The Economic Impact of Ethanol Plants in South...
31
The Economic Impact of Ethanol Plants in South Dakota December 27, 2005 Final Report By Randall M. Stuefen of Stuefen Research, LLC www.stuefenresearch.com [email protected] Phone 605-624-9754 Cell 605-677-8384 813 Valley View Drive Vermillion, South Dakota 57069
Transcript of The Economic Impact of Ethanol Plants in South...
The Economic Impact of EthanolPlants in South Dakota
December 27, 2005Final Report
By Randall M. Stuefen ofStuefen Research, LLC
Phone 605-624-9754Cell 605-677-8384
813 Valley View DriveVermillion, South Dakota 57069

2
Introduction
The ethanol industry impacts South Dakota’s economy in the short term while a plant isbeing constructed and in the long term through the operation of the plant. The economicimpact from the operation of the state’s ethanol plants is addressed in this study.
Ethanol production is manufacturing but it qualifies as a value added agriculturalindustry. It transforms corn into ethanol, distillers’ grain and carbon dioxide enhancingthe value of the original commodity. The agricultural community benefits throughownership in the industry as investors and increased revenues from corn by narrowing thebasis between the Chicago futures price and the local price for the commodity.
The South Dakota ethanol industry is relatively young. The state’s first productionfacility was located in the community of Scotland, South Dakota. It was the state’s onlyplant for five years until an Aberdeen plant began production in 1993 which wasfollowed six years after that by a plant in Huron. The industry after more than a decadeconsisted of three plants with a production capacity of approximately 35 million gallonsper year. Following the decade of modest growth, the industry began a dramaticexpansion in 2001 with a 48 million gallon plant constructed in Wentworth. In 2002, thelast plant with production capacity smaller than 40 million gallons per year was put intoproduction in Rosholt.1 New plant sizes now range from 40 to more than 100 milliongallons.
National Distribution of Ethanol Production Facilities(In January 2005)
1 Tri-State Ethanol of Rosholt is now North Country Ethanol of Rosholt. Tri-State Ethanol experienced anaccident in December of 2002 that ended operations and with bankruptcy following in May of 2003. NorthCountry Ethanol began production at the plant again in 2005 with an increase in production capacityplanned. The economic impact estimates in this analysis will not include the Rosholt plant because of noproduction in 2004.
3
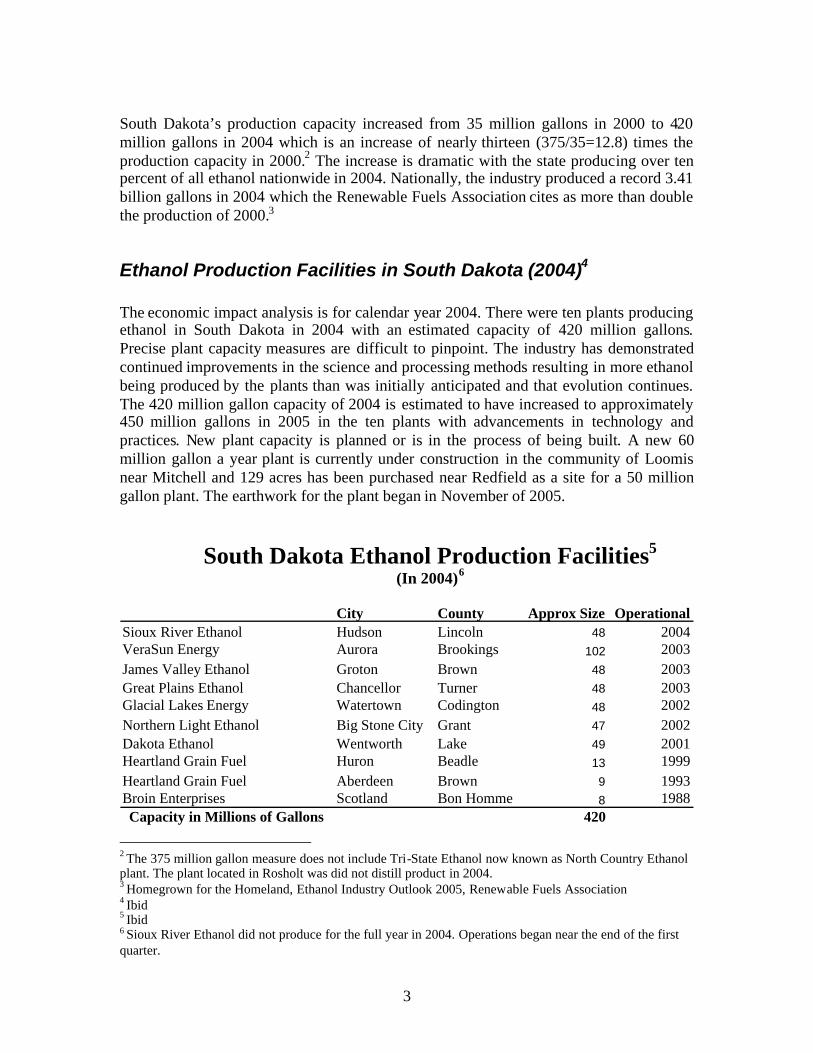
South Dakota’s production capacity increased from 35 million gallons in 2000 to 420million gallons in 2004 which is an increase of nearly thirteen (375/35=12.8) times theproduction capacity in 2000.2 The increase is dramatic with the state producing over tenpercent of all ethanol nationwide in 2004. Nationally, the industry produced a record 3.41billion gallons in 2004 which the Renewable Fuels Association cites as more than doublethe production of 2000.3
Ethanol Production Facilities in South Dakota (2004)4
The economic impact analysis is for calendar year 2004. There were ten plants producingethanol in South Dakota in 2004 with an estimated capacity of 420 million gallons.Precise plant capacity measures are difficult to pinpoint. The industry has demonstratedcontinued improvements in the science and processing methods resulting in more ethanolbeing produced by the plants than was initially anticipated and that evolution continues.The 420 million gallon capacity of 2004 is estimated to have increased to approximately450 million gallons in 2005 in the ten plants with advancements in technology andpractices. New plant capacity is planned or is in the process of being built. A new 60million gallon a year plant is currently under construction in the community of Loomisnear Mitchell and 129 acres has been purchased near Redfield as a site for a 50 milliongallon plant. The earthwork for the plant began in November of 2005.
South Dakota Ethanol Production Facilities5
(In 2004)6
City County Approx Size OperationalSioux River Ethanol Hudson Lincoln 48 2004VeraSun Energy Aurora Brookings 102 2003James Valley Ethanol Groton Brown 48 2003Great Plains Ethanol Chancellor Turner 48 2003Glacial Lakes Energy Watertown Codington 48 2002Northern Light Ethanol Big Stone City Grant 47 2002Dakota Ethanol Wentworth Lake 49 2001Heartland Grain Fuel Huron Beadle 13 1999Heartland Grain Fuel Aberdeen Brown 9 1993Broin Enterprises Scotland Bon Homme 8 1988Capacity in Millions of Gallons 420
2 The 375 million gallon measure does not include Tri-State Ethanol now known as North Country Ethanolplant. The plant located in Rosholt was did not distill product in 2004.3 Homegrown for the Homeland, Ethanol Industry Outlook 2005, Renewable Fuels Association4 Ibid5 Ibid6 Sioux River Ethanol did not produce for the full year in 2004. Operations began near the end of the firstquarter.

4
Basic Ethanol Business Structure
The fundamental business structure for a dry mill ethanol production facility is reflectedin the graphic below. An ethanol plant receives its revenue flows from the sale of ethanoland the co-products distiller’s grain and carbon dioxide. The distiller’s grains can be soldas Wet Distiller’s Grains (WDG) or as Dry Distiller’s Grains (DDG). Carbon Dioxide canbe compressed or liquefied and sold in their respective markets or released if no localmarket exists.
The “Out-Flows” identified in the graphic below exemplify the expenses per bushel ofcorn associated with the production of ethanol and its co-products. One can see that thelargest cost of production in the graphic is corn followed by the investment in plant andequipment. The expense for natural gas compared to the cost of corn has changed sincethis graphic was developed. The price of corn has fallen dramatically while the cost fornatural gas has risen substantially.
As noted, the actual cost for the factors of production and the other side of the ledger, thevalue of the ethanol plants products, will vary with market conditions. The graphic is forillustrative purposes only. Market conditions are fluid and the risks associated with allassumptions in a model are constantly changing.
An Example of In-Flows and Out-Flows in theProduction of Ethanol7
7 Presentation “Commodity Marketing’s Approach to Ethanol Risk Management”, Mr. Craig Ludtke,Commodity Marketing Co., Albert Lea, Minnesota, Presentation in Omaha, 2005
Example Using 2004 Prices
5
Ethanol Production Impact on Corn Prices
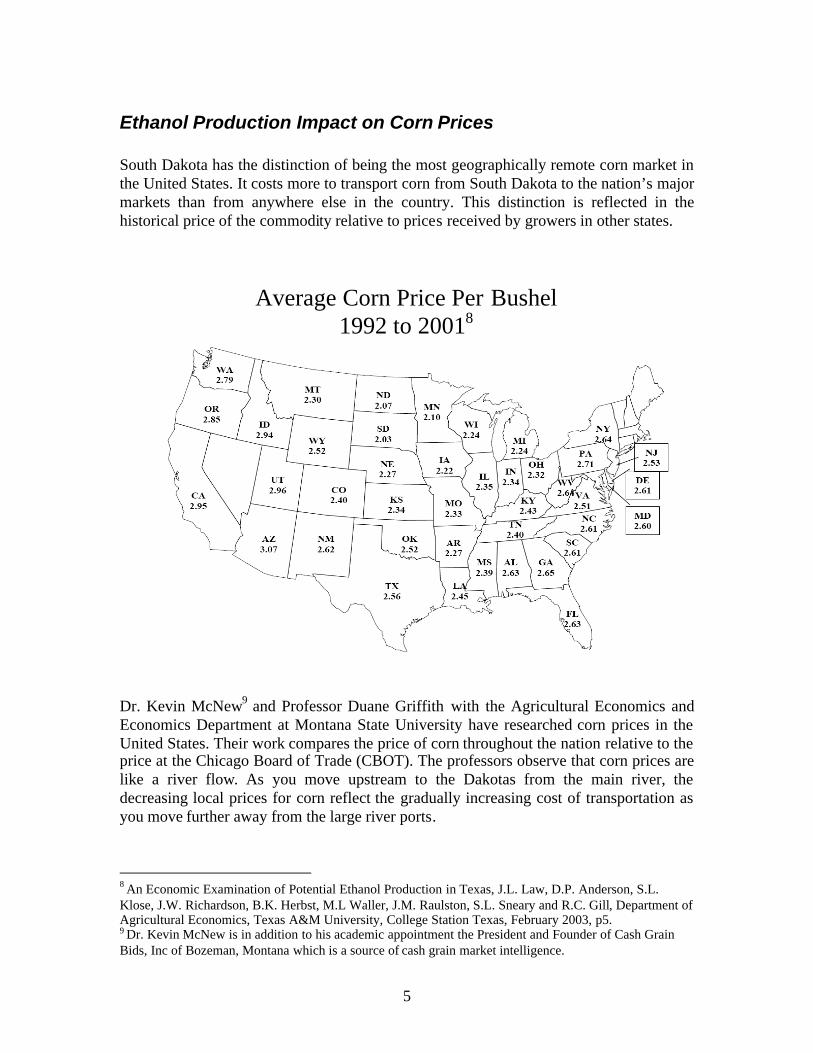
South Dakota has the distinction of being the most geographically remote corn market inthe United States. It costs more to transport corn from South Dakota to the nation’s majormarkets than from anywhere else in the country. This distinction is reflected in thehistorical price of the commodity relative to prices received by growers in other states.
Average Corn Price Per Bushel1992 to 20018
Dr. Kevin McNew9 and Professor Duane Griffith with the Agricultural Economics andEconomics Department at Montana State University have researched corn prices in theUnited States. Their work compares the price of corn throughout the nation relative to theprice at the Chicago Board of Trade (CBOT). The professors observe that corn prices arelike a river flow. As you move upstream to the Dakotas from the main river, thedecreasing local prices for corn reflect the gradually increasing cost of transportation asyou move further away from the large river ports.
8 An Economic Examination of Potential Ethanol Production in Texas, J.L. Law, D.P. Anderson, S.L.Klose, J.W. Richardson, B.K. Herbst, M.L Waller, J.M. Raulston, S.L. Sneary and R.C. Gill, Department ofAgricultural Economics, Texas A&M University, College Station Texas, February 2003, p5.9 Dr. Kevin McNew is in addition to his academic appointment the President and Founder of Cash GrainBids, Inc of Bozeman, Montana which is a source of cash grain market intelligence.

6
Corn Basis Flow in 2000 Prior to Ethanol Plant ExpansionDarker is Higher Basis and Lighter toward Mississippi River represents Lower Basis
Changes in the marketplace brought by the ethanol industry are evident in the changedtransportation patterns in Iowa. Visible in the graphic above, Iowa corn was historicallyshipped to the river ports where it was transported to the gulf by barge. The lighter colorsin the graphic represent a smaller basis adjustment as transportation becomes less costly.
The general pattern of larger corn basis adjustments as markets move away from theMississippi and Missouri Rivers remains evident in the 2004 graphic on the followingpage, but price basis patterns have changed in eastern South Dakota and northwesternIowa. Much of the South Dakota basis is now similar to that throughout Iowa, unlike thesituation in the graphic above. In fact there is an island in north central Iowa where thebasis adjustment for corn is now deeper meaning transportation is more costly than inSouth Dakota. Dr. McNew describes this change as a “basis inversion”. He writes thatthis means the region of Northwest Iowa and Southeast South Dakota generally has alower basis adjustment than does a portion of central Iowa. Corn in central Iowa is nowmore likely to move north and northwest toward the growing ethanol industries innorthwest Iowa and southeast South Dakota than to the historical river port markets.

7
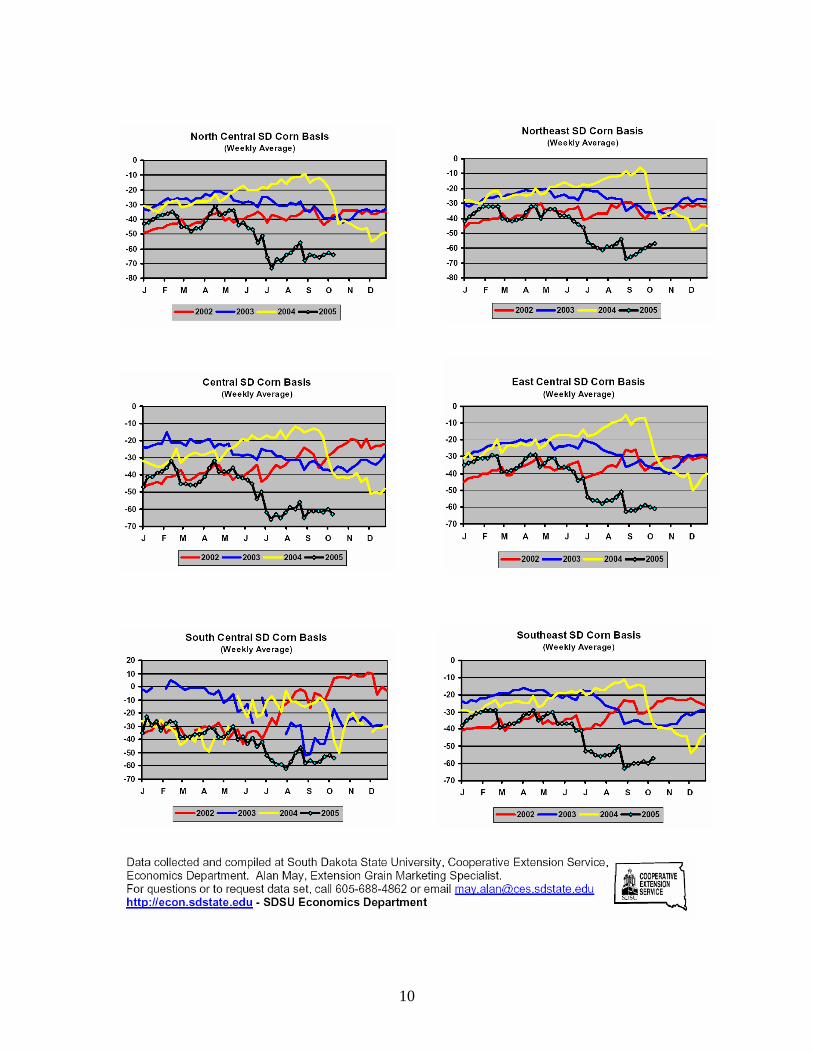
Purpose of Reporting “Basis”
Reporting the “basis” for corn provides information about local supply and demandconditions. Basis is comparative data that assists farm operators and commoditymarketers in choosing between the local markets for the best place to sell their corn.Basis is calculated by subtracting the local cash or market price for the commodity fromthe futures price at the Chicago Board of Trade (CBOT).
While the CBOT price for corn reflects the general supply and demand pressures in thenational marketplace, the local market price reflects transportation, storage and localsupply and demand pressures. The improved basis throughout eastern South Dakota asshown in the graphic illustrates that factors affecting local prices have changed. Aproportion of that change is attributed to the use of corn in the production of ethanol,distiller’s grains and carbon dioxide. Other significant structural changes that could haveaffected the market are economies of scale from the use of unit trains and the increasedsize of modern elevators and storage facilities.
Modern markets go beyond state and national borders and so do influences of supply inthe international markets. In March of 2004, Argentina’s record crop started reaching theinternational market impacting the price and volume of US exports. China announcedincreased exports at about that same time. Following the entry of more corn from othercountries in the marketplace, the US harvested a bumper crop. The impact of theincreased supply of corn can be seen in the 2004 cash price in the graphic below. Theprice fell dramatically in the spring and throughout the summer based on international

8
news and continued the decline in price as confidence increased that the 2004 crop wasgoing to be a record harvest.
Market complexity is apparent. The use of corn for ethanol production has placed upwardpressure on the commodity’s local price. The increased efficiencies from using unit trainsand larger scale storage facilities have done the same. Yet, the abundance of corn broughtto the marketplace domestically and internationally was so pronounced beginning in 2004and into 2005 that the price of corn in South Dakota is lower in 2005 than the 1992 to2001 average. The impact of ethanol production can be lost in this time of abundance butthe price basis records show price impacts and changes in the flow of corn to markets.
Corn Prices and Ethanol Production
Dr. McNew estimates that the change in price basis for corn between June 1999 and 2004was between 20 and 30 cents per bushel in the southeast part of South Dakota with animpact of more than 30 cents in the northeastern part of the state. The increased demandfor corn to support ethanol production contributed to those changes. More conservativeestimates from other sources attribute from 10 to 12 cents a bushel narrowing of the basisto ethanol production on average.
9
The average improvement of 10 to 12 cents per bushel is assumed to be the impact onlocal corn price at the ethanol plants. The cost of transporting the corn from farm andfield to the plants is an offset to this increase in value. The benefit to the corn producerdiminishes as distance from the plant and the cost of transportation increases. The priceadvantage of shipping and selling corn to an ethanol plant is thought to exhaust at adistance of 35 to 50 miles.
Perspective can be lost in a time of abundance. The tremendous growth in the state’sethanol industry has come at a time of record and near record corn crops. There has beenample supply of corn “available for export” in the local market. Corn crops haveexceeded the local need by large margins but that may not always be the case. Thecurrent surplus may not always be there and the industry has cautioned that use of morethan fifty percent of the corn available for export for ethanol production coulddramatically increase the local price of corn, increasing costs and the profitability ofethanol production.
The caution should be of particular interest to South Dakota ethanol producers. SouthDakota uses a higher percentage of its annual corn production to produce ethanol thanany other state. Rough estimates are that one in three or one in four rows of the state’sannual corn crop are currently being used to produce ethanol and those are grossmeasures.10 If corn used for other purposes is subtracted from the total, the proportion ofthe crop available for export and used for ethanol production is greater than twenty-fiveto thirty-three percent. South Dakota is positioned to test the hypothesis that the localprice of corn changes dramatically if pressure beyond a point is applied on the localsupply of corn that is available for export.
Poor corn years have happened and the 1993 and 1995 corn crops can add perspective. In1993, South Dakota’s farmers had a crop that averaged 63 bushels to the acre. Theaverage crop was 79 bushels to the acre in 1995. If one assumes that the number of acresplanted to corn is 4 million acres as it was in 2005, years like those would yield 47 and 59percent of the bumper 2004 crop, or 59 and 74 percent of the 2003 crop. If there comes atime when stores of corn are short and crops like 1993 and 1995 happen again, thehypothesis will be tested.
Dr. McNew’s work indicates a narrowing of the basis in eastern South Dakota by 10 to30 cents a bushel with improvement exceeding 30 cents in northern parts of the statefrom historical local prices. A portion of that improvement will be used to estimate theimpact of the ethanol industry. Other experts estimate the basis narrowing attributable tothe ethanol industry out of that larger amount at 10 to 12 cents per bushel and it is thismore conservative measure that will be used in the analysis. This analysis does notspecifically address price impact differences between plants that require the delivery ofcorn as a condition of investment and those that strictly buy in the open market.
10 The 2004 estimate of corn used for ethanol production in 2004 is 145.0 million bushels of corn. Theamount harvested in 2004 was 539.5 million bushels or about one in four rows. The amount harvested in2003 was 427.4 million bushels. The 2004 use would be about one in three rows of 2003 production.
10
11
Estimating Economic Multipliers and Impacts
The multiplier estimation product used in the analysis is IMPLAN (IMpact Analysis forPLANning). IMPLAN was developed at the University of Minnesota over a period ofyears in conjunction with the U.S. Forest Service’s Land Management Planning Unit inFort Collins. Governmental agencies and leading universities across the nation use thisproduct for estimating economic impacts.
IMPLAN is an input-output (I-O) estimation model. The versatility of this model enablesspecific analysis for each area of interest, including county, multi-county regions, a stateor a group of states. Naturally, some estimation error will remain. The I-O techniquedescribes an enterprise based on average ingredient and performance measures andtherefore best predicts the impact of an average enterprise. While the I-O modelingtechnique has been designed and refined to minimize error, estimation error does occurbecause of our inability to distinguish the specific enterprise from the average.
Three multiplier effects are presented: the output, value-added, and employment effects.Each of these in turn reflects three components: the direct effect, the indirect effect, andthe induced effect. The output multiplier is the change in the economy required to deliveran additional dollar of construction services to demand. The initial response in finaldemand is the direct effect, always with a multiplier of one. The construction contractorswill in turn buy goods and services from other industries to produce the dollar's worth ofconstruction, and these industries buy inputs themselves, creating a whole series ofadditional purchases that are captured by the indirect effect component. Finally, therewill be additional purchases motivated by the income generated for households in thesetransactions; these are called induced effects. All three effects combine to create theoutput multiplier.
The output multiplier measures the economic activity that will occur as a result of theinitial stimulus. It will rise as more inputs are purchased and more income is spent in theregion in question. If most inputs are purchased and most income is spent outside theregion, the output multiplier will be relatively small. Small counties, for example, willhave smaller output multipliers than counties with large wholesale and retail operations,and county multipliers will be smaller than the state multipliers.
The output multiplier is appropriate for sizing up the total economic activity that willoccur in an area as a result of a project. The value-added effect is a better measure of theincome created for people and the government by the project. Payments for raw materialscontinue through the system, but payments for labor, or proprietors' income, ordistributed corporate profits represent added wealth for people, and thus value-added.Payments for input materials are referred to as "leakages" from the stream of payments.Eventually a dollar spent on the final product ends up split among many incomerecipients, some of whom live outside the region under consideration. As a result, thevalue-added multiplier effect is expected to be below one. Like the output multiplier, thevalue-added effect will typically be larger for the state than for individual counties.
12
Value-added is decomposed into the same three parts as the output multiplier: directeffects, indirect effects, and induced effects. The direct component will be incomegenerated over and above the cost of resources in the immediate enterprise. The indirectmultiplier effect similarly measures net income created in the upstream industries thatsupply inputs for the final good. The induced component reflects the on-going effect ofthe income created directly and indirectly: income that is spent on goods and servicescreates demand for additional goods and services, thus creating a repeating cycle ofexpenditures. The sum of the three parts creates the value-added multiplier effect.
Finally, the analysis in this report provides an employment multiplier, showing theestimated number of jobs created by one million dollars of output. Again, the multiplieris comprised of three parts. The direct component shows the number of jobs created bythe immediate enterprise, ethanol plant construction. The indirect again refers to jobscreated in supporting industries, and the induced component reflects jobs created byadditional demand throughout the area’s economy.
The economic impacts resulting from the production of ethanol and the economic impactsresulting from increased local price as a result of narrowing of the basis will be estimatedseparately. The economic multipliers for ethanol plant operations are presented firstfollowed by a discussion of the multipliers for corn revenues resulting from the basisimproved local price of corn. The corn multipliers are that which would be applied to awindfall. The production activities associated with growing the corn are not considered.Only the costs associated with the delivery of the corn to the ethanol plants areconsidered and this activity has an impact separate from the increase in income.
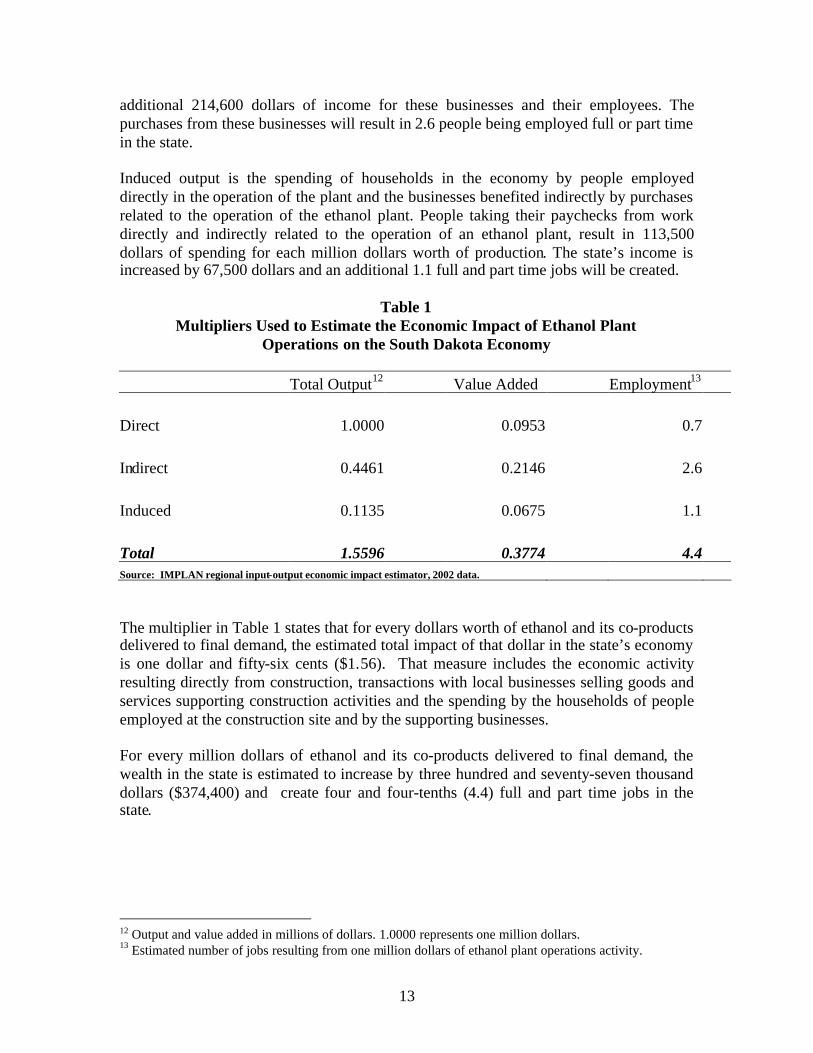
Multiplier Estimates for the Ethanol Industry11
Table 1 shows the direct economic impact on the South Dakota economy of deliveringone dollar of ethanol and its co-products to final demand. For every dollar of ethanoldelivered to final demand in South Dakota, nine and one-half cents (0.0953) of newincome will be created. That income will be realized by investors or owners, managementand the labor force at the plant. A delivery of one million dollars of ethanol to finaldemand is estimated to directly result in 0.7 full and part time jobs and the creation of95,300 dollars of new income. The difference between the initial delivery of 1 milliondollars of ethanol to final demand and the 95,300 dollar increase (1,000,000 x .0953) inincome is that money spent on non-labor costs.
The indirect output includes those goods and services purchased from other businesses inthe state to produce one million dollars of ethanol. It is estimated that for every onemillion dollars of ethanol produced, 446,100 dollars of goods and services will bepurchased from other businesses in the state and those expenditures will result in an
11 The operations impact described in this section of the report does not include the impact of ethanolproduction on the price of corn. All agricultural crop inputs were excluded from the IMPLAN estimate inthis section. Impacts from increased corn prices will be addressed in a following section.
13
additional 214,600 dollars of income for these businesses and their employees. Thepurchases from these businesses will result in 2.6 people being employed full or part timein the state.
Induced output is the spending of households in the economy by people employeddirectly in the operation of the plant and the businesses benefited indirectly by purchasesrelated to the operation of the ethanol plant. People taking their paychecks from workdirectly and indirectly related to the operation of an ethanol plant, result in 113,500dollars of spending for each million dollars worth of production. The state’s income isincreased by 67,500 dollars and an additional 1.1 full and part time jobs will be created.
Table 1Multipliers Used to Estimate the Economic Impact of Ethanol Plant
Operations on the South Dakota Economy
Total Output12 Value Added Employment13
Direct 1.0000 0.0953 0.7
Indirect 0.4461 0.2146 2.6
Induced 0.1135 0.0675 1.1
Total 1.5596 0.3774 4.4Source: IMPLAN regional input-output economic impact estimator, 2002 data.
The multiplier in Table 1 states that for every dollars worth of ethanol and its co-productsdelivered to final demand, the estimated total impact of that dollar in the state’s economyis one dollar and fifty-six cents ($1.56). That measure includes the economic activityresulting directly from construction, transactions with local businesses selling goods andservices supporting construction activities and the spending by the households of peopleemployed at the construction site and by the supporting businesses.
For every million dollars of ethanol and its co-products delivered to final demand, thewealth in the state is estimated to increase by three hundred and seventy-seven thousanddollars ($374,400) and create four and four-tenths (4.4) full and part time jobs in thestate.
12 Output and value added in millions of dollars. 1.0000 represents one million dollars.13 Estimated number of jobs resulting from one million dollars of ethanol plant operations activity.
14
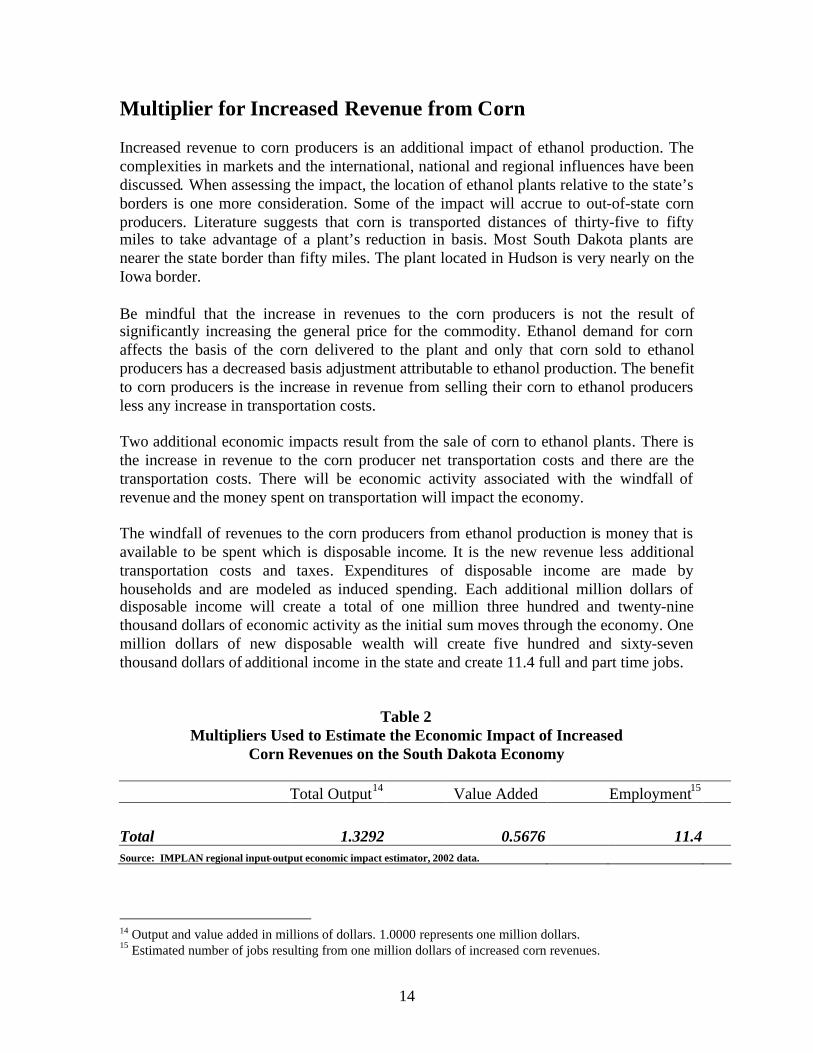
Multiplier for Increased Revenue from Corn
Increased revenue to corn producers is an additional impact of ethanol production. Thecomplexities in markets and the international, national and regional influences have beendiscussed. When assessing the impact, the location of ethanol plants relative to the state’sborders is one more consideration. Some of the impact will accrue to out-of-state cornproducers. Literature suggests that corn is transported distances of thirty-five to fiftymiles to take advantage of a plant’s reduction in basis. Most South Dakota plants arenearer the state border than fifty miles. The plant located in Hudson is very nearly on theIowa border.
Be mindful that the increase in revenues to the corn producers is not the result ofsignificantly increasing the general price for the commodity. Ethanol demand for cornaffects the basis of the corn delivered to the plant and only that corn sold to ethanolproducers has a decreased basis adjustment attributable to ethanol production. The benefitto corn producers is the increase in revenue from selling their corn to ethanol producersless any increase in transportation costs.
Two additional economic impacts result from the sale of corn to ethanol plants. There isthe increase in revenue to the corn producer net transportation costs and there are thetransportation costs. There will be economic activity associated with the windfall ofrevenue and the money spent on transportation will impact the economy.
The windfall of revenues to the corn producers from ethanol production is money that isavailable to be spent which is disposable income. It is the new revenue less additionaltransportation costs and taxes. Expenditures of disposable income are made byhouseholds and are modeled as induced spending. Each additional million dollars ofdisposable income will create a total of one million three hundred and twenty-ninethousand dollars of economic activity as the initial sum moves through the economy. Onemillion dollars of new disposable wealth will create five hundred and sixty-seventhousand dollars of additional income in the state and create 11.4 full and part time jobs.
Table 2Multipliers Used to Estimate the Economic Impact of Increased
Corn Revenues on the South Dakota Economy
Total Output14 Value Added Employment15
Total 1.3292 0.5676 11.4Source: IMPLAN regional input-output economic impact estimator, 2002 data.
14 Output and value added in millions of dollars. 1.0000 represents one million dollars.15 Estimated number of jobs resulting from one million dollars of increased corn revenues.

15
The benefit from the reduction in basis that is not new wealth to the corn producer is thatproportion of the increased revenues that is spent on the transportation from farm or fieldto the ethanol plant. There is economic activity associated with the task of trucking thecorn and that economic activity and its multipliers are described in Table 3.
The table shows the direct economic impact on the South Dakota economy of deliveringone dollar of truck transportation to final demand. For every dollar of truck transportationdelivered to final demand in South Dakota, forty-two cents (0.4223) of new income willbe created. That income will be realized by owners, management and the labor forceinvolved in truck transportation. If one million dollars of service is considered, itsdelivery is estimated to directly result in 9.6 full and part time jobs and the creation of422,300 dollars of new income.
It is estimated that for every one million dollars of trucking services, 438,300 dollars ofgoods and services will be purchased from other businesses in the state and thoseexpenditures will result in an additional 232,300 dollars of income for these businessesand their employees. The purchases from these businesses will result in 4.4 people beingemployed full or part time in the state.
Spending by households in the economy by truck owners, people employed directly bytruck owners and the businesses benefited indirectly by purchases related to thetransportation of the corn is estimated to result in 332,800 dollars of spending for eachmillion dollars worth of trucking services provided. The state’s income is increased by197,900 dollars and an additional 4.1 full and part time jobs will be created.
Table 3Multipliers Used to Estimate the Economic Impact on the South Dakota
Economy from Trucking Corn to Ethanol Plants-
Total Output16 Value Added Employment17
Direct 1.0000 0.4223 9.6
Indirect 0.4383 0.2323 4.4
Induced 0.3328 0.1979 4.1
Total 1.7712 0.8525 18.1Source: IMPLAN regional input-output economic impact estimator, 2002 data.
16 Output and value added in millions of dollars. 1.0000 represents one million dollars.17 Estimated number of jobs resulting from one million dollars of truck transportation.
16
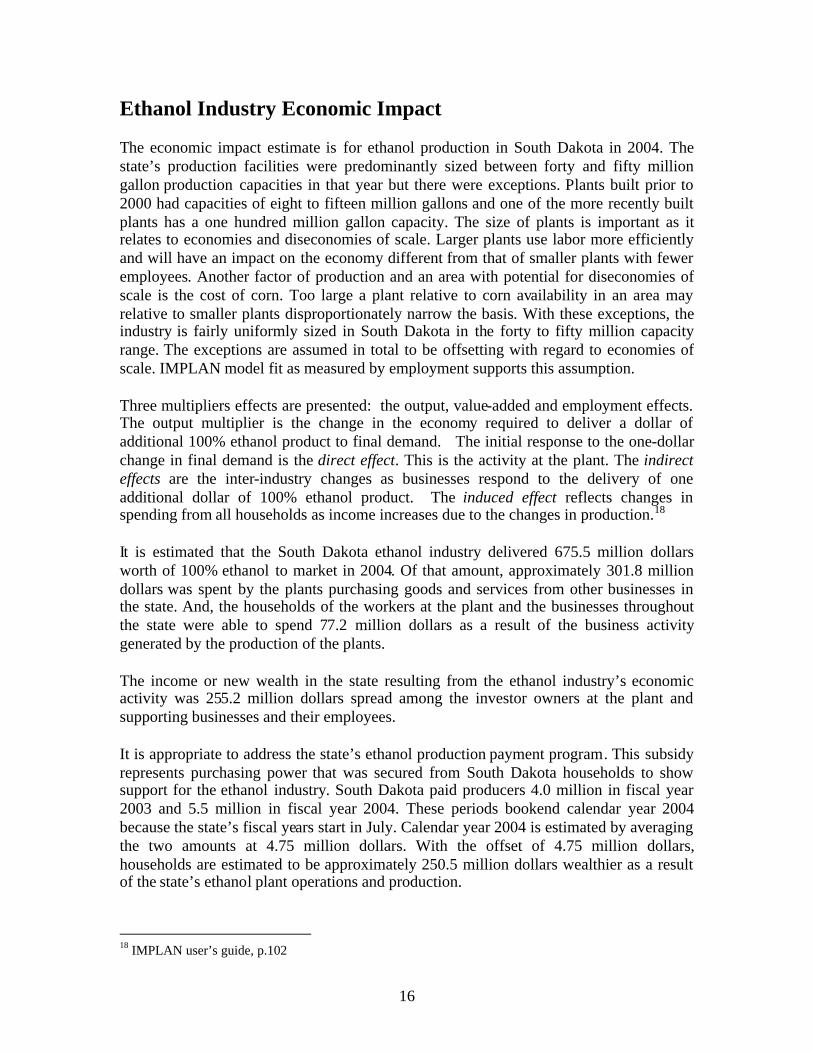
Ethanol Industry Economic Impact
The economic impact estimate is for ethanol production in South Dakota in 2004. Thestate’s production facilities were predominantly sized between forty and fifty milliongallon production capacities in that year but there were exceptions. Plants built prior to2000 had capacities of eight to fifteen million gallons and one of the more recently builtplants has a one hundred million gallon capacity. The size of plants is important as itrelates to economies and diseconomies of scale. Larger plants use labor more efficientlyand will have an impact on the economy different from that of smaller plants with feweremployees. Another factor of production and an area with potential for diseconomies ofscale is the cost of corn. Too large a plant relative to corn availability in an area mayrelative to smaller plants disproportionately narrow the basis. With these exceptions, theindustry is fairly uniformly sized in South Dakota in the forty to fifty million capacityrange. The exceptions are assumed in total to be offsetting with regard to economies ofscale. IMPLAN model fit as measured by employment supports this assumption.
Three multipliers effects are presented: the output, value-added and employment effects.The output multiplier is the change in the economy required to deliver a dollar ofadditional 100% ethanol product to final demand. The initial response to the one-dollarchange in final demand is the direct effect. This is the activity at the plant. The indirecteffects are the inter-industry changes as businesses respond to the delivery of oneadditional dollar of 100% ethanol product. The induced effect reflects changes inspending from all households as income increases due to the changes in production.18
It is estimated that the South Dakota ethanol industry delivered 675.5 million dollarsworth of 100% ethanol to market in 2004. Of that amount, approximately 301.8 milliondollars was spent by the plants purchasing goods and services from other businesses inthe state. And, the households of the workers at the plant and the businesses throughoutthe state were able to spend 77.2 million dollars as a result of the business activitygenerated by the production of the plants.
The income or new wealth in the state resulting from the ethanol industry’s economicactivity was 255.2 million dollars spread among the investor owners at the plant andsupporting businesses and their employees.
It is appropriate to address the state’s ethanol production payment program. This subsidyrepresents purchasing power that was secured from South Dakota households to showsupport for the ethanol industry. South Dakota paid producers 4.0 million in fiscal year2003 and 5.5 million in fiscal year 2004. These periods bookend calendar year 2004because the state’s fiscal years start in July. Calendar year 2004 is estimated by averagingthe two amounts at 4.75 million dollars. With the offset of 4.75 million dollars,households are estimated to be approximately 250.5 million dollars wealthier as a resultof the state’s ethanol plant operations and production.
18 IMPLAN user’s guide, p.102
17
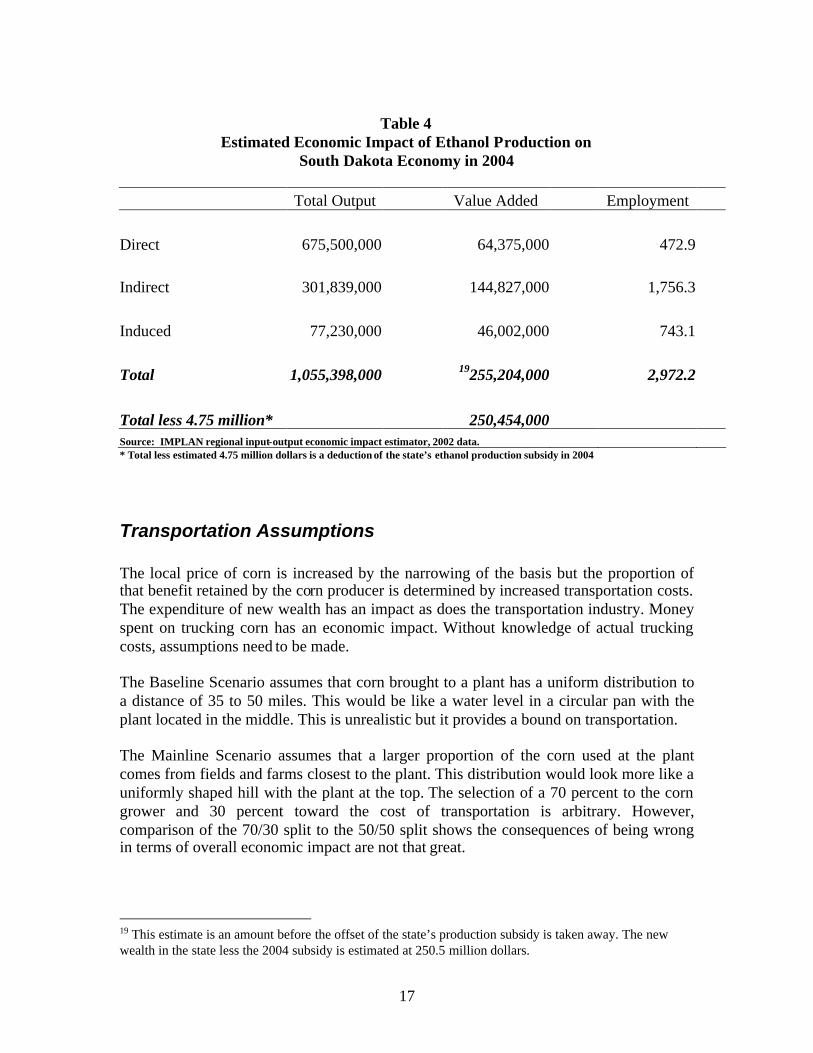
Table 4Estimated Economic Impact of Ethanol Production on
South Dakota Economy in 2004
Total Output Value Added Employment
Direct 675,500,000 64,375,000 472.9
Indirect 301,839,000 144,827,000 1,756.3
Induced 77,230,000 46,002,000 743.1
Total 1,055,398,000 19255,204,000 2,972.2
Total less 4.75 million* 250,454,000Source: IMPLAN regional input-output economic impact estimator, 2002 data.* Total less estimated 4.75 million dollars is a deduction of the state’s ethanol production subsidy in 2004
Transportation Assumptions
The local price of corn is increased by the narrowing of the basis but the proportion ofthat benefit retained by the corn producer is determined by increased transportation costs.The expenditure of new wealth has an impact as does the transportation industry. Moneyspent on trucking corn has an economic impact. Without knowledge of actual truckingcosts, assumptions need to be made.
The Baseline Scenario assumes that corn brought to a plant has a uniform distribution toa distance of 35 to 50 miles. This would be like a water level in a circular pan with theplant located in the middle. This is unrealistic but it provides a bound on transportation.
The Mainline Scenario assumes that a larger proportion of the corn used at the plantcomes from fields and farms closest to the plant. This distribution would look more like auniformly shaped hill with the plant at the top. The selection of a 70 percent to the corngrower and 30 percent toward the cost of transportation is arbitrary. However,comparison of the 70/30 split to the 50/50 split shows the consequences of being wrongin terms of overall economic impact are not that great.
19 This estimate is an amount before the offset of the state’s production subsidy is taken away. The newwealth in the state less the 2004 subsidy is estimated at 250.5 million dollars.
18
Baseline Scenario: Economic Impact from Increased Price ofCorn (50% to Corn Producer / 50% to Transportation)
It is assumed that ethanol production narrowed the basis on corn by ten to twelve cents abushel at the plant door. Further, it is recognized that the basis improvement resultingfrom ethanol production is eroded from the perspective of the corn grower by the distancethe commodity is transported. The cost of transportation diminishes the improvement inbasis until the revenue improvement is exhausted which is thought to be between thirty-five and fifty miles.
The baseline assumption is that corn attracted to a plant has a uniform distribution to adistance between 35 and 50 miles. Making that assumption, on average the basisadvantage is split between enhancing the value of the corn and the cost of transportingthe grain from field or farm to the plant. That assumption yields a realized revenueimprovement from corn delivered to the ethanol plant of five to six cents per bushel withan identical amount paid for transportation.
It is estimated that the state produced 400 million gallons of ethanol in 2004 and that ittook approximately 145 million bushels of corn to make that number of gallons. That is ayield of 2.76 gallons of ethanol per bushel of corn. If the basis was improved by ten centsa bushel at the door of the plant, the split of revenues between the corn producers andtransportation costs, 7.25 million dollars would be paid to each. At twelve cents perbushel, there would be 17.4 million dollars to divide (17.4/2 = 8.7 million).
The impact of this windfall is estimated from new money spent by households after taxesand contribution for social security. The average disposable income in South Dakota in2004 less contributions by employees and the self employed for social security is 80.1%.After that leakage, the 7.25 million dollars is reduced to 5.8 million dollars at ten centsper bushel and 7.0 million at twelve cents but one last assumption needs to be made forthis to be a South Dakota economic impact estimate. Not all corn used in the productionof ethanol in South Dakota plants originates from the state. The following economicimpact is overstated by the proportion of income and transportation expense that isattributable to imported corn. Without supporting data or evidence, it is assumed that25% of the income flows to out of state corn producers and that 30% of the transportationcosts and impact are treated as leakages. This division between income and transportationdecreases the 5.8 and 7.0 million dollar disposable income less social securitycontributions to 4.4 and 5.2 million dollars.
19
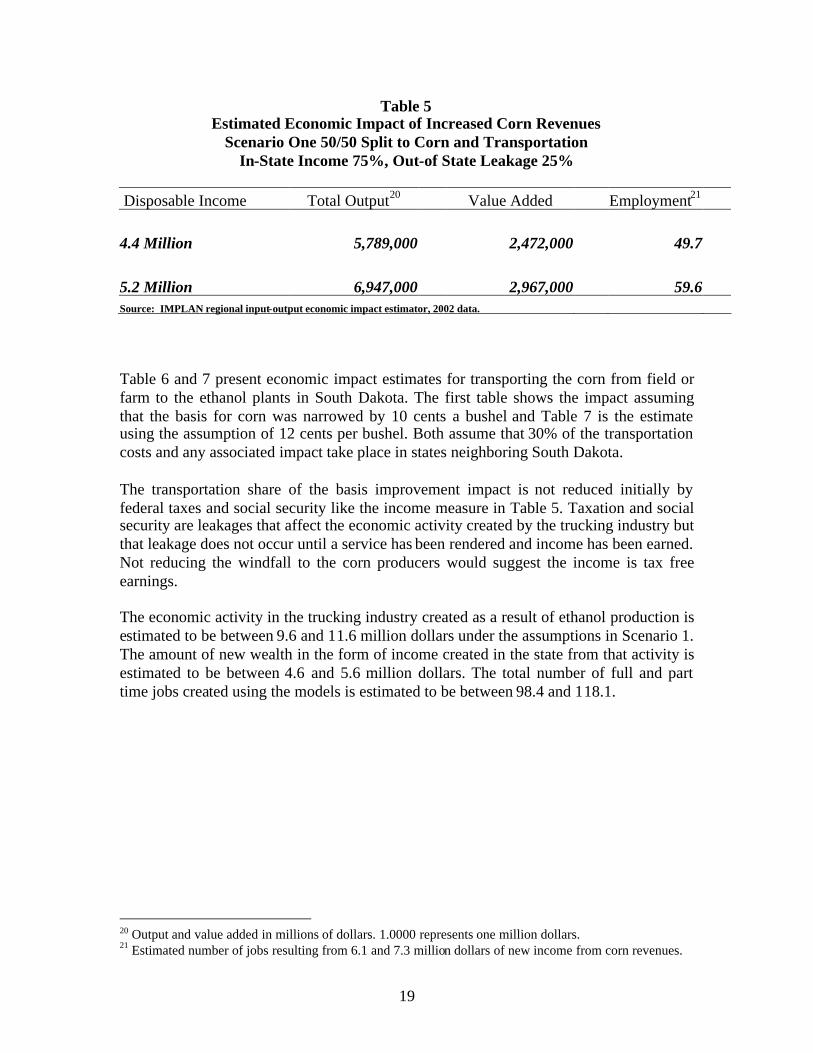
Table 5Estimated Economic Impact of Increased Corn Revenues
Scenario One 50/50 Split to Corn and TransportationIn-State Income 75%, Out-of State Leakage 25%
Disposable Income Total Output20 Value Added Employment21
4.4 Million 5,789,000 2,472,000 49.7
5.2 Million 6,947,000 2,967,000 59.6Source: IMPLAN regional input-output economic impact estimator, 2002 data.
Table 6 and 7 present economic impact estimates for transporting the corn from field orfarm to the ethanol plants in South Dakota. The first table shows the impact assumingthat the basis for corn was narrowed by 10 cents a bushel and Table 7 is the estimateusing the assumption of 12 cents per bushel. Both assume that 30% of the transportationcosts and any associated impact take place in states neighboring South Dakota.
The transportation share of the basis improvement impact is not reduced initially byfederal taxes and social security like the income measure in Table 5. Taxation and socialsecurity are leakages that affect the economic activity created by the trucking industry butthat leakage does not occur until a service has been rendered and income has been earned.Not reducing the windfall to the corn producers would suggest the income is tax freeearnings.
The economic activity in the trucking industry created as a result of ethanol production isestimated to be between 9.6 and 11.6 million dollars under the assumptions in Scenario 1.The amount of new wealth in the form of income created in the state from that activity isestimated to be between 4.6 and 5.6 million dollars. The total number of full and parttime jobs created using the models is estimated to be between 98.4 and 118.1.
20 Output and value added in millions of dollars. 1.0000 represents one million dollars.21 Estimated number of jobs resulting from 6.1 and 7.3 million dollars of new income from corn revenues.

20
Table 6Estimated Economic Impact of Transporting Corn70% of 7.25 Million Dollars at Ten Cents/Bushel
30% Out-of State Leakage
Total Output Value Added Employment
Direct 5,438,000 2,296,000 52.2
Indirect 2,383,000 1,263,000 23.9
Induced 1,810,000 1,076,000 22.3
Total 9,630,000 4,635,000 98.4Source: IMPLAN regional input-output economic impact estimator, 2002 data.
Table 7Estimated Economic Impact of Transporting Corn70% of 8.7 Million Dollars at Twelve Cents/Bushel
30% Out-of State Leakage
Total Output Value Added Employment
Direct 6,525,000 2,756,000 62.6
Indirect 2,860,000 1,516,000 28.7
Induced 2,172,000 1,292,000 26.8
Total 11,556,000 5,563,000 118.1Source: IMPLAN regional input-output economic impact estimator, 2002 data.
Mainline Scenario: Economic Impact from Increased Price ofCorn (70% to Corn Producer / 30% to Transportation)
The Mainline Scenario assumes that more corn comes from producers located nearer theplant than from those nearing the point where financial gain is exhausted at a distance of35 to 50 miles. The assumptions other than the 70/30 division of revenues for the two

21
scenarios are the same. The two estimates reflect an income enhancing narrowing of thebasis by 10 and 12 cents a bushel. The induced impact of the windfall income to the cornproducer is estimated using disposable income adjusting for taxes and social securitycontributions. Without supporting data or evidence, it is assumed that 25% of the incomeflows to out of state corn producers and that 30% of the transportation costs are paid totruckers out of state.
The revenue from corn is again assumed to increase 10 and 12 cents per bushel attributedto the narrowing of the basis. This is consistent with Baseline Scenario. The split of therevenues is changed from 50/50 to 70/30 favoring corn producers over the transportationindustry. Changing the distribution assumption increases income measures afteradjustments from 4.4 and 5.2 million dollars for the 10 cent and 12 cent per bushelassumptions to 6.1 and 7.3 million dollars. The new wealth after the 6.1 million dollars ofcorn producer income makes its way through the economy is estimated to total 9.6million dollars at ten cents a bushel and the total impact at twelve cents a bushel isestimated to be 11.5 million dollars.
Table 8Estimated Economic Impact of Increased Corn Revenues
Scenario One 70/30 Split to Corn and Transportation
Disposable Income Total Output22 Value Added Employment23
6.1 Million 8,105,000 3,461,000 69.5
7.3 Million 9,726,000 4,153,000 83.4Source: IMPLAN regional input-output economic impact estimator, 2002 data.
The income measures to the corn producers were increased by changing their share to 70percent. It follows that 30 percent is paid to the transportation industry. After reducingtransportation’s share of 4.4 million dollars by 30 percent for neighboring state-providedtrucking, the amount assumed spent is 3.0 million dollars at 10 cents per bushel and 3.7million dollars at 12 cents per bushel of basis improvement.
The range of economic activity in the sector resulting from the operation of ethanolproduction facilities under this scenario is estimated to be between 5.4 and 6.5 milliondollars. The amount of new wealth or value added by the transportation sector isestimated to be between 2.6 and 3.1 million dollars. Full and part time jobs created areestimated to be between 55.1 and 66.2.
22 Output and value added in millions of dollars. 1.0000 represents one million dollars.23 Estimated number of jobs resulting from 6.1 and 7.3 million dollars of new income from corn revenues.
22
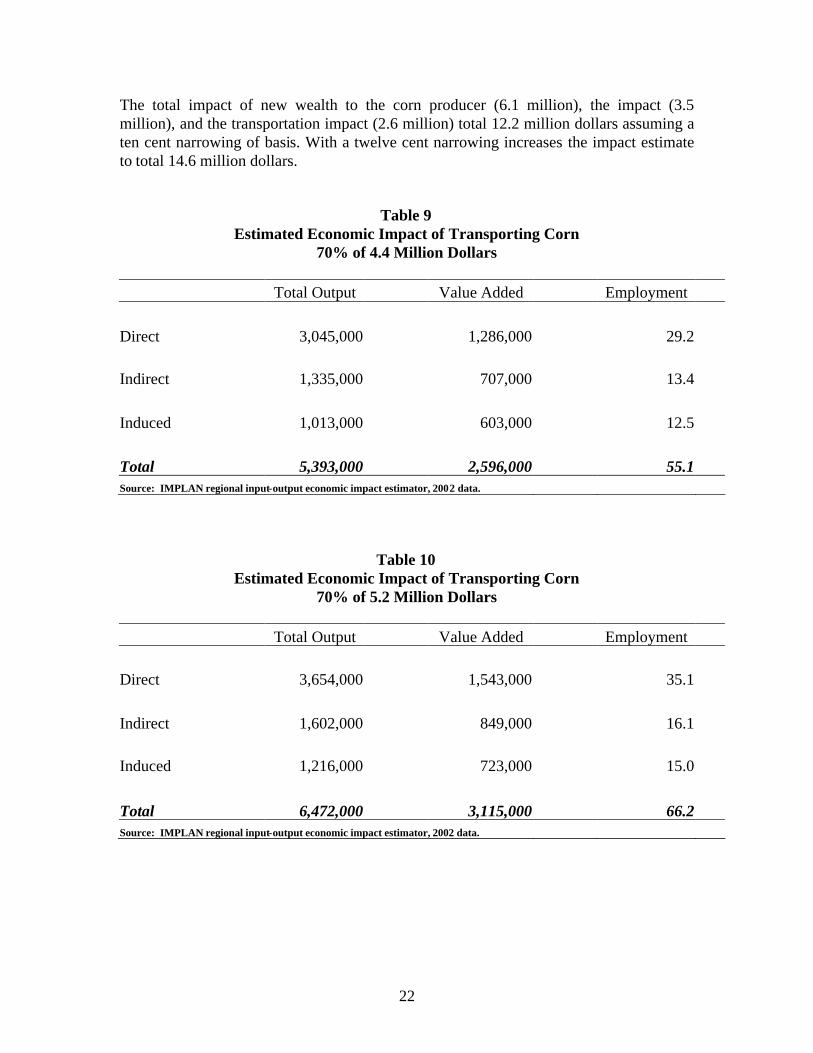
The total impact of new wealth to the corn producer (6.1 million), the impact (3.5million), and the transportation impact (2.6 million) total 12.2 million dollars assuming aten cent narrowing of basis. With a twelve cent narrowing increases the impact estimateto total 14.6 million dollars.
Table 9Estimated Economic Impact of Transporting Corn
70% of 4.4 Million Dollars
Total Output Value Added Employment
Direct 3,045,000 1,286,000 29.2
Indirect 1,335,000 707,000 13.4
Induced 1,013,000 603,000 12.5
Total 5,393,000 2,596,000 55.1Source: IMPLAN regional input-output economic impact estimator, 2002 data.
Table 10Estimated Economic Impact of Transporting Corn
70% of 5.2 Million Dollars
Total Output Value Added Employment
Direct 3,654,000 1,543,000 35.1
Indirect 1,602,000 849,000 16.1
Induced 1,216,000 723,000 15.0
Total 6,472,000 3,115,000 66.2Source: IMPLAN regional input-output economic impact estimator, 2002 data.
23
Summary of Local Corn Price Economic Impact Assumptions
Estimating the economic impact resulting from the improvement in corn prices iscomplicated by data availability but estimates that provide perspective are possible. Theestimates presented are conservative from the perspective that ten to twelve cents perbushel improvements are used and not the higher basis impact evidenced in the MontanaState University research. South Dakota uses more of its corn and consequently a greaterproportion of its corn is available for export in the production of ethanol than any otherstate. The industry assumption and some early research suggest the impact on basisadjusted local price for corn is greater when a larger percentage of corn available forexport is used by the industry.
Assumptions used in the economic impact estimates include the following:
Estimated corn use in production of ethanol in 2004 is 145 million bushels Ten and twelve cents per bushel of corn is the assumed narrowing of the basis More revenue from narrowing increases the feasible distance to transport corn Revenue increases to the corn producers above increases in transportation cost
are a bonus or a windfall in income Disposable income determines the economic impact of the windfall Some corn is imported from neighboring states (25%) and the cost of
transporting the corn is on average assumed to be higher and a larger proportion(30%).
The out of state corn grower participation percentage is recognition of neighboringstate’s participation in the South Dakota industry. Actual participation rates andtransportation adjustments would require additional research.
Ethanol Industry’s Impact on Corn Price beyond the Plant
The economic impact estimate discussed to this point is an estimate of impacts at theethanol plants and upon the price of corn relative to the general market. Existing opinionsuggests corn is shipped distances as far as 35 to 50 miles to take advantage of improvedprices. The 10 to 12 cents per bushel assumption relates to transportation of thecommodity. It is assumed that 10 to 12 cents per bushel was the appropriate incentivenecessary to induce growers to truck corn past local grain elevators or other communitybuyers.
That impact addresses only the corn delivered to ethanol plants and limits the economicimpact to the incremental or differential cost that the ethanol plants must pay to attractsufficient amounts of corn to maintain full production. The graphic presented earlier andreproduced below shows corn basis as reported by grain elevators. The basisimprovement applies to all corn sold in the local market and not just the corn sold anddelivered to ethanol plants. Basis and changes in basis for corn is measured at the local

24
grain elevators. The basis adjusted price paid by grain elevators is the local price paid incompetition with ethanol plants and other corn buyers.
Dr. McNew estimates that local basis for corn has been narrowed from 10 to 30 cents perbushel while other industry experts have estimated the average basis improvement inSouth Dakota is just over 20 cents on average. Ethanol is an important factor in the localmarket price for corn but experts do attribute some of the improvement in basis to othermarket forces. To make it even more difficult to put in perspective, the greater thepercentage of corn available for export used in the production of ethanol, the greaterinfluence on local price these market forces become. The end result is that there is noindisputable measure of the ethanol industry’s influence in the state’s local basis price ofcorn.
Because 2004 was not a typical corn production year, calculating impacts on that recordcrop wouldn’t be very meaningful. An average measure is a better perspective whensetting longer term expectations given this circumstance. Average corn production inSouth Dakota between 1995 and 2004 was 375,355,000 bushels per year. The value ofnarrowing the basis 10, 15 and 20 cents is 37.5, 56.3 and 75.1 million dollars using thataverage production measure. Further study is required to determine the appropriate basisamount to attribute to ethanol production and additional analysis is required to determinewhat portion of any basis improvement contributes to the cost of producing corn and thatwhich is additional profit.

25
The multipliers previously used for a windfall in income or bonus are applied here to addperspective to the range of estimates. The multipliers used are those from Table 2. The37.5, 56.3 and 75.1 million dollars amounts adjusted for income tax and social securityyield disposable income estimates of 30.1, 45.1 and 60.1 million dollars. That moneyspent in the economy will generate between 30.1 and 60.1 million dollars of economicactivity. The additional disposable income along with the income created while themoney makes its way through the economy is expected to generate between 51.4 and102.7 million dollars with full and part time jobs of 428 to 856 supported. Regardless ofthe price improvement level that proves appropriate, the impacts are in addition to theincremental or differential impacts shown in Table 8 of the mainline scenario.
Table 11Economic Impact of General Corn Price Basis Improvement
Ten Year Statewide Average Production of Corn
New Income Less Tax and SS Total Output Value Added Employment(10, 15, 20 Cents) (80.1%) 1.3292 0.5676 11.4
37,535,500 30,065,936 49,892,187 21,305,150 427.956,303,250 45,098,903 74,838,280 31,957,725 641.975,071,000 60,131,871 99,784,373 42,610,300 855.8
There are still other impacts to consider not addressed here. These are offsetting impactsthat result from higher local prices of corn. For example, the cost of cattle and hogfeeding increases with the cost of this factor of production. Decreases in livestockproduction resulting from increased ethanol production should be accounted for to fullyunderstand the industry’s impact. That analysis and the analysis of other changes in ruralSouth Dakota resulting from production and use choices are beyond of the scope of thisstudy.
Taxes
Every enterprise carries with it the issue of taxation. In South Dakota, taxation ofbusinesses with a few exceptions primarily falls into the categories of sales and propertytaxes. The state does not have a general corporate income tax. The sales taxes paid by theethanol industry on operations and the property taxes paid on capital improvements arediscussed below.
Industry Sales Taxes Paid
The ethanol industry pays substantial sums in sales taxes to the state of South Dakota.Electricity and gas are substantial inputs in ethanol production. It is estimated that plants

26
paid more than three million dollars in sales tax on energy expenses in 2004. Otherpurchases are also sales taxable and the total amount of sales tax paid to the state isconservatively estimated to have been between 3 and 4 million dollars in that year.
Property Taxes Paid
Property tax levies are applied to all ethanol plants. Taxes received by a county will bethe amount received on that property prior to plant construction or greater. No propertytax revenues collected prior to the ethanol plants location is lost in any case. The tax onland continues as it was with payments going to support local government.
There are provisions in South Dakota property tax law designed to encourage economicdevelopment of which the industry is taking advantage. Property can be taxed in one ofthree ways. Capital improvements can be taxed as any other property, a discretionaryformula can be applied or a tax incremental finance (TIF) can be allowed.
The state’s discretionary formula allows the value of the capital improvement for taxpurposes to be reduced for a period of up to five years. The phase-in of value is as thelocal jurisdiction determines appropriate. Typically, levies start at 20 percent of thecapital improvement value and increase 20 percent a year to 100 percent in year five.Nothing would stop local officials from approving a start at 0 percent in the first year onthe capital improvements and phasing in the levy to 100 percent in year six. Any otherpreferential scheme over the five years is allowable as well.
The TIF is an economic development tool similar to a loan program. Money required tomake the plant operational in excess of that raised from investors is obtained by issuing abond. The property tax revenues from the capital improvement, the plant, are used toretire the bond. Contribution of tax revenues for the support of local government on thecapital improvement is forgone by the taxing entities to encourage the economicdevelopment. The bond repayment periods are variable typically ranging between ten andtwenty years. One plant has a provision that is TIF like in repayment, the term is fortwenty-five years but the funds used were economic development funds and not bonds.At the end of the repayment period, the plants will pay property taxes like othercommercial property.
The outcome for local government support is very different between the use of thediscretionary formula and a TIF. The discretionary formula diminishes the plant’scontribution to local government from its capital improvements for a five year period.The TIF will delay contributions to local government on its capital improvements for aconsiderably longer time. Early retirements of the bonds result in the property tax supportof local government coming earlier.
The table shows older plants being taxed under a discretionary formula. Discretionaryformula provisions are allowed on plant improvements and reinvestments. Older plantsreceiving preferential tax treatment are paying the full levy on the older capitalimprovements and are receiving relief on new investments.

27
Table 12Ethanol Plant Property Tax Status in 2004
Support of Discretionary Payment to EstimatedLocal Government Formula TIF TIF Full Value
Sioux River Ethanol* 2004 1,738$ 53,631$ x 2023VeraSun Energy 2004 16,702 281,503 x 2020James Valley Ethanol 2003 32,415 x - - -Great Plains Ethanol 2003 1,848 96,828 On Structure 2019Glacial Lakes Energy 2002 1,773 x 70,097 Repay Fund 2027Northern Lights Ethanol 2002 466 188,174 x 2022Dakota Ethanol 2001 976 143,169 x 2018Heartland Grain Fuel 1999 94,662 - - -Heartland Grain Fuel 1993 39,213 x - - -Broin Enterprises** 1988 25,827 x - - -
Totals 215,618$ 833,402$*Distribution of funds between support of local government and TIF estimated using proportions of property values.** A new addition to the existing plant is under a discretionary formula.
28
Conclusions
Large scale ethanol production is a relatively new form of manufacturing and valueadded agriculture in South Dakota. Prominence of the industry is new to South Dakotawith substantial growth in this decade following modest beginnings in the 1990s. While itis an industry that becomes more mature each year, the technology and productionprocesses are continuing to improve, increasing efficiency and the potential of theproduction facilities.
The economic impact of ethanol production and the impacts associated with narrowingcorn’s price basis are addressed separately in this study. The benefits from the ethanolindustries’ operations and the increase in revenue to corn producers are very different.Ethanol producers will have an economic impact in the state as the result of employingpeople, buying factors of production and delivering additional product to final demand.The economic impact to the corn producer occurs if the basis is narrowed on theirexisting product. The increase in income to corn producers is a windfall added to thereceipts for existing production.
In 2004, the ethanol industry was a substantial part of the South Dakota economy. It isestimated that 675.5 million dollars of product which includes ethanol, distillers’ grainand carbon dioxide was sold by South Dakota ethanol producers. That is the value of theproduct at the door of the ethanol plants. The shipment of the ethanol product, thedistillers’ grains and the carbon dioxide from the plants to their customers is notconsidered in this estimate.
The total economic activity created by the production of ethanol in South Dakota at theplants’ doors is over one billion dollars (1.055 billion). That impact does not include theimprovement in the basis narrowed local price for the corn used in the production of theethanol which is estimated separately.
Approximately one hundred forty-five million bushels of corn was used for ethanolproduction in 2004. A ten and twelve cent a bushel narrowing of basis yields a directgross revenue improvement of 14.5 and 17.4 million dollars. These revenues weredistributed between the corn producers and transportation costs for moving the grain fromfarm or field to the plant. Using the assumptions of the mainline scenario, it is estimatedthat the additional economic activity was between twelve and fifteen million dollars.(12.2 and 14.6 million or 0.0122 and 0.0146 billion)
The increase in economic activity throughout the state’s economy as a result of producingethanol without considering general price improvements due to basis narrowing in 2004including the increase in corn revenues is estimated to have been between 1.06724 and1.07025 billion dollars, measured at the door of the ethanol plants. If the increase inincome to corn growers due to general improvement in basis is considered using a ten
24 1.0551 + 0.0122 = 1.0673 or 1.06725 1.0551 + 0.0146 = 1.0697 or 1.070
29
year average crop yield, the economic activity range increases to 1.099 and 1.131 milliondollars. Note that impacts beyond the door of the plant are not included in theseestimates. Transportation of ethanol and distillers’ grains away from the plant and use ofthe co-products in the state are not included.
New income or new wealth throughout the economy as a result of ethanol plantoperations is estimated at more than a quarter billion dollars at 255.2 million dollars. Ofthat total, 64.3 million dollars is paid to the investors in the plant and the workers at theplant. It is estimated that the ten plants included in the study employed 472.9 people on afull or part-time basis in 2004.
The economic activity created by ethanol production in other businesses in the state andthe activity of the employees at the plant and these businesses result in nearly threethousand (2,972.2) people having full or part time employment throughout the state’seconomy.
Corn basis improvement and resulting economic activity are considered separately. Theincome or new wealth directly attributed to the increased value of corn relative to thegeneral market is estimated to be between 12.2 and 14.6 million dollars and the increasednumber of full and part time jobs is estimated to be between 124.6 and 149.6.
Assuming a ten year average production of 375.4 million bushels and calculating 10, 15and 20 cent local price improvements, value added or new wealth with multiplier appliedare calculated to fall between 51.4 and 102.7 million dollars. The lower figure assumeshalf the 20 cent improved basis (10 cents) is attributable to the ethanol industry impactingthe local price for corn and the latter is calculated using the full 20 cent per bushelimprovement. The number of full and part time jobs created or supported by theeconomic activity is estimated to be between 427.9 and 855.8.
The ethanol industry is estimated to have paid between three and four million dollars insales tax in 2004. That amount is paid on the purchases of energy and other factors ofproduction that support operations but the sales tax contribution resulting from ethanolproduction does not end at the plant. The businesses supporting the plant had costs andpaid additional tax. And, there are the household purchases made in the South Dakotaeconomy as a result of a quarter billion dollars of new income or wealth being created inthe state. Offsetting these contributions, the producer subsidy paid to ethanol plants incalendar year 2004 is estimated to have been 4.75 million dollars.
Property tax on the land where ethanol plants are located did not change. The land istaxed now as it was. Older ethanol plants that have exhausted economic developmentincentives now pay property taxes like any similar commercial property. Recent capitalimprovements which include new plants and new additions to older plants are typicallytaxed in one of two ways. There is a discretionary formula that reduces a plants taxliability or the property is in a tax incremental finance (TIF) district.
30
The discretionary formula applied to plants typically provides that 20 percent of full taxliability will be paid the first year and the contribution is increased by 20 percent eachyear thereafter until full payment is made in the fifth year. The schedule of payments isset by the local authorities. The only restriction is the five year time limit.
TIF’s are created at the option of the local governing boards. The definition of a taxincremental financing district is in the name. It is the issuing of a bond or bonds tofinance a project with the proceeds from what would have been the “tax levy” applied tothe bond’s repayment. This method results in no direct contribution for the support oflocal government above that on the land for ten to twenty-five years.
But it doesn’t end there. The creation of jobs in the communities that these plants arelocated in or the surrounding communities have the benefit of their employees living inhomes paying property taxes. The businesses that support the plants operations indirectlyhave employees that pay property taxes. The same can be said for the retail industry thatfeels the support of expenditures from both groups of employees.
New technology brings new efficiencies and South Dakota’s energy industry continues tobecome more competitive with alternatives. A failed plant was put back on line in 2005.New plants were announced and construction commenced in the communities of Loomisand Redfield. The Loomis plant will have a 60 million gallon capacity and the Redfieldplant will have the more traditional 50 million gallon plant. Changes in technology,efficiencies and knowledge of this new market have brought the industry a long way fromits 8 million gallon plant beginnings.
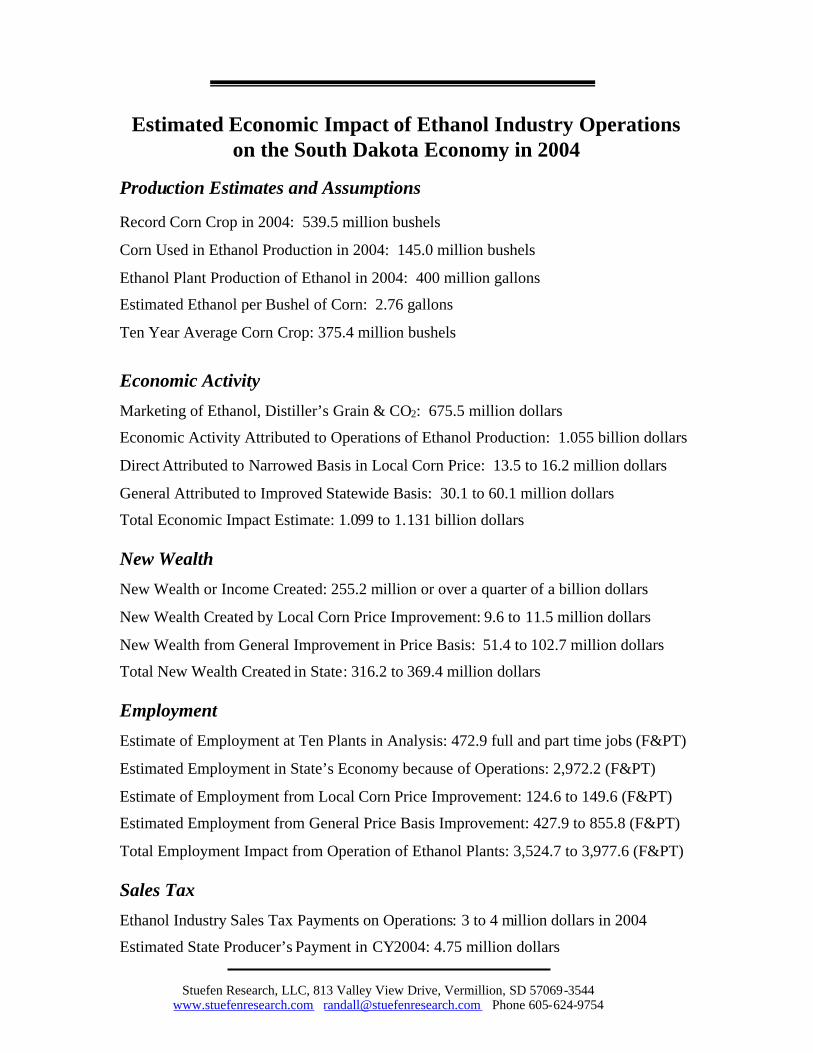
Estimated Economic Impact of Ethanol Industry Operationson the South Dakota Economy in 2004
Production Estimates and Assumptions
Record Corn Crop in 2004: 539.5 million bushels
Corn Used in Ethanol Production in 2004: 145.0 million bushels
Ethanol Plant Production of Ethanol in 2004: 400 million gallons
Estimated Ethanol per Bushel of Corn: 2.76 gallons
Ten Year Average Corn Crop: 375.4 million bushels
Economic Activity
Marketing of Ethanol, Distiller’s Grain & CO2: 675.5 million dollars
Economic Activity Attributed to Operations of Ethanol Production: 1.055 billion dollars
Direct Attributed to Narrowed Basis in Local Corn Price: 13.5 to 16.2 million dollars
General Attributed to Improved Statewide Basis: 30.1 to 60.1 million dollars
Total Economic Impact Estimate: 1.099 to 1.131 billion dollars
New Wealth
New Wealth or Income Created: 255.2 million or over a quarter of a billion dollars
New Wealth Created by Local Corn Price Improvement: 9.6 to 11.5 million dollars
New Wealth from General Improvement in Price Basis: 51.4 to 102.7 million dollars
Total New Wealth Created in State: 316.2 to 369.4 million dollars
Employment
Estimate of Employment at Ten Plants in Analysis: 472.9 full and part time jobs (F&PT)
Estimated Employment in State’s Economy because of Operations: 2,972.2 (F&PT)
Estimate of Employment from Local Corn Price Improvement: 124.6 to 149.6 (F&PT)
Estimated Employment from General Price Basis Improvement: 427.9 to 855.8 (F&PT)
Total Employment Impact from Operation of Ethanol Plants: 3,524.7 to 3,977.6 (F&PT)
Sales Tax
Ethanol Industry Sales Tax Payments on Operations: 3 to 4 million dollars in 2004
Estimated State Producer’s Payment in CY2004: 4.75 million dollars
31Stuefen Research, LLC, 813 Valley View Drive, Vermillion, SD 57069-3544
www.stuefenresearch.com [email protected] Phone 605-624-9754