The economic impact of domestic surfing on the United Kingdom · The economic impact of domestic...
32
1 The economic impact of domestic surfing on the United Kingdom
Transcript of The economic impact of domestic surfing on the United Kingdom · The economic impact of domestic...
1
The economic impact of domestic surfing on the United Kingdom

1
Published by Surfers Against SewageOctober 2013
Written byDr Bryan Mills BA(Hons), DipFM, PGCE, Phd, MIfL, SFHEA (Cornwall College) Email: [email protected]
Andy Cummins BSc(Hons) Campaign Director (Surfers Against Sewage) Email: [email protected]
SAS contact details:Surfers Against Sewage,Wheal Kitty Workshops,St. Agnes,Cornwall,TR5 0RD.
www.sas.org.uktel: 01872 553001email: [email protected]
Cover Image: Saltshots.com

2
1. The survey generated a total of 2,159 useable responses.
2. Although the majority of surfers are based in and around the areas most commonly associated with surfing (Cornwall and Devon) 11 surfing regions have surfer populations in excess of 10,000.
3. Surfers (64%) have on average higher levels of educational attainment than the wider population (27%).
4. Surfers (79.1%) are disproportionately represented in professional, managerial and business owning classes compared to the wider population (54%).
5. Surfing is not restricted to those under 30 years of age and in fact reaches out to those in their 40s, 50s and beyond.
6. Surfers spend an annualised average of £495.21 on surfboards, wetsuits, accessories and clothes, £222.86 on car parking, £708.45 on refreshments in local cafes and bars, £587.30 on local convenience stores and £966.27 on fuel.
7. An average of £169 is spent on accommodation in the UK and £474 is spent on foreign travel. This reflects the fact that not all surfers travel abroad, partly due to being able to enjoy world class waves in their own country. Many respondents spent in excess of £1,000.
8. The total spend per year on surfing and surf related activities in the UK can be estimated as £2,013.82 excluding fuel and accommodation/foreign travel, £2,980.09 including fuel and up to £3624.77 including all categories.
9. Given that there are 500,000 surfers in the UK this equates to a contribution to economic activity of between £1billion and £1.8billion per year spread between the regions and countries of
the UK.
10. Using an economic multiplier for tourism, none having been deduced for surfing, it can be suggested that the indirect economic impact of surfing may be as much as £3.96bn (£1.8bn X 2.2) and the overall impact as much as £4.95bn (£3.96bn x1.25).
EXECUTIVE SUMMARY:
Credit: Alex Callister

3
Introduction: 4
Literature Review: 4
Prosed Method and Assumptions: 7
Sample section: 8
Survey instrument design: 8
Establish an estimate of the geographical spread of surfers by county: 9
Who is the UK surfer? 10
Establish an estimate of annual spend by surfers within their county and nationally: 13
Establish an approximate value surfers place on surfing. 21
Conclusion, Policy Issues: 24
Limitations and Areas of Further Reasearch: 25
Appendix 1: Draft proposed questionnaire: 26
References: 29
TABLES:Table 1: Estimates of geographic spread of surfers 9
Table 2: Age and sport 10
Table 3: Age and Sport Chi-square analysis 10
Table 4: Qualifications and Sport 11
Table 5: Qualifications and Sport Chi-square analysis 11
Table 6: NS-SEC: self-coded class 12
Table 7: Spend on equipment, accessories, materials and clothing 13
Table 8: Spend per year on car parking month and region 14
Table 9: Spend on café at surf break per month 15
Table 10: Spend on local shops at surf break per month 16
Table 11: Cost of fuel (weighted average based on respondents four most popular breaks, 17
distance and frequency at those breaks)
Table 12: Spend on accommodation and foreign holidays 18
Table 13: National averages (excluding motoring) 18
Table 14: National averages (including motoring) 18
Table 15: National averages (including motoring, accommodation and foreign travel) 18
Table 16: Regional spend (excluding fuel , accommodation and foreign travel) 19
Table 17: Regional spend including fuel (excluding accommodation and foreign travel) 20
Table 18: Expenditure on comparable activities and sports 20
Table 19: Distance travelled and percentage of surfing that distance accounts for 21
Table 20: Number of times per month by region that surfers go surfing (midpoint averages) 22
FIGURES:Figure 1: Direct, Indirect and Induced expenditure (WTTC, 2013) 5
Figure 2: Geographical distribution of respondents 9
Figure 3: Average times surfing per month 23
Figure 4: Seasonality of tourism trips (Visit Cornwall, 2012) 23
CONTENTS
4
Although there are numerous studies on the impact of tourism (for example Carlos & Jose, 2012) and various sports (for example Ramchandani & Coleman, 2012) no complete study has been
conducted on the value of surfing to the UK economy. Earlier work by the South West Regional Development Agency (RDA, 2004) estimated the value of surfing to Cornwall alone as £64 million and that it was responsible for 1,607 jobs and a recent study of North Devon by TRISURF (Abell and Mallett, 2008) indicated a spend of £52.1 million in that area. However a national figure has not been deduced. Internationally there are numerous estimates as to surfing’s worth to individual locations (for example the Gold Coast City Council estimates surfing to be worth $(Aus) 3.3 billion to the Australian Gold Coast (CGSC, 2011), Nelsen (2007) estimates that surfing had a value of $26million and an economic impact of between $8million and $13million to San Clemente1 in California while Coffman and Burnett (2009) estimate a value of $23.8million for the Half Moon Bay2 area). However there is a lack of reliable empirical research related directly to the United Kingdom. In the absence of such information it is possible to under estimate the value of surfing and hence the negative impact on the wider economy of any reduction of surfing activity. This report presents a pilot study that tested certain empirical methods and provides initial data on surfing’s worth. The study is broadly limited to the domestic market as more robust datasets are available for this group. This therefore underestimates the total value of surfing to the UK economy.
The economic value of surfing on a global scale has been acknowledged by authors (for example Kvinta (2013) states that
in 2010 $6.3 billion was spent in the US on boards and equipment alone) and its benefit to local economies commented upon (for example Barbieri and Sotomayor 2012; Buckley, 2002; Frank, Zhou, Bezerra, & Crowley, 2009; Ponting, 2008; Tantamjarik, 2004). Barbieri and Sotomayor’s (2012) work focused on the growth in and value of specialist surf tourism (defined as including an overnight stay) and highlighted that surfing can be considered a ‘serious leisure activity’ on Stebbins’ (1982) implying that it goes beyond a casual hobby, in addition, and perhaps uniquely, surfing attracts ‘fans’ who have little interest in the actual sport itself but rather wish to ape the look and dress of surfers. This has implications for behaviour and spending patterns and is complimented by Moutinho, Dionisio and Leal’s (2007) earlier work on tribal behaviour that highlights just how seriously surfers take their sport and their associated spend. It is important to make a distinction within this paper between economic impact and estimated value. Coffman and Burnett (2009) focus on value whilst Nelsen (2007) looks at economic impact. By adopting a travel cost method they are able to examine the revealed preference and willingness to pay for surfing (a ‘use’ value). This is an estimate of the value people place on surfing. It is assumed that the combination of transport costs, opportunity cost in travel and opportunity cost in lost time during activity can be used to estimate the value the individual places on that activity when it is not possible to directly obtain a market value. This compares to activities such as attending concerts or sporting activities which charge an entry fee. Economic impact on the other hand is the direct spend of people engaged in these activities. Estimating the economic value or impact of surfing is
No complete study has been conducted on the value of
surfing to the UK economy
The economic impact of domestic surfing on the United Kingdom | Intoduction
INTRODUCTION
LITERATURE REVIEW
Internationally there are numerous estimates as to
surfing’s worth to individual locations for example the Gold
Coast City Council estimates surfing to be worth $(Aus) 3.3
billion to the Australian Gold Coast
Surfing can be considered a ‘serious leisure activity’
implying that it goes beyond a casual hobby, in addition,
and perhaps uniquely, surfing attracts ‘fans’
1San Clemente is a city of only 63,000 people but is near the internationally famous break known as ‘Trestles’ 2Half Moon Bay is near the internationally famous break ‘Mavericks’

5
complicated further by the fact that it is a combination of trip related and equipment related expenditure. Surfers need to travel to a venue, may choose to refresh themselves (food and drink) whilst there and bring with them surfing equipment. Nelsen’s (2007) study, for example, focused on trip related expenditure only and so very directly measures impact in the location that the actual surfing activity takes place, when equipment is included it is rare that this is also manufactured at that location. This can be taken further by examining the multipliers associated with direct, indirect and induced expenditure. The total number of jobs and wealth created within the area as a result of spending is not simply a matter of direct jobs but also the indirect effect of embeddedness (local purchasing by the firm) and the induced effect created by employees spending their new found wealth locally (Armstrong & Taylor, 2000). Within this research tourism multiplier values are used as a proxy enabling the estimation of direct expenditure as defined by the World Trade and Tourism Council in Figure 1 below:
Figure 1: Direct, Indirect and Induced expenditure (WTTC, 2013)
In order to calculate indirect and induced expenditure work would need to be done with the services used by surfers. In many cases these are not surf specific companies (e.g. fuel, car parks, cafes, restaurants). In the case of surf specific industries and services further analysis would be welcome but is outside the scope of this project.
The typical UK surfer will require, in addition to the obvious surfboard, at least one wetsuit though two may be more typical (wet suits being classified as summer and winter), boots, gloves, hood and board leash. Leaving aside any clothing or surfboard this collection will cost approximately3 £300-£400 and is often renewed regularly if not annually (this links to the data collected in this survey shown in Table 7: Spend on equipment, accessories, materials and clothing). In addition surfers do not necessarily live by the beach they
TOTALTravel and Tourism Contribution• To GDP
• To employment
INDUCEDContribution (spending of direct and indirect employees)• Food and beverages
• Recreation
• Clothing
• Housing
• Household goods
Estimating the economic value or impact of surfing is complicated further by the fact that it is a combination
of trip related and equipment related expenditure
The economic impact of domestic surfing on the United Kingdom | Literature Review
The typical UK surfer will require, in addition to the
obvious surfboard, at least one wetsuit though two may
be more typical, boots, gloves, hood and board leash
INDIRECTTravel & Tourism Contribution• T&T investment spending
• Government collective T&T spending
• Impacts of purchases from suppliers
DIRECTTravel and Tourism Contribution
COMMODITIES• Accomodation
• Transportation
• Entertainment
• Attractions
INDUSTRIES• Accomodation services
• Food and beverage services
• Retail Trade
• Transportation services
• Cultural, sports and recreational services
SOURCES OF SPENDING• Residents’ domestic T&T spend
• Businesses’ domestic travel spending
• Visitor exports
• Individual government T&T spend
3 Surfdome.com, a discount surf store, quote between £319.99 and £79.99 for a winter wetsuit, £379.99 to £62.99 for a summer suit, £59.99 to £9.99 for boots, £59.99 to £9.99 for gloves, £39.99 to £10.99 for hat, £32.99 to £12.99 for a leash and £664.99 - £199.99 for a board.

6
surf, and will often surf up to 100 times per year (Nelsen, 2007 and Table 20: Number of times per month by region that surfers go surfing (midpoint averages)) incurring travel and parking costs as well as making use of local
facilities including cafes , restaurants and hotels (Dolnicar & Fluker, 2003).
Underlying all of this valuation is of course the way surfers interact with the natural environment. Surfing’s interaction with nature is not unique, for example fell walkers and runners, climbers, mountain cyclists and horse riders all share a similar need for a natural environment in which to pursue their interest. However, the size of the surfing industry and its need for a clean natural environment within which to operate perhaps provides a need for a focus on the natural capital associated with the sport. The complex indirect use values associated with the marine environment and the links between the sport and its cultural links with the environment (Canniford
and Karababa, 2012) highlights a need for policy makers to be uniquely aware of the economic impact poor environmental decisions can have on both the environment and the economy.
Previous studies have highlighted the difficulty of reaching surfers and active sports participants as a group (Shaw and Jakus 1996; Hanemann et al. 2004, Nelsen, 2007). As a percentage of the general population and even as a percentage of the beach going population at peak times their numbers are small making random samples unreliable. However from a tourism perspective surfers provide vital shoulder season activity. Not only do surfers continue to use the water 12 months of the year their use of beaches extends beyond the summer peak day time to mornings and evenings (Nelsen et al. 2007).
The economic impact of domestic surfing on the United Kingdom | Literature Review
Surfers continue to use the water 12 months of the year their use of beaches extends beyond the summer peak day time to mornings and evenings
A priceless world class winter wave breaks on a UK beachCredit: Alex Callister
Credit : Andy Hughes
The surfing industry and its need for a clean natural environment within which
to operate perhaps provides a need for a focus on the
natural capital associated with the sport
Surfers spend
£495 on surfboards, wetsuits, accessories, materials and clothing
6

7
Following Nelsen’s (2007) and Barbieri and Sotomayor’s
(2012) success with an electronic survey a similar approach was adopted in this enquiry. By taking advantage of SAS’s email list of over 50,000 surfers a comprehensive sample of the UK was achieved, with the limitation that the individual had to have some form of social media connection with SAS either directly or indirectly. There are three main aims to the survey:
1. Establish an estimate of the geographical spread of surfers by region.
By surveying the entire UK it is anticipated that the spread of responses will suggest the approximate spread of surfers by surf region. These data will help dispel the myth that surfing is a sport associated only with a small number of specific coastal regions.
2. Establish an estimate of annual spend by surfers within their region and nationally.
The direct economic impact of surfing can be estimated on a regional and national basis by gathering data on annual spend. This can be categorised as spend on equipment, spend on travel and spend on facilities.
3. Establish an approximate value surfers place on surfing.
An understanding of both travel costs and time spent travelling will assist in estimating the value surfers place on surfing by using the travel cost method (Liston-Heyes, 1999). Though this will not show direct economic impact it will help better understand the value of surfing as a sport.
The economic impact of domestic surfing on the United Kingdom | Proposed Method and Assumptions
PROPOSED METHODAND ASSUMPTIONS
7Credit: Alex Callister

8
SAS promoted the economic questionnaire across their mailing lists (50,000+), Facebook page (44,000+), Twitter accounts (9,000
+) and membership (7,000 +) as well as promotion across the UK surf media. This resulted in 2,159 usable responses from UK surfers (where surfing is defined as using a shortboard, a longboard, a bodyboard, a stand up paddle board, a surf mat, a windsurfer or bodysurfing). Whilst the survey focused on domestic activity foreign surfers were not excluded (N=61) and their spend in the UK was also collected. Respondents were self-selecting and of course limited to those with access to ICT, with connections with the channels mentioned and with a desire to complete the survey. In this instance it is not expected that non-response bias occurred other than with age (the survey underrepresenting those below 18). To develop greater insight into any bias that may be present in non-respondents 4 differences were explored between the first and last quartile of questionnaires returned. Using the assumption that non-respondents are more likely to have similarities to late respondents than early respondents, differences between the first and last quartile would indicate a high probability that non-respondents are also significantly different (Bishop & Wiseman, 1999). In this instance none were significant enough to cause concern and it is assumed that there is little non-response bias beyond that previously discussed.
The survey had four broad themes. The first (questions 1-4) is aimed at suitability. The definition of surfer will be extended
as discussed above. To classify as a surfer as opposed to a beach user the expectation is that ‘surfing’ will occur 20 times per year (Leeworthy and Wiley, 2001). Questions 5-12 identify the surfer’s socio-demographic profile (in part using methods approved by the Office of National Statistics). The use of socio-demographic data is in line with Abell and Mallett (2008), Barbieri and Sotomayor (2012), Coffman, and Burnett (2009) and Nelsen, Pendleton, et al. (2007) thus making comparisons easier.The following section (questions 13-26) establishes the seasonal nature of surfing, preferred beaches and modes of travel. The emphasis remains on surfing within the UK though data is collected on spend on trips abroad. There is some similarity here with the work of Nelsen, Pendleton, et al’. (2007) but their focus was on a specific break. Although surfers often frequent numerous breaks it was decided to focus on the four breaks they visited most often. Data is also collected relating to the percentage of all activity this represents and so it will be possible to test whether this assumption is robust. To this is added detailed information (questions 27-43) about expenditure but this is separated into local expenditure on services and expenditure on equipment. The intention is to be able to produce locally relevant data as opposed to averaged annual spends.
2,159 usable responses from UK
surfers
The economic impact of domestic surfing on the United Kingdom | Proposed Method and Assumptions
SAMPLE SECTION
SURVEY INSTRUMENT DESIGN
The survey had four broad themes:
1: The definition of surfer
2: The surfer’s socio-demographic profile
3: The seasonal nature of surfing
4: Local expenditure on services and expenditure
on equipment
4Non-respondents may not be randomly distributed, and certain categories may be over or under represented - Errington (1985).

9
Cornwall 87,453 17.49%South Coast 3 6 77,618 15.52%East Devon 58,480 11.70%Land Locked 8 46,784 9.36%South Coast 1 9 39,872 7.97%Cardiff 39,607 7.92%North East 32,695 6.54%South Devon 28,974 5.79%North Devon 23,923 4.78%East Coast 21,531 4.31%Swansea 12,228 2.45%West Wales 8,240 1.65%South Coast 2 7 7,443 1.49%Northern Ireland 4,785 0.96%North Wales 4,519 0.90%Morray Firth 2,127 0.43%Orkney Islands 1,329 0.27%Inner Hebrides 1,329 0.27%North Coast 532 0.11%Outer Hebrides 532 0.11%Grand total 500,000 100%
Based on the total number of surfers estimated by Defra (2007) of 500,000 and the distribution of responses to this survey it is possible to create an index such that we can estimate the total number of surfers per region and the associated percentage of total surfer population (see also Figure 2: Geographical distribution of respondents). For example 17.49% of respondents came from Cornwall and so 17.49% of the UK’s surfer population of 500,000 come from Cornwall – or 87,453. It is accepted that the survey may over represent surfers in the far south west, this being the original
founding region of Surfers Against Sewage, however a figure of 87,543 for Cornwall represents approximately 16% of that county’s population – or 24% of those aged between 10 and 65 5 years of age . It is worth stating that Defra’s figure of 500,000 is based on a 2007 study by the British Marine Federation and has been used as it is commonly cited but more recent work by the BMF et al (2012) pushes this figure up to 599,016 with 521,000 as the lower limit of participation and an upper limit of 677,000 (at 90% confidence). These results are based on a nationally representative sample of 12,000 of the general public. However, given the wide use of the 500,000 figure cited by Defra and its more conservative value that figure is used in this report.
The economic impact of domestic surfing on the United Kingdom | Establish an estimate of the geographical spread of surfers by region
ESTABLISH AN ESTIMATE OF THE
GEOGRAPHICAL SPREAD OF SURFERS BY REGION
We can estimate the total number of surfers per region
5 Population data drawn from Cornwall Council website (Population) www.cornwall.gov.uk/default.aspx?page=221376 East & West Whittering (Selsey) to Folkestone
7 Isle of Wight8 Surfers living more than 25 miles outside a surfing region as identified in the Stormrider Guide.9 From the Devon border to Bournemouth (Hegistbury Head)
Every corner of the UK receives great waves, this huge wave is found near Hartlepool.
Credit: McClean
Comparable data for North Devon suggested a total surfing population in that region of 42,000, however this figure was based on both resident and visitors to the area, both surveys of course are also confounded by issues relating to representation and the assumed randomness of the sample. The data presented above refers to domicile only (Abell and Mallett, 2008). Figure 2: Geographical distribution of respondentsTable 1: Estimates of geographic spread of surfers

10
Chi-Square TestsValue df Asymp. Sig. (2-sided)
Pearson Chi-Square 198.602a 12 .000
Likelihood Ratio 199.254 12 .000
Linear-by-Linear Association
149.969 1 .000
N of Valid Cases 1744
a. 1 cells (4.8%) have expected count less than 5. The minimum expected count is 2.12.
Table 3: Age and Sport Chi-square analysis
From Tables 2 and 3 it is possible to see there is a statistically significant relationship between age and type of surfing with younger people riding more shortboards and a greater number of older people riding longboards than you would expect if there was no relationship.
The economic impact of domestic surfing on the United Kingdom | Establish an estimate of the geographical spread of surfers by region
WHO IS THE UK SURFER?
Shortboard Longboard Bodyboard Total
Under 18 Count 44 16 5 65
Expected Count 32 23 9
18-24 Count 171 60 30 261
Expected Count 130 94 37
25-34 Count 331 192 38 561
Expected Count 280 202 79
35-44 Count 253 215 78 546
Expected Count 272 197 77
45-54 Count 56 104 68 228
Expected Count 114 82 32
55-64 Count 14 36 18 68
Expected Count 34 24.5 10
65-74 Count 0 6 10 15
Expected Count 7.5 5 2
Total Count 869 629 246 1744
Expected Count 869 629 246
What type of surfing do you most commonly engaged in?
Wha
t is
your
age
?
Table 2: Age and sport

11
The economic impact of domestic surfing on the United Kingdom | Establish an estimate of the geographical spread of surfers by region
Shortboard Longboard Bodyboard Total
None Count 24 9 8 41
Expected Count 21 15 6
L1 1-4 GCSEs Count 19 22 7 48
Expected Count 24 17 7
L2 – 5 GCSE or equivalent
Count 69 48 22 139
Expected Count 70 50 20
L 3 Apprentice Count 29 24 7 60
Expected Count 30 22 8
L3 – 2 or more A Level or equivalent
Count 176 107 46 329
Expected Count 165 118 46
L4 – degree etc Count 550 412 154 1116
Expected Count 558 401 157
Total Count 867 622 244 1733
Expected Count 867 622 244
What type of surfing do you most commonly engaged in?
Wha
t’s th
e hi
ghes
t lev
el o
f edu
catio
n co
mpl
eted
? (O
NS
desc
riptio
ns):
Chi-Square TestsValue df Asymp. Sig. (2-sided)
Pearson Chi-Square 9.338a 10 .500
Likelihood Ratio 9.558 10 .480
Linear-by-Linear Association
.088 1 .766
N of Valid Cases 1733
Table 5: Qualifications and Sport Chi-square analysis
Table 4: Qualifications and Sport
As can be seen from Tables 4 and 5 there is no significant relationship between surfing discipline and qualifications. However it is worth noting that 1,116 respondents reported qualification to level 4 and above. This gives 64% of respondents as having an undergraduate or above qualification compared to 27% in England and Wales for the general population
(ONS, 2011).
The longboard, shortboard and bodyboard offer the rider a very different surfing experience.

12
The average spend on equipment, accessories, materials and clothing for surf regions within the UK is displayed in the table below:
The economic impact of domestic surfing on the United Kingdom | Annual Spend
ESTABLISH AN ESTIMATE OF ANNUAL SPEND BY SURFERS WITHIN THEIR
REGION AND NATIONALLY How
often do you replace or buy a wetsuit?
What is your approximate spend, per wetsuit, on that/those wetsuit(s)? (£)
How often do you replace or buy a board?
What is your approximate spend, per board, on that/those surfboard(s)? (£)
PA spend on wetsuits (£)
PA Spend on surfboards (£)
Approximately how much per year do you spend on surfing accessories? (£)
Approximately how much per year do you spend on surfing materials? (£)
Approximately how much per year do you spend on surf related clothing? (£)
N Mode Mean Mode Mean Mean Mean Mean PA Weighted
no region given
278 0.25 197.80 0.25 427.63 49.45 106.91 96.35 43.75 212 508.80 65.51
Cornwall 329 0.50 198.84 0.25 338.18 99.42 84.54 82.04 34.87 183 484.10 73.77
North Devon
90 0.25 205.81 0.25 348.63 51.45 87.16 74.03 35.97 167 415.66 17.33
South Devon
109 0.50 192.64 0.25 374.27 96.32 93.57 76.84 40.44 192 498.98 25.19
South Coast 1
150 0.50 194.78 0.25 382.34 97.39 95.59 86.35 40.61 204 523.67 36.38
South Coast 2
28 0.50 218.96 0.25 400.00 109.48 100.00 96.00 39.60 215 560.08 7.26
South Coast 3
292 0.25 197.23 0.25 380.92 49.31 95.23 82.94 44.32 180 451.34 61.04
East Devon
220 0.25 195.08 0.25 349.97 48.77 87.49 83.35 44.37 222 486.18 49.54
North East
123 0.50 213.99 0.25 371.31 106.99 92.83 85.36 42.53 219 547.02 31.16
East Coast
81 0.50 234.92 0.25 363.17 117.46 90.79 94.83 35.05 176 514.20 19.29
Morray Firth
8 1.00 221.88 0.25 332.14 221.88 83.04 176.88 59.38 386 926.99 3.43
North Coast
2 1.00 275.00 1.00 300.00 275.00 300.00 112.50 105.00 100 892.50 0.83
Outer Hebrides
2 0.50 350.00 0.50 350.00 175.00 175.00 20.00 30.00 0 400.00 0.37
Orkney Islands
5 1.00 338.00 1.00 540.00 338.00 540.00 115.00 56.00 92 1141.00 2.64
Inner Hebrides
5 0.50 225.00 1.00 450.00 112.50 450.00 225.00 125.00 375 1287.50 2.98
Cardiff 149 0.50 198.40 0.25 399.39 99.20 99.85 96.98 44.34 229 569.47 39.30
Swansea 46 0.50 184.73 0.25 345.91 92.36 86.48 62.19 32.79 222 496.11 10.57
West Wales
31 0.50 208.75 0.25 420.86 104.38 105.21 82.41 44.46 200 536.46 7.70
North Wales
17 0.25 152.92 0.25 391.25 38.23 97.81 57.73 25.83 233 452.52 3.56
Northern Ireland
18 0.25 175.36 0.25 350.00 43.84 87.50 59.29 32.92 160 383.90 3.20
Land Locked
176 0.25 172.54 0.25 332.99 43.13 83.25 74.33 35.80 182 418.70 34.13
495.21
Table 7: Spend on equipment, accessories, materials and clothing

13
Table 7 shows regional average spend on equipment, accessories, materials and clothing. The two columns referring to frequency of purchase are decimal when that purchase is made once every two years (0.5) or more (0.25). The weighted average spend for the year (weighted by number of surfers per region) is calculated as £495.21. Some of the differences in spend may be explained by the need to invest more in high performance colder water wetsuits in
colder parts of the UK. Where surf breaks are heavier board breaks are more likely, or it may simply reflect that prices are higher in those regions or that the type of surfer encountered invests more in their sport.
Table 8 shows regional average spend on car parking. The weighted average spend for the year (weighted by number of surfers per region) is calculated as £222.86.
The economic impact of domestic surfing on the United Kingdom | Annual Spend
N JAN (£)
FEB (£)
MARCH (£)
APRIL (£)
MAY (£)
JUNE (£)
JULY (£)
AUG (£)
SEPT (£)
OCT (£)
NOV (£)
DEC (£) PA (£)
Weighted Spend
no region given
278 12.56 12.56 12.56 12.56 30.15 30.15 30.15 30.15 30.15 30.15 10.05 4.80 246.01 31.68
Cornwall 329 9.88 9.88 23.71 23.71 23.71 23.71 33.59 33.59 33.59 23.71 7.90 3.86 250.85 38.23
North Devon
90 17.03 17.03 17.03 40.87 40.87 40.87 40.87 40.87 40.87 40.87 13.62 6.60 357.40 14.90
South Devon
109 15.67 15.67 15.67 15.67 15.67 37.62 37.62 37.62 37.62 37.62 12.54 5.57 284.55 14.37
South Coast 1
150 20.13 20.13 20.13 20.13 20.13 20.13 20.13 48.31 48.31 48.31 16.10 6.43 308.38 21.43
South Coast 2
28 4.38 4.38 10.50 10.50 10.50 10.50 14.88 10.50 14.88 10.50 3.50 1.77 106.77 1.38
South Coast 3
292 7.40 7.40 18.49 18.49 18.49 18.49 18.49 18.49 18.49 18.49 11.09 5.12 178.92 24.20
East Devon
220 8.79 8.79 8.79 8.79 21.98 21.98 21.98 21.98 21.98 21.98 8.79 6.57 182.37 18.58
North East
123 13.40 13.40 13.40 13.40 13.40 13.40 13.40 13.40 32.16 32.16 8.04 4.56 184.11 10.49
East Coast
81 1.81 1.81 1.81 1.81 1.81 1.81 1.81 1.81 4.33 4.33 1.44 0.52 25.07 0.94
Morray Firth
8 3.63 3.63 8.70 3.63 3.63 3.63 3.63 3.63 8.70 8.70 2.18 1.15 54.80 0.20
North Coast
2 0.00 0.00 0.00 0.00 0.00 0.00 0.00 0.00 0.00 0.00 0.00 0.00 0.00 0.00
Outer Hebrides
2 0.00 0.00 0.00 0.00 0.00 0.00 0.00 0.00 0.00 0.00 0.00 0.00 0.00 0.00
Orkney Islands
5 0.00 0.00 0.00 0.00 0.00 0.00 0.00 0.00 0.00 0.00 0.00 0.00 0.00 0.00
Inner Hebrides
5 0.00 0.00 0.00 0.00 0.00 0.00 0.00 0.00 0.00 0.00 0.00 0.00 0.00 0.00
Cardiff 149 8.70 8.70 21.75 21.75 21.75 21.75 52.19 52.19 52.19 21.75 13.05 7.41 303.18 20.92
Swansea 46 12.43 12.43 12.43 29.83 29.83 29.83 29.83 29.83 29.83 29.83 9.94 4.81 260.88 5.56
West Wales
31 4.54 4.54 10.89 10.89 10.89 10.89 10.89 10.89 15.43 10.89 3.63 1.32 105.67 1.52
North Wales
17 12.50 8.28 42.50 30.00 12.50 12.50 30.00 30.00 42.50 30.00 10.00 3.32 264.10 2.08
Northern Ireland
18 7.29 4.13 7.29 7.29 7.29 7.29 7.29 17.50 17.50 17.50 5.83 2.36 108.58 0.91
Land Locked
176 6.84 7.21 6.84 6.84 17.11 17.11 17.11 41.06 41.06 17.11 6.84 4.79 189.95 15.48
222.86
Table 8: Spend per year on car parking month and region
14
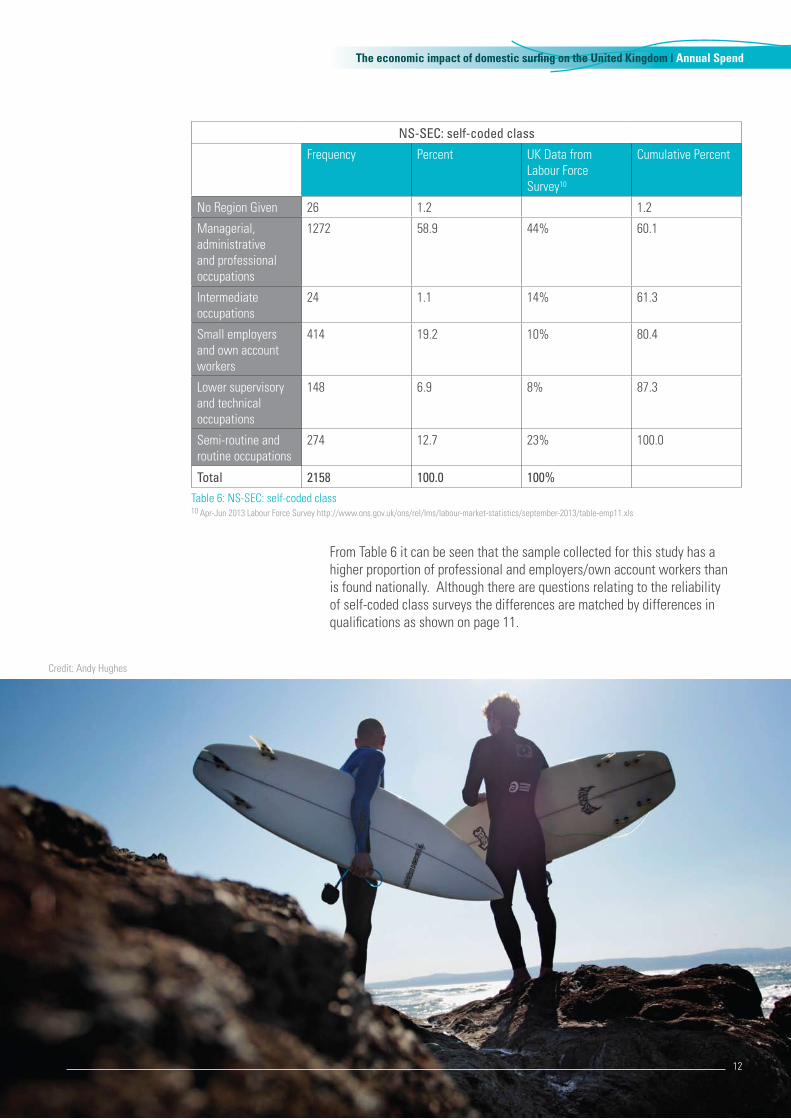
From Table 6 it can be seen that the sample collected for this study has a higher proportion of professional and employers/own account workers than is found nationally. Although there are questions relating to the reliability of self-coded class surveys the differences are matched by differences in qualifications as shown on page 11.
NS-SEC: self-coded class
Frequency Percent UK Data from Labour Force Survey10
Cumulative Percent
No Region Given 26 1.2 1.2
Managerial, administrative and professional occupations
1272 58.9 44% 60.1
Intermediate occupations
24 1.1 14% 61.3
Small employers and own account workers
414 19.2 10% 80.4
Lower supervisory and technical occupations
148 6.9 8% 87.3
Semi-routine and routine occupations
274 12.7 23% 100.0
Total 2158 100.0 100%Table 6: NS-SEC: self-coded class
The economic impact of domestic surfing on the United Kingdom | Annual Spend
12
Credit: Andy Hughes
10 Apr-Jun 2013 Labour Force Survey http://www.ons.gov.uk/ons/rel/lms/labour-market-statistics/september-2013/table-emp11.xls

15
Table 9 shows regional average spend in cafes at surf breaks. The weighted average spend for the year (weighted by number of surfers per region) is calculated as £708.45.
The economic impact of domestic surfing on the United Kingdom | Annual Spend
N JAN FEB MARCH APRIL MAY JUNE JULY AUG SEPT OCT NOV DEC PA Weighted Spend
no region given
278 59.71 59.71 59.71 59.71 143.30 143.30 143.30 143.30 143.30 143.30 47.77 22.79 1169.18 150.55
Cornwall 329 20.64 20.64 49.53 49.53 49.53 49.53 70.17 70.17 70.17 49.53 16.51 8.07 524.04 79.86
North Devon
90 21.13 21.13 21.13 50.72 50.72 50.72 50.72 50.72 50.72 50.72 16.91 8.19 443.54 18.49
South Devon
109 36.11 36.11 36.11 36.11 36.11 86.67 86.67 86.67 86.67 86.67 28.89 12.83 655.61 33.10
South Coast 1
150 45.82 45.82 45.82 45.82 45.82 45.82 45.82 109.98 109.98 109.98 36.66 14.63 702.00 48.77
South Coast 2
28 19.60 19.60 47.04 47.04 47.04 47.04 66.64 47.04 66.64 47.04 15.68 7.92 478.32 6.20
South Coast 3
292 25.21 25.21 63.04 63.04 63.04 63.04 63.04 63.04 63.04 63.04 37.82 17.47 610.02 82.50
East Devon
220 29.26 29.26 29.26 29.26 73.16 73.16 73.16 73.16 73.16 73.16 29.26 21.87 607.13 61.87
North East
123 35.90 35.90 35.90 35.90 35.90 35.90 35.90 35.90 86.16 86.16 21.54 12.22 493.28 28.10
East Coast
81 25.36 25.36 25.36 25.36 25.36 25.36 25.36 25.36 60.87 60.87 20.29 7.29 352.23 13.21
Morray Firth
8 25.63 25.63 61.50 25.63 25.63 25.63 25.63 25.63 61.50 61.50 15.38 8.10 387.35 1.44
North Coast
2 85.00 85.00 60.00 60.00 25.00 10.00 10.00 25.00 60.00 60.00 20.00 0.00 500.00 0.46
Outer Hebrides
2 0.00 0.00 0.00 0.00 0.00 0.00 0.00 0.00 0.00 0.00 0.00 0.00 0.00 0.00
Orkney Islands
5 24.00 34.00 34.00 24.00 24.00 24.00 10.00 24.00 34.00 34.00 8.00 4.56 278.56 0.65
Inner Hebrides
5 71.25 242.25 242.25 171.00 242.25 242.25 242.25 242.25 242.25 28.50 78.38 30.78 2075.66 4.81
Cardiff 149 28.56 28.56 71.40 71.40 71.40 71.40 171.36 171.36 171.36 71.40 42.84 24.33 995.35 68.69
Swansea 46 27.50 27.50 27.50 66.00 66.00 66.00 66.00 66.00 66.00 66.00 22.00 10.65 577.15 12.30
West Wales
31 20.09 20.09 48.21 48.21 48.21 48.21 48.21 48.21 68.30 48.21 16.07 5.85 467.91 6.72
North Wales
17 43.54 28.85 148.04 104.50 43.54 43.54 104.50 104.50 148.04 104.50 34.83 11.56 919.95 7.24
Northern Ireland
18 53.21 30.15 53.21 53.21 53.21 53.21 53.21 127.71 127.71 127.71 42.57 17.26 792.41 6.61
Land Locked
176 33.99 35.81 33.99 33.99 84.96 84.96 84.96 203.91 203.91 84.96 33.99 23.80 943.21 76.89
708.45
Table 9: Spend on café at surf break per month

16
The economic impact of domestic surfing on the United Kingdom | Annual Spend
Table 10 shows regional average spend in local shops at surf breaks. The weighted average spend for the year (weighted by number of surfers per region) is calculated as £587.30.
N JAN FEB MARCH APRIL MAY JUNE JULY AUG SEPT OCT NOV DEC PA Weighted Spend
no region given
278 61.76 61.76 61.76 61.76 148.22 148.22 148.22 148.22 148.22 148.22 49.41 23.57 1209.30 155.71
Cornwall 329 16.52 16.52 39.64 39.64 39.64 39.64 56.15 56.15 56.15 39.64 13.21 6.46 419.34 63.90
North Devon
90 14.11 14.11 14.11 33.87 33.87 33.87 33.87 33.87 33.87 33.87 11.29 5.47 296.20 12.35
South Devon
109 32.83 32.83 32.83 32.83 32.83 78.79 78.79 78.79 78.79 78.79 26.26 11.66 595.99 30.09
South Coast 1
150 33.27 33.27 33.27 33.27 33.27 33.27 33.27 79.84 79.84 79.84 26.61 10.62 509.64 35.41
South Coast 2
28 15.63 15.63 37.50 37.50 37.50 37.50 53.13 37.50 53.13 37.50 12.50 6.31 381.31 4.95
South Coast 3
292 18.24 18.24 45.60 45.60 45.60 45.60 45.60 45.60 45.60 45.60 27.36 12.64 441.27 59.68
East Devon
220 26.80 26.80 26.80 26.80 67.01 67.01 67.01 67.01 67.01 67.01 26.80 20.03 556.11 56.67
North East
123 30.19 30.19 30.19 30.19 30.19 30.19 30.19 30.19 72.45 72.45 18.11 10.27 414.77 23.63
East Coast
81 16.75 16.75 16.75 16.75 16.75 16.75 16.75 16.75 40.20 40.20 13.40 4.82 232.62 8.73
Morray Firth
8 19.38 19.38 46.50 19.38 19.38 19.38 19.38 19.38 46.50 46.50 11.63 6.13 292.88 1.09
North Coast
2 85.00 85.00 60.00 60.00 25.00 10.00 10.00 25.00 60.00 60.00 20.00 0.00 500.00 0.46
Outer Hebrides
2 0.00 0.00 0.00 0.00 0.00 0.00 0.00 0.00 0.00 0.00 0.00 0.00 0.00 0.00
Orkney Islands
5 40.80 57.80 57.80 40.80 40.80 40.80 17.00 40.80 57.80 57.80 13.60 7.75 473.55 1.10
Inner Hebrides
5 12.50 42.50 42.50 30.00 42.50 42.50 42.50 42.50 42.50 5.00 13.75 5.40 364.15 0.84
Cardiff 149 20.59 20.59 51.48 51.48 51.48 51.48 123.56 123.56 123.56 51.48 30.89 17.54 717.69 49.53
Swansea 46 16.32 16.32 16.32 39.18 39.18 39.18 39.18 39.18 39.18 39.18 13.06 6.32 342.58 7.30
West Wales
31 11.79 11.79 28.29 28.29 28.29 28.29 28.29 28.29 40.07 28.29 9.43 3.43 274.51 3.94
North Wales
17 37.08 24.57 126.08 89.00 37.08 37.08 89.00 89.00 126.08 89.00 29.67 9.85 783.50 6.17
Northern Ireland
18 31.15 17.65 31.15 31.15 31.15 31.15 31.15 74.77 74.77 74.77 24.92 10.10 463.91 3.87
Land Locked
176 27.36 28.82 27.36 27.36 68.39 68.39 68.39 164.13 164.13 68.39 27.36 19.15 759.22 61.89
587.30
Table 10: Spend on local shops at surf break per month

17
Table 11: Cost of fuel (weighted average based on respondents four most popular breaks, distance and frequency at those breaks)
11 Surfers were asked to list their four most frequently surfed beaches, the distance to them and the percentage of total trips these accounted for. The number given in the table is the weighted average of these trips. As would be expected the closest breaks tended to be the ones most commonly surfed.
12 www.theaa.com/resources/Documents/pdf/motoring-advice/running-costs/petrol2013.pdf
As would be expected land locked surfers have higher average spend on fuel than their coastal counterparts (Table 11), however all regions, with the exception of the Scottish Islands, show significant spend per individual. The fuel cost is based on the AA12 estimate for a low cost car and fuel at 137.7p per litre. It does not include any other running costs. Average spend nationally would be £966.27.
The economic impact of domestic surfing on the United Kingdom | Annual Spend
N Weighted Average Miles11
Frequency Total Miles
Average Cost @ 12.67p
Total
no region given
278 75.5 102 £976.32 £271,416.43
Corwall 329 30.0 138 £524.51 £172,565.09
North Devon
90 44.0 123 £686.04 £61,743.99
South Devon
109 69.6 95 £837.93 £91,334.02
South Coast 1
150 110.8 81 £1,136.96 £170,544.58
South Coast 2
28 24.5 133 £413.23 £11,570.35
South Coast 3
292 175.4 51 £1,133.40 £330,952.89
East Devon
220 241.2 42 £1,283.31 £282,329.14
North East
123 70.7 74 £662.43 £81,478.89
East Coast
81 77.6 74 £727.19 £58,902.37
Morray Firth
8 94.5 88 £1,053.64 £8,429.11
North Coast
2 12.4 130 £203.83 £407.66
Outer Hebrides
2 2.3 68 £19.71 £39.42
Orkney Islands
5 20.1 167 £425.11 £2,125.54
Inner Hebrides
5 33.1 167 £700.68 £3,503.38
Cardiff 149 138.2 75 £1,313.35 £195,689.46
Swansea 46 42.8 109 £591.03 £27,187.60
West Wales
31 34.2 128 £554.69 £17,195.49
North Wales
17 86.7 124 £1,365.58 £23,214.80
Northern Ireland
18 92.6 79 £924.81 £16,646.64
Land Locked
176 206.9 56 £1,471.08 £258,909.75
N 2159 Average Total £2,086,186.62
Surfers are more likely to pull up in an Audi than a VW camper van.Credit: Chris Nelson

18
The economic impact of domestic surfing on the United Kingdom | Annual Spend
As with fuel the spend on accommodation and foreign holidays by those closer to the coast is less than those inland. An average of £169 on UK accommodation and £474 on foreign travel covers a wide range of values, with some surfers reporting spends on foreign trips in the thousands.
Table 12: Spend on accommodation and foreign holidays
How much do you spend a year on hotels and accommodation to go surfing in the UK?
How much do you spend on foreign surfing trips per year?
Mean Count Sum Mean Count Sum
no region given £498 278 £8,971 £1,515 278 £63,638
Cornwall £244 329 £16,840 £1,231 329 £162,501
North Devon £231 90 £8,081 £1,571 90 £66,000
South Devon £256 109 £11,265 £1,132 109 £40,750
South Coast 1 £332 150 £28,590 £1,192 150 £71,530
South Coast 2 £319 28 £3,830 £1,377 28 £17,900
South Coast 3 £465 292 £84,140 £1,395 292 £168,788
East Devon £497 220 £58,675 £1,179 220 £93,125
North East £446 123 £29,007 £1,368 123 £71,152
East Coast £320 81 £12,800 £1,228 81 £47,900
Morray Firth £437 8 £2,620 £1,633 8 £4,900
North Coast / 2 / £2,000 2 £4,000
Outer Hebrides / 2 / / 2 /
Orkney Islands £500 5 £1,500 £2,150 5 £4,300
Inner Hebrides £375 5 £750 £3,333 5 £10,000
Cardiff £405 149 £34,011 £1,321 149 £70,026
Swansea £302 46 £7,240 £1,823 46 £23,700
West Wales £282 31 £3,670 £1,121 31 £19,050
Mid Wales / / / / / /
North Wales £369 17 £2,580 £1,233 17 £7,400
Northern Ireland £94 18 £470 £880 18 £4,400
Land Locked £467 176 £49,495 £1,219 176 £71,950
Average £169 £474
Average per annum spends: (£)
Equipment and materials 495.21
Car parking 222.86
Café 708.45
Local shops 587.30
2013.82
Average per annum spends: (£)
Equipment and materials 495.21
Car parking 222.86
Café 708.45
Local shops 587.30
Motoring 966.27
2980.09
Average per annum spends: (£)
Equipment and materials 495.21
Car parking 222.86
Café 708.45
Local shops 587.30
Motoring 966.27
Accommodation 169.84
Foreign Travel 474.84
3624.77
Table 13: National averages (excluding motoring) Table 14: National averages
(including motoring)
Table 15: National averages (including motoring, accommodation and foreign travel)

19
Based on an average yearly spend of £2013.82 (excluding fuel, accommodation and travel) and the total number of surfers estimated by Defra (2007) as 500,000 it can be suggested that surfers contribute £1,006,910,000 excluding cost of travel. It is worth noting that this figure assumes activity participation rates as measured within this project’s sample (and seen in
Table 20: Number of times per month by region that surfers go surfing (midpoint averages). The BMF in their 2012 study estimated numbers of participants at 599,016 but in their 2009 study observed that only 23% participated regularly. However this frequency of participation value was based on responses from only 110 surfers. If the cost of fuel is included into the average cost calculations the figure rises to £1,490,045,000 and when accommodation and foreign travel is considered it becomes £1,812,385,000. It is worth remembering that a proportion of spend on foreign travel will be in the form of imports and a leakage occurs. However an amount remains in the form of UK based tour operators, flight and ferry operators and insurance and travel brokers. The analysis conducted in this research only looks at first round direct expenditure. No account is taken of indirect or induced expenditure or the effects of multipliers. When these are taken into account, and using a multiplier for tourism as none has been deduced for surfing, it can be suggested that the indirect economic impact of surfing may be as much as £3.96bn (£1.8bn X 2.2) and the overall impact as much as £4.95bn (£3.96bn x1.25) (Oxford Economics, 2008).
From the table to the left, assuming that the survey proportions represent the national spread of surfers, it can be seen clearly that Cornwall, the South Coast and Devon account for most expenditure. As previously discussed the number of surfers in Cornwall may be slightly over-estimated. Even allowing for a
correction of up to 33% the spend still remains over £100 million with the residual amount redistributed around the UK. The data also ignores the impact of surfing events such as Boardmasters at Newquay in Cornwall, estimated by Arup (2010) as contributing £17million to the local economy.
The economic impact of domestic surfing on the United Kingdom | Annual Spend
n Weight Value Percent
Cornwall 329 0.152 £ 153,438,346 15.2%
South Coast 3 292 0.135 £ 136,182,362 13.5%
Blank 278 0.129 £ 129,653,071 12.9%
East Devon 220 0.102 £ 102,603,150 10.2%
Land Locked 176 0.082 £ 82,082,520 8.2%
South Coast 1 150 0.069 £ 69,956,693 6.9%
Cardiff 149 0.069 £ 69,490,315 6.9%
North East 123 0.057 £ 57,364,488 5.7%
South Devon 109 0.050 £ 50,835,197 5.0%
North Devon 90 0.042 £ 41,974,016 4.2%
East Coast 81 0.038 £ 37,776,614 3.8%
Swansea 46 0.021 £ 21,453,386 2.1%
West Wales 31 0.014 £ 14,457,717 1.4%
South Coast 2 28 0.013 £ 13,058,583 1.3%
Northern Ireland 18 0.008 £ 8,394,803 0.8%
North Wales 17 0.008 £ 7,928,425 0.8%
Morray Firth 8 0.004 £ 3,731,024 0.4%
Orkney Islands 5 0.002 £ 2,331,890 0.2%
Inner Hebrides 5 0.002 £ 2,331,890 0.2%
North Coast 2 0.001 £ 932,756 0.1%
Outer Hebrides 2 0.001 £ 932,756 0.1%
Table 16: Regional spend (excluding fuel, accommodation and foreign travel)
Fistral beach during the 2012 Boardmasters surfing festival.

20
Earlier studies had estimated that surfing may have contributed approximately £64m (RDA, 2004) to Cornwall, the new figure established in this study of £153million reflects growth in the sport in the decade (GIA, 2011) in between and differences in survey methods. Similarly TRISURF’s study of North Devon (Abell and Mallett, 2008) indicated a spend of £52.1 million compared to the £42million found in this study. In this instance the difference partly reflects the fact that TRISURF’s study included both resident and visiting surfers.
Given the sizable amount of expenditure fuel accounts for the following table illustrates what may be the total contribution to regional economies.
With a total combined expenditure of £1.49 billion the inclusion of fuel pushes the expenditure in all but five regions above the £10 million mark.
There are significant sums spent in landlocked regions,
on east coast and in Northern Ireland and Wales
The economic impact of domestic surfing on the United Kingdom | Annual Spend
n Weight Value Percent
Cornwall 329 0.152 £ 276,180,947 27.4%
South Coast 3 292 0.135 £ 245,121,084 24.3%
Blank 278 0.129 £ 233,368,703 23.2%
East Devon 220 0.102 £ 184,680,269 18.3%
Land Locked 176 0.082 £ 147,744,215 14.7%
South Coast 1 150 0.069 £ 125,918,365 12.5%
Cardiff 149 0.069 £ 125,078,909 12.4%
North East 123 0.057 £ 103,253,059 10.3%
South Devon 109 0.050 £ 91,500,679 9.1%
North Devon 90 0.042 £ 75,551,019 7.5%
East Coast 81 0.038 £ 67,995,917 6.8%
Swansea 46 0.021 £ 38,614,965 3.8%
West Wales 31 0.014 £ 26,023,129 2.6%
South Coast 2 28 0.013 £ 23,504,761 2.3%
Northern Ireland 18 0.008 £ 15,110,204 1.5%
North Wales 17 0.008 £ 14,270,748 1.4%
Morray Firth 8 0.004 £ 6,715,646 0.7%
Orkney Islands 5 0.002 £ 4,197,279 0.4%
Inner Hebrides 5 0.002 £ 4,197,279 0.4%
North Coast 2 0.001 £ 1,678,912 0.2%
Outer Hebrides 2 0.001 £ 1,678,912 0.2%Table 17: Regional spend including fuel (excluding accommodation and foreign travel)
Sector Total expenditure Note
Surfing £1.8bn Includes fuel and foreign travel
Cycling £2.9bn (Grous, 2011) Includes £0.5bn on infrastructure
Domestic Tourism (UK) £99.8bn All domestic tourism
Value of Tourism to Cornwall £1.9bn (Visit Cornwall, 2012)
Camping and caravanning holidays (domestic) £0.159bn (Worthington, 2013)
UK leisure, superyacht and small commercial marine industry (total)
£2.855 bn (BMF, 2013) Includes manufacture of yachts and small leisure boats
UK leisure, superyacht and small commercial marine industry (excluding manufacture yachts and small leisure boats)
1.71bn (BMF, 2013)
Expenditure on admissions to visitor attractions in the UK
£0.816bn (Keynote, 2013) “Data provided by the national tourist boards, … calculated by multiplying the average admission fees by the number of paid-for attractions in each country”
To provide some form of relative scale the following table compares surfing expenditure to some other popular sectors:
Table 18: Expenditure on comparable activities and sports
21
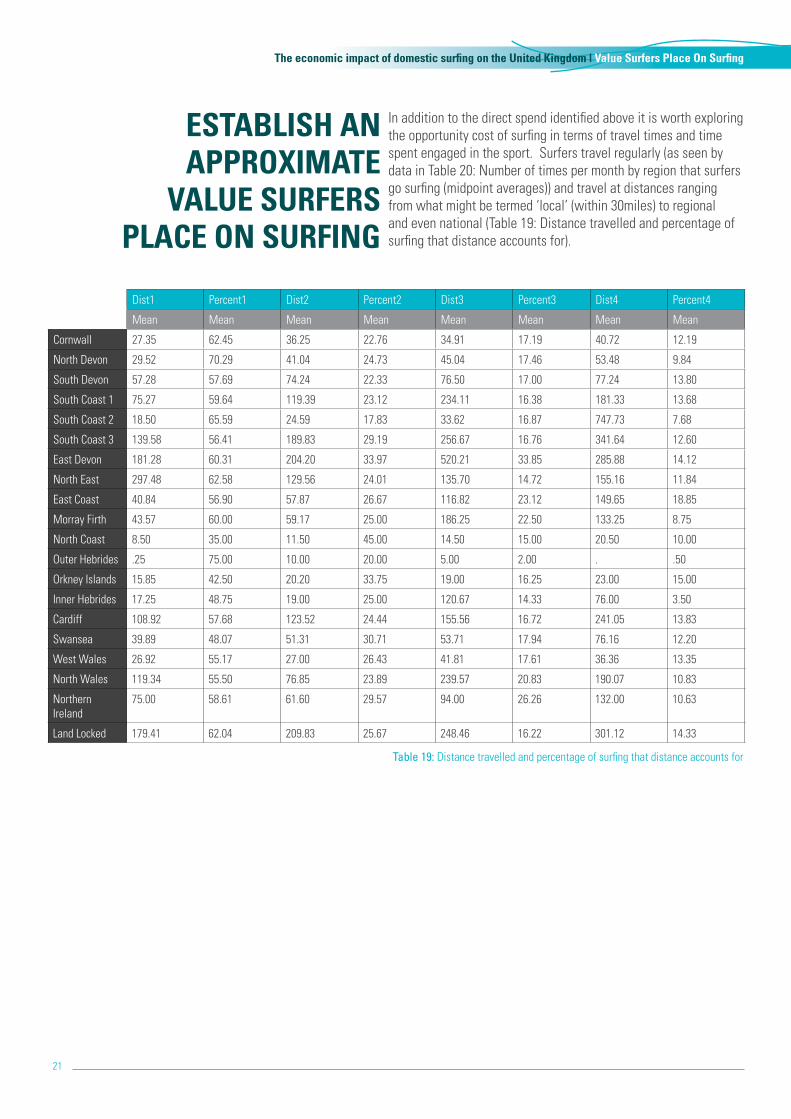
In addition to the direct spend identified above it is worth exploring the opportunity cost of surfing in terms of travel times and time spent engaged in the sport. Surfers travel regularly (as seen by data in Table 20: Number of times per month by region that surfers go surfing (midpoint averages)) and travel at distances ranging from what might be termed ‘local’ (within 30miles) to regional and even national (Table 19: Distance travelled and percentage of surfing that distance accounts for).
The economic impact of domestic surfing on the United Kingdom | Value Surfers Place On Surfing
ESTABLISH AN APPROXIMATE
VALUE SURFERS PLACE ON SURFING
Dist1 Percent1 Dist2 Percent2 Dist3 Percent3 Dist4 Percent4
Mean Mean Mean Mean Mean Mean Mean Mean
Cornwall 27.35 62.45 36.25 22.76 34.91 17.19 40.72 12.19
North Devon 29.52 70.29 41.04 24.73 45.04 17.46 53.48 9.84
South Devon 57.28 57.69 74.24 22.33 76.50 17.00 77.24 13.80
South Coast 1 75.27 59.64 119.39 23.12 234.11 16.38 181.33 13.68
South Coast 2 18.50 65.59 24.59 17.83 33.62 16.87 747.73 7.68
South Coast 3 139.58 56.41 189.83 29.19 256.67 16.76 341.64 12.60
East Devon 181.28 60.31 204.20 33.97 520.21 33.85 285.88 14.12
North East 297.48 62.58 129.56 24.01 135.70 14.72 155.16 11.84
East Coast 40.84 56.90 57.87 26.67 116.82 23.12 149.65 18.85
Morray Firth 43.57 60.00 59.17 25.00 186.25 22.50 133.25 8.75
North Coast 8.50 35.00 11.50 45.00 14.50 15.00 20.50 10.00
Outer Hebrides .25 75.00 10.00 20.00 5.00 2.00 . .50
Orkney Islands 15.85 42.50 20.20 33.75 19.00 16.25 23.00 15.00
Inner Hebrides 17.25 48.75 19.00 25.00 120.67 14.33 76.00 3.50
Cardiff 108.92 57.68 123.52 24.44 155.56 16.72 241.05 13.83
Swansea 39.89 48.07 51.31 30.71 53.71 17.94 76.16 12.20
West Wales 26.92 55.17 27.00 26.43 41.81 17.61 36.36 13.35
North Wales 119.34 55.50 76.85 23.89 239.57 20.83 190.07 10.83
Northern Ireland
75.00 58.61 61.60 29.57 94.00 26.26 132.00 10.63
Land Locked 179.41 62.04 209.83 25.67 248.46 16.22 301.12 14.33
Table 19: Distance travelled and percentage of surfing that distance accounts for

22
As can be seen in Table 16 surfers regularly travel considerable distances to reach ideal waves. Not surprisingly, given both location and travel networks and the fact that they enjoy consistent good to high quality surf, surfers in Scottish Islands travel less, as do surfers in North Devon and Cornwall.Referring back to Table 11: Cost of fuel (weighted average based on respondents four most popular breaks, distance and frequency at those breaks) it is apparent that surfers drive a wide range of miles depending on location. It is not the case that surfers who live in Cornwall and Devon drive fewer miles in total on average, as might be expected given their proximity to surf, as they also make a greater number of trips. On average nationally surfers drive 6,391 miles per year associated with surfing. Based on an average speed of 30mph this would suggest that surfers dedicate 213 hours to travelling to surf breaks.
The economic impact of domestic surfing on the United Kingdom | Value Surfers Place On Surfing
January Feb March April May June July August Sept October Nov Dec Total
Blank 278 5.00 5.00 5.00 5.00 12.00 12.00 12.00 12.00 12.00 12.00 5.00 5.00 102.00
Cornwall 329 5.00 5.00 12.00 12.00 12.00 12.00 17.00 17.00 17.00 12.00 12.00 5.00 138.00
North Devon
90 5.00 5.00 5.00 12.00 12.00 12.00 12.00 12.00 12.00 12.00 12.00 12.00 123.00
South Devon
109 5.00 5.00 5.00 5.00 5.00 12.00 12.00 12.00 12.00 12.00 5.00 5.00 95.00
South Coast 1
150 5.00 5.00 5.00 5.00 5.00 5.00 5.00 12.00 12.00 12.00 5.00 5.00 81.00
South Coast 2
28 5.00 5.00 12.00 12.00 12.00 12.00 17.00 12.00 17.00 12.00 12.00 5.00 133.00
South Coast 3
292 2.00 2.00 5.00 5.00 5.00 5.00 5.00 5.00 5.00 5.00 5.00 2.00 51.00
East Devon
220 2.00 2.00 2.00 2.00 5.00 5.00 5.00 5.00 5.00 5.00 2.00 2.00 42.00
North East 123 5.00 5.00 5.00 5.00 5.00 5.00 5.00 5.00 12.00 12.00 5.00 5.00 74.00
East Coast 81 5.00 5.00 5.00 5.00 5.00 5.00 5.00 5.00 12.00 12.00 5.00 5.00 74.00
Morray Firth
8 5.00 5.00 12.00 5.00 5.00 5.00 5.00 5.00 12.00 12.00 12.00 5.00 88.00
North Coast
2 17.00 17.00 12.00 12.00 5.00 2.00 2.00 5.00 12.00 12.00 17.00 17.00 130.00
Outer Hebrides
2 2.00 5.00 5.00 5.00 2.00 5.00 5.00 12.00 12.00 5.00 5.00 5.00 68.00
Orkney Islands
5 12.00 17.00 17.00 12.00 12.00 12.00 5.00 12.00 17.00 17.00 22.00 12.00 167.00
Inner Hebrides
5 5.00 17.00 17.00 12.00 17.00 17.00 17.00 17.00 17.00 2.00 17.00 12.00 167.00
Cardiff 149 2.00 2.00 5.00 5.00 5.00 5.00 12.00 12.00 12.00 5.00 5.00 5.00 75.00
Swansea 46 5.00 5.00 5.00 12.00 12.00 12.00 12.00 12.00 12.00 12.00 5.00 5.00 109.00
West Wales
31 5.00 5.00 12.00 12.00 12.00 12.00 12.00 12.00 17.00 12.00 12.00 5.00 128.00
North Wales
17 5.00 3.31 17.00 12.00 5.00 5.00 12.00 12.00 17.00 12.00 12.00 12.00 124.31
Northern Ireland
18 5.00 2.83 5.00 5.00 5.00 5.00 5.00 12.00 12.00 12.00 5.00 5.00 78.83
Land Locked
176 2.00 2.11 2.00 2.00 5.00 5.00 5.00 12.00 12.00 5.00 2.00 2.00 56.11
Average 5.19 5.96 8.10 7.71 7.76 8.10 8.90 10.48 12.76 10.10 8.67 6.48 100.20
Table 20: Number of times per month by region that surfers go surfing (midpoint averages)

23
Whilst the two figures above follow similar patterns it is worth noting that with regards to tourism trips the difference between January and August is a factor of approximately seven whilst with surfing the difference is only a factor of two. This echoes work done by the BMF et al (2009) which showed that only 41.5% of surfing actually takes place during summer. From this we can conclude that although surfing is seasonal the seasonal effect is less pronounced than with tourism trips allowing the sport to add more constructively to the sustainability of coastal areas than is the case with general tourism related trips. In other words a coastal resort may find it enjoys spend from the surfing community more consistently throughout the year than is found from relying on non-surfing day visitors. Given the location of surfers shown in Figure 2: Geographical distribution of respondents, it is also apparent that these surfers are not necessarily resident in the coastal resort.
The economic impact of domestic surfing on the United Kingdom | Value Surfers Place On Surfing
Figure 3: Average times surfing per month
Figure 4: Seasonality of tourism trips (Visit Cornwall, 2012)
With new wetsuit technology surfers will use the sea comfortably all year round, even in the far north of the UK.
Credit: Lewis Arnold
14.00
12.00
10.00
8.00
6.00
4.00
2.00
0.00January February March April May June July August September October November December
Average times surfing per month (UK)
January February March April May June July August September October November December
Seasonality - trips
90.2
11.6
101.8
UK trips (000’s)
OS trips (000’s)
Total trips (000’s)
140.3
17.0
157.3
1480.4
16.4
196.8
441.1
29.8
470.9
441.1
29.8
470.9
601.4
29.9
631.3
661.6
41.3
702.9
731.7
42.5
774.2
491.2
29.7
520.9
210.5
23.3
233.8
160.4
14.7
175.1
130.3
18.3
148.6

24
It has been possible to collect a reasonably comprehensive sample of what is considered to be a hard to reach group and draw some meaningful conclusions. The survey generated a total of 2,159 useable responses and although the majority of surfers are based in and around the areas most commonly associated with surfing
(Cornwall and Devon) 11 surfing regions have been shown to have surfer populations in excess of 10,000. The spread of surfers throughout the UK may surprise the lay reader and this has implications for policy makers nationally and regionally. In addition the image of the ‘beach bum’ often portrayed in the media is frustrated by the collection of evidence that suggests that surfers have on average higher levels of educational attainment than the wider population and are disproportionately represented in professional, managerial and business owning classes.
With regards to expenditure, the central theme of this study, it can be estimated that surfers spend an annualised average of £495.21 on surfboards, wetsuits, accessories and clothes, £222.86 on car parking, £708.45 on refreshments in local cafes and bars, £587.30 on local convenience stores and £966.27 on fuel. In addition an average of £169 is spent on UK accommodation and £474 is spent on foreign travel. This reflects the fact that not all surfers travel abroad. Those that do spend averages in excess of £1,000. The total spend per year on surfing and surf related activities can be estimated as £2,013.82 excluding fuel and accommodation/foreign travel, £2,980.09 including fuel and up to £3624.77 including all categories. Given that there are 500,000 surfers in the UK this equates to a direct contribution to economic activity of between £1billion and £1.8billion per year spread between the regions and countries of the UK. When indirect and induced effects are taken into account these amounts increase to £3.96bn and £4.95bn respectively.
It is also evident that surfing is not a summer only activity and the use of coastal resorts and facilities extends well into the winter months. In addition the variation in numbers participating between seasons is not as pronounced as is encountered within general visitors and day trips.
Policy issues:
1. Given that the size and spread of the surfing community is larger than is commonly believed it is evident that policy makers should consider the impact of both existing policy and new coastal proposals on the surfing community and coastal economy. This issue is not just of relevance to the far south west
2. Surfing generates a considerable income for the UK economy and the impact of all new policy likely to impact should be considered regardless of location
3. Even in geographic regions where there are no coastal policy makers, there is likely to be constituents that have a vested interest in the maintenance of healthy coastal regions
4. Given the size and distribution of the UK surfing population, and the revenue generated by the sport, estimates of the natural capital value associated with the coast across the UK should be revised
11 surfing regions have been shown to have surfer populations in
excess of 10,000
The economic impact of domestic surfing on the United Kingdom | Conclusion, Policy Issues
CONCLUSION, POLICY ISSUES
Given that there are 500,000 surfers in the UK
this equates to a direct contribution to economic
activity of between £1billion and £1.8billion
per year spread between the regions and countries
of the UK

25
The study is not without its limitations. Key amongst these are:
1. The original database of contacts was derived from SAS’s own database of mailing lists (50,000+), Facebook page members (44,000+), twitter accounts (9,000 +) and membership (7,000 +)
2. The study appears to slightly over represent Cornwall. This is possibly due to the stratification of the original databases used
3. Respondents have self-completed the survey and no third party confirmation of their spend or behaviour has been possible
4. Under 18s are probably underrepresented. This is possibly due to the stratification of the original databases used and to a survey that may appear, in their eyes, is aimed more towards adults (with questions relating to employment etc.)
5. The study has not examined in detail indirect and induced effects, relying instead on multipliers
Areas for additional research could include:
1. Additional field based studies to test the reliability of the data with regards to actual expenditure.
2. Additional field based studies to test the reliability of the data with regards to actual numbers of surfers frequenting breaks
3. Expansion of the survey to included better representation from under 18 year olds
4. Establishment through addition economic analysis of reliable multipliers associated with surfing and the surfing industry
The economic impact of domestic surfing on the United Kingdom | Limitations and Further Research
LIMITATIONS AND AREAS
FOR FURTHER RESEARCH
11 surfing regions have been shown to have surfer populations in excess of 10,000
Given that there are 500,000 surfers in the UK this equates to a direct contribution to economic activity of between £1billion and £1.8billion per year spread between the regions and countries of the UK
25
Credit: Alex Callister

26
Thank you for taking the time to complete this questionnaire. The purpose of the questionnaire is to allow SAS to better understand surfers’ direct and indirect spend on their sport. Your personal details will not be stored and the questionnaire is anonymous. Responses may be published but only in aggregate to show general patterns and trends.
The economic impact of domestic surfing on the United Kingdom | Appendix 1
APPENDIX 1: QUESTIONNAIRE
YOU AND YOUR SURFING:
1. Type of surfing most commonly engaged in:a. Short board (standing)b. Long board (standing)c. Bodyboardd. Standup Paddle board (SUP)e. Windsurff. Kite Surfg. Bodysurfh. Surf Kayaki. Bellyboard or Surf Mat
2. Secondary type of surfing engaged in:a. Short board (standing)b. Long board (standing)c. Bodyboardd. Standup Paddle board (SUP)e. Windsurff. Kite surfg. Only do one style
3. Of the 100% of time you spend surfing, what percentage of time is spent practicing your most common board discipline ?
4. And what is percentage of the time you spend surfing on your secondary surfing discipline?
5. What is your age?
6. What is the postcode at which you normally live?
7. What’s the highest level of education completed? (based on Office of National Statistics descriptions):
a. No qualifications: No formal qualifications.b. Level 1: 1-4 GCSEs or equivalent qualifications.c. Level 2: 5 GCSEs or equivalent qualifications.d. Apprenticeships.e. Level 3: 2 or more A-levels or equivalent
qualifications.f. Level 4 or above: Bachelors degree or equivalent, and
higher qualifications.
8. The following questions use the Office of National Statistics NS-SEC: self-coded method to classify occupations
‘Do (did) you work as an employee or are (were) you self-employed?’ a. Employee b. Self-employed with employees c. Self-employed/freelance without employees
9. ‘How many employees currently work at the location where you work (worked)?’
a. 1 to 24 b. 25 or more
10. For self-employed: ‘How many people do (did) you employ?’ a. 1 to 24 b. 25 or more
11. ‘Do (did) you supervise any other employees?’ (A supervisor or foreman is responsible for overseeing the work of other employees on a day-to-day basis)
a. Yes b. No
12. Select one option to show which best describes the sort of work you do. If you are not working now tick a box to show what they did in your last job.
a. Modern professional occupations such as: teacher – nurse – physiotherapist – social worker – welfare officer – artist– musician – police officer (sergeant or above) – software designer
b. Clerical and intermediate occupations such as: secretary – personal assistant – clerical worker – office clerk – call centre agent – nursing auxiliary – nursery nurse
c. Senior managers or administrators (usually responsible for planning, organising and co-ordinating work, and for finance) such as: finance manager – chief executive
d. Technical and craft occupations such as: motor mechanic – fitter – inspector – plumber – printer – tool maker – electrician – gardener – train driver
e. Semi-routine manual and service occupations such as: postal worker – machine operative – security guard – caretaker – farm worker – catering assistant – receptionist – sales assistant
f. Routine manual and service occupations such as: HGV driver – van driver – cleaner – porter – packer – sewing machinist – messenger – labourer – waiter/waitress – bar staff
g. Middle or junior managers such as: office manager – retail manager – bank manager – restaurant manager – warehouse manager – publican
h. Traditional professional occupations such as: accountant – solicitor – medical practitioner – scientist – civil/mechanical engineer

27
The economic impact of domestic surfing on the United Kingdom | Appendix 1
LOCATIONS AND FAVOURITE SPOTS:
13. How many times do you go surfing in January?
14. How many times do you go surfing in February?
15. How many times do you go surfing in March?
16. How many times do you go surfing in April?
17. How many times do you go surfing in May?
18. How many times do you go surfing in June?
19. How many times do you go surfing in July?
20. How many times do you go surfing in August?
21. How many times do you go surfing in September?
22. How many times do you go surfing in October?
23. How many times do you go surfing in November?
24. How many times do you go surfing in December? 25. This question comes in 2 parts; Firstly, what are the total distances you travel to surf the four
beaches you most regularly surf? For each beach please estimate the total distance to the beach
and back home. And also list these 4 separate distances to each beach, not one total distance.
Secondly, what % of your surfing time is spent at each beach? An example answer might be: Porthtowan: 5 miles & 50%.
Fistral: 7 miles & 20% Watergate Bay: 12 miles & 20% Perranporth: 5 miles & 10%
26. How do you travel to your regular surf break:a. Walk/cycleb. Public transportc. Drive on ownd. Shared car
YOUR SURFING EXPENSES:
27. How much do you spend on car parking, per visit, at your regular breaks?
28. At your regular breaks how much on average do you spend each visit on refreshment in local cafes/bars?
29. At your regular breaks how much on average do you spend each visit on refreshment in the local shop(s)?
30. How much do you spend a year on hotels and accommodation to go surfing in the UK.?
31. How much do spend on foreign surfing trips per year?
32. How often do you replace or buy a wetsuit?a. Twice yearlyb. Yearlyc. Every two yearsd. Longer
33. What is your approximate spend, per wetsuit, on those/that wetsuit?
34. Where do you buy your wetsuits from?a. locally (within 10miles), b. within same county, c. within UK (visit), d. over internet (UK), e. over internet (international)
35. How often do you replace or buy a board?a. Twice yearlyb. Yearlyc. Every two yearsd. Longer
36. Do you buy your surfboard from?a. locally (within 10miles), b. within same county, c. within UK (visit), d. over internet (UK), e. over internet (international)

28
The economic impact of domestic surfing on the United
37. What is your approximate spend, per board, on those/that surfboard?
38. Approximately how much per year do you spend on surf related clothing?
39. Where do you buy your surf related clothes? a. locally (within 10miles), b. within same county, c. within UK (visit), d. over internet (UK), e. over internet (international)
40. Approximately how much per year do you spend on surfing accessories? (wax, deck pad, board bag, leash, fins, roof racks & straps, wax comb etc.)
41. Where do you buy your surfing accessories? a. locally (within 10miles), b. within same county, c. within UK (visit), d. over internet (UK), e. over internet (international)
42. Approximately how much per year do you spend on surfing materials? (surf mags, DVDs, books, stickers, posters etc)
43. Where do you buy your surfing materials? a. locally (within 10miles), b. within same county, c. within UK (visit), d. over internet (UK), e. over internet (international)
28

29
Abell, L & Mallett, S. (2008) The Economic Value of Surfing in Northern Devon, TRISURF, Devon
Armstrong, H. & Taylor, J. (2000) Regional Economics and Policy, 3rd ed., Harvester Wheatsheaf, Hertfordshire
Arup, (2001) Assessment of the potential contribution of marinas and watersports to increasing prosperity in Cornwall. Ove Arup and Partners, Bristol, UK
Barbieri, C. & Sotomayor, S. (2012) Surf travel behavior and destination preferences: An application of the Serious Leisure Inventory and Measure, Tourism Management, 35, 111-121
Bishop, P. & Wiseman, N. (1999) The North-South Divide in the UK Defence Sector, Regional Studies, Vol. 33, No. 9, pp. 829-843
BMF, MCA, RYA and Lifeboats (2012) Water sports and Leisure Participation Survey 2012, www.britishmarine.co.uk/pdf/WatersportsParticipationSurvey2012-ExecutiveSummary.pdf, 8/10/2013
BMF, MCA, RYA and Lifeboats (2009) Water sports and Leisure Participation Survey 2009. www.britishmarine.co.uk/upload_pub/WatersportsandLeisureOmnibus2009finalpublic.pdf
BMF (2013) Be in the know – how is your industry performing?, BMF Publications, www.britishmarine.co.uk/news__press/news_article.aspx?ArticleId=3029, 8/10/2013
Buckley, R. (2002a). Surf tourism and sustainable development in Indo Pacific Island - the industry and the islands. Journal of Sustainable Tourism, 10(5), 405e424.
Canniford, R. & Karababa, E. (2012) Partly primitive: discursive constructions of the domestic surfer, Consumption Markets & Culture, Vol. 16, No. 2, 119–144
Carlos, S. & Jose, C. (2012) An analysis of visitors’ expenditures in a tourist destination: OLS, quantile regression and instrumental variable estimators. Tourism Economics, Jun, Vol. 18 Issue 3, p555-576
Coffman, M. & Burnett, K. (2009) An Analysis of the Mavericks Region andAn Analysis of the Mavericks Wave from an Ecotourism Perspective, www.savethewaves.org/sites/default/files/Mavericks_Wave_Valuation_Report_0.pdf, 1/9/2013
DEFRA (2007) Charting Progress: Leisure and Recreatioin, www.chartingprogress.defra.gov.uk/feeder/Scetion_3.6_Leisure_and_Recreation.pdf, 8/10/2013
Dolnicar, S., & Fluker, M. (2003) Who’s riding the wave? An investigation into demographic and psychographic characteristics of surf tourists. In Proceedings of the 13th international research conference of the Council for Australian University Tourism and Hospitality Education (CAUTHE).
Errington, A. (1985) Sampling Frames for Farm Surveys in the UK: Some Alternatives, Journal of Agricultural Economics, Vol. 36, No. 2, pp 251-258
Frank, M., Zhou, S., Bezerra, P., & Crowley, Z. (2009). Effects of long-term recreational surfing on control of force and posture in older surfers: a preliminary investigation. Journal of Exercise, Science and Fitness, 7(1), 31e38.
GCSC (2011) Surf Industry Development Project, Gold Coast City Council, http://www.businessgc.com.au/GCSCI GIA (2011) Global Surfing Market to Reach $13.2 Billion by 2017, www.prweb.com/releases/surfing_surfboards/surfing_apparel/prweb8581431.htm, 9/10/2013
The economic impact of domestic surfing on the United Kingdom | References
REFERENCES
Credit: Andy Hughes

30
Grous, Alexander (2011)The British cycling economy: ‘gross cycling product’ report. Sky and British Cycling.
Hanemann, M., L. Pendleton, et al. (2004). Southern California Beach Valuation Project: 74.
Kvinta, P. (2013) Surfenomics 101, www.features.blogs.fortune.cnn.com/2013/06/05/surfonomics-101/
Keynotes (2013) Tourist Attractions Market Report 2013, Keynotes, www.keynote.co.uk/market-intelligence/view/product/10799/tourist-attractions/chapter/4/market-size, 8/10/2013
Leeworthy, V.R. and P.C. Wiley 2001. “Current Participation Patterns in Marine Recreation,” U.S. Department of Commerce, National Oceanic and Atmospheric Administration, National Ocean Service, Special Projects, 53 p.
Liston-Heyes, C. (1999) Stated vs. computed travel data: a note for TCM practitioners. Tourism Mgmt 20, 149–152.
Moutinho, L., Dionisio, P. & Leal, C. (2007) Surf tribal behaviour: a sports marketing application, Marketing Intelligence & Planning, Vol. 25, No. 7, pp. 668-690
Nelsen, C., L. Pendleton, et al. (2007). “A Socioeconomic Study of Surfers at Trestles Beach.” Shore & Beach 75(4): 32-37.
Oxford Economics (2008) The Economic Case for the Visitor Economy, Cited in: Beyrouty, K & Tessler, A. (2013) The Economic Impact of the UK Heritage Tourism Economy, Oxford Economics, www.hlf.org.uk/aboutus/howwework/Documents/EcoImpactHeritageTourism2013.pdf, 9/10/2013
Ponting, J. (2008). Consuming Nirvana: An exploration of surfing tourist space (Doctoral dissertation). University of Technology, Sydney.
Ramchandani, G. M. & Coleman, R. (2012) Testing the accuracy of event economic impact forecasts, International Journal of Event and Festival Management, Volume: 3 Issue: 2
Shaw, W. D. and P. Jakus (1996). “Travel Cost Models of Demand for Rock Climbing.” Agricultural and Resource Economics Review 25(2): 133-142.
Stebbins, R. (1982). Serious leisure: a conceptual statement. The Pacific Sociological Review, 25(2), 251e272.
Tantamjarik, P. (2004). Sustainability issues facing the Costa Rica surf tourism industry (Master’s thesis). University of Hawaii, HA.
Visit Cornwall, (2012) Value of Tourism 2011, The SouthWest Research Company, www.visitcornwall.com/sites/default/files/generic_files/Value%20of%20Tourism%20in%20Cornwall%202011%20by%20District.pdf, 7/10/2013
Worthington, J (2013) Camping and Caravanning - UK - April 2013, Mintel
WTTC (2013) Travel and Tourism Economic Impact 2013, World Travel and Tourism Council, www.wttc.org/research/economic-impact-research/, 12/7/2013
The economic impact of domestic surfing on the United Kingdom | References
Credit: Alex Callister

31
Surfers Against Sewage,Wheal Kitty Workshops,St. Agnes, Cornwall, TR5 0RD.
www.sas.org.uktel: 01872 553001email: [email protected]
Credit: Saltshots.com