
The Economic Crisis and the Policy Response William G. Gale Brookings Institution Presentation to...
53
1 The Economic Crisis and the Policy Response William G. Gale Brookings Institution Presentation to Invest in Kids Working Group March 16, 2009
-
Upload
carmel-cummings -
Category
Documents
-
view
215 -
download
1
Transcript of The Economic Crisis and the Policy Response William G. Gale Brookings Institution Presentation to...

1
The Economic Crisis and the Policy Response
William G. GaleBrookings Institution
Presentation to Invest in Kids Working GroupMarch 16, 2009

2
Introduction
• “Our economy is badly weakened, a consequence of greed and irresponsibility on the part of some, but also our collective failure to make hard choices and prepare the nation for a new age.” – Barack Obama, January 20, 2009
• The current economic crisis has created almost an “anything goes” mentality with respect to the size and structure of federal policy interventions.

3
Outline
• Interlocking Problems and Proposed Solutions– The Economy – The Housing Sector – The Financial Sector – The Budget
• Where we go from here?

4
Quick Summary
• The belief that housing prices would rise forever led to risky behavior.
• The collapse in housing prices created problems for the financial sector and revealed additional problems.
• The collapse in housing and finance led the economy down. • The budget, already in bad shape, was hurt by the downturn
and the stimulus, and faces medium- and long-term problems. • Proposals to address the economy, housing, finance, and the
budget are intertwined and aggressive, but may not work. • Getting out of the recession won’t be enough – medium-term
and long-term challenges are significant.

5
The Economy

6
The Current Situation
• An economic “vicious circle” that is broad, rapid and deep: – Declines in consumer spending and confidence (all-time
low), due to uncertainty about jobs.
– Declines in business investment and hiring (>3 million job losses since September), due to uncertainty about spending.
– Declines in state and local government spending• Balanced budget rules create pro-cyclical spending
– Net exports not helping• “Flight to safety” raises the value of the dollar, hurts net exports
• Rest of the world in recession, too

7
The Goal
• Convert the “vicious circle” to a “virtuous cycle.” • Instill confidence. • Boost aggregate demand
– Consumer spending
– Business hiring and investment
– Federal, state, and local government purchases
• Stabilize or raise prices– Avoid debt/deflation spiral
• Include global dimension–Largely overlooked in US
8
Policy Options
• We don't really know what will work or how much is needed. – No good examples of nations pulling themselves
out rapidly.– We can (maybe) avoid the mistakes of the 1930s
and of Japan in the 1990s, but is that enough?
• So, some humility is in order – Be wary of solutions from models that did not
predict the problem.– We will make new mistakes.

9
Policy Options
• There are no ideal options.– Any policy will help some who “don’t deserve it”
and hence will create inequities and moral hazard.
• Summers: The risks associated with under-responding are much bigger than the risks associated with over-responding.
10
The Stimulus Package
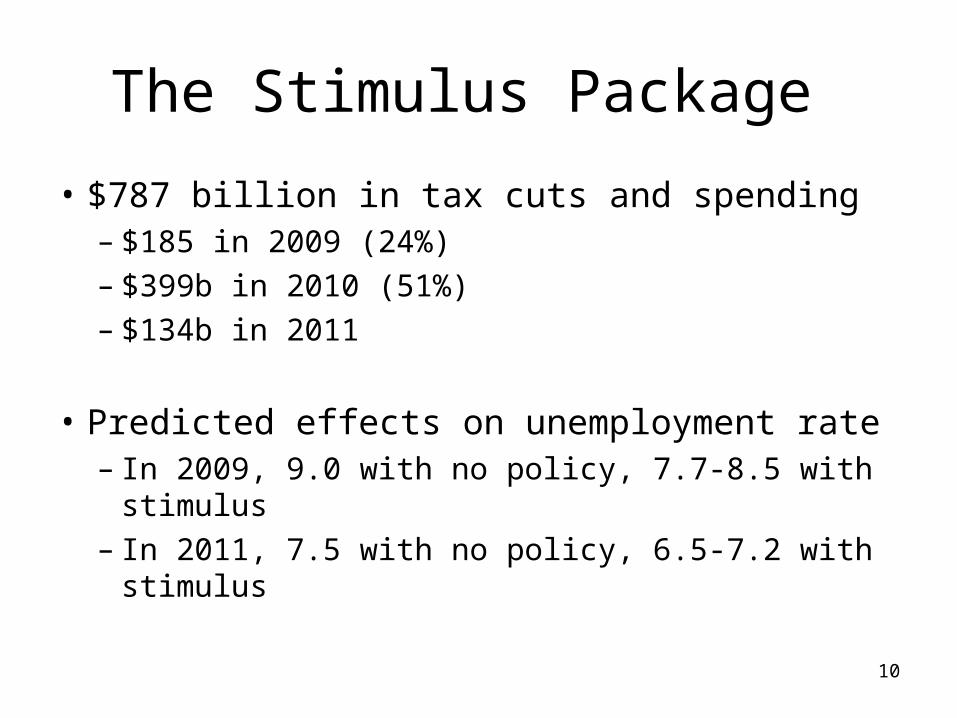
• $787 billion in tax cuts and spending – $185 in 2009 (24%)– $399b in 2010 (51%) – $134b in 2011
• Predicted effects on unemployment rate– In 2009, 9.0 with no policy, 7.7-8.5 with stimulus– In 2011, 7.5 with no policy, 6.5-7.2 with stimulus

11
The Stimulus Package
• Investment – Transportation and infrastructure ($117b)– Energy ($61b)– Education ($48b)– Health care ($38b) – Health IT, NIH– Science and Technology ($13b)
• Aid – To State/Local governments (Medicaid) ($153b) – To Individuals (UI, Food stamps, COBRA, etc.) ($99b)
• Tax Relief – For Individuals ($247b)– Tax incentives for business ($10b)

12
The Stimulus Package
• The best spending options give big “bang for the buck,” but take time to implement– Infrastructure
– State and local government assistance
– UI and Food stamps can be implemented sooner
• Tax cuts often can take effect sooner, but seem more likely to be saved in the current environment – That will help households and businesses shore up their
balance sheets (a little), but won’t be as stimulative.

13
Assessing the Stimulus
• A big, diversified, somewhat sustained stimulus was the right response, but…– We need the stimulus from the housing and
financial packages, too. – Economic activity now is worse than expected
even quite recently. – We may need an additional stimulus, or a longer
stimulus – expect many provisions to be continued after 2 years.

14
The Housing Market

15
Current Situation
• As housing prices rose inexorably for decades, – Leverage ratios rose– Lending standards fell (especially in 2005 and 2006)– Loans were securitized (starting in the 2000s)
• Since peaking in 2006, national housing prices have fallen 26%.– Even larger declines in certain areas – CA, FL, AZ, NV– Foreclosures jumped – Now 14 million homeowners are underwater – owe more
on their mortgage than the value of their house.
16
Defaults
• What causes defaults?– House value < mortgage balance (e.g., drop in house price)
– Household income falls (e. g., with job loss)
– Mortgage payments jump (e.g., with ARMs)
• Defaults and foreclosures destroy economic value (and hence create more defaults and foreclosures)– Transaction costs of foreclosures
– Reduced value of foreclosed houses and neighborhoods
– Reduced property taxes and increased crime
17
Defaults
• Why not just write down loan value?
• Securitized loans are hard to restructure– Too many parties involved – a group of investors
holds a group of mortgages– Exacerbated by complex structures – groups of
investors actually hold parts of a group of mortgages
– No one has clear, legal authority to negotiate

18
Housing Package
• Homeowners who are current on payments and have loans between 80% and 105% of house value, held by Fannie or Freddie will be eligible to refinance at favorable terms.
• Homeowners who are behind or struggling on payments, or are underwater, will be eligible for monthly payment reductions, shared by lenders and the government.
19
Housing Package
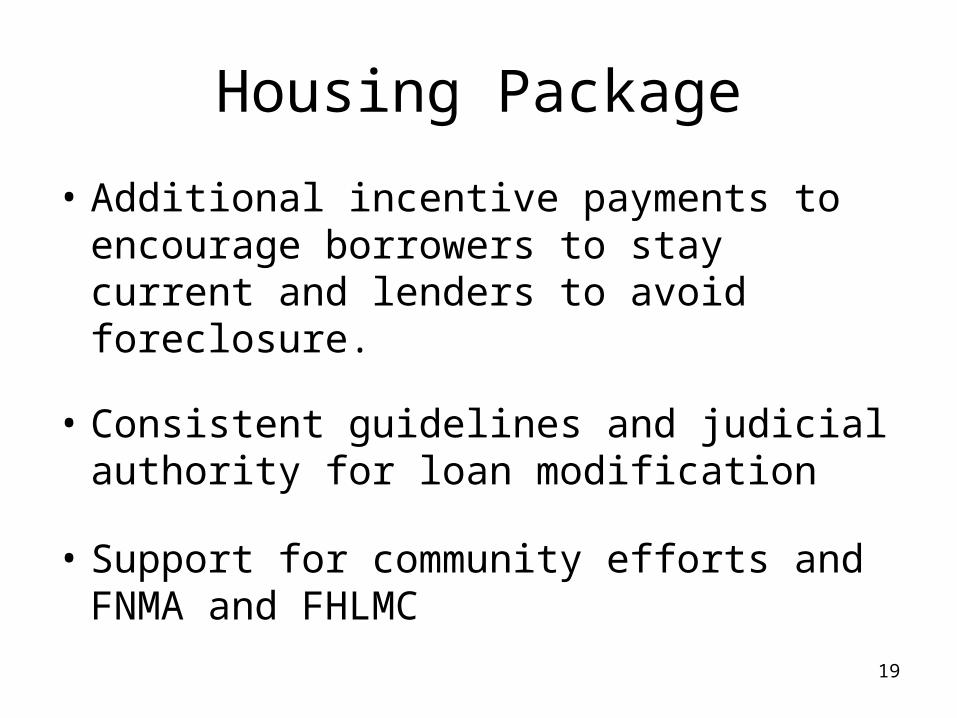
• Additional incentive payments to encourage borrowers to stay current and lenders to avoid foreclosure.
• Consistent guidelines and judicial authority for loan modification
• Support for community efforts and FNMA and FHLMC

20
Will It Work?
• The plan doesn’t help people who are underwater get above water (it just reduces their payments). People will still have incentives to walk away if conditions get worse.
• Conditions will get worse:– House prices are projected to decline 14% further in 2009
(even after recent record declines)– Unemployment will rise further – a lagging indicator– Negative equity loans, about to be reset in 2009 and 2010,
will boost required payments for many borrowers (especially in CA).

21
The Financial Sector
22
A Perfect Storm?
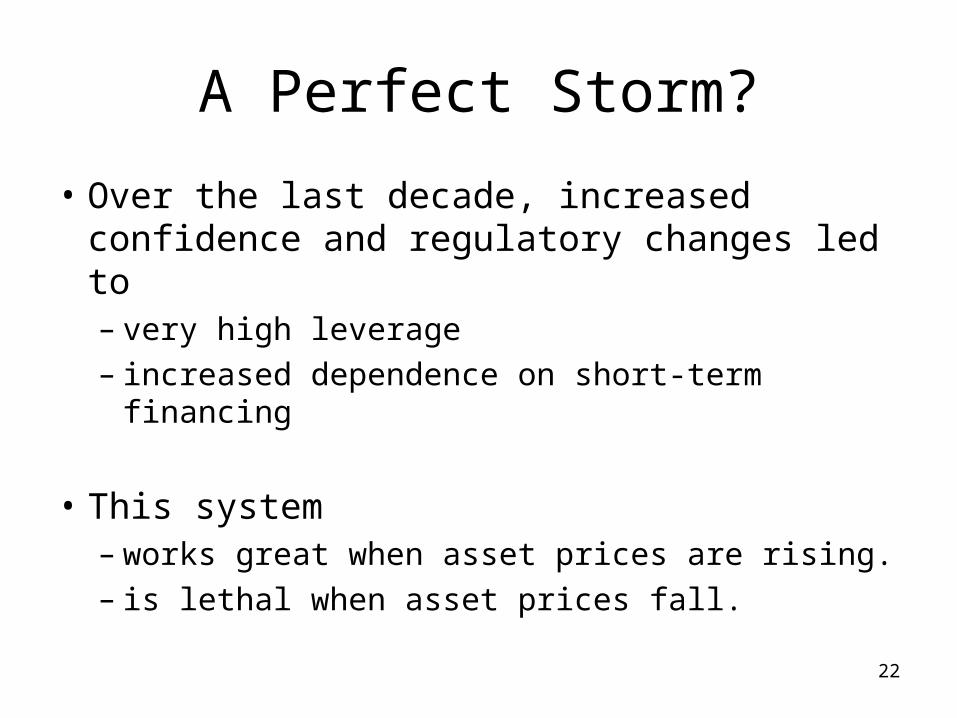
• Over the last decade, increased confidence and regulatory changes led to – very high leverage – increased dependence on short-term financing
• This system– works great when asset prices are rising. – is lethal when asset prices fall.

23
A Perfect Storm?
• Example: – For a firm with 30:1 leverage, a 2% drop in assets causes a
60% fall in equity.
– This makes it harder to borrow (firm has less collateral)
– But the firm needs short-term financing, so to get cash it has to liquidate illiquid assets and take a loss (especially if all firms are trying to sell assets at the same time).
– This furthers the decline in equity, and repeats the cycle...
• Note: a 4% drop in assets makes the firm insolvent. • Now consider a 26% drop in housing values….

24
A Perfect Storm?
• Rising housing prices also hid a series of other problems that emerged after the collapse– Inability to rate complex financial instruments– Poor underwriting, risk management, and corporate governance
• Financial markets have crashed– Equity markets have declined by 50%.– Many credit markets are effectively frozen.
• Without government intervention and the prospect of future intervention, many major firms would have gone under – Domino effects would have been even more widespread.

25
Financial Stability Plan
• Stress tests for major lending institutions– Banks who fail will need to raise private or public capital – Intended to assure the strength of the financial sector but
may have the opposite effect if it reveals large shortfalls and requires massive government intervention.
• Public-private investment fund for “legacy” assets (formerly known as toxic assets)– Similar to TARP, but avoids making the gov’t place a
value on toxic assets.– Not clear if this will work.
26
Financial Stability Plan
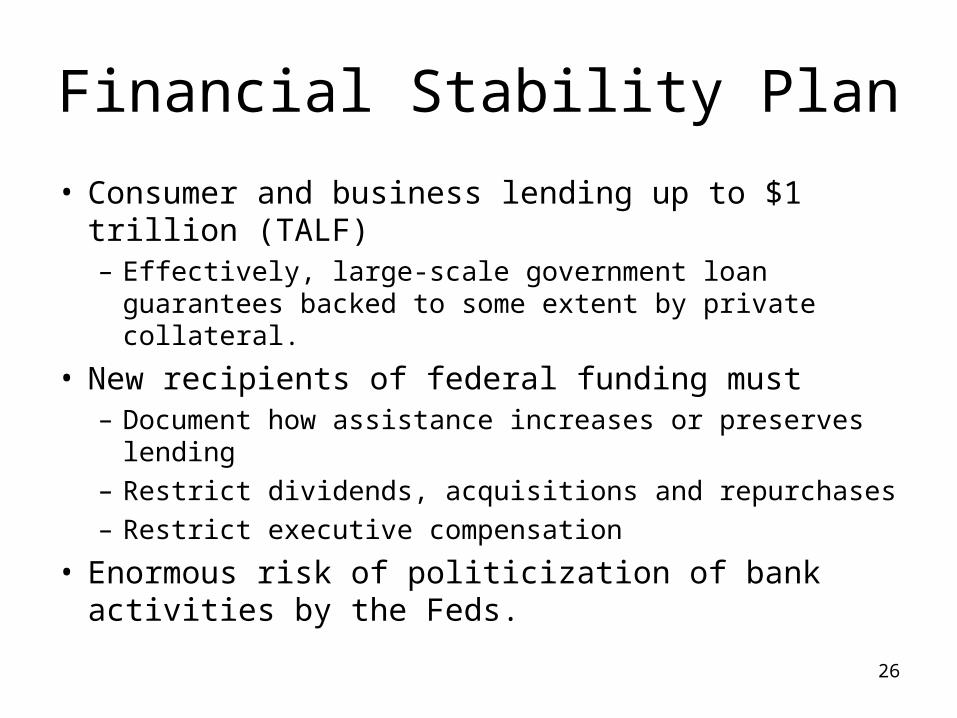
• Consumer and business lending up to $1 trillion (TALF)– Effectively, large-scale government loan guarantees backed
to some extent by private collateral.
• New recipients of federal funding must– Document how assistance increases or preserves lending
– Restrict dividends, acquisitions and repurchases
– Restrict executive compensation
• Enormous risk of politicization of bank activities by the Feds.

27
What about nationalization?
• There is a continuum of actions that qualify as “nationalization”
• It would be quite difficult to literally take over the banks – Citigroup is 50 times the size of Continental Illinois.
• Any solution is going to involve some restructuring of banks – Good bank/Bad banks
• RTC is not a good example– RTC just disposed of the asset of defunct institutions.– Completely different from managing a failing institution.

28
Long-term financial market reforms
• What is the right size and structure of the financial sector? – Massive expansion in the 2000s– Virtues of many small firms versus fewer, “too big
to fail” entities
• Enhanced regulation of systematically important institutions– Fund some portion of their assets with long-term
subordinated debt

29
Long-term financial market reforms
• Encourage formation of clearinghouses and regulation for derivatives contracts– Start with credit default swaps
• Counter-cyclical capital standards– Requiring a higher capital cushion in “good
times,” lower ratios in bad times
• Reorganize financial regulatory agencies– Jurisdiction by function or objective (solvency,
consumer protection) rather than type of regulated financial institution
The Budget

31
The 2009 Budget
• CBO’s (January) baseline – Deficit of $1.2 trillion, 8.3% of GDP – With stimulus, deficit of $1.4 trillion, more than
9% of GDP– Spending – highest since WWII– Revenues – lowest since 1959– Deficit – highest since WWII– Public Debt – highest since 1956

32
How Did the Deficit Get So Big?
• In January 2001, CBO projected a baseline surplus for 2009 of $710 billion. How did that turn into a deficit of $1,186 trillion? – About 2/3 of difference is due to policy changes –
tax cuts and spending increases relative to the January 2001 baseline.
– About 1/3 due to forecasting errors

33
Unified Deficit or Surplus as a Share of GDP
-0.12
-0.1
-0.08
-0.06
-0.04
-0.02
0
0.02
0.04
0.06
2001 2002 2003 2004 2005 2006 2007 2008 2009
Surp
lus
or D
efic
it a
s a
Sha
re o
f G
DP
January 2001 Baseline Projections
Proj.
Economic and Technical Changes
Policy Changes
Actual

34
10-Year Budget Outlook
• The January CBO baseline– Deficits decline sharply through 2012, then
gradually through 2019.
• These results are based on a series of rules and accounting conventions that CBO uses that may not be very representative or realistic

35
Revenue Assumptions
• The baseline assumes that almost all tax provisions scheduled to expire do expire– 2001 and 2003 tax cuts– “Regular” expiring tax provisions– AMT patches, currently expired at end of 2008
• We extend all of these provisions in the adjusted baseline
36
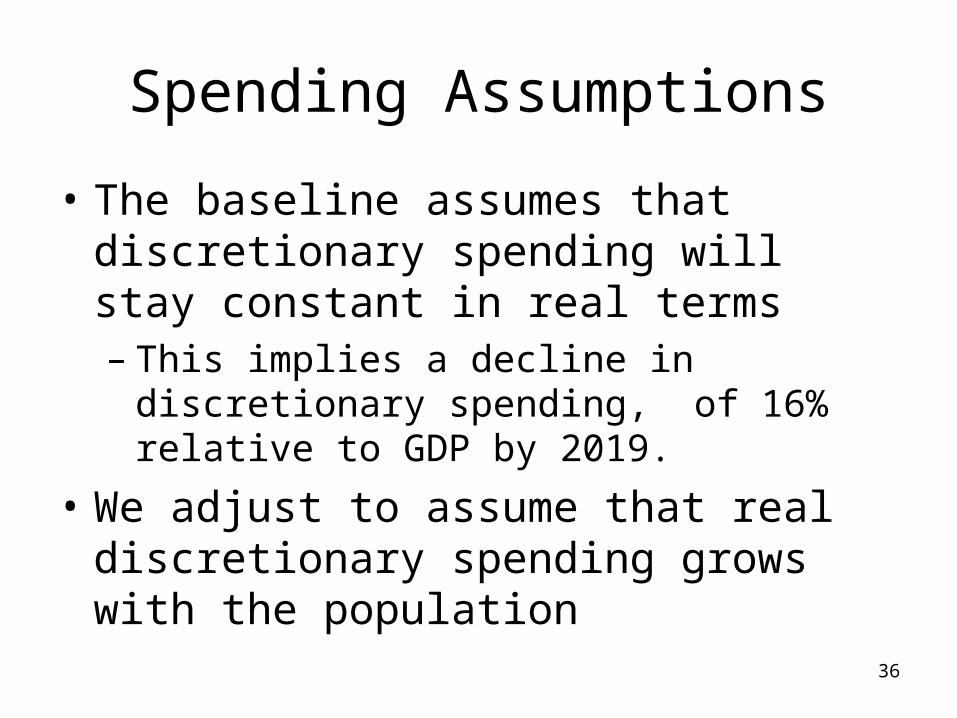
Spending Assumptions
• The baseline assumes that discretionary spending will stay constant in real terms – This implies a decline in discretionary spending,
of 16% relative to GDP by 2019.
• We adjust to assume that real discretionary spending grows with the population

37
Budget Deficits Under Various Scenarios Share of GDP, 2008-2019
-12
-10
-8
-6
-4
-2
0
2008 2009 2010 2011 2012 2013 2014 2015 2016 2017 2018 2019
Su
rplu
s or
Def
icit
(%
GD
P)
CBO (2009). Includes economic HR1 stimulus costs.
CBO Unified Baseline
Auerbach-Gale Adjusted Unified Baseline

38
The Adjusted Baseline
• The adjusted deficit falls through 2012, like the CBO baseline. But the adjusted deficit is 4.9% in 2012, not 1.6%.
• The adjusted deficit rises after 2012, reaching 6.1% of GDP in 2019– the CBO baseline deficit shrinks to 1.1% of GDP.

39
The Administration’s Budget
• Starts with expanded baseline similar to above, but with some differences in GDP and other factors.
• New spending – Health care– Energy
• Tax cuts – Families– Businesses

40
Paying for the Administration’s Budget
• Revenue raisers– Cap and Trade system – Eliminate Bush tax cuts for the top 2 percent– Restrict itemized deductions for the top 2 percent– Close loopholes—international, carried interest – No income tax hike for those with Y<250k.
• Spending cutbacks – Health care– Agriculture – Defense (relative to an inflated baseline)

41
Budget Deficits Under Various Scenarios Share of GDP, 2008-2019
-12
-10
-8
-6
-4
-2
0
2008 2009 2010 2011 2012 2013 2014 2015 2016 2017 2018 2019
Su
rplu
s or
Def
icit
(%
GD
P)
CBO (2009). Includes economic HR1 stimulus costs.
CBO Unified Baseline
Auerbach-Gale Adjusted Unified Baseline
Administration Adjusted Baseline

42
Budget Deficits Under Various Scenarios Share of GDP, 2008-2019
-13
-11
-9
-7
-5
-3
-1
1
2008 2009 2010 2011 2012 2013 2014 2015 2016 2017 2018 2019
Su
rplu
s or
Def
icit
(%
GD
P)
CBO (2009). Includes economic HR1 stimulus costs.
CBO Unified Baseline
Auerbach-Gale Adjusted Unified Baseline
Administration Adjusted Baseline
Administration Policy
43
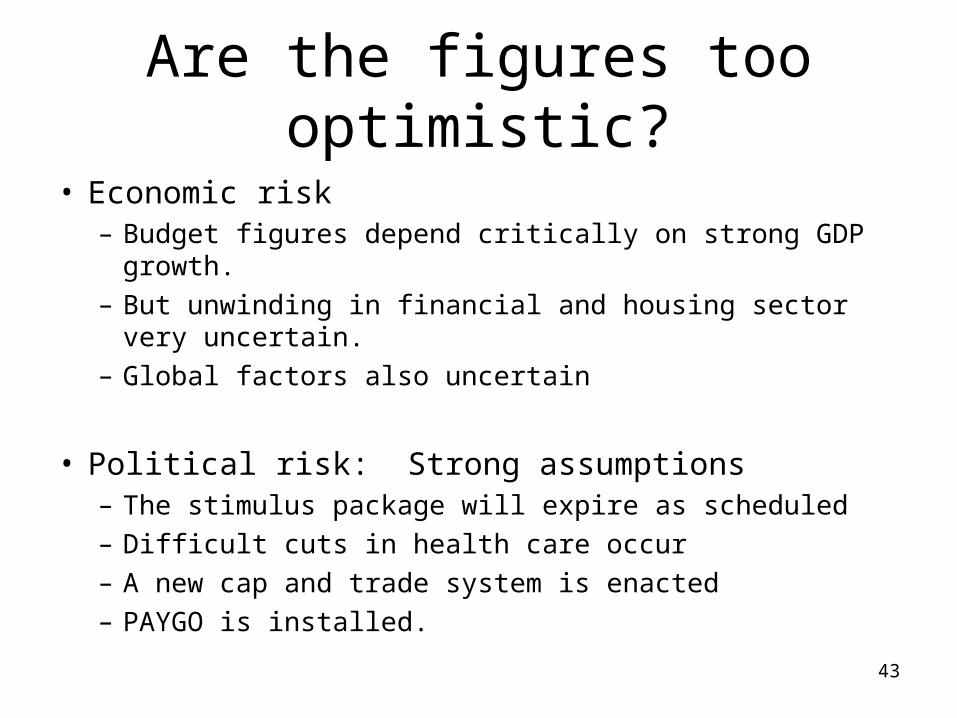
Are the figures too optimistic?
• Economic risk – Budget figures depend critically on strong GDP growth.
– But unwinding in financial and housing sector very uncertain.
– Global factors also uncertain
• Political risk: Strong assumptions – The stimulus package will expire as scheduled
– Difficult cuts in health care occur
– A new cap and trade system is enacted
– PAYGO is installed.

44
Implications for Funding Children’s Programs
• Consider the difference between (a) revenues and (b) spending on net interest, defense and the elderly portions of Social Security, Medicare, Medicaid and SSI.
• This difference is what is left to finance all other government activity (in the absence of federal borrowing), including children’s programs.
45
Implications for Funding Children’s Programs
• Consider the difference between (a) revenues and (b) spending on net interest, defense and the elderly portions of Social Security, Medicare, Medicaid and SSI.
• This difference is what is left to finance all other government activity (in the absence of federal borrowing), including children’s programs.
46
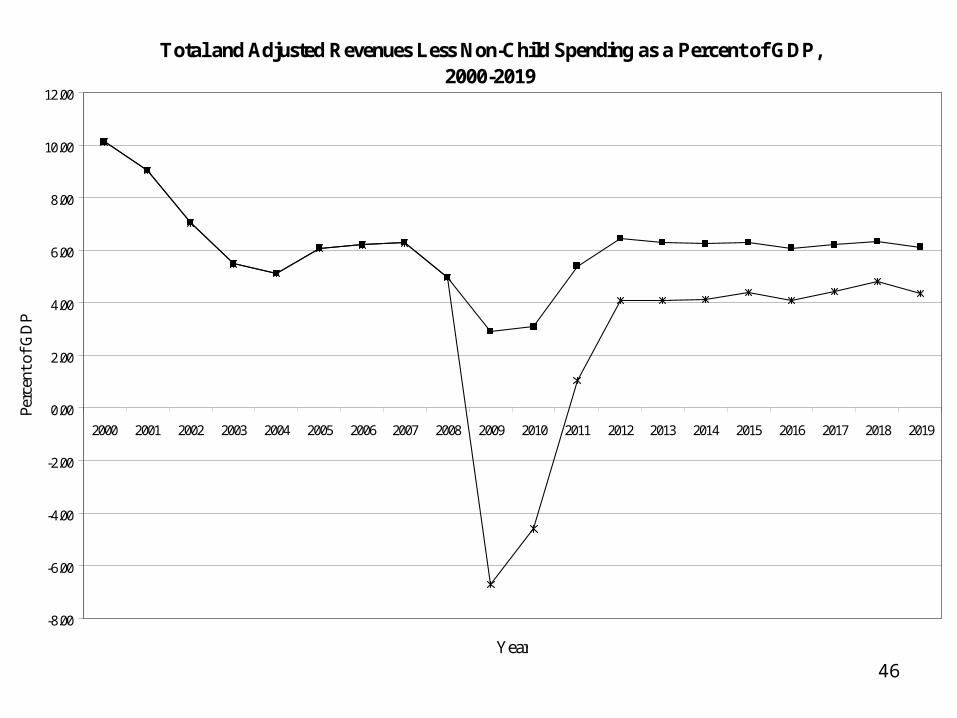
Total and Adjusted Revenues Less Non-Child Spending as a Percent of GDP, 2000-2019
-8.00
-6.00
-4.00
-2.00
0.00
2.00
4.00
6.00
8.00
10.00
12.00
2000 2001 2002 2003 2004 2005 2006 2007 2008 2009 2010 2011 2012 2013 2014 2015 2016 2017 2018 2019
Year
Perc
ent o
f G
DP
Total revenues minus non-child spending
Adjusted revenues minus non-child spending

47
15
17
19
21
23
25
27
29
2009 2014 2019 2024 2029 2034 2039 2044 2049 2054 2059 2064 2069 2074 2079
Per
cent
of G
DP
Year
Revenues and Expenditures as a Percent of GDP
CBO Baseline Revenues
CBO Baseline Expenditures

48
Baseline:Through Permanent Through Permanent
2082 2082As a Percent of GDP 3.80 5.70 6.65 8.63In Trillions of Present-Value Dollars 27,844 78,274 48,710 118,514
Including HR1 Stimulus Package:As a Percent of GDP 3.92 5.77 6.77 8.70In Trillions of Present-Value Dollars 28,699 79,229 49,565 119,469
Official CBO Baseline Adjusted Baseline
Fiscal Gaps

49
Where do we go from here?

50
Short-run uncertainties
• The four packages (stimulus, housing, finance, budget) will likely succeed or fail together.
• Global factors – Coordinated stimulus could help– European financial crisis or Chinese collapse could
hurt tremendously

51
Medium-term uncertainties
• What is the exit strategy?– We got into this problem by spending too much
and borrowing too much.– We are trying to get out of it by spending and
borrowing even more
• This may raise GDP, reduce unemployment – but it will leave us with higher and more
unsustainable levels of spending and debt.

52
Medium-term uncertainties• After recovery, we need to transition rapidly to a higher-
saving society– To pay down international debt, pay for entitlements,
finance investments • This will require
– Contradictory fiscal policy (lower spending, higher taxes)– Reduced private consumption– New investment, public and private– Trade surpluses
• Balancing fiscal policy to maintain full employment and meet these needs will be a difficult balancing act.
53
Long-Term Certainty
• Even if the short-run strategy and medium-term transition work, the country faces massive long-run fiscal shortfalls, primarily but not exclusively because of health care.
• Another set of challenges (and, yes, opportunities).


