The Economic Consequences of Death in South Africa
48
0 The Economic Consequences of Death in South Africa Cally Ardington, University of Cape Town Till Bärnighausen, Harvard School of Public Health and Africa Centre for Health and Population Studies Anne Case, Princeton University Alicia Menendez, University of Chicago November 2012 We thank Angus Deaton for helpful comments. Ardington gratefully acknowledges funding from the South African National Research Foundation/Department of Science and Technology: Human and Social Dynamics in Development Grand Challenge and the National Institutes of Health Fogarty Internal Centre under grant R01 TW008661-01. Bärnighausen was supported through Grant Nos. R01 HD058482-01 from the National Institute of Child Health and Development, National Institutes of Health (NIH); and R01 MH083539-01 from the National Institute of Mental Health, NIH; and by the Wellcome Trust. Case thanks Alice Muehlhof for expert research assistance, and gratefully acknowledges financial support from the National Institute of Aging under grant P30 AG024361. Menendez gratefully acknowledges funding by the National Institutes of Health, including the Eunice Kennedy Shriver National Institute of Child Health and Human Development (NICHD) (#5R24HD051152). Analysis is based on data collected through the Africa Centre Demographic Information Systems supported by Wellcome Trust Grants 065377/Z01/Z and 082384/Z07/Z.
Transcript of The Economic Consequences of Death in South Africa

0
The Economic Consequences of Death in South Africa
Cally Ardington, University of Cape Town
Till Bärnighausen, Harvard School of Public Health and Africa Centre for Health and Population Studies
Anne Case, Princeton University
Alicia Menendez, University of Chicago
November 2012
We thank Angus Deaton for helpful comments. Ardington gratefully acknowledges funding from the South African National Research Foundation/Department of Science and Technology: Human and Social Dynamics in Development Grand Challenge and the National Institutes of Health Fogarty Internal Centre under grant R01 TW008661-01. Bärnighausen was supported through Grant Nos. R01 HD058482-01 from the National Institute of Child Health and Development, National Institutes of Health (NIH); and R01 MH083539-01 from the National Institute of Mental Health, NIH; and by the Wellcome Trust. Case thanks Alice Muehlhof for expert research assistance, and gratefully acknowledges financial support from the National Institute of Aging under grant P30 AG024361. Menendez gratefully acknowledges funding by the National Institutes of Health, including the Eunice Kennedy Shriver National Institute of Child Health and Human Development (NICHD) (#5R24HD051152). Analysis is based on data collected through the Africa Centre Demographic Information Systems supported by Wellcome Trust Grants 065377/Z01/Z and 082384/Z07/Z.
1
Abstract
We quantify the impact of adult deaths, from AIDS and from other causes, on household economic
wellbeing, using a large longitudinal dataset spanning more than a decade. Verbal autopsies allow us to
distinguish AIDS mortality from that due to other causes. We find that households in which members die
of AIDS are systematically poorer than other households, measured using members’ educations,
household assets, and self-assessed poverty. The timing of the lower SES observed for these households
and their AIDS deaths suggests that the socioeconomic gradient in AIDS mortality is being driven
primarily by poor households being at higher risk for AIDS, rather than AIDS impoverishing the
households. Moreover, we find, using reports on asset holdings and households’ self-reports of poverty,
that households that experience a death from any cause are systematically poorer following a death.
Funeral expenses born by the deceased’s household can explain some of the impoverishing effects of
death in the household. We find no evidence that poverty following an adult death is due to the loss of an
employed household member and his or her earnings. The scale-up of antiretroviral therapy (ART), late in
our study period, has begun to change the age profile of mortality in the DSA. However, to date, ART has
not changed the socioeconomic status gradient observed in AIDS deaths.

2
1. Introduction
The AIDS epidemic has increased the economic vulnerability of households in many parts of sub-Saharan
Africa. AIDS deaths are often preceded by a period of illness, in which household members provide care
to those who have fallen ill, and contribute toward their medical expenses (McIntyre et al. 2005). AIDS
illness and death also often reduce household income, through the loss of a prime aged worker or through
changes in work patterns for prime aged caregivers. In addition, in many parts of Africa, even poor
households are expected to host elaborate funerals, adding to the financial burden the household shoulders
(Collins and Leibbrandt 2007, Case and Menendez 2011, Case et al. 2012).
Quantifying households’ economic vulnerability following an adult death in general, and an
AIDS death in particular, serves many purposes. Policy makers need to know, for example, how death
affects household functioning. NGOs and other groups who provide services to households where
members are HIV positive, and those that have experienced an AIDS death, would benefit from a better
understanding of the ways in which such households are vulnerable.
To date, quantification of the impact of an AIDS death on household economic wellbeing has
been limited by the quality and quantity of data available. Beegle and De Weerdt (2008) highlight the
challenges researchers face. Very few data sets can distinguish AIDS morbidity and mortality from that of
other causes. Households with members who die from AIDS may be systematically different from other
households, limiting the usefulness of comparisons between such households. In addition, spillover
effects from households in which deaths occur to other households may lead to underestimates of the
impact of AIDS deaths, if comparisons are made between households in the same community. While
more longitudinal data are becoming available, very few datasets cover a long enough period of time to
look outside of a narrow window before and after a death occurs.
In this paper, we quantify the economic impact of adult deaths from AIDS, and from other
causes, using data that overcome many of these concerns. The Africa Centre for Health and Population
Studies began collecting data in January 2000 on the lives of approximately 87,000 people in 11,000

3
households in Northern KwaZulu-Natal, South Africa. Data are collected twice annually on births, deaths,
marriages, residency status and household membership status for each individual under surveillance in the
demographic surveillance area (DSA). Verbal autopsies, described in the next section, are performed for
every death, allowing us to distinguish AIDS deaths from deaths due to other chronic illnesses and sudden
health related or accidental deaths. That these households have been followed since 2000 gives us a wider
window to assess the impact of illness and death. In addition, eight rounds of a socioeconomic survey
provide markers for household socioeconomic status over the entire period, allowing us to examine
outcomes in households in which deaths occur and to compare them both to other households in the DSA,
and to their own economic status prior to a death.
We find that households in which members die of AIDS are systematically poorer than other
households, measured using members’ educations, household assets, and self-assessed poverty. However,
these households were poorer long before members fell ill with AIDS. The timing of the lower SES
observed for these households and their AIDS deaths suggests that the socioeconomic gradient in AIDS
mortality is being driven primarily by poor households being at higher risk for AIDS, rather than AIDS
impoverishing the households. Following a death, households that experienced an AIDS death are
observed being poorer still. However, the additional socioeconomic loss following an AIDS death is very
similar to the loss observed from all other types of death. We investigate possible mechanisms by which
death leads to lower asset holdings and higher self-assessed reports of poverty for the household, and find
that funeral expenses born by the deceased’s household can explain some of the impoverishing effects of
death in the household. In contrast, the loss of an employed member cannot. We find no evidence that
poverty following an adult death is due to the loss of an employed household member and his or her
earnings. The scale-up of antiretroviral therapy (ART), late in our study period, has begun to change the
age profile of mortality in the DSA, lowering the mortality rate of infants and young children, and that of
adults aged 20 to 40. However, we find that adults who die of AIDS in 2008 and 2009—after the scale-

4
up—continue to be drawn systematically from poorer households. To date, ART has not changed the
socioeconomic status gradient observed in AIDS deaths.
We begin by introducing the Africa Centre data we use in our analysis, before turning to examine
the socioeconomic correlates and consequences of death in the DSA.
2. The Africa Centre for Health and Population Studies
The Africa Centre maintains a database on all individuals who live in, or who are reported to be members
of, households that reside in the DSA. A knowledgeable household member reports on current members,
whether or not they are resident in a homestead in the DSA at the time of the household interview.1
Verbal autopsies
Upon learning of the death of a household member, a verbal autopsy nurse is sent to interview the
deceased’s primary caregiver.2 Symptoms and healthcare seeking behaviors of the deceased are recorded,
and sent to two clinicians, who independently assess the information and, where possible, assign a cause
of death. Using medical records from local hospitals, the Africa Centre’s verbal autopsy data have been
validated, and shown to have high sensitivity, specificity, and predictive value for both AIDS and non-
AIDS causes of deaths (Hosegood et al. 2004).
Socioeconomic data
Over the period from 2000 to 2011, eight household socioeconomic surveys (HSE) were conducted for all
households in the DSA. These occurred in 2001, 2003/04, 2005, 2006, 2007, and annually between 2009
1 Approximately30 percent of members are non-resident at any point in time, with a large fraction of those away having migrated for employment. 2 In order to respect households in mourning, the verbal autopsy visit occurs with a lag of at least 6 months. For details on the protocol, visit http://www.africacentre.ac.za.

5
and 2011. In all HSE rounds, information was collected on household ownership of specific assets and
members’ educations. In each round after the 2001 HSE round, information was also collected on
households’ own assessments of their financial position. We will use this information to look at
consequences of adult deaths, with a special focus on AIDS deaths.
3. Death in the Demographic Surveillance Area
The impact of the AIDS crisis on the age-mortality profile in the DSA can be seen in Figure 1, which
plots for the year 2001 the log-odds of death from all causes and the log-odds of death from all non-AIDS
related causes for all individuals who were being followed by the Africa Centre demographic surveillance
system on January 1, 2001. Here the log-odds of death are graphed against individuals’ ages as of January
1st. As is observed in populations globally, the log-odds of non-AIDS related mortality rises
approximately linearly with age beyond adolescence (Elo and Preston 1996, p. 51). The additional deaths
in early and middle adulthood attributable to HIV can be seen in the deviation of all-cause mortality from
non-AIDS related mortality, which is evident from ages 20 to 60.
In what follows, we analyze the impact of deaths that occurred between 2000 and 2009.3
Antiretroviral therapy roll-out in this part of KwaZulu-Natal increased markedly in 2008 (Houlihan et al.
2011), which has the potential of changing the age profile and the mean economic status of individuals
who die of AIDS-related illnesses. In the discussion section, we return to examine how the arrival of ART
may have changed the economic correlates and consequences of AIDS deaths.
Table 1 presents the number of deaths in the field site, by age category, from January 1, 2000 to
December 31, 2009, and the fraction of these deaths by cause for each of six age categories. We have
divided deaths into AIDS deaths, deaths from non-AIDS related chronic conditions, and sudden deaths,
which are due to accidents (largely homicides and motor-vehicle related deaths) and to the onset of acute
3 Verbal autopsy diagnoses are not currently complete for 2010 or beyond.

6
health conditions (heart attack and stroke, for example).4 In this period, children largely died of diarrhea
and gastroenteritis, respiratory infections, and AIDS. Almost two-thirds of all adults who died between
the ages of 20 and 40 were diagnosed as having died of AIDS. The fraction of adults who died of other
chronic illnesses increases from 4 percent of deaths among adults aged 20 to 39, to 27 percent of deaths of
adults aged 40 or older.
The impact of deaths may vary by cause, in part because individuals who die suddenly – say,
from an accident or a heart attack – generally will not have been in need of care prior to death. In contrast,
when household members die of AIDS, or a chronic condition, there may have been a period of time prior
to death when resources were depleted to pay for care or to provide for those who had fallen ill. In the
absence of antiretroviral therapy, survival time for individuals, once they have AIDS, can generally be
measured in months (Morgan et al. 2000, Morgan et al. 2002). In addition, the characteristics of people
who die of a given condition – AIDS, for example – will differ from those of people who die from other
causes – say, chronic illness. We present preliminary evidence on this in Table 2 where, for all adult
deaths (ages 18 and older), means and standard errors are reported for age at death, the fraction female,
educational attainment, and the fraction of the deceased who were reported to be employed the last time
information was reported about them in an HSE round. We also report the fraction having any
information reported for them in any household socioeconomic module (HSE). The majority of cases that
lack any information from an HSE module died before the first round of HSE data was collected.
It is apparent from Table 2 that adults who die of AIDS are significantly younger on average (37
years old) than are those who die from chronic illnesses, sudden death, or death from unknown causes,
while individuals who die from chronic conditions are significantly older. The educational attainment of
younger cohorts of adults in South Africa is significantly higher on average than that attained by older
4 Verbal autopsies return ICD 10 codes for cause of death. We use these, with a cross walk to ICD 9 codes, and the Chronic Condition Indicator to assign death from a chronic condition. A chronic condition, by definition, is one that lasts longer than a year, and either limits self-care, social interactions or independent living, or requires on-going medical care. See http://www.hcup-us.ahrq.gov/toolssoftware/chronic/chronic.jsp for details. In the remainder of our paper, “chronic conditions” will refer to non-AIDS related chronic conditions.

7
cohorts, and the gap in the mean level of schooling between those who died of AIDS and those who died
of other chronic conditions (7.0 versus 3.4 years) is largely due to the difference in their ages at death.
This is also true for their employment status, where 40 percent of members who die of AIDS were
reported to be working when last observed in an HSE – true of 20 percent of members who die of chronic
conditions. In our analysis below, we will examine the extent to which differences in the characteristics of
those who die contribute to differences in outcomes observed between households that experience
different types of death in this period.
4. Socioeconomic Correlates and Consequences of Death in the DSA
One of the challenges of examining the impact of death on household outcomes is that there are two-way
links between economic status on one hand, and individuals’ morbidity and mortality on the other. Poorer
access to clean water, nutritious foods, and healthy work environments can lead members of poorer
households to have higher morbidity and earlier mortality. At the same time, individuals who are too ill to
work may stop contributing to household income and may draw down household assets to pay for
expensive medical treatments. We can use the longitudinal data from the Africa Centre to examine the
timing of illness and death and changes in household asset holding and self-assessed poverty to examine
the mechanisms that link economic status and household members’ mortality.
Education and AIDS mortality
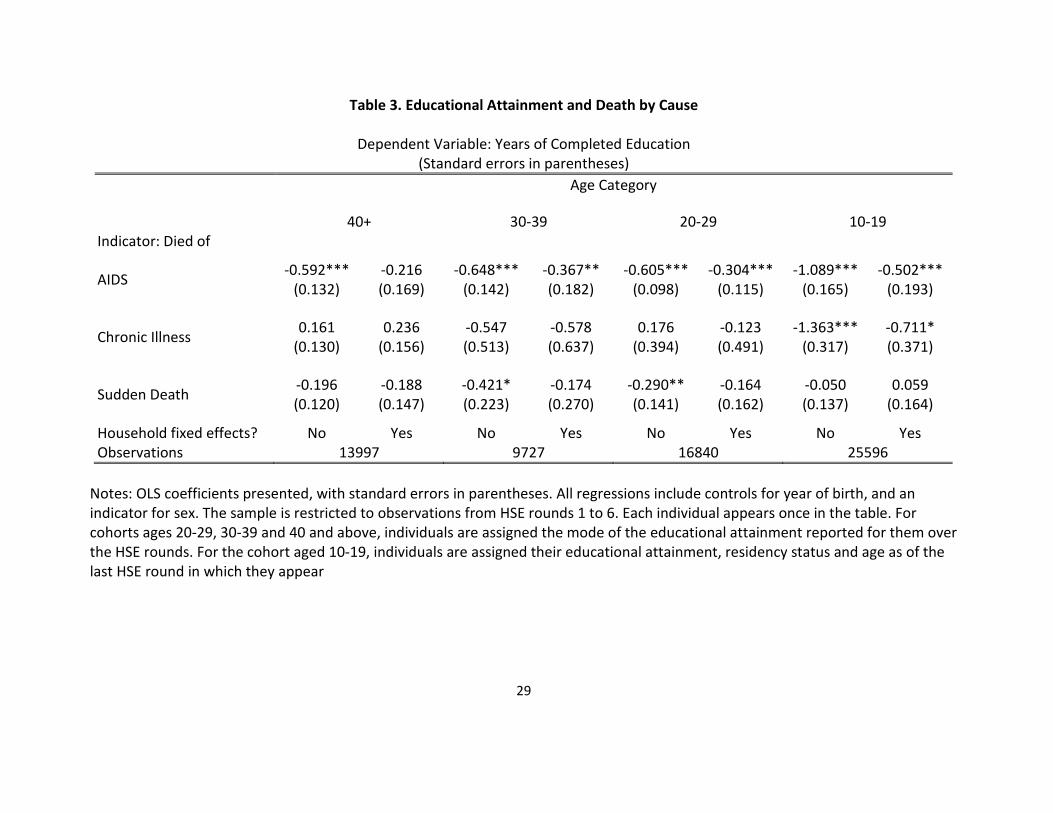
Table 3 presents the association between death by cause and years of completed education for all
members of the DSA greater than age 9, analyzed separately by ten-year age groups. The sample is drawn
from all individuals observed in a socioeconomic wave between HSE1 (2001) and HSE 6 (2009). All
individuals appear once in the sample for which regression results are reported. For cohorts ages 20-29,
30-39 and 40 and above, individuals are assigned the mode of the educational attainment reported for

8
them over the HSE rounds.5 For the group aged 10-19, individuals are assigned their educational
attainment and age as of the last HSE round in which they appear. All regressions include controls for
year of birth and an indicator for sex. For each age group, the left column reports coefficients from OLS
regressions in which years of completed schooling has been regressed on indicators for types of death,
with those who survive being the comparison group. The right column reports coefficients from
regressions that also include a complete set of household fixed effects.
Beginning with the oldest age group – individuals aged 40 or older – we find dying of AIDS is
negatively and significantly associated with individuals’ educational attainment. Given that people in this
age group would have finished their educations prior to the arrival of the AIDS crisis, we can eliminate
explanations in which the association between education and dying of AIDS is due to illness limiting
people’s ability to go to school. We can also rule out explanations based on people choosing to limit their
educations as a response to lower life expectancy (Fortson 2011). In the late 1980s, when the youngest
members in this cohort were making their final decisions on schooling, little was known about the impact
of HIV and AIDS on life expectancy. For this age group, the strong negative association between
education and death from AIDS is attributable to lower education being correlated with behaviors or other
characteristics that led to higher mortality risk from AIDS.
When individuals in this age group are compared to all other people of their sex and year of birth,
on average those who die of AIDS have completed 0.6 fewer years of education, as can be seen in the left
hand column. When compared to other members of their own households in this age group who do not
die of AIDS, they have completed only 0.2 fewer years of schooling. This can be seen in the second
column, where household fixed effects are included in the regression. That the coefficient in the second
column is a third of the size of that in the first column, and is not statistically significant, reflects the fact
that, on average, adults in households in which individuals die of AIDS have significantly less education
5 Changes over time in reported educational attainment for adults are more likely to reflect measurement error than true additional education.
9
than adults in other households. Note that the reason other members have completed fewer years of
schooling than individuals in other households is not because they were caring for someone who would
die of AIDS: these members were also finishing their educations (at the very latest) in the late 1980s, well
before people had begun to fall ill from AIDS.
The coefficients on our AIDS death indicator are almost identical for regressions run on the next
younger cohort – individuals 30 to 39 years old. When compared to all other people in the DSA in the
same age group who did not die of AIDS, those who did had completed 0.65 fewer years of schooling on
average. When compared to members of their own households in this age group, they had completed 0.37
fewer years of education. Results are similar for individuals in our 20-29 year old cohort. Again, the
results suggest that adults who die from AIDS, and other adults in their households, have lower economic
status, as measured by education.6
The youngest age cohort was largely still in school when most recently observed in an HSE
survey. On average, the educational attainment of members of this cohort will continue to increase as they
age. For this reason, we include indicators for the HSE round in which these young adults were last
observed and a variable measuring their ages at that time, in addition to one measuring their year of birth,
in regressions run for the last two columns of Table 3. Coefficients on an AIDS death indicator are
significantly larger for this cohort: death from AIDS is associated with 1.1 fewer years of schooling
relative to other individuals living in the DSA in the same age group. This reflects in part the selection
effect discussed above for older cohorts – that lower education is associated with higher mortality risk
from AIDS. However, for this age group, illness prior to death may also have caused these young adults
to fall behind in school. If the selection effect is roughly the same for young adults as it was for older
adults (approximately 0.6 years), then half of the education deficit of those who die from AIDS in this age
group may be attributable to illness, and half to selection. For this youngest cohort, death from a non-
6 These results are consistent with those of Bärnighausen et al. (2007) who find education was protective against acquiring HIV between the first two waves of HIV testing in the DSA.

10
AIDS related chronic condition is also associated with significantly lower educational attainment,
something we do not observe for older cohorts. This may also reflect the fact that those who die in young
adulthood from chronic conditions were ill during school-going ages, and may have fallen behind other
students for that reason.
We further examine the timing of illness and death from AIDS and its relationship to completed
education in Table 4. Here we restrict our sample to individuals observed in household economic modules
from HSE 1 (2001) to HSE 4 (2006), in order to look at the association between death from AIDS at
future dates and current educational attainment. In this analysis, individuals who die can appear more than
once, in order to observe their progression with respect to education, and to death. Each regression
includes a complete set of year of birth indicators interacted with age indicators, and indicators for sex,
residency, HSE round and indicators for death from other causes (sudden death, and death from chronic
conditions). To these, we add indicators that the individual will die of AIDS within a year, between 1 and
2 years, between 2 and 3 years, and at/or beyond 3 years from the current HSE round. For older age
cohorts, the coefficients on indicators of future AIDS deaths look very similar to those presented in Table
3. These regressions are comparable to the first column for each age cohort in Table 3. The coefficients
on future AIDS deaths in the oldest cohorts generally range between –0.5 to –0.8. This is, again, a
selection effect that those who will die of AIDS completed fewer years of schooling, on average.
For the youngest cohort (ages 10 to 19), the coefficient on an indicator signaling that the person
will die of AIDS in more than 3 years’ time is also in this range (–0.6). Attributing this to a selection
effect, it appears that three or more years prior to death, individuals have not fallen ill to the point that it is
affecting their ability to attend school on average. Members of the youngest cohort fall further behind in
their schooling in the years closer to death. The educational deficit for those who will die of AIDS in this

11
youngest cohort rises from 0.6 years, to 0.8 years (2 to 3 years prior to death), to 1.5 years, and finally to
1.7 years, on average, in the year prior to death.7
Households’ assets and self-assessed poverty
That households in which an adult member will die of AIDS are poorer well prior to the member’s death
can also be seen in Figure 2, which presents evidence on the total number of assets owned by households
which either have in the past, or will in the future, experience the death of an adult member from AIDS or
from another cause. Specifically, we run a regression of the form:
[5 6]
[5 6][ ] (1)
t to
ht c ht htc t to
A ind death c X uτ
τ ττ
β α= +
= −
= = + +∑ ∑
where htA is the number of assets household h reports in the HSE module collected in year t . The
variable [ ]ind death c τ= is an indicator that the household experienced a death of type c in period τ ,
where causes c are (entered separately) death from AIDS, death from a chronic illness, sudden death
from a known cause, or death from a cause unknown. For each cause of death we include indicators that
death occurred between 5 and 6 years before the current HSE module (the coefficient for which is marked
as P56 on Figure 2), between 4 and 5 years ago (P45), through to deaths that occurred within the past year
(P1). Analogously, we include indicators that a death from each cause will occur within the next year
(F1), one to two years from now (F12), out to deaths that will occur between 5 and 6 years in the future
(F56).8 We also include in this regression a complete set of indicators for HSE round, and the number of
7 The coefficients for this cohort are higher in Table 4 for the years closer to death than is the AIDS death coefficient in Table 3 because not every household will have an HSE round in the year prior to death. Table 3 reports on the last HSE round in which the member was observed, which could be several years in the past, while Table 4 makes a finer distinction between AIDS deaths. 8 We use asset information for all HSE rounds from HSE1 (2001) to HSE8 (2011) to look at the association between current asset holding and deaths that occur between 2000 and 2009 (the period for which we have complete verbal

12
household members in each household at the time the household came under surveillance.9 We allow
correlation in the unobservables from the same household observed in different HSE rounds.
The three panels of Figure 2 present regression coefficients and standard errors for leads and lags
of death by cause for AIDS (topmost panel), sudden death (middle panel), and non-AIDS chronic
conditions (bottom panel). Relative to other households, on average households that have or will
experience a death from AIDS have systematically fewer assets. In the years following a death (P1
through P56), on average such households have 0.4 fewer assets than other households. Households that
will experience an AIDS death in the future also have significantly fewer assets than other households.
This is true even if that death will occur only in 5 to 6 years. Observing uniformly lower asset holdings in
households from 1 to 6 years prior to an AIDS death suggests that the lower level of assets in AIDS
households prior to death is not due to the household drawing down assets to care for members who
become ill, as assets are lower outside the window of time when individuals with AIDS would be alive
and in need of support. The asset deficit is smaller before a death than after (0.25 assets versus 0.4), but is
statistically significant for all indicators of future death. These findings, for AIDS deaths, are consistent
with households being poorer prior to the onset of AIDS illness and death, and households becoming even
poorer after the death – possibly due to the expense incurred in paying for a funeral. We will return to this
in Section 5.
The loss of assets at the time of death can be seen for other causes as well. For example, in
households where an adult member will die in the future of a sudden death, asset holdings are not
autopsy data). At each HSE round, not every household contributes information for all periods in the past and the future. For example, for a household observed at HSE4 (2006), we can document the correlation between current household SES and deaths that occurred up to 6 years in the past. For that household, however, we can only observe the association between current SES and deaths in the future up to 3 years out. When information is missing we assign household zero values, and include an indicator that recognizes that this information is missing at that point for that household. 9 Larger households are more likely to experience a death. Larger households also on average own more assets. We include the number of members at the household’s first visit to break any mechanical link between assets and death that works simply through household size.

13
significantly different from those observed in other households. This can be seen in coefficients F1
through F56 in the middle panel of Figure 2. With sudden death, we expect no feedback from illness to
asset depletion prior to the death. However, once a death occurs, such households’ asset positions fall
significantly below those of other households, with deficits of 0.2 to 0.4 assets. The same pattern can be
seen for deaths from chronic illness in the bottom panel – suggesting that assets are not drawn down to
pay for expenses of those who are chronically ill prior to death.
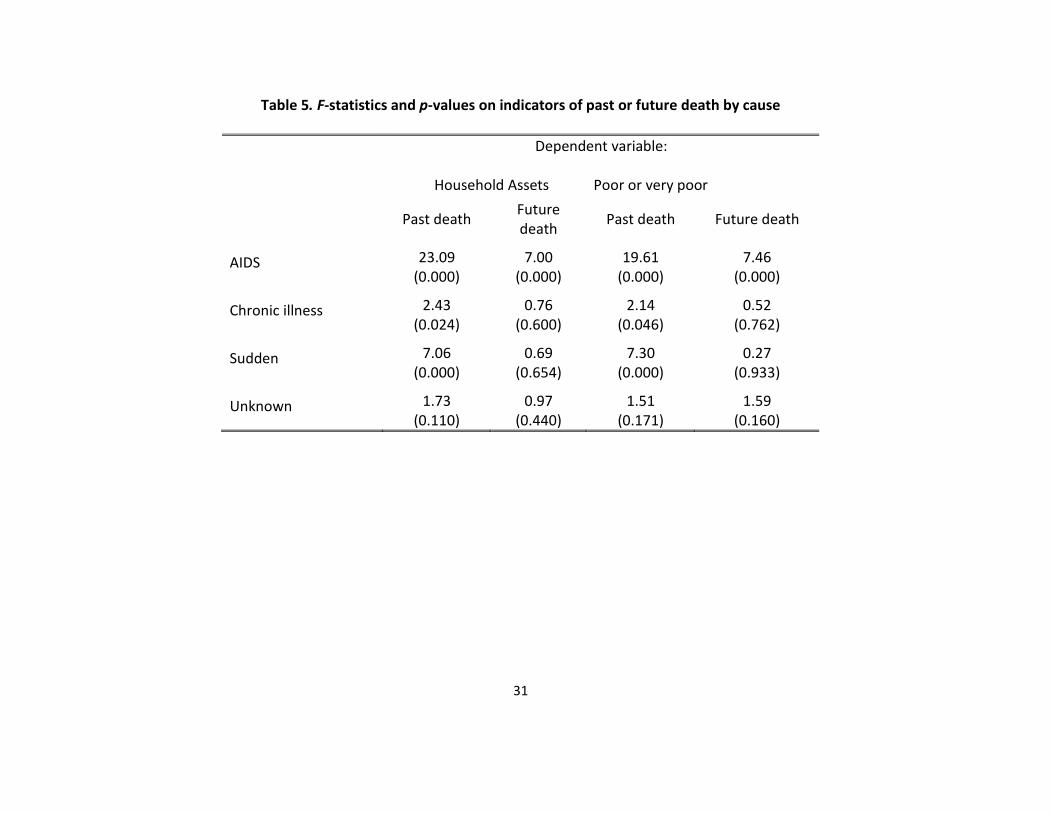
F-statistics on the joint significance of indicators for past deaths and future deaths, by cause, are
presented in Table 5, and corroborate the evidence in Figure 2. Households in which a member has or will
die of AIDS are significantly different from other households both prior to and after the death. The F-
statistics and p-values for variables P1 through P56 (for deaths in the past) are presented in column 1, and
those for variables F1 through F56 (deaths in the future) are presented in column 2. Households in which
a member will die of a chronic disease or die a sudden death are not statistically different in their asset
holdings before such deaths occur, but are significantly poorer following the death.
Beginning with the second household economic module (HSE2, 2003/04), a knowledgeable
household member was asked to report on the household’s current financial situation, with possible
responses being that the household was “Very Comfortable,” “Comfortable,” “Just Getting By,” “Poor,”
or “Extremely Poor.” We use households’ responses to this question as a second marker of household
socioeconomic status, and run a regression similar to equation (1), but with a dependent variable equal to
1 if the household reports that it is “poor” or “very poor,” and zero otherwise. Coefficients on leads and
lags of death by cause are presented in Figure 3, and F-statistics on death indicators are presented in
columns 3 and 4 of Table 5. Households in which a member has died or will die of AIDS are significantly
more like to report that they are poor. This is true well before and many years after the death. Households
where a member will die a sudden death are no more or less likely to report that they are poor until the
death occurs. After a death, they are approximately 5 percentage points more likely to report that they are
poor. This persists throughout the period in which we can study them. Households in which a member

14
will die of a chronic condition are not more likely to report poverty prior to the death. However in the first
year after the death they are significantly more likely to report that their household is poor – an effect that
abates with time. We will present evidence in Section 5 that the less pronounced effect of a funeral on
poverty for those households in which someone died from a chronic condition may be due to the
financing of the decedent’s funeral.
The results presented on past and future deaths in Figures 2 and 3 compared households that
experience a death to other households observed in the same HSE round. We can also use the longitudinal
data to compare households with their own earlier markers of socioeconomic status by running
regressions of the form:
, 1[ ] [ , ( 1)] . (2)ht h t c ht htc
y y ind death c t t X uδ γ−− = = − − + +∑
, 1 [ , ( 1)] . (3)ht h t c ht htc
y y ind death c t t X uα δ γ−= + = − − + +∑
In equation (2), , 1[ ]ht h ty y −− is the change in a socioeconomic outcome (number of assets owned, self-
report of poverty) between the current round of HSE data and the data collected in the most recent
previous HSE round, and [ , ( 1)]ind death c t t= − − is an indicator that a death from cause c occurred
between the HSE rounds. In these regressions, we also include the number of household members
reported in the previous round, a complete set of HSE round indicators, and the number of days that has
passed between the two HSE survey rounds.
In the DSA, change in asset holdings between survey rounds is lower on average for households
initially observed with more assets. Our results above suggest that initial asset holdings are lower for
households that will experience an AIDS death. For this reason, we also run regressions that allow more
flexibility between past and current asset position. Equation (2) implicitly restricts the coefficient on
lagged asset holdings to be equal to one. We relax that constraint in equation (3), and examine how
current assets are associated with death between survey rounds, conditional on previous assets.

15
Results for estimation of equations (2) and (3) are reported in Table 6. We find, controlling for
the household’s previous asset position, death from any cause between survey rounds is associated with
reporting significantly fewer assets in the current HSE round. Similarly, conditional on the household’s
previous report on poverty, a death between the rounds is associated with a positive and significant
increase in the probability of reporting the household is poor or very poor in the current wave.10
Prime-age and pension-age
We turn attention from death by cause to focus on death by age and sex. There are many reasons why the
death of household members may have different effects on household socioeconomic status, depending on
the age and sex of the member who died. In South Africa, women above the age of 60 and men above the
age of 65 are generally eligible for a state old-age pension that, by international standards, is very
generous.11 Take up of the pension in the African community is high (upwards of 90 percent), and we
assign pension status to members based on their age eligibility. Old age pensioners are significantly less
likely to be working, and are significantly more likely to contribute to a fund – a burial society or a
funeral policy – to defray costs associated with their own funerals. Pensioners generally live in large,
multiple generation households, and their households tend to be poorer than other households on average
(Case and Deaton 1998). For all of these reasons, we might anticipate the correlates and consequences of
their deaths may differ from those of prime-aged adults.
To examine this we run a regression similar to that presented in equation (1):
10We have focused here on the deaths of all adult household members, whether or not they were resident in the DSA. Deaths of non-resident members may have different effects on households, and their impacts may be more heterogeneous – depending on how close the non-resident member was to the household residing in the DSA; whether he or she sent or received transfers from the household prior to death; and whether the DSA household financed the funeral for the non-resident member. We test for differences in the associations between household SES and past and future deaths by residency status. We find no significant difference between the impact of resident and non-resident deaths on household SES, running tests that are analogous to those presented in Tables 5 and 6. We present these results in Appendix Tables 1 and 2. As we see no significant differences in the patterns for resident members and all members, we continue to examine deaths of all members. 11 Beginning in April 2008, men’s age eligibility began to move toward 60. We assign pension-eligibility to reflect the law change.
16
[5 6]
/ ,/ [5 6]
[ / ] (4)t to
ht age sex ht htage sex t to
A ind death age sex X uτ
τ ττ
β α= +
= −
= = + +∑ ∑
where we have replaced indicators of death by cause by indicators of death by age and sex categories
(prime-aged women, prime-aged men, pension-aged women and pension-aged men). We present results
for household asset holding in Figure 4, and for household self-assessed poverty in Figure 5.
Corresponding F-statistics from these two socioeconomic status regressions are presented in Table 7.
In households that will experience the death of a prime-aged or pension-aged man, we see no
significant difference in asset holdings, relative to other households, prior to the member’s death.
However, prime-aged and pension-aged females are observed living in households with fewer assets in
the years leading up to their deaths. Self-assessed poverty follows a similar pattern, with households in
which prime-aged or pension-aged women die more likely to report that the household is poor prior to the
death. For the younger women, this may reflect the fact that 70 percent of prime-aged women who died
between 2000 and 2009 died of AIDS—true of only 52 percent of prime aged men who died during that
period.
The death of a member in all four age-sex groups is associated with a significant and substantial
deterioration in their households’ relative asset position following the member’s death, with the most
pronounced deterioration for households that experience the death of a pension-aged man. Relative to
other households, the death of a member in any of these age-sex categories is associated with a higher
probability of reporting that the household is poor or very poor following the death.
Table 8 presents results for changes in household asset holding and reports of poverty following
the deaths of prime-aged and pension-aged adults. These are run for regressions analogous to those
presented in equations (2) and (3). We find, controlling for the households’ previous level of assets, or

17
their previous report on household poverty, that the death of all four types of members is associated with
poorer socioeconomic status – measured using either assets or self-assessed poverty.
5. Discussion
There are many reasons that households may lose ground relative to other households following the death
of a member. Additional data collected through the Africa Centre Demographic Surveillance System can
help us sort through some of the possible causes.
Funerals
A household in the DSA may become permanently poorer following the death of a household member in
part because of the obligation it faces to bury members in a manner that reflects both the household’s
status and the member’s status within the community. For example, it is generally expected in KwaZulu-
Natal that funerals will be larger, the older was the deceased, and that the feast following a man’s funeral
will involve slaughtering a cow (an expensive proposition),while that following a woman’s will involve
slaughtering a goat (at lesser expense).12 Case et al. (2012) use data collected in the DSA on the funeral
expenses for the deaths of household members that occurred between January 1, 2003 and December 31,
2005 to document funeral expenditures and financing.13 Using data collected in the Illness and Death
Survey, they find the average cost of an adult funeral is approximately equal to median per capita annual
African income during this period. While community, church, and employers often contribute toward the
funeral, the deceased’s household on average paid 90 percent of the costs associated with the funeral. A
12Cattle in this area sold for approximately 2000 Rand a head in the 2003-2005 period of data collection. This estimate is consistent with other reports for this period. King (2004) reports sale prices for a cow fluctuated between R1500 and R2000 in the former bantustan of KaNgwane, between 2000 and 2002. McCord (2004) reports that sale prices for cows varied from R700 to R3000 in Limpopo in mid-2003. To provide a yardstick against which to measure this sum, we note that in the 2003-2004 HSE2 data collection for the DSA, median total household expenditure per month was 776 Rands. 13ACDIS recorded 3728 adult deaths between January 2003 and December 2005. The Illness and Death Survey collected funeral information for 84 percent of individuals who died in that period.

18
quarter of all adults who died in that period had some sort of funeral insurance that paid (primarily) cash
to the policy holder’s beneficiaries. Policy holders are overwhelmingly old age pensioners, who join a
burial society or take out a policy with a funeral parlor or an insurance company at the time they begin to
receive their state old-age pension. A quarter of households in the DSA borrowed money (many at
usurious interest rates) to bury their dead.14
Using data collected in the Illness and Death Survey, Table 9 presents descriptive regression
results for funeral expenditures and financing. Column one presents coefficients from a regression of total
funeral spending (in Rand) on indicators for the cause of death, and indicators for whether the deceased
was a prime-aged or pension-aged man or woman. The benchmark characteristics of the deceased,
captured by the constant term, are those of a prime-aged woman who died after a chronic illness. On
average, a funeral for this type of member cost just over 5000 Rand (8000 Rand in 2012 prices). If she
had died of AIDS, approximately 1300 fewer Rand would have been spent on the funeral. This reflects in
part the fact, discussed in the previous section, that households in which a member will die from AIDS
are poorer well before the death. Relative to a prime-aged woman, 450 extra Rand are spent on average
on a pension-eligible woman’s funeral, more than 500 additional Rand for that of a prime-aged man, and
more than 1800 Rand more are spent on the funeral of a male pensioner—a combination that reflects the
status of members by age and sex, and the higher likelihood that a deceased pensioner had funeral
insurance.
The relative probabilities of having held funeral insurance prior to death can be seen in column
two, where the dependent variable is equal to 1 if the deceased’s primary caregiver reports that a funeral
policy paid out at death, and is equal to 0 otherwise. Relative to a prime aged woman dying after a
chronic illness, prime aged women who die of AIDS are 13 percentage points less likely to have had a
14Qualitative field work conducted by Themba Mbhele (2007) in the Dondotha Area Study documents exorbitant interest rates charged by money lenders.

19
funeral policy, and those dying a sudden death are 8 percentage points less likely. In contrast to prime-
aged adults, pensioners are highly likely to hold a policy: 78 percent of pension aged men (0.300+0.482)
and 86 percent of pension aged women who died between 2003 and 2005 held funeral insurance. Even the
households of pensioners with burial insurance on average pay positive out-of-pocket expenses for the
funeral. On average, 2300 Rand are spent by the household for the funeral of a pension-aged man who
held burial insurance, while 800 Rand are spent for pension-aged women with insurance.
Households that do not have the resources on hand to finance an appropriately-sized funeral often
borrow money to do so. This can be seen in column three, where the dependent variable is an indicator
equal to 1 if the household reports that it borrowed money for the funeral. This occurred in 18 percent of
the funerals observed for prime-aged women when death followed a chronic illness. Borrowing money
for a funeral is significantly more likely when the death was due to AIDS (27 percent versus 18 percent).
On average, then, AIDS deaths are associated with smaller funerals but the funerals are significantly more
likely to be funded, at least in part, out of borrowed money. This kind of debt could strain a household’s
resources well into the future. The funerals of prime-aged men are larger than those for prime-aged
women, and they are almost 5 percentage points more likely to be financed in part with borrowed money.
This also leads to households’ financial positions being more fragile in the future.
We can observe the impact of borrowing money and of having held a burial insurance policy on
the asset holdings and self-assessed poverty of households in HSE modules before and after a death that
was recorded in the Illness and Death Survey. Table 10 presents coefficients from regressions analogous
to those presented in equation (3) but with indicators that an adult death from any cause occurred between
HSE rounds and, for those households with a death, an indicator that the deceased had burial insurance
and an indicator that the household borrowed money for the deceased’s funeral. (These are set to zero for
households where a death did not occur.) We control for the number of members in the previous period
(prior to the death), and include indicators for which HSE round the observation comes from, and the time
in days between the household’s last HSE visit date and its current HSE visit date. In the first four

20
columns, we control for the household’s asset position in the previous round, and in the last column, we
control for their self-assessed poverty in the previous round. Because we recorded information about
funerals from 2003 to 2005, we restrict our analysis of assets held to HSE2 (2003/04), HSE3 (2005) and
HSE4 (2006).
As we observed in the previous section, death between survey rounds is negatively and
significantly associated with asset holdings on average. Relative to other households with the same asset
position in the previous round, household that experienced a death hold 0.2 fewer assets when observed
following the death. Reporting that money was borrowed for the funeral is associated with an even
weaker asset position for the household, with an additional 0.3 fewer assets reported following the death,
relative to other households that experienced a death. However, households that report the deceased had a
burial policy experience no weakening in their asset position following death. The coefficient on the
indicator that the deceased had a policy (0.290) completely offsets the association between death and
assets (-0.287). For households that report borrowing money, but also report that the deceased had a
funeral policy, death is overall associated with a relatively poorer asset position. The funeral policy
offsets the coefficient on death, but borrowing still leaves a household vulnerable to reporting relatively
fewer assets than households that were equally positioned in the previous wave. Results in column 5,
which report on changes in the probability that a household reports it is poor or very poor, are consistent
with these results. Overall, bearing the cost of funerals puts households in a weaker socioeconomic
position in the DSA, and provides a partial explanation for the results we observed in Section 4.
Loss of an employed member
An additional mechanism through which death of an adult member could affect household SES is through
the loss of earnings of a working member. In Table 11, we test this in two ways. Using data from the
Illness and Death Study, we investigate whether household assets and self-assessed poverty following a
death are significantly related to a primary caregiver’s report that, when the deceased was healthy, his or

21
her earnings were important to the household (which is true for 25 percent of adult deaths). In addition,
we test whether these markers of economic wellbeing are significantly different from those in other
households experiencing a death if the deceased was employed when last seen in an HSE module.15
Controlling for asset holdings in the previous round, we find that asset holdings are not
significantly associated with either of our measures of employment for the deceased. When controls are
not included for previous assets, employment of the deceased is positively and significantly associated
with household asset holdings: the deceased being employed is itself a marker that the household is better
off than other households that experienced a death. This is also reflected in the results reported for self-
assessed poverty. Even with a control for self-assessed poverty in the previous round, that the deceased
member was working when last seen is negatively and significantly related to the probability of reporting
that the household is poor in the current round. The deceased’s earnings no longer contribute to the
household pot. However, past contributions may protect the household after this member has died.
Moreover, conditional on age, we find employed members are significantly more likely to have had a
burial policy, which would defray funeral expenses. It is possible that, taken together, these offset the loss
of earnings, leading to an insignificant association between employment prior to death and household
future SES.
ART and household socioeconomic standing
That the arrival in the DSA of antiretroviral theory (ART) is beginning to change the age-mortality profile
can be seen in Figure 6, which returns to the log-odds of dying from all causes – now presented for 2001
and 2009. It is clear from Figure 6 that death rates at very young ages and in early-middle age have fallen
15 Reports on whether the deceased’s earnings were important to the household are only available for deaths covered in the Illness and Death Survey (2003-2005). When using this measure of deceased’s employment, we focus on changes in assets and self-assessed poverty measured between HSE2 and HS4. Reports on whether the deceased was working when last observed are available, in principle, in all HSE rounds preceding the death. We report on the latter for both the more restricted period—that is, matching rounds with those available in the Illness and Death Survey—and for the whole sample period.

22
during this period. Although it is still far from being approximately linear in age after adolescence, the
movement observable is quite marked. (See Herbst et al. 2009, Herbst et al. 2011 for discussion.)
Has the scale-up of ART begun to change the socioeconomic gradient in AIDS mortality we
observed for deaths through the first decade of the 2000s? To explore this question, we re-ran equation
(1) for all deaths (2000-2009), and included lead and lag indicators that the death in question occurred in
the period after ART scale-up occurred in 2008-2009. Table 12 presents the F-statistics for the
coefficients for AIDS deaths in the past and the future in regressions for asset holdings and reports of
poverty. We find no evidence, in these first years after ART scale-up, that deaths in 2008 and 2009 are
coming from households that are significantly different from households in which deaths occurred earlier
in the decade, measured using household assets. However, with respect to self-assessed poverty, we find
that relative to deaths that occurred between 2000 and 2007, those in 2008 and 2009 are drawn from
households with lower self-reported poverty, on average. It is too early to document the long-run effects
of ART roll-out, but there is a suggestion, based on the self-assessed poverty results, that it could change
the socioeconomic gradient in AIDS mortality. It will be interesting to return to this question once
additional years of post-rollout data can be added to the analysis.
Sample attrition
Given our reliance on the information collected in HSE modules following deaths, we examine the extent
to which death causes households to attrite from surveillance – either because the household dissolves, or
because it moves outside of the demographic surveillance area and is lost to follow-up. Appendix Table 3
presents evidence on this for all households who are present in at least one HSE round between HSE1
(2001) and HSE 5 (2007).16 Households present at more than one HSE round in this period will appear
multiple times in this sample. We test whether those households who remain under surveillance until the
16 We stop at HSE5 so that we can look forward and see whether the household had attritted before HSE6, which is the last round for which we currently have verbal autopsy data.

23
next HSE round, and those who leave surveillance for whatever reason, are significantly different with
respect to household characteristics, including whether a death had occurred in the household in the 12
months prior to the HSE module in which they are observed.
Among households lost to follow-up, 9.4 percent experienced the death of an adult member from
any cause in the year before their household was visited for the HSE round. This is true for 9.9 percent of
households not lost to follow-up. That this difference is not statistically significant can be seen in the last
column, where the significance of differences between the means presented in columns one and two are
noted with asterisks (* for significance at the 10 percent level, ** for 5 percent, *** for 1 percent).17
Looking at death in the household by cause, we find a small but statistically significant difference in the
fraction of households that had an AIDS death, with households who remain under surveillance more
likely to have had an AIDS death (5.0 percent versus 4.2 percent). Households that remain under
surveillance and those who will exit before the next HSE round do not differ significantly in the fraction
that experienced the death of a prime aged woman, a pension aged woman, or a pension aged man.
Households that remain under surveillance are significantly more likely to have experienced the death of
a prime-aged male household member (4.4 versus 3.7 percent). Households that exit surveillance are
more fragile, in that they have fewer members and lower socioeconomic status, measured using assets
owned, and self-assessed poverty.
6. Conclusions
In the demographic surveillance area, AIDS mortality follows a sharp economic gradient. We find that
less well educated individuals in asset poor households are at significantly higher risk of dying from
AIDS than are other individuals of the same age and sex. Part of the mechanism through which education
leads to lower AIDS mortality appears to be through lowering the risk of contracting HIV (Bärnighausen 17 As in Hosegood et al. (2004b), household dissolution is significantly more likely following an adult death. However, household dissolution accounts for a relatively small fraction of households that attrite. Overall, attrition is insensitive to adult death.

24
et al. 2007). A better understanding of the mechanisms through which education operates in doing this
would be helpful for prevention campaigns. Education may also lead to behaviors that increase the time
from HIV to AIDS, and the success of ART programs upon the arrival of AIDS. It is an open question
whether continued ART provision will, over time, lessen the SES gradient in AIDS mortality. Continued
demographic surveillance may provide answers to these questions with time.
Death in households in the DSA is associated with persistently poorer household socioeconomic
status, measured in a variety of ways. We find that funerals play a role in lowering household SES
following a death, especially in those cases in which money was borrowed to pay for the funeral. Future
analyses on individuals in households that experience a death may shed light on the repercussions of large
funerals for individual members’ outcomes.

25
References Bärnighausen, Till, Victoria Hosegood, Ian M. Timaeus, and Marie-Louise Newell. 2007. “The Socioeconomic Determinants of HIV Incidence: Evidence From a Longitudinal Population-based Study in Rural South Africa.” AIDS 21 (suppl 7): S29-38. Beegle, Kathleen and Joachim De Weerdt. 2008. “Methodological Issues in the Study of the Socioeconomic Consequences of HIV/AIDS.” AIDS 22(suppl 1): S89-94. Case, Anne and Angus Deaton. 1998. “Large Cash Transfers to the Elderly in South Africa.” 1998. Economic Journal 180(450): 1330-1361. Case, Anne and Alicia Menendez. 2011. “Requiescat in Pace? The Consequences of High Priced Funerals in South Africa.” Chapter 11 (pages 351-73) in Explorations in the Economics of Aging, David Wise (ed.) University of Chicago Press. Case, Anne, Anu Garrib, Alicia Menendez and Analia Olgiati. 2012. “Paying the Piper: The High Cost of Funerals in South Africa.” Forthcoming Economic Development and Cultural Change. Collins, Daryl L. and Murray Leibbrandt. 2007. “The Financial Impact of HIV/AIDS on Poor Households in South Africa.” AIDS 21(Suppl 7): 575-81. Elo, Irma T. and Samuel H. Preston. 1996. “Educational Differentials in Mortality: United States 1979-85.” Social Science & Medicine 42(1): 47-57. Fortson, Jane G. 2011. “Mortality risk and human capital investment: The impact of HIV/AIDS in sub-Saharan Africa.” The Review of Economics and Statistics, 93(1): 1–15. Herbst, A.J., G.S. Cooke, T. Bärnighausen, A. Kanykany, F. Tanser, and M.L. Newell. 2009. “Adult Mortality and Antiretroviral Roll-out in Rural KwaZulu-Natal, South Africa.” Bull World Health Org. 87(10): 754-62. Herbst, Abraham J., Tshepiso Mafojane and Marie-Louise Newell. 2011. “Verbal Autopsy-based Cause-Specific Mortality Trends in Rural KwaZulu-Natal, South Africa, 2000-2009.” Population Health Metrics 9: 47. Hosegood, V., A. Vanneste and I. Timaeus, 2004. “Levels and causes of adult mortality in rural South Africa: the impact of AIDS.” AIDS 18:663-671.
Hosegood, Victoria, Nuala. McGrath, Kobus Herbst and Ian Timaeus. 2004b. “The Impact of Adult Mortality on Household Dissolution and Migration in Rural South Africa.” AIDS 18: 1585-90.
Houlihan, Catherine F., Ruth M Bland, Portia C Mutevedzi, Richard J Lessells, James Ndirangu, Hilary Thulare and Marie-Louise Newell.2011. “Cohort Profile: Hlabisa HIV Treatment and Care Programme.” International Journal of Epidemiology 40: 318-326. .

26
King, Brian H. 2004. “Spaces of change: Tribal authorities in the former KaNgwane homeland, South Africa.” (March 5, 2004). Center for African Studies. Breslauer Symposium on Natural Resource Issues in Africa. Paper King2004a. Available on line at http://repositiories.edlib.org/case/breslauer/king2004a. Mbhele, Themba. “The Dondotha Area Study: Five Interviews Conducted by Themba Mbhele.” Accessed on line November 20, 2012. http://www.sarpn.org/documents/d0000159/P152_KwaZulu-Natal_Narratives_Dondotha.pdf . McCord, Anna. 2004. “Policy expectations and programme reality: The poverty reduction and labour market impact of two public works programmes in South Africa.” Economics and Statistics Analysis Unit (ESAU) Working Paper 8. Available on line at http://www.odi.org.uk/spiru/publications/working_papers/Esau_8_South_Africa.pdf McIntyre, Diane, Michael Thiede, Göran Dahlgren, and Margaret Whitehead. 2005. “What are the economic consequences for households of illness and of paying for health care in low- and middle-income country contexts?” Social Science & Medicine 62(4): 858-65. Morgan, D., C. Mahe, B. Mayanja, J.M. Okongo, R. Lubega and J.A.G. Whitworth. 2002. “HIV-1 Infection in Rural Africa: Is There a Difference in Median Time to AIDS and Survival Compared with That in Industrialized Countries.” AIDS 16(4): 597-603. Morgan, D., S.S. Malamba, J. Orem, B. Mayanja, M. Okongo, and J.A.G. Whitworth. 2000. “Survival by AIDS Defining Condition in Rural Uganda.” Sex Transm Inf. 76: 193-197.

27
Table 1. Deaths by Cause in the Africa Centre Demographic Surveillance Area 2000-2009
Age Categories 0-5 6-9 10-19 20-29 30-39 40+ Cause of death: AIDS 0.365
(0.012) 0.346
(0.038) 0.313
(0.022) 0.585
(0.010) 0.660
(0.009) 0.312
(0.006) Sudden death 0.500
(0.012) 0.428
(0.039) 0.508
(0.024) 0.327
(0.010) 0.241
(0.008) 0.340
(0.006) Chronic Illness 0.074
(0.006) 0.138
(0.027) 0.109
(0.015) 0.037
(0.004) 0.035
(0.003) 0.266
(0.006) Unknown cause 0.062
(0.006) 0.088
(0.023) 0.070
(0.012) 0.051
(0.005) 0.064
(0.004) 0.082
(0.004) Observations 1739 159 431 2299 3031 5896
Notes. Each cell reports the fraction of deaths attributable to a particular cause, for a given age range. Standard errors are given in parentheses.

28
Table 2. Characteristics of Adults Who Die, By Cause of Death, 2000-2009
Cause of Death AIDS Chronic Sudden Unknown Age at death 37.2
(0.15) 63.5
(0.43) 47.5
(0.34) 49.9
(0.72) Female 0.54
(0.01) 0.55
(0.01) 0.41
(0.01) 0.51
(0.02) Indicator: had information collected in an HSE module
0.82 (0.01)
0.86 (0.01)
0.85 (0.01)
0.92 (0.01)
Years of education 7.0 (0.07)
3.4 (0.11)
5.76 (0.09)
5.6 (0.18)
Employed when last seen in HSE
0.40 (0.01)
0.20 (0.01)
0.35 (0.01)
0.34 (0.02)
Observations 5242 1768 3571 808 Notes. Means presented, with standard errors in parentheses. The sample is restricted to adults, ages 18 and older.
29
Table 3. Educational Attainment and Death by Cause
Dependent Variable: Years of Completed Education (Standard errors in parentheses)
Age Category
40+ 30-39 20-29 10-19 Indicator: Died of
AIDS -0.592*** (0.132)
-0.216 (0.169)
-0.648*** (0.142)
-0.367** (0.182)
-0.605*** (0.098)
-0.304*** (0.115)
-1.089*** (0.165)
-0.502*** (0.193)
Chronic Illness 0.161 (0.130)
0.236 (0.156)
-0.547 (0.513)
-0.578 (0.637)
0.176 (0.394)
-0.123 (0.491)
-1.363*** (0.317)
-0.711* (0.371)
Sudden Death -0.196 (0.120)
-0.188 (0.147)
-0.421* (0.223)
-0.174 (0.270)
-0.290** (0.141)
-0.164 (0.162)
-0.050 (0.137)
0.059 (0.164)
Household fixed effects? No Yes No Yes No Yes No Yes Observations 13997 9727 16840 25596
Notes: OLS coefficients presented, with standard errors in parentheses. All regressions include controls for year of birth, and an indicator for sex. The sample is restricted to observations from HSE rounds 1 to 6. Each individual appears once in the table. For cohorts ages 20-29, 30-39 and 40 and above, individuals are assigned the mode of the educational attainment reported for them over the HSE rounds. For the cohort aged 10-19, individuals are assigned their educational attainment, residency status and age as of the last HSE round in which they appear

30
Table 4. Educational Attainment and Time to Death Age Category
40+ 30-39 20-29 10-19 Indicator: Will die of AIDS
In less than 1 year –0.804*** (0.202)
–0.525*** (0.202)
–0.869*** (0.176)
–1.655*** (0.315)
In 1 - 2 years –0.484*** (0.167)
–0.842*** (0.159)
–0.901*** (0.123)
–1.479*** (0.282)
In 2 - 3 years –0.676*** (0.167)
–0.481*** (0.163)
–0.637*** (0.123)
–0.831*** (0.229)
In 3 or more years –0.492*** (0.110)
–0.555*** (0.110)
–0.569*** (0.073)
–0.611*** (0.096)
Observations 50127 32106 59017 81428 Notes: OLS coefficients presented, with standard errors in parentheses. All regressions include a complete set of year of birth indicators interacted with age indicators, and indicators for sex, residency, HSE round, and indicators for death by a chronic illness and sudden death. The sample is restricted to observations from HSE rounds 1 to 4.
31
Table 5. F-statistics and p-values on indicators of past or future death by cause
Dependent variable:
Household Assets Poor or very poor
Past death Future death Past death Future death
AIDS 23.09 (0.000)
7.00 (0.000)
19.61 (0.000)
7.46 (0.000)
Chronic illness 2.43 (0.024)
0.76 (0.600)
2.14 (0.046)
0.52 (0.762)
Sudden 7.06 (0.000)
0.69 (0.654)
7.30 (0.000)
0.27 (0.933)
Unknown 1.73 (0.110)
0.97 (0.440)
1.51 (0.171)
1.59 (0.160)

32
Table 6. Changes in household socioeconomic status following a death
Change in Number of
assets owned
Number of assets owned
Change in Self-reported poverty
Self-reported poverty
AIDS death between HSE survey rounds
-0.152*** (0.044)
-0.259*** (0.039)
0.033** (0.014)
0.069*** (0.011)
Sudden death between survey rounds
-0.144*** (0.051)
-0.165*** (0.045)
0.011 (0.015)
0.029** (0.012)
Death from chronic illness Between survey rounds
-0.099 (0.080)
-0.116* (0.070)
0.039* (0.021)
0.040** (0.017)
Assets holdings lagged one HSE round -- 0.607***
(0.005) -- --
Poverty report lagged one HSE round -- -- -- 0.200***
(0.006)
Number of observations 44984 44984 35049 35049
Notes: All regressions include the number of household members reported in the previous HSE round, indicators for each HSE round, and the number of days since the previous HSE round. Self-reported poverty is an indicator equal to 1 if the household reports it is poor or very poor.

33
Table 7. F-statistics and p-values on indicators of past or future death by age and sex
Dependent variable:
Household Assets Poor or very poor
Past death Future death Past death Future death
Prime aged male 8.65 (0.000)
0.49 (0.816)
10.92 (0.000)
0.74 (0.595)
Prime aged female 9.21 (0.000)
2.68 (0.013)
6.50 (0.000)
4.37 (0.001)
Pension aged male 5.97 (0.000)
1.71 (0.115)
4.83 (0.000)
0.45 (0.811)
Pension aged female 12.81 (0.000)
6.25 (0.000)
5.79 (0.000)
3.23 (0.006)

34
Table 8. Changes in household socioeconomic status – prime age and pension deaths
Change in Number of
assets owned
Number of assets owned
Change in Self-reported
poverty
Self-reported poverty
Prime aged male death between HSE survey rounds
−0.168*** (0.047)
−0.175*** (0.041)
0.019 (0.014)
0.036*** (0.010)
Prime aged female death between survey rounds
−0.128*** (0.048)
−0.196*** (0.043)
0.020 (0.014)
0.050*** (0.011)
Pension aged male death between survey rounds
−0.239** (0.096)
−0.248*** (0.085)
0.040 (0.030)
0.053*** (0.023)
Pension aged female death between survey rounds
−0.010 (0.082)
−0.202*** (0.072)
0.008 (0.023)
0.051*** (0.018)
Assets holding lagged one HSE round
-- 0.607*** (0.005) -- --
Poverty report lagged one HSE round
-- -- -- 0.200*** (0.006)
Number of observations 44984 44984 35049 35049 Notes: All regressions include the number of household members reported in the previous HSE round, indicators for each HSE round, and the number of days since the previous HSE round.

35
Table 9. Funeral expenses and financing
Dependent variable: Total funeral
expenses Indicator:
deceased had a burial policy
Indicator: household borrowed money to pay for the funeral
Deceased died of AIDS –1326.96*** (216.67)
–0.128*** (0.025)
0.091*** (0.026)
Sudden death –182.47 (210.75)
–0.084*** (0.024)
0.006 (0.026)
Cause of death unknown –841.55*** (311.98)
–0.064 (0.036)
–0.059 (0.038)
Deceased was prime aged male 543.13*** (142.13)
–0.002 (0.016)
0.047*** (0.017)
Deceased was pension aged male
1841.35*** (268.53)
0.482*** (0.030)
0.008 (0.032)
Deceased was pension aged female
454.99** (221.00)
0.560*** (0.025)
–0.037 (0.027)
Constant 5037.41*** (213.97)
0.300*** (0.025)
0.178*** (0.026)
Number of observations 3183 3109 3067 Notes: Data on funeral expenses and financing are drawn from the Illness and Death Survey collected in the Demographic Surveillance
Area for deaths that occurred between January 2003 and December 2005.

36
Table 10. Asset holdings and funeral financing
Dependent Variable: Household assets Poor or very Poor Indicator: death in household between survey waves
–0.208*** (0.053)
–0.132** (0.062)
–0.287*** (0.062)
–0.208*** (0.073)
0.062*** (0.017)
Indicator: household borrowed to pay funeral expenses
-- –0.277** (0.109) -- –0.248**
(0.111) 0.061** (0.027)
Indicator: deceased had a burial policy
-- -- 0.290*** (0.110)
0.247*** (0.111)
–0.049* (0.027)
Number of observations 17502 17468 17502 17468 17022 Notes: All regressions include an indicator for HSE survey round, the number of household members in the previous period, and days between the HSE rounds. Columns 1 to 4 include household asset holdings in the previous round. Column 5 includes the household’s report of its financial wellbeing in the previous round. Data are drawn from HSE2, HSE3 and HSE4.

37
Table 11. Employment, earnings and socioeconomic status following a death
Dependent Variable: Household assets Poor or very poor HSE 3 & HSE 4 HSE 2-6 HSE 3 & HSE 4 HSE 3-6 Indicator: death in household between survey waves
–0.208***
(0.079)
–0.224***
(0.057)
–0.262***
(0.036)
0.083*** (0.019)
0.074*** (0.014)
0.065*** (0.009)
Indicator: deceased’s earning were important to household
0.081
(0.147)
--
--
–0.039 (0.034)
--
--
Indicator: deceased was working when last observed in an HSE round
-- 0.105 (0.089)
0.081 (0.055)
-- –0.034* (0.021)
–0.038*** (0.014)
Number of observations 16779 18226 44543 16342 17716 34948 Notes: All regressions include an indicator for HSE survey round, days between the last HSE round and the current round, and the number of household members reported in the previous round. Columns 1 to 3 include a control for household asset holdings in the previous round, and columns 4 to 6 include a control for the household’s self-report on poverty in the previous round. Reports that the deceased’s earnings were important to the household while he or she was working are drawn from the Illness and Death Survey.

38
Table 12. F-statistics and p-values on indicators of past or future death after ART arrival
Dependent variable:
Household Assets Poor or very poor
Past death Future death Past death Future death
All AIDS deaths 20.48 (0.000)
6.63 (0.000)
19.24 (0.000)
10.17 (0.000)
All AIDS deaths × Indicator[Post-2008]
0.59 (0.667)
0.40 (0.881)
1.18 (0.316)
5.74 (0.000)

39
Figure 1. Log odds of dying by age – all cause and non AIDS-related mortality
-8-6
-4-2
0Lo
g od
ds o
f dyi
ng
0 20 40 60 80 100age in years
All cause 2001 Non AIDS-related 2001
All cause and non AIDS-related mortalityLog odds of dying by age

40
Figure 2: Relative asset holdings by cause and timing of death
-.6-.4
-.20
Rel
ativ
e as
sets
F56
F45
F34
F23
F12 F1 P1
P12
P23
P34
P45
P56
Years before/since death
Cause of death: AIDS-.6
-.4-.2
0.2
.4R
elat
ive
asse
ts
F56
F45
F34
F23
F12 F1 P1
P12
P23
P34
P45
P56
Years before/since death
Cause of death: sudden
-.50
.5R
elat
ive
asse
ts
F56
F45
F34
F23
F12 F1 P1
P12
P23
P34
P45
P56
Years before/since death
Cause of death: chronic

41
Figure 3. Relative self-reported poverty by cause and timing of death
0.0
5.1
Rel
ativ
e po
verty
F45
F34
F23
F12 F1 P1
P12
P23
P34
P45
P56
Years before/since death
Cause of death: AIDS-.0
50
.05
.1R
elat
ive
pove
rty
F45
F34
F23
F12 F1 P1
P12
P23
P34
P45
P56
Years before/since death
Cause of death: sudden
-.1-.0
50
.05
.1R
elat
ive
pove
rty
F45
F34
F23
F12 F1 P1
P12
P23
P34
P45
P56
Years before/since death
Cause of death: chronic

42
Figure 4. Relative asset holdings by age and sex of deceased and timing of death
-1-.5
0.5
1R
elat
ive
asse
ts
F56
F45
F34
F23
F12 F1 P1
P12
P23
P34
P45
P56
Years before/since death
Deceased: Prime-aged female
-1-.5
0.5
1R
elat
ive
asse
ts
F56
F45
F34
F23
F12 F1 P1
P12
P23
P34
P45
P56
Years before/since death
Deceased: Prime-aged male
-1-.5
0.5
1R
elat
ive
asse
ts
F56
F45
F34
F23
F12 F1 P1
P12
P23
P34
P45
P56
Years before/since death
Deceased: Pension-aged female
-1-.5
0.5
1R
elat
ive
asse
ts
F56
F45
F34
F23
F12 F1 P1
P12
P23
P34
P45
P56
Years before/since death
Deceased: Pension-aged male
Relative asset holdings by age and sex of deceased and timing of death

43
Figure 5. Relative self-reported poverty by age and sex of deceased and timing of death
-.1-.0
50
.05
.1.1
5R
elat
ive
pove
rty
F45
F34
F23
F12 F1 P1
P12
P23
P34
P45
P56
Years before/since death
Deceased: Prime-aged female
-.1-.0
50
.05
.1.1
5R
elat
ive
pove
rty
F45
F34
F23
F12 F1 P1
P12
P23
P34
P45
P56
Years before/since death
Deceased: Prime-aged male
-.1-.0
50
.05
.1.1
5R
elat
ive
pove
rty
F45
F34
F23
F12 F1 P1
P12
P23
P34
P45
P56
Years before/since death
Deceased: Pension-aged female
-.1-.0
50
.05
.1.1
5R
elat
ive
pove
rty
F45
F34
F23
F12 F1 P1
P12
P23
P34
P45
P56
Years before/since death
Deceased: Pension-aged male
Relative self-reported poverty by age and sex of deceased and timing of death

44
Figure 6. Log odds of dying by age – all cause mortality in 2001 and 2009
-8-6
-4-2
0Lo
g od
ds o
f dyi
ng
0 20 40 60 80 100age in years
All cause 2001 All cause 2009
All cause mortalityLog odds of dying by age

45
Appendix Table 1. F-statistics and p-values on indicators of past and future death by residency status at time of death
Household Assets Poor or very poor
Past death Future death Past death Future death
Adult deaths 11.64
(0.000) 2.66
(0.014) 7.25
(0.000) 1.40
(0.221) Resident adult deaths
0.54 (0.781)
1.45 (0.192)
1.43 (0.199)
2.46 (0.031)
Appendix Table 2. Changes in household socioeconomic status following a resident member’s death
Change in
Number of assets owned
Number of assets owned
Change in Self-reported poverty
Self-reported poverty
Adult death between HSE survey rounds
−0.106** (0.054)
−0.181*** (0.047)
0.028* (0.015)
0.037*** (0.012)
Resident adult death between survey rounds
-0.083 (0.063)
-0.062 (0.056)
-0.005 (0.018)
0.021 (0.014)
Assets holdings lagged one HSE round -- 0.607***
(0.005) -- --
Poverty report lagged one HSE round -- -- -- 0.200***
(0.006)
Number of observations 44984 44984 35049 35049

46
Appendix Table 3. Household attrition between waves of the HSE module, HSE1 to HSE6
Among households that Fraction of households in which an adult died in the 12 months prior to the current HSE module from
Left surveillance
between HSE waves
Remained in surveillance
and seen in the next HSE wave
Significance of the difference between households who stayed and left
All causes 0.094 0.099 AIDS 0.042 0.050 ** Other chronic illness 0.018 0.014 ** Sudden death 0.031 0.034 Fraction of households in which an adult of the following type died in the 12 months prior to the current HSE module
Prime-aged female 0.039 0.039 Prime-aged male 0.037 0.044 * Pension-aged female 0.015 0.013 Pension-aged male 0.009 0.008 Number of household members 4.449 8.454 *** Number of resident household members 2.852 5.875 *** Total household assets 4.14 5.607 *** Self-reports poor or very poor 0.486 0.428 *** Observations 4499 46354
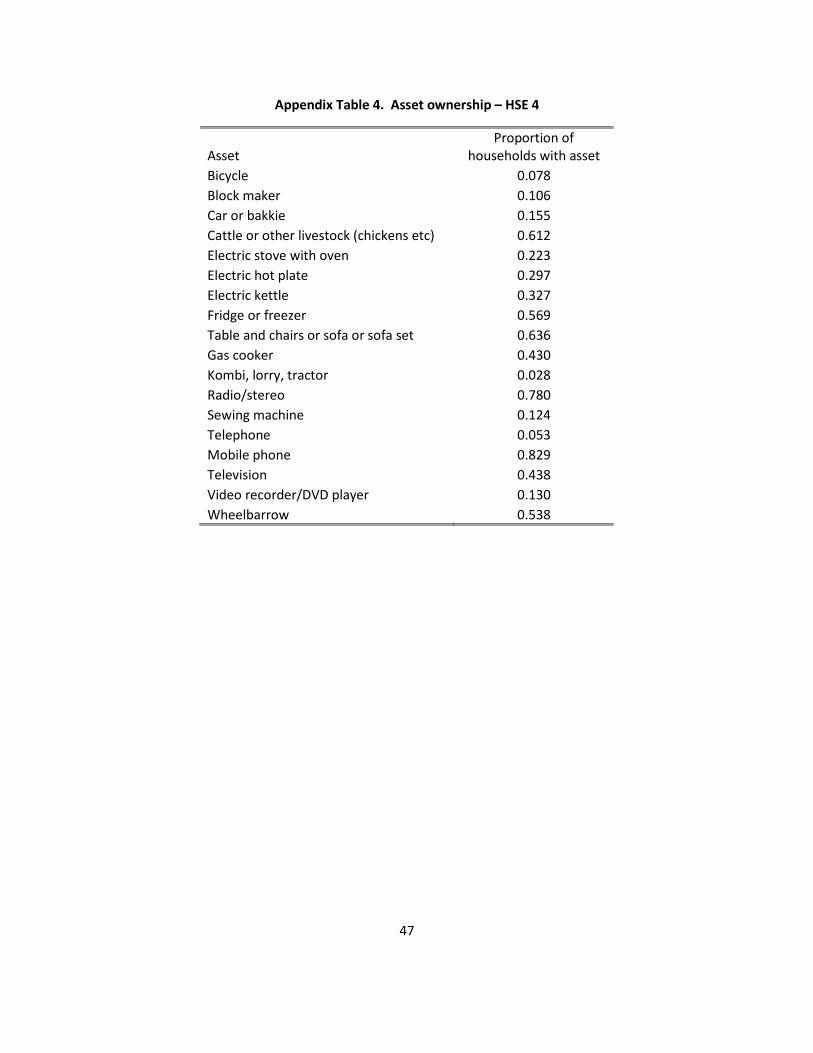
47
Appendix Table 4. Asset ownership – HSE 4
Asset Proportion of
households with asset Bicycle 0.078 Block maker 0.106 Car or bakkie 0.155 Cattle or other livestock (chickens etc) 0.612 Electric stove with oven 0.223 Electric hot plate 0.297 Electric kettle 0.327 Fridge or freezer 0.569 Table and chairs or sofa or sofa set 0.636 Gas cooker 0.430 Kombi, lorry, tractor 0.028 Radio/stereo 0.780 Sewing machine 0.124 Telephone 0.053 Mobile phone 0.829 Television 0.438 Video recorder/DVD player 0.130 Wheelbarrow 0.538