THE ECONOMIC CONSEQUENCES - European Commission
74
THE ECONOMIC CONSEQUENCES OF AGEING POPULATIONS (A COMPARISON OF THE EU,US AND JAPAN) K. MC MORROW & W. ROEGER* * The authors are economists in the Directorate-General for Economic and Financial Affairs (ECFIN) of the European Commission. Acknowledgements: The authors would like to thank A. Dramais and C. Denis for their valuable comments and assistance with this paper. Thanks is also extended to H. Rovers for her excellent secretarial help.
Transcript of THE ECONOMIC CONSEQUENCES - European Commission

THE ECONOMICCONSEQUENCES
OF AGEING POPULATIONS
(A COMPARISON OF THEEU,US AND JAPAN)
K. MC MORROW& W. ROEGER*
* The authors are economists in the Directorate-General for Economic and FinancialAffairs (ECFIN) of the European Commission.
Acknowledgements: The authors would like to thank A. Dramais and C. Denis for theirvaluable comments and assistance with this paper. Thanks is also extended to H. Roversfor her excellent secretarial help.

1
THE ECONOMIC CONSEQUENCES OFAGEING POPULATIONSA COMPARISON OF THEEU, US AND JAPAN
TABLE OF CONTENTS
I NTRODUCTION AND OVERVIEW
CHAPTER 1: DEMOGRAPHIC TRENDS AND FORECASTS1960-2050
1.1 Economic V Demographic Dependency Ratios
Box 1: A comment on Eurostat’s Population Projections for the EU 2000-2050
CHAPTER 2: HOW IS AGEING LIKELY TO IMPACT ECONOMICALLY : M AIN
TRANSMISSION CHANNELS
2.1 Public Finance Pressures2.2 “Life Cycle” Effects on Private Savings + Interactions between Public & Private
Savings Developments: The Role of Ricardian Equivalence in determining the finalimpact of Ageing on National Savings
2.3 Labour force implications of a rise in dependency ratios2.4 Potential impact on Capital Accumulation and on Technical Progress2.5 Interest Rate, Exchange Rate and Balance of Payments Effects
Box 2: Theories of Savings and the Dominance of the Life Cycle ParadigmBox 3: Modelling the Systemic Aspects of Demographic Change : The Quest IIApproach
CHAPTER 3: QUEST II C ENTRAL AGEING SCENARIO 2000-2050
Box 4: Wages, Labour Taxation and Unemployment Benefits : Economic Impact ofDifferent Assumptions regarding the Reservation Wage
CHAPTER 4: QUEST II POLICY SCENARIOS : EASING THE ECONOMIC
BURDEN OF AGEING IN THE COMMUNITY
4.1 Budgetary Prudence : The importance of Respecting the SGP4.2 Labour Market Reform : Raising Labour Force Participation Rates, Extending
Working Lifetimes and Lowering Structural Unemployment4.3 Promoting Productivity and Endogenous Growth4.4 Comprehensive Reforms Scenario4.5 Income Distribution Consequences of Ageing
CHAPTER 5: RESULTS OF COMPARABLE AGEING STUDIES
5.1 OECD Minilink Model Study of Global Consequences of Ageing5.2 IMF Study of G7 countries using the Multimod Model
SUMMARY AND CONCLUDING COMMENTS

INTRODUCTION AND OVERVIEW
Life expectancy, fertility rates and migration flows are the key determining factorsunderlying all population projections. Any objective assessment of the likelyevolution of these factors over the coming decades suggests thatageing of the EU,US and Japanese populations is an inescapable fact, due to the progressivelengthening in life expectancy and the fall in fertility rates to below the criticalthreshold levels required for generational renewal.
The share of elderly people in the overall population is presently of the order of 15percent in the EC, US and Japan. According to the latest demographic projections,this share is likely to almost double between now and 2050 in the case of the EU andJapan, while growing more modestly in the US to reach 21% at the end of the period.While the share of the elderly also grew over the last number of decades, increases upto the present time did not pose insurmountable problems because the population ofworking age was also growing rapidly and dependency ratios actually fell. This latterluxury of growing numbers entering the labour force, which governments could turnto in order to fund the additional pension and health care expenditures associated withan ageing population, is fast disappearing. Over the next half century, sharpincreases in dependency ratios are projected to emerge in all areas. Consequently,as a result of these twin developments, i.e. growing shares of the over 65s in thepopulation allied to declining numbers in the age groups which traditionallysupported the non-economically active age groups, “grey” pressure has ceased to betrivial, if it ever was so, in terms of its economic implications.
A lot of research has been carried out in various organisations either on the situationin individual countries or on specific age-related topics such as the impact of ageingon the public finances, on potential output, on private savings behaviour, etc. Whilethis work is vital and adds considerably to the ongoing debate, it suffers from itsinherently partial nature in that the importance of international linkages and the roleof systemic interactions and feedback mechanisms are inadequately catered for.These “general equilibrium” elements are crucial to providing a completeunderstanding of the likely impact of a global phenomenon such as ageing.
A model such as QUEST II, with its large geographical coverage, is able to provide asingle, internally consistent, framework for handling all the macroeconomic aspectsof the “greying” issue. QUEST’s consistent modelling of the various trade andfinancial linkages between economies, and especially between the Community’sMember States and the US and Japan, ensures that all dimensions of the problem canbe looked at including the crucial systemic issues, by definition excluded by partialanalyses, such as theequilibrating role played by interest rates and exchange ratesin determining the final, long-term, projections of the economic implications of thisphenomenon.
The paper is structured as follows. Chapter one provides the basic data in terms ofthe past and expected population trends, with the distinction being made betweendemographic and economic dependency ratios. Chapter two goes on to discuss, in apartial equilibrium framework, the main channels through which ageing will impact.The rival modelling approaches are also described and the relative merits of theOverlapping Generations Models (OLG) V the Quest II approach is discusssed. The

2
subsequent two chapters take the broad numbers from chapter one as well as theinsights from chapter 2 to provide a general equilibrium perspective on ageing usingthe Quest II model. Chapter three gives ano-policy-change assessmentof the impactof ageing, with the following chapter looking at a number of policy initiatives which,if adopted, wouldease the economic burden of ageingsubstantially, according to thesimulations carried out. In the last chapter, the results of two equivalent, age-related,modelling exercises are looked at, namely a 1998 analysis carried out by the OECDusing its Minilink model and an earlier 1990 analysis carried out by the IMF using itsMultimod model

3
CHAPTER 1: DEMOGRAPHIC TRENDS AND FORECASTS1960-2050
I NTRODUCTION : The present chapter examines past and projected populationtrends and assesses the implications of these latter trends for dependency ratiodevelopments. The essential feature to highlight regarding past and currentdevelopments is the extent of the demographic upheaval which has and is occurring,due to falling birth rates and lengthening life spans. As regards future projections,while uncertainties exist, especially regarding the evolution of fertility rates, one factappears indisputable namely that large increases in the share of the over 65s in thepopulations of the EU15, US and Japan will inevitably occur due to the fact that thepost-war baby-boom generations in the latter areas will be reaching the normalretirement age in the early decades of the next century. It is envisaged that thisageing process, leading to higher dependency ratios in all of the three regions, willhave major economic and social consequences for the countries affected, althoughaccurate predictions will be difficult given that nothing is available in terms ofhistorical demographic precedents.
An exhaustive analysis of past and expected population changes is beyond the scopeof the present paper. Consequently, following a short discussion of both the sourcesfor the population projections and on the potential errors attaching to such estimates,the analysis is confined to the dependency ratio implications of these populationtrends. This latter approach is driven by the need to focus the analysis on the maineconomic impacts of ageing and on providing an understanding of the essentialbackground material which is used in the simulations which are carried out in thesubsequent chapters.
DATA SOURCES AND QUALIFICATIONS : The population projections used for theanalysis draw on the UN’s long term, medium variant, projections for the US andJapan and on Eurostat’s equivalent baseline projections for the Community (see Box1 for a short commentary on the Eurostat projections). Both sets of projections coverthe period 2000-2050. The text below also includes references, where appropriate, todata covering the period from 1960 to the present time, in order to place the expectedtrends for the next 50 years in their proper historical context.
While the UN and Eurostat population projections appear realistic, with their mid-point estimates being based on a realistic examination of the most recent trends forthe key determining variables, it is nevertheless important for policy makers to beconscious of the potential inaccuracies which are involved. The usual warningstherefore apply to these projections, i.e. they are prone to the normal forecastingerrors, due in particular to unpredictable and sometimes substantial fluctuations infertility rates1 as well as the difficulty in predicting the impact of various social,economic and political factors in the determination of net migration flows.
1An interesting example of potential forecasting errors occurred in France in 1930 when Frenchdemographers made a 50 year population projection which forecasted, on the basis of an examinationof the consequences of World War I and the subsequent low birth rates of the 1920s, that the Frenchpopulation would only be 35 million in 1980 when in fact the population turned out to be over 50%larger at nearly 54 million. This forecasting error was essentially unavoidable since it resulted from a

4
Finally, while uncertainties clearly exist regarding long term demographic projectionsit is nevertheless important for policy makers to bear in mind that the outlook over theshort-term, i.e. over the next 20 years, is relatively certain with regard to the agecohorts which have potentially the greatest economic and budgetary implications overthat period. For example, excluding migration flows the prediction of which evenover relatively short periods of time remains problematic, the growth of the labourforce can be predicted fairly accurately over the next two decades since the bulk ofany new entrants to the workforce have already been born and likewise with thenumber of over 65s, given the relative stability of mortality rates, they can also bepredicted with reasonable confidence.
1.1 DEMOGRAPHIC AND ECONOMIC DEPENDENCY DEVELOPMENTS :TRENDS AND PROSPECTS
DEMOGRAPHIC DEPENDENCY Ratios: The level and structure of the Community’spopulation is being fundamentally transformed by those factors referred to earliernamely changes in birth rates, life expectancy and migration flows, the results ofwhich will be most felt in the early part of the next century. The Community is notalone in this regard with the US and Japan also equally affected.
A useful summary indicator of these demographic changes is the dependency ratio,which can be defined in a number of different ways depending on its intendedpurpose. One of the most commonly used ratios is the overall demographicdependency ratio, which is conventionally defined as the ratio of the “dependent” agegroups (0-14 and 65+) to the population in the working age groups (15-64). Thelatter ratio is expected to change dramatically over the next 50 years compared withpast behaviour.
Over the period 1960-1995 the overall dependency ratio actually fell in all 3 areas,with decreases in the proportion of young people more than offsetting the rise in theold age dependency ratio. These broad trends are expected to change dramaticallyover the next fifty years, with the overall dependency ratio expected to risesignificantly in all areas, with increases ranging from 15 percentage points in the caseof the US to 22 and 40 percentage points in the case of the EU and Japan respectively(Graph 1). These increases in the overall total reflect a broadly stabilising youth ratioand a sharp increase in the old age share of the total. As regard the latter old ageratio, in 1985, for example, the EU ratio of over 65s to those between 15-64 was 20%i.e. there were five potential workers for every one retired person. By 2050 that ratiois expected to deteriorate dramatically to only about two economically active workersfor every person over 65.
In terms of the relative timing of these latter changes, the one significant difference isthat Japan is forecast to experience the increase in dependency ratios roughly 10-15years before the EU and the US.
ECONOMIC DEPENDENCY RATIOS : A big problem with the demographic definition ofdependency, according to a wide range of commentators, is that it doesn’t accurately
pragmatic decision to extrapolate forward the most recent trends. Demographers could not have beenexpected to predict the recovery in fertility rates which actually took place.

5
Graph 1: Demographic Dependency RatiosEU, US and Japan
Total Dependency Ratio(1)
�
�
� �� �
�
� �
�
B BB
B B B BB
B B
19601970
19801990
20002010
20202030
20402050
0
0.2
0.4
0.6
0.8
1
�
�
��
�
�
�
��
�
B
B
B BB B B
B
B B
19601970
19801990
20002010
20202030
20402050
0
0.1
0.2
0.3
0.4
0.5
0.6
�
�
� �
��
� � ��
B
B
B
B B BB
B B B
19601970
19801990
20002010
20202030
20402050
0
0.1
0.2
0.3
0.4
0.5
0.6
Old Age Dependency Ratio(2) Youth Dependency Ratio(3)
Japan
Japan
Japan
EU
EU
EU
USUS
US
(1): Total Dependency Ratio = (Population under 14 or above 65) / (Pop. aged 14-64)
(2): Old Age Dependency Ratio = (Population above 65) / (Pop. aged 14-64)
(3): Youth Dependency Ratio= (Population under 14) / (Pop. aged 14-64)

6
Graph 2: Comparison of Economic andDemographic Dependency Ratios: EU, US and
JapanTotal Demographic Dependency Ratio
�
�
� �� �
�
� �
�
B BB
B B B BB
B B
19601970
19801990
20002010
20202030
20402050
0
0.2
0.4
0.6
0.8
1
�
�
��
� �
�
� �
�B
BB
BB B
B
B
B B
19601970
19801990
20002010
20202030
20402050
0
0.2
0.4
0.6
0.8
1
1.2
�
�
��
� �
�
� �
�B
BB
BB B B
B
B B
19601970
19801990
20002010
20202030
20402050
0
0.2
0.4
0.6
0.8
1
1.2
1.4
Potential Economic Dependency Ratio (1) Effective Economic Dependency Ratio (2)
Japan
JapanEUEU
USUS
(1): Potential Economic Dependency Ratio =
(Population under 14 or above 65) / (Labour Force)
(2): Effective Eonomic Dependency Ratio =
(Population under 14 or above 65) / (Employment)
US
EU
Japan

7
reflect the economic burden on the active proportion of the population of working ageand in particular on those actually in employment since it is only those who are inemployment which are financing government transfers to the non-active population.
It is clear that this latter “economic” dependency burden on current labour income ismuch heavier for regions or countries with low employment rates. This is particularlythe case with the Community where the demographic dependency ratio in 1995 was49% but the economic dependency ratio (defined as the total of the 0-14 and the 65+age groups as a proportion of the overall numbers employed) was as high as 85%(Graph 2)2.
It is also evident that divergences between the Community, the US and Japan in termsof participation rates and employment rates are much larger than the differences indemographic structure and these differentials are reflected in the respective ratios.The Community’s demographic and economic dependency ratios of 49% and 85%,for example, compare with a demographic dependency ratio in the US which is notthat different (53%) but with an economic dependency ratio which is very different(75%). As regards Japan the 1995 demographic ratio is again not radically differentat 44% but the economic dependency ratio is, in fact, a further 16 % points lower thanthat in the US, being consequently 26 % points lower than here in the Community.These 10 and 26 % points differences in the transfer burden facing US and Japaneseversus EU workforces, which must of course at some point reflect itself either inhigher taxes / social security contributions in order to finance the additional transfersor in a lowering of benefit payments to recipients, emanates from the fact that thefinancing of the ageing burden is spread over a greater number of workers in the USand Japan because of the higher labour force participation rates and lowerunemployment rates compared with here in Europe.
FUTURE EVOLUTION OF DEPENDENCY RATIOS : Under Eurostat’s baseline scenario,the EU’s overall population is expected to fall slightly over the next 50 years from372 million in 1995 to an estimated 367 million in 2050. In addition to the fall innumbers, a significant ageing of the population is also predicted, with the old agedependency ratio (i.e. over 65s as a proportion of the working age population)expected to almost double, rising by 24 percentage points from 23% in 1995 to 47%in 2050. The economic dependency ratio or ageing burden3, measured in this case asthe ratio of the over 65s to the employed population, displays an even greaterincrease, rising by a massive 39 percentage points from 85% in 1995 to 124% in2050. In the case of the US and Japan the situation in the latter country appears morealarming with an increase in the economic dependency ratio of 57 percentage pointscompared with less than 20 points in the case of the US.
2 As regards economic dependency, it is important to highlight the relative positions of the individualMember States. As stated in European Economy (1994) « the differences between Member Statesbecome considerable since their divergence in terms of activity rates and employment rates are muchlarger than the differences in age structure and the economic dependency problems will be muchheavier in countries with low employment rates. This may be illustrated by the respective positions ofGreece, Spain, France and the United Kingdom where demographic dependency is practically the same(54 to 55.5%) but where the economic dependency with respect to employment ranges from 82.7 to118.1%. »3 The economic dependency ratio calculations assume that the employment and unemployment ratesremain invariant over the forecast horizon.

8
When one looks at the actual numbers involved one can see quickly the magnitude ofthe challenge to be faced by the EU, US and Japan. Over the past 35 years thenumber of people aged 65 and over in the 3 areas combined increased by roughly 53million. This, however, did not pose any major economic problems since theworking age population rose by substantially more (138 million) and easily supportedthe additional economic burden. The next 50 years will see a dramatic turnaround inthese numbers, with the number of over 65s growing by an additional 92 million butwith the working age population actually declining by 41 million. On the basis ofthese latter absolute numbers one can more readily comprehend the daunting natureof the challenge which this ageing burden places on the economic systems of therespective geographical areas.

9
TABLE 1: POPULATION TRENDS: 1960-1995
1960 1995US Japan EC15 US Japan EC15
AgeTotals and Age Structure (Millions + % of Total)
0-14 56 28 78 59 20 66
(% ofTotal)
(31) (30) (25) (22) (16) (18)
15-64 108 60 205 174 87 249
(% ofTotal)
(60) (64) (65) (65) (70) (67)
65+ 17 6 33 34 18 57
(% ofTotal)
(9) (6) (10) (13) (14) (15)
TotalPopulation
181 94 316 267 125 372
Source: DGII
Dependency Ratio DevelopmentsA: Demographic Dependency Ratios
Youth Old-Age Total
1960 1995 1960 1995 1960 1995
EU15 0.38 0.26 0.16 0.23 0.54 0.49
US 0.52 0.34 0.16 0.19 0.68 0.53
Japan 0.47 0.23 0.10 0.20 0.57 0.44
B: Economic Dependency Ratios
Potential Economic Dependency(0-14+65s+)/Active Population
Effective Economic Dependency(0-14+65s+)/Active Employment
1960 1995 1960 1995
EU15 0.85 0.75 0.88 0.85
US 1.04 0.69 1.11 0.75
Japan 0.75 0.57 0.77 0.59

10
TABLE 2: POPULATION PROJECTIONS: 2000-2050
2000 2050US Japan EC15 US Japan EC15
AgeTotals and Age Structure (Millions + % of Total)
0-14 59 19 64 65 17 52
(% ofTotal)
(21) (15) (17) (19) (16) (14)
15-64 184 86 252 209 59 214
(% ofTotal)
(66) (68) (67) (60) (54) (58)
65+ 35 21 61 74 33 101
(% ofTotal)
(12) (17) (16) (21) (30) (28)
TotalPopulation
278 126 377 348 110 367
Source: UN and Eurostat
Dependency Ratio DevelopmentsA: Demographic Dependency Ratios
Youth Old-Age Total
2000 2050 2000 2050 2000 2050
EU15 0.26 0.25 0.24 0.47 0.50 0.72
US 0.32 0.31 0.19 0.35 0.51 0.66
Japan 0.22 0.29 0.24 0.57 0.46 0.86
B: Economic Dependency RatiosPotential Economic Dependency(0-14+65s+)/Active Population
Effective Economic Dependency(0-14+65s+)/Active Employment
2000 2050 2000 2050
EU15 0.75 1.09 0.85 1.24
US 0.66 0.86 0.72 0.93
Japan 0.61 1.13 0.63 1.16

11
BOX 1: A COMMENT ON EUROSTAT’SPOPULATION PROJECTIONS FOR THE
EU
Reflecting the uncertainties of long-term population projections, Eurostat’s latest(1996) forecasts for the EU countries provide both « high » and « low » scenariosas well as a baseline (effectively a mid-point projection) scenario. It is the latterbaseline scenario which is used for the simulations carried out in the main text.
POPULATION PROJECTIONS FOR THE EU : EUROSTAT’S BASELINE,HIGH AND LOW SCENARIOS
The key underlying assumptions and the associated population projections to 2050for the three scenarios are given below in Table 3 and Graph 3 respectively. Thebaseline scenario projects a small decline in the EU’s population over the forcastperiod from 377 million in 2000 to 367 million in 2050. This compares withprojections of 303 million and 444 million in 2050 for the low and high scenariosrespectively. From the latter overview figures and an analysis of the underlyingassumptions one can see quickly the considerable degree of uncertainty attachingto population projections with small differences in key population parameterassumptions cumulating quickly over the long periods considered.
Graph 3: Demographic Projections EU15 2000-2050
250
300
350
400
450
500
20002005
20102015
20202025
20302035
20402045
2050
Mill
ions
LOW
BASELINE
HIGH

12
TABLE 3 : KEY UNDERLYING ASSUMPTIONS : FERTILITY RATES, LIFEEXPECTANCY AND MIGRATION FLOWS
2000 2025 2050
FERTILITY RATE
Low 1.40 1.44 1.45
Baseline 1.55 1.66 1.66
High 1.75 1.95 1.94
LIFE EXPECTANCY-MALES
LOW 73.9 75.5 75.8
Baseline 74.7 78.4 79.7
High 75.5 81.0 82.7
LIFE EXPECTANCY-FEMALES
Low 80.5 81.9 82.2
Baseline 81.1 84.1 85.1
HIGH 81.7 85.7 86.9
NET MIGRATION
(X 1000)Low 411 396 396
Baseline 679 592 592
High 1010 788 788
.
TRENDS IN RELATION TO THE KEY I NFLUENCING FACTORS1960-1995: To give someidea of the basis on which the various population assumptions have beencalculated, the underlying forecast assumptions given in the table above for theperiod 2000-2050 can be compared with the actual developments which occurred infertility rates, life expectancies and migration flows over the period 1960-1995.
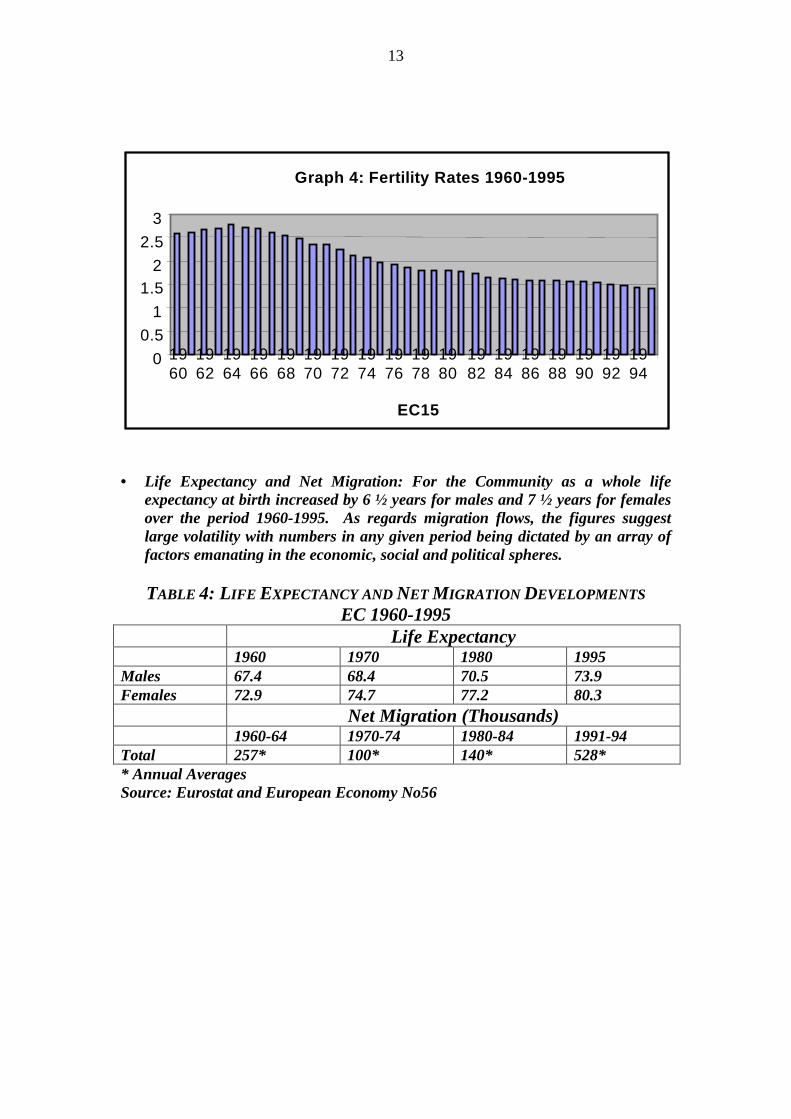
• Fertility Rates: As regards birth rates, the high rates in the immediate post-warperiod moderated quickly, with fertility rates in the EC as a whole falling to 2.6in 1960, 1.8 in 1980 and to an average of less than 1.5 in the present decade,which is far below the rate of 2.1 needed simply to maintain a stable populationover time. The present EC fertility rates are similar to those pertaining inJapan and compare with rates of 2.0 in the US. These fertility rate changesover the last 50 years have created a spiked population distribution, the effectsof which are now starting to manifest themselves.
13
• Life Expectancy and Net Migration: For the Community as a whole lifeexpectancy at birth increased by 6 ½ years for males and 7 ½ years for femalesover the period 1960-1995. As regards migration flows, the figures suggestlarge volatility with numbers in any given period being dictated by an array offactors emanating in the economic, social and political spheres.
TABLE 4: LIFE EXPECTANCY ANDNET MIGRATION DEVELOPMENTS
EC 1960-1995Life Expectancy
1960 1970 1980 1995Males 67.4 68.4 70.5 73.9Females 72.9 74.7 77.2 80.3
Net Migration (Thousands)1960-64 1970-74 1980-84 1991-94
Total 257* 100* 140* 528** Annual AveragesSource: Eurostat and European Economy No56
Graph 4: Fertility Rates 1 960-1995
0
0.5
1
1.52
2.5
3
1960
1962
1964
1966
1968
1970
1972
1974
1976
1978
1980
1982
1984
1986
1988
1990
1992
1994
EC15

14
CHAPTER 2:HOW IS AGEING LIKELY TO
IMPACT ECONOMICALLY
As stressed in Chapter one, the next 50 years will witness a significant increase inageing in the EU, the US and Japan, with the number of people aged 65 and overlikely to grow significantly according to the most plausible scenarios (Table 5). Suchan unprecedented phenomenon raises serious questions as to its implications for thepublic finances, and in particular for the sustainability of the present old age PAYG(Pay-as-you-go) pension system, for private savings behaviour, for the evolution oflabour productivity and for the outlook for potential growth and living standards ingeneral4.
TABLE 5 : SHARE OF OVER 65S IN TOTAL POPULATION (%)1960 2000 2050
US 9.2 12.4 21.2Japan 6.1 16.5 30.4EC15 10.6 16.1 27.6
How is ageing likely to impact: Ageing is expected to operate through the followingmain channels:• Expenditure Pressures on the Public Finances• “Life Cycle” Effects on Private Savings Behaviour+Ricardian Equivalence
Effects• Labour Supply Implications• Potential Impact on Capital Accumulation and Total Factor Productivity• Equilibrating role for Interest Rates and Exchange Rates and shifts in External
Balances
2.1- EXPENDITURE PRESSURES ON THE PUBLIC FINANCES
Despite the normal uncertainties associated with all population projections, the broadthrust or pattern of demographic change is already largely determined for the next 50years, with ageing being a significant feature of these changes, and with publicexpenditure pressures being intense in those areas of public budgets, such as healthand pensions spending, which are linked to life cycle developments.
Ageing is consequently expected to result in substantial increases in age-relatedpublic expenditures5. Furthermore, and equally worrying, if past experience isanything to go by, Governments are going to have difficulty even keeping theirpension and health care budgets to the, already rather large, percentage pointsincreases which will emanate from purely demographic factors. The reason for thislatter difficulty derives from the fact that, despite the relatively favourabledemographics operating at present in terms of the public finances, health and pension
4 Ageing, of course, will raise a host of more microeconomic issues which are not directly addressed inthe paper such as the impact of ageing workforces in terms of labour mobility, both geographical andoccupational, as well as internal occupational mobility i.e. the role of seniority rules in companies inreducing the opportunties for rapid promotion of younger workers etc.5 These increases are discussed in detail in Chapter 3.

15
expenditures as a % of GDP have been rising steadily over the last number ofdecades. In fact, the Transfers to Households category (i.e. Social Benefits), of whichpensions and health are major components, has accounted for nearly two-thirds of theincrease in the total Government expenditure to GDP ratio in the Community since1970. Pensions and health care expenditure combined represents roughly 1/3 of allGovernment expenditure.
Graph 5: Total Government Expenditure in the EUand its Components 1970-1995
Source: Eurostat
35.6%
48.5%
1970 19950%
10%
20%
30%
40%
50%
60%% of GDP
Capital Exp.Subsidies
Social Benefits
Interest Payments
Current Direct Exp.
Capital Exp.Subsidies
Social Benefits
Interest Payments
Current Direct Exp.
TABLE 6: GOVERNMENT EXPENDITURE TRENDS IN THE EU 1970-1995 (%OF GDP)1970 1980 1990 1995 Change
1970-95Current Direct Exp 11.8 14.0 14.0 13.7 1.9Interest Payments 1.9 3.0 4.7 5.4 3.5Social Benefits 13.5 17.8 18.5 21.7 8.2Subsidies 1.6 1.9 1.8 1.7 0.1Capital Exp. 5.7 4.7 4.4 3.9 -1.8Total Gov. Exp. 35.6 42.8 45.3 48.5 12.9
Favourable demographics at present in terms of the public finances: In overallterms, the public finances are at present probably benefiting from demographicdevelopments, with low birth rates over the last number of decades tending to reducegovernment expenditures, allied to the fact that the large post World War II « Baby-Boom » generation is at the height of its earning power and contributing strongly onthe revenue side. This is probably giving governments a sense of complacency whichis inhibiting the taking of the necessary reforms which will inevitably be forced oncountries once the demographics start to change radically in about 10 years time.

16
Health and Pension Reform will not be easy: It is important to stress the scale ofthe task facing governments in relation to controlling health and pension expenditureover the next 50 years. As shown in Table 6, over the last 35 years, increases in theseexpenditures have been the main culprits in explaining the inexorable rise in the shareof government expenditure in GDP but only a small proportion of these pressurescame from ageing effects�• In the case of pensions, according to the OECD (1988), only 25% of the increase
in the pension expenditure to GDP ratio between 1960 and 1985 can be explainedby movements in the old-age dependency ratio with the remainder due to non-demographic factors such as increased benefits and a widening in eligibility,associated with the general expansion of the welfare state during the 1960s and1970s.
• Ageing of the population has an obvious significance for publicly run “Pay-as-you-go” (PAYG) pension systems. Policymakers have realised for some timenow that deficits on the PAYG system would quickly reach unsustainable levels ifno changes were introduced in terms of both benefits and contribution rates. Suchpolicy changes are being introduced since governments realised that excessivereliance on increased social security contributions would have meant that thefinancing burden on the future working population may have provoked a negativeresponse in terms of labour supply. Consequently, action on the benefits side hasbeen taken in many cases with the implication that a large proportion of thepresent working population face the prospect of either less generous pension pay-outs or longer working lifetimes than previously planned for. While reforms havebeen enacted in a large number of countries, given the scale of the ageingphenomenon, it is accepted that pension expenditure as a % of GDP will stillinevitably rise over the next 50 years, placing a heavy burden on national budgets.
• In the case of health care, Oxley and MacFarlan(1994) have estimated that“demand side effects associated with population ageing, increased incomes andincreased insurance coverage may explain only a portion - probably under half -of overall expenditure growth. This leaves a large residual which to a significantextent may be attributable to developments affecting the provision of healthservices”.
Overall, therefore, when one realises that the demographic pressures are likely todouble in the Community (the old age dependency ratio will rise from 24% to 47%),one sees the looming crisis if the non-demographic factors are also not tackled in anyreform process. In this regard, while in the case of pensions the phase of extension ofcoverage as well as the constant enhancing of benefit pay-outs would appear to beover, health care reforms would not appear to have gone as far.
Education Expenditure: The essential point to be made here is that the hoped-forspending reductions, reflecting the falling share of the younger age groups in theoverall population, is not expected to materialise. This lack of proportionalitybetween numbers and expenditures in essence reflects the large fixed cost elementendemic to all public education systems. Consequently the hoped for offset to higherpension and health care expenditure will not, it appears, be forthcoming, with in factthe projections for broad stability in the education expenditure to GDP ratio beingtypical of each of the three geographical areas.

Graph 6: Overview of Public Expenditure on Education, Health and Pensions in the EU, US and Japan
Source: OECD
35955371
40655277
68124465
7236
16262
8768
�
�
�4.9% 5%
3.6%
EU15 US Japan0%
1%
2%
3%
4%
5%
6%% of GDP
0
5000
10000
15000
20000Annual public expenditure per student per year (equivalent US $)
TOTAL (% GDP) per student in primary education
per student in secondary education per student in tertiary education�
A. 1995 Public Expenditure on Education in the EU, US and Japan
6.7%
4.6%3.8%
7.8%
5.2% 5.0%
EU US Japan0.0%
2.0%
4.0%
6.0%
8.0%
10.0%% of GDP
1980 1992
B. Public Expenditure on Pensions in the EU, US and Japan*
* Public Expenditure on Old Age Cash Benefits
1960 1965 1970 1975 1980 1985 1990 19950%
1%
2%
3%
4%
5%
6%
7%
8%% of GDP
United States Japan EU
C. Public Expenditure on Health in the EU, US and Japan
83.7% pop. 87.3% pop. 86.5% pop.
16.3% pop. 12.7% pop. 13.5% pop.
62.2% H. Exp. 62.8% H. Exp.57.1% H. Exp.
37.8% H. Exp. 37.2% H. Exp.42.9% H. Exp.
EU US Japan
100%
Popu
lati
on
100%H
ealthE
xpenditure
Population aged over 65
Population aged 0-64
D. Concentration of Total Health Expenditure on the Elderly(1993)*
*: EU average based on data for Germany, France, UK, Finland, the Netherlands, Portugal and Sweden

2.2- “L IFE CYCLE ” EFFECTS ON PRIVATE SAVINGS BEHAVIOUR
Demographic change and private savings behaviour: Crucial to any analysis of thelikely economic impact of an ageing population is its impact in terms of saving rates.Ageing populations, for example, would be expected to result in a lowering of theprivate savings ratio if the savings pattern of consumers was to comply with thetraditional “life cycle” hypothesis (See Box 2). Life-cycle (LCH) models of savingsbehaviour suggest that an important component in determining the aggregate savingrate is a population’s demographic profile, with savings propensities and the overalldependency ratio expected to be negatively correlated. Inter-temporal considerationsprovide the intrinsic analytical underpinning of such models with the objective of theaverage consumer being to even out consumption over a lifetime in which incomefluctuates substantially depending on age, i.e. the notion of consumption smoothing.Under this view of the world, the savings rate would be expected to be high when alarge proportion of the population is employed, with savings being built up to financepost-retirement consumption. Likewise, the savings rate should be lower when a largepercentage of the population is very young or is over the retirement age.
While theoretically the link between aggregate saving rates and dependency ratios inLCH-type models is clear, unfortunately the empirical supporting evidence is moreheterogeneous. In a recent review of the empirical evidence, Meredith (1995)concluded that the data source used impacts significantly on the results obtained, withstudies based on micro-economic or macroeconomic, time-series or cross-section data,producing widely divergent estimates of the responsiveness of the savings ratio tochanges in the dependency ratio.
In overall terms, Meredith suggests that the forecasts of the life cycle model in relationto demographics and savings is generally supported by the evidence derived fromaggregate data, with changes in the elderly dependency ratio having a greater effect onsavings patterns compared with the youth dependency ratio (see Table 7). Anunweighted average of the estimated coefficients shows the savings rate falling by 0.86and 0.61 of a percentage point for every 1 percentage point increase in the elderly andyouth dependency ratios respectively. Effects on the aggregate savings rate of thisorder of magnitude, in the absence of changes to the other major determinants ofhousehold savings, would undoubtedly represent a significant response to the projectedshifts in the demographic structure of the EU, Japan and US.
However, it should be noted that while most econometric studies do discover asignificant and numerically important association between demographic variables andaggregate saving rates, other studies using household survey evidence challenge thatview and suggest that any effects on the saving rate may be negligible. In addition tothis survey evidence, the results of studies such as that by Masson, Bayoumi andSamiei (1995)6, which derives both time series and cross-section estimates, suggeststhat although demographics are important determinants of private savings rates, thesize of the dependency ratio effect is lower than that found in the above series of
6 This study on the international evidence regarding the determinants of private saving, concludes thatincome growth, real interest rates and demographic effects are important determinants of private savingrates. In addition, changes in the fiscal position of governments are found to be substantially offset, byan average of 60%, by changes in private savings behaviour. Population ageing would therefore appearfrom this study to be an important determinant of, and impact negatively on, private savings rates.

19
studies quoted by Meredith, with a 1% point increase in the dependency ratio leading,according to Masson et al, to a reduction of only 0.14% in the private savings ratio ofindustrial countries. In deference therefore to the downward direction of the mostrecent evidence, it appears prudent to move to the lower end of the various estimates.This is also the approach adopted in the OECD’s (1998) paper on ageing whichincorporates a coefficient of 0.3 for its model simulations.
TABLE 7 SUMMARY OF STUDIES ON DEMOGRAPHICS AND SAVING(Figures in parentheses are estimated t-statistics)
EFFECT ON SAVING RATE OF 1 PERCENTAGEPOINT RISE IN THE DEPENDENCY RATIO
YOUTH ELDERLY
AGGREGATE CROSS-SECTION STUDIES
1. Modigliani (1970) -0.20(3.7)
-0.88(3.1)
2. Modigliani and Sterling(1983) -0.13(1.4)
-0.51(4.3)
3. Feldstein (1980) -0.77(3.9)
-1.21(2.7)
4. Horioka (1986) -0.92(4.2)
-1.61(4.0)
5. Graham (1987) -0.87(2.9)
0.12(0.3)
6. Koskela and Viren (1989) -0.73(1.7)
-0.76(0.8)
7. Horioka (1991) -0.44(1.7)
-1.09(2.4)
8. OECD (1990) … -0.93(2.4)
TIME -SERIES STUDIES
9. Shibuya (1987) … -0.34(3.8)
10. Horioka (1991) -0.30(5.1)
-1.13(3.7)
11. Masson and Tryon (1990) -1.10 -1.10
UNWEIGHTED AVERAGE OF THE ABOVE
ESTIMATION RESULTS -0.61 -0.86HOUSEHOLDDATA STUDIES
Hayashi, Ando and Ferris (1988)Bosworth, Burtless and Sabelhaus(1991)
These studies question the applicabilityof the life-cycle model on the basis of theobserved saving behaviour of the elderlyin household data1
Source: Meredith (1995)1. Meredith concludes in relation to these household data studies “By using more recent and detailed information on the incomeand consumption of retired households, the analysis has shown that the savings rates for the elderly calculated in some householdlevel studies may be misleading. It appears that the elderly do dissave, and that the rate of dissaving is very similar to thatpredicted by a life-cycle model of household behaviour”.

20
Box 2: Theories of Saving and the Dominance of the Life CycleParadigm
THEORIES OF SAVINGS: A wide variety of motives for household saving have been putforward in the theoretical literature. For convenience purposes these motives can begrouped together into essentially three theories of savings with, as one wouldintuitively expect, assumptions about an individual’s time horizon being one of theessential differences between the competing hypotheses.• The life cycle model assumes that an individual’s time horizon is their own
lifetime and that their utility hinges solely on their own consumption. The desireto smooth one’s lifetime consumption path by evening out normal cyclicalincome fluctuations provides the fundamental motive for saving/dissavingsduring different periods of one’s life, with the need to provide sufficientresources for retirement being the clearest example of these life-cycle effects. Inthe most normal formulation of the life-cycle hypothesis, the lifetime planninghorizon of the individual consumer, combined with the expected proportionalitybetween consumption and permanent income, ensures that no net lifetimesavings are planned with transfers to heirs only being equivalent to their owninitial inheritance.
• The bequest model assumes that an individual’s time horizon is multi-generational with strong ties linking current generations to their descendantsand with individuals driven to maximize not only their own utility but also that offuture generations through a bequest motive. Unlike the “finite” life cycleconsumers therefore, the “Ricardian” variety are assumed to have “infinite”lives in the sense of having strong links to their descendants via the abovementioned bequest motive.
• The precautionary or “buffer stock” theory of saving is built on the view that amajor motive for holding and accumulating assets is to shield one’s consumptionagainst future uncertainties, such as unpredictable fluctuations or disruptions inincome or extraordinary health expenditures. One of the intuitive implicationsof this “buffer stock” model is that individuals with higher income uncertaintyshould amass a greater stock of wealth to allow for this.
DOMINANCE OF THE LCH APPROACH: In terms of the empirical modelling ofconsumer behaviour, especially in the larger multinational models, the substantialdegree of acceptance of the permanent income7/life cycle approach(PIH/LCH)° isevident, with virtually all mainstream models emphasising the importance offorward looking consumers and consumption smoothing to reflect the smoothness ofpermanent income changes. The success of the PIH/LCH approach was not onlybuilt on its solid grounding in microeconomic utility maximising theory but also onits empirical explanatory power being consistent, as it was, with both the short-runand long-run evidence. Over the long-run, it suggested that wealth (i.e. permanentincome) was the main determining factor in terms of consumption and that theconsumption to wealth ratio was a stable one. As regards the short-run itencompasses the Keynesian approach by explaining why over the business cycleconsumption fluctuates less than disposable income as a result of consumption
7 The life cycle hypothesis is similar to the Permanent Income Hypothesis in that in both cases consumption is a constantproportion of income.

21
smoothing by consumers – which has the effect of evening out consumption in theface of fluctuating income.
While the present dominance of the LCH view is not in doubt, it is not without itsdetractors. Criticism has been focussed on a number of fronts, including theempirical evidence provided by household survey data which, as mentioned in thetext, suggests that the savings behaviour of retired people is very different to thatpostulated in the LCH view8. More fundamentally, the LCH view fails in the mindsof a growing number of researchers, including Deaton (1992) and Carroll (1997), toadequately address the issue of income uncertainty and the “buffer-stock” view ofsavings. While theoretically if all consumers were highly rational and forwardlooking and operated in a situation of perfectly functioning financial markets theywould be able to borrow and lend freely and smooth their lifetime consumptionpatterns. In reality, a substantial proportion of consumers would not appear tofunction in this “perfect foresight” way for a variety of reasons including:• Firstly, uncertainty concerning future wealth calculations and income flows
make people subscribe to more risk averse or precautionary types of behaviour.• Secondly, a large proportion of consumers act in a simpler, less forward-looking,
fashion than theory would suggest with many using simple rules of thumb, suchas monitoring “buffer” stocks of liquid assets.
While the above criticisms are entirely valid, most modellers still retain the life cycleassumption since the empirical support for the LCH view remains considerable. Asshown in table 7 in the text, which summarises the results of various, cross-country,studies on the link between demographics and saving, the evidence strongly supportsthe existence of a negative effect on savings of increases in the old-age dependencyratio. In addition, most “working” versions of LCH type models have also taken onboard the results of the above empirical research indicating the presence ofsubstantial liquidity constraints on consumption, with its implication that aggregateconsumption responds to changes in current income as well as in permanentincome. Consequently, most modern models distinguish two types of consumers, theforward looking or wealth constrained variety who smooth their consumption profilein accordance with the life cycle hypothesis and the liquidity constrained orbackward looking variety who are restricted to their current incomes in terms oftheir purchasing patterns.
8 Meredith’s skepticism, referred to earlier, on the results of household survey data is supported byMiles (1999) who stresses the role played by PAYG pension systems in the results obtained. Milesstates « What the numerical examples and the empirical studies suggest is that failure to measurepension wealth correctly can have a major impact on estimates of saving, especially for theelderly……in principle mis-measurement of pension income could account for the strikingdiscrepancy between what life cycle models imply about the age/saving relation and estimates ofsaving rates by age that are derived from looking solely at household data in isolation frominformation on the value of funds that back pensions. The reason is that for those contributing to afunded scheme pension wealth conforms exactly to the simple life cycle pattern; it is steadily built upduring the working life and is run down in retirement »

22
NATIONAL SAVINGS DEVELOPMENTS AND THE ROLE OF RICARDIAN EQUIVALENCE
A crucial issue to be addressed in terms of the economy-wide growth effects of ageingis the assumptions to be made regarding the national savings implications (i.e. the sumof public and private savings) of increased, age-related, public expenditures. Whilelife-cycle effects look likely to ensure that ageing populations will mean a reduction inprivate savings in the future and public dissaving is likely to increase on the basis ofunchanged policies, ascertaining the national savings implications is not simply amatter of aggregating together the separate effects because that would ignore theexistence of potentially important interactions between private and public savings.
• Firstly, will public savings deteriorate by an equivalent amount to that ofthe expenditure increase, i.e. is it reasonable for simulation purposes toassume that non-age related public spending, as well as governmentrevenue sources, remain unchanged in GDP terms;
• Secondly,is it reasonable to postulate that private savings behaviour willremain aloof to developments at the public level, which of course wouldmean that the Ricardian equivalence or debt neutrality hypothesis isdeemed irrelevant.
As regards the first point, stability assumptions regarding the non-age related share ofoverall public expenditure can be deemed legitimate given the objectives of the presentexercise, one of which is to single out the demographic factors influencing nationalbudgets, in order to assess the extent of the supplementary, age-related, budgetaryadjustments which are likely to be imposed.
Graph 7 : National Saving in the Community
Source: Eurostat
1960 1965 1970 1975 1980 1985 1990 199515%
17%
19%
21%
23%
25%
27%
29%
Total National Saving
Private Saving
Negative Public Saving
Positive Public Saving

23
The presumption regarding the private savings / national savings implications,however, flies in the face of the bulk of the empirical evidence. Views differ regardingdebt neutrality and the potency of these interactions, with a strict application of theRicardian equivalence hypothesis implying that overall national savings would beunaffected since any decline in government savings would be fully offset bycompensating movements in private savings, since private agents would realise thefuture tax implications of such a change at the public level. Empirical evidence tosupport the contention for full Ricardian equivalence (Seater, 1993) is less widespreadthan those studies which suggest a partial Ricardian offset of about half (Bernheim(1987); Hague & Monteil (1989); Schmidt-Hebbel et al. (1992); Masson et al (1995).Some of these latter studies suggest that the degree of reciprocity between governmentand private savings developments is likely to be heightened in the event that individualcountries are faced with adverse or indeed explosive debt dynamics.
2.3 : LABOUR FORCE I MPLICATIONS OF A RISE IN DEPENDENCY RATIOS
Any assessment of the likely burden to be imposed due to ageing must take cognizanceof the future shape of Community labour markets. If the latter were to continue toshow characteristics similar to those prevailing today, such as high unemploymentcombined with low activity rates, the additional burden, in the form of increased taxesand social security contributions, imposed on the working population by the increase independency ratios, would be likely to generate considerable disincentive effects interms of labour supply and work effort. Furthermore the budgetary situation wouldquickly become unsustainable in the absence of fundamental reforms to the present“pay-as-you-go” pension system, with the possibility of initiating the transition phaseto a fully funded pension system also appearing more remote in the absence of labourreforms.
As shown in the labour market simulations in Chapter 4, employment reforms alongthe lines laid down in the recent employment guidelines would be expected toconsiderably relieve the economic pressure of ageing through unemploymentreductions and the achievement of activity rates comparable to those in the US andJapan. These scenarios suggest that the negative impact on Community livingstandards could be almost totally offset by the implementation of these labour marketreforms alone. However, as the discussion in the following paragraphs on labour forceparticipation rates makes clear, such a favourable response from the labour marketwould, of course, only be forthcoming in the event of a comprehensive reformpackage, including taxation and social welfare reforms, being agreed to and set inplace at the national and Community levels.
The decision to retire early and its effect on labour force participation rates: Tworecent studies have examined the impact of tax and benefits system incentives on theearly retirement decision making process. In a 1997 NBER Working Paper, Gruberand Wise present evidence of substantial cross country differences in terms of labourforce participation rates of the older age groups, with particularly high levels ofwithdrawals in European labour markets compared with the US and Japan, linked todifferences in the treatment of taxes and benefits. Replacement ratios of close to 70percent, at the official retirement age, were found in the EU, compared with around 40percent and 55 percent in the US and Japan respectively. In addition, Gruber and Wise

24
calculated that in the year immediately after eligibility for early retirement, the implicittax rate on earnings was about 80 percent in several EU Member States (France, Italy,UK and Belgium) compared with rates of zero in the US and less than 50 percent inJapan.
In a separate OECD study, Blondal and Scarpetta (1998) also examined this issue ofthe role of social security systems in negatively impacting on the participation rates ofolder workers. The provisions of old age pension systems and the sharp increase sincethe 1960’s in the implicit tax on continuing to work after the age of 55 has made itfinancially unattractive to work beyond that age. These financialdisincentives/penalties to continued labour force participation have been magnified bythe introduction of different types of early retirement schemes in many countries,including disability and unemployment-related programmes. All these actions haveresulted in a marked decline in the participation rates of older workers since the mid1970’s, with Europe being particularly badly affected. Blondal and Scarpetta estimatethat in those Member States with particularly large distortions in their present systems,that the participation rates for 55-64 year olds could be increased by 8-9 percentagepoints or even more if the disincentives to work for this age group were to be removed.For the remaining Member States, participation rates could increase by between 4-6percentage points, with the US and Japan gaining by less than 4 percentage points.
Graph 8 : EU-15 Employment as a percentage of the 14-64 Population Age Cohort
Source: Eurostat
�
�
��
� �
�� � � �
�
�
�
�� �
��
�
�
� �
�
�� �
1970 1975 1980 1985 1990 199550%
55%
60%
65%
70%
In overall terms therefore while all of the decline in the participation rates of olderworkers cannot be attributed to financial disincentives and early retirementprogrammes, with growing prosperity also playing a role, it is clear that these factorshave manifestly encouraged the labour force withdrawal of older workers. In terms ofthe future, while such schemes may often have been reverted to in the past, especiallyin Europe, as a short-term palliative to lower the unemployment rate, it is clear that

25
such policy interventions must be unwound in the future as a means of addressing theopposite problem of labour supply shortages. In this regard eliminating the financialdisincentives to remaining longer in the labour force as well as measures to increasethe statutory as well as the effective retirement age could hold substantial gainsespecially for Europe. As regards increases in the effective average age of retirement,this could be achieved by changing key features of Member States pensions systems,especially if the latter reforms were to ensure that pension systems became actuariallyneutral.
TABLE 8: PARTICIPATION RATES FOR SPECIFIC AGE GROUPS ANDEFFECTIVE
RETIREMENT AGES IN THE EC, JAPAN AND THE US
Participation Rates: 199050-54 55-59* 60-64* 65-69 70-74
EC 69.5 53.8 25.5 7.3 2.3Japan 82.0 71.5 54.7 24.4 23.9US 80.0 66.1 44.2 11.5 6.3
Participation Rates specifically for the Age Group 55-641950 1980
EC 51.3 45.1Japan 63.0 64.5US 57.2 55.8
Effective Retirement Age*1950 1990
EC 64.3 61.3Japan 64.7 64.8US 64.4 62.8* Statutory Retirement Age is 65 in the EU and the US and 55/60 in Japan.Source: CPB Netherlands
2.4- POTENTIAL IMPACT ON CAPITAL ACCUMULATION OR ON TECHNICAL
PROGRESS
CAPITAL ACCUMULATION : Is the option available of reducing the downturn in livingstandards through capital accumulation? Savings and investment have a potentiallyimportant role to play in helping to offset the effects of rising dependency burdens,with higher savings leading to higher productive investment and higher long-rungrowth. The negative impact on living standards due to the reduced rate of growth ofthe labour supply could in this way be potentially offset by higher rates of labourproductivity growth emanating from a rising capital stock. However, this investmentroute to boosting long-run growth would appear to be cut off, since not only is thenational savings rate not expected to rise to finance the required higher investmentrate, the most likely outcome, especially if one subscribes to the LCH, is a fall innational savings, with the latter fall again largely demographically induced.

26
Graph 9 : EU15 Gross Fixed Capital Formation and GDP Growth
�
�
� �
�
��
�
��
�
�
�
�
�
�
�
��
�
�
��
�� �
� �
��
�
��
�
� ��
1961 1966 1971 1976 1981 1986 1991 1996
0%
5%
10%
15%
-5%
-10%
% change
Gross Fixed Capital Formation GDP Growth�
While it is clear that savings and investment are not the only ingredients that influencelong-term living standards, with technical progress potentially playing a greater role,nevertheless it must be accepted that greater levels of savings, converted into greaterhuman and physical wealth holdings, increases the options available for coping withthe adverse effects of ageing. Consequently, prudence demands action to boostnational savings rates over the medium to long run, with action in terms of governmentsavings / dissaving being the most effective avenue to be explored9.
Technical Progress: One of the critical assumptions to be made in relation topredicting the long-term economic impact of demographic change is the extent towhich increased labour efficiency can offset the reduction in the rate of growth of thelabour supply. This is a highly complex issue and one which has received a lot ofattention in the empirical literature. From a review of the latter it would appeardifficult to establish with any certainty whether demographic change will be positiveor negative for productivity. According to some research it could be detrimental toproductivity growth if an ageing labour force turns out to be less dynamic andinnovative whereas other researchers take the alternative view that technologicalchange may be boosted to offset the negative implications of the ensuing relativescarcity of labour.
9The crowding out effects of Government debt, in particular the crowding out of private investment dueto the higher real rates of interest, is associated with excessive consumption of available nationalresources i.e. a lower pool of savings which in turn results over the long-run in a reduction in realincome and consumption levels (i.e. reductions in sustainable real standards of living) as a result of thelower average level of capital accumulation.

27
Simon (1986), Wattenberg (1987) and Romer (1990) take the former view and arguethat technical progress is slowed down by the anticipated ageing of the populationbecause of the above mentioned loss of dynamism and since declining markets forcapital goods ensures that innovation is less profitable. Cutler et al (1990) presentempirical evidence to support the opposite view that labour scarcity induces increasedinnovation i.e. the “scarcity is the mother of invention” argument. This scarcity viewassumes that in a situation of relatively slow population growth, there is anacceleration, on a per capita basis, in human capital accumulation. In their cross-national analysis of 29 non-OPEC countries for the period 1960-1985, Cutler et alestimate that a decline in the annual labour force growth rate of 1 percentage point isassociated with about a 0.5 percentage point increase in productivity growth.
Furthermore, this view of Cutler et al. is supported in the context of ongoing researchin relation to endogenous growth rate theories. For example, Fougère and Mérette(1997) suggest that investment priorities may change with population ageing, with thelatter phenomenon increasing the incentive for human capital investment, resulting in aredistribution of investment away from physical towards human capital, withpotentially favourable long-run effects in terms of the rate of economic growth. Theempirical interest in this whole area of endogenous growth theory has been enormousin recent years, with the latter stressing that the total factor productivity (TFP) elementof economic growth partially emanates from sources which are amenable to policyinfluence. If it is accepted that the behaviour of economic agents is susceptible toproductivity enhancing policy interventions, then this would represent a majordeparture from the standard neo-classical view which postulates that technical progressis exogenously determined.
To conclude, therefore, the empirical evidence linking ageing directly to productivitytrends is far from convincing with even doubts regarding whether the association ordirection of any effect is positive or negative. In these circumstances it seems prudentto take a neutral position with regard to future technical progress or efficiency trends interms of any simulation work i.e. the average rate of change experienced in the US,Japan and the EU over the past decade is generally extrapolated forward.
2.5 INTEREST RATE, EXCHANGE RATE AND BALANCE OF PAYMENTS
DEVELOPMENTS
Savings and investment developments not only impact on potential growth but also oninterest rates, exchange rates and international capital movements. Global and regionalmovements in the latter variables are precipitated by divergent pressures on the savings/ investment front. In broad overall terms, when savings / investment imbalancesemerge at the world-wide level, such tensions manifest themselves in real interest ratemovements, whereas regionally–based strains result in shifts in exchange rates and netforeign asset positions.
At the worldwide level, given the large differentials in terms of the relative timing andextent of the “greying” phenomenon, current account positions between the developedgroup of countries and between the latter and the developing world will be prone toprotracted swings, with the cumulative changes in net foreign asset positions beingpotentially important. Trying to withstand these persistent swings in balance ofpayments positions would not be justifiable, or indeed possible, since the latter will not

28
be driven by short term considerations such as changes in the relative cyclical positionsof countries or in their relative competitiveness, but by fundamental shifts in domesticsavings / investment balances. Despite the large element of doubt permeating anypredictions in relation to current account positions, with the timing of any swings orindeed the sign being the subject of frequent revisions, nevertheless the majority viewis that the developed world should move towards, and remain in, surplus over the nextdecade or so, with the latter being whittled away in subsequent decades.
Graph 10 : EU-15, US, Japan: Balance on Current Transactions with the Restof the World
Source: Eurostat
�
�
��
��
��
�� � �
� �
�
�
�
�
�
�
�
�
� �
��
�
�
�
�
��
��
� �
��
1960 1965 1970 1975 1980 1985 1990 1995
0%
2%
4%
6%
-2%
-4%
% of GDP
EU15 US Japan�
Amongst the many likely demographically induced sources of savings / investmentpressures over the coming decades, the following stand out for particular attention:
• Negative impact on private and public savings: These pressures will vary acrosscountries, with the developed world likely to be the first affected, and across time,with countries such as Japan starting to age sooner than other developed regionslike the EU and the US. These differences will inevitably generate exchange rateand current account tensions.
• Negative impact on output growth: If this occurs then less investment will beneeded since the slowdown in output growth should translate itself into aslowdown in the requisite rate of growth of the capital stock.
• Changes in the relative shares in world output of the developed anddeveloping countries: Given that the relative weights of the latter groups ofcountries is likely to change over the next 50 years, with the developed worldlosing out in relative terms, large changes in global patterns of savings andinvestment should be expected. The developing countries, as a block, for example,are likely to devote a higher proportion of their growing share of world output toinvestment, and indeed to supplement their thirst for funds by running currentaccount deficits. As mentioned above, the developed world should, on average,

29
see improvements in their current account positions as savings are raised relative toinvestment i.e. import demands slow down relative to the developing world.
All of the above 3 sources of pressures and in particular the relative shifts in therespective positions of the various countries will inevitably generate exchange rate andcurrent account tensions and depending on how the global savings / investmentbalance develops, perhaps also changes in worldwide real interest rates.

30
BOX 3: MODELLING THE SYSTEMIC ASPECTS OF DEMOGRAPHIC
CHANGE : THE QUESTII A PPROACH
OLG MODELS: It is often argued in the literature that Overlapping GenerationsModels (OLG’s), which explicitly keep track of the savings decisions and wealthholdings of different age cohorts in the population, are the theoretically mostrigorous approach to modelling demographic change. Examples of this multi-cohort approach include Auerbach-Kotlikoff (1987), Fougère-Merette (1998),Hviding-Merette (1998) and Miles (1999). However, it is important to stress that it isalso accepted that this approach is not only more complex and demanding but also,due to the fact that it is still in its infancy, that its empirical results are still open toquestion in terms of their reliability. Consequently, the IMF (1990) and OECD(1998) have adopted an approach which is similar to the one used in this studywhere existing models have been adapted in order to study the consequences ofpopulation ageing.
Furthermore, it is interesting to point out, at this stage, that the results of thesimulations in Chapters 3 and 4 are not that different from those produced in studiesusing the OLG approach. This perhaps is not that surprising since OLG models, aswith QUEST II, have the life-cycle hypothesis at their core. Consequently theapproach adopted for this study is to modify QUEST II as opposed to going down theOLG route.
PARTIAL V GENERAL EQUILIBRIUM APPROACH: Looking at the ageing problem in thepiecemeal way carried out in chapter two, while interesting and elucidating in termsof highlighting the key influences at work, in the final analysis is less thansatisfactory since it fails to take account of systemic, dynamic, forces which willundoubtedly kick into action once ageing starts to impact on the economic systemsof the respective countries.
Estimating the effects of ageing using a static or partial equilibrium analysis is infact prone to three major sources of problems :• Firstly, policy adjustments are inevitable in order to avoid the development of
unsustainable private or public sector imbalances.• Secondly, the emergence of tensions or imbalances in an economy is normally
followed by corrective, general equilibrium, feedback effects such as changes ininterest rates or exchange rates, in the level and composition of savings, in thebehaviour of consumers and investors and even, in certain circumstances, inchanges in the rate of technical progress, all of which must be taken intoaccount in assessing the final impact of ageing.
• Finally, global interdependencies ensure that changes in the relative currentaccount and net foreign asset positions of countries / geographical zones need tobe adequately modelled in order to assess the impact of an ageing process whichis not occurring at uniform speeds or intensity across countries or regions of theworld.
ADAPTING MODELS TOHANDLE DEMOGRAPHIC CHANGE: General equilibrium macromodels, with a broad geographical coverage, are therefore undoubtedly preferable tothe partial equilibrium methods often adopted in analysing the ageing problem.Macro-models, such as QUEST II, however, often have to be adapted in order to be

31
able to effectively incorporate the effects of demographic changes. Adaptations areusually necessary to the models consumption equations, where demographicinfluences are rarely explicitly included; to the production / supply-side; and to theway the government sector is modelled. The discussion in Chapter 5 regarding theOECD Minilink and IMF Multimod models gives additional information regardingthe kind of « adjustments » which need to be made to the core model structure inorder to handle demographic developments.
As regards the consumption equations, the choice between the « life cycle » or« buffer-stock » theories of savings as well as the empirical evidence in support ofintertemporal smoothing models (i.e. what is the relative importance of liquidityconstrained versus wealth constrained consumers), all remain contentious issueswhich are unlikely to be resolved in the immediate future. The final decisions madewith regard to these issues impact significantly on the models simulation outputwith, for example, a model where the life-cycle elements are pervasive indetermining savings behaviour generating greater economic effects fromdemographic changes relative to those produced by “buffer stock” inspired theoriesof savings.
As regards the modelling of the supply-side influences of demographic change,labour supply equations must be capable of taking account of not only changes intotal population but also changes in the dependency structure and age structure ofthe population and of the factors which impact most strongly on labour forceparticipation rate decisions. Being able to model the impact of the latter factors interms of translating them into variations in the effective labour supply is a basicprerequisite for assessing the consequences of population ageing. Another issue tobe addressed is how models should handle the question of technical progress i.e.should it be exogenously or endogenously determined. Most of the larger modelsretain the assumption that the rate of increase in the latter is exogenous.
As regards the modelling of the government sector, issues inevitably involve thehandling of age-sensitive government expenditures and transfer payments tohouseholds. The demographic influences on the revenue side revolve around theissue of insulating budgets from the effects of ageing by shifting from direct toexpenditure-based taxes.
OVERVIEW OF THE DEMOGRAPHICALLY SENSITIVE PARTS OF THE QUEST II M ODEL :MODELLING OF HOUSEHOLD BEHAVIOUR, LABOUR SUPPLY, TECHNICAL PROGRESS
AND THE GOVERNMENT SECTOR
HOUSEHOLD BEHAVIOUR: The behaviour of households in the QUEST II model ischaracterised by the Life Cycle Hypothesis. The latter is a generalization of thePermanent Income Model since it allows for the analysis of consumption and savingbehaviour of households with possibly only a finite time horizon. According to thishypothesis, households base their consumption decision on a discounted stream ofcurrent and future expected net income and on their current stock of financialwealth. The basic reason for doing this is derived from a concept of inter-temporalutility maximization of households, whereby they find it optimal to smoothconsumption over time.

32
The calculation of permanent income incorporates the current and discountedfuture expected net income stream the household sector is expected to earn. Itconsists of all non-capital income, i.e. net labour income and all other transfers tohouseholds, including unemployment benefits. The other determinant for privateconsumption is financial wealth which, at the aggregate level, consists of the marketvalue of firms in the domestic economy, the net foreign asset position andgovernment debt.
It should be noted, however, that although government debt enters the definition forprivate wealth, this does not mean that it has a positive effect on privateconsumption because households deduct future tax payments and reductions intransfer payments, which are required to service the debt, from their permanentincome. This is also known as Ricardian Equivalence. This proposition does,however, only hold in its extreme form for infinitely lived consumers. Life cycleconsumers will discount the future more heavily and thereby underestimate the taxburden associated with government debt. Consequently they will regard governmentdebt at least partially as net wealth of the household sector, with this net wealtheffect of government debt being, however, negligible in the life cycle model.
Finally, the empirical specification of the model allows for a deviation to the aboveformulation reflecting the findings of many empirical studies of consumer behaviourwhich point to a sizeable fraction of consumption being dependent on real currentdisposable income because of liquidity constrained private households.
LABOUR SUPPLY: Labour supply or wage setting behaviour in the QUEST modeldiffers strongly from the standard neo-classical model of labour supply. However,the formulation of the wage equations have borrowed some elements of the neo-classical labour supply hypothesis. In standard neo-classical labour supply models,the supply of labour is derived from a household utility function where householdsvalue leisure positively. This implies that labour supply, in terms of hours, dependspositively on the net real wage rate (substitution effect) and negatively on householdwealth, which is composed of life cycle income and financial wealth (income effect).
The wage equation in Quest II encompasses not only the latter neo-classical laboursupply hypothesis - based on the consumption leisure choice – but also includesaspects of wage equations known from the bargaining literature where wage rulesare postulated, which identify productivity and labour market tightness as majordeterminants of wage claims by workers. Which feature of the labour supplydominates in this model depends crucially on the bargaining strength of workers.
PRODUCTION/TECHNICAL PROGRESS: Firms are assumed to operate in amonopolistically competitive environment. Private sector GDP is produced via anested CES and Cobb Douglas production function with capital, energy and privatesector employment as inputs. Variables representing an efficiency index for the fixedcapital stock and labour augmenting technical progress are also included. Labouraugmenting technical progress grows at an exogenously determined rate and theefficiency index for capital captures embodiment effects resulting from current andpast investment. Capital stock changes according to the rate of fixed capitalformation and the rate of geometric depreciation.

33
GOVERNMENT: The assumptions about government behaviour are ratherconventional. Governments do not maximize an objective function but follow anexogenously given spending pattern. Current expenditure is divided into interestpayments on government debt, purchases of goods and services (which includesgovernment investment), government employment, net government transfers tohouseholds net of unemployment benefits, and other transfers. Governmentspending is financed through labour income taxes and social security contributions,corporate income taxes, energy taxes, value added tax and other receipts.
It is well known that public debt dynamics is an intrinsically unstable processprovided that the real interest rate exceeds the average growth rate of the economyand both spending and taxation grow in a fixed proportion with GDP. Dynamicconsistency therefore requires the introduction of a debt rule which makes one orseveral spending or receipt categories of the government budget an instrument fordebt stabilisation. To enforce the government’s intertemporal budget constraint, afiscal policy reaction function is imposed where the target is the debt to GDP ratio.As a standard setting this rule is imposed for net government transfers to households,which is the least distortionary in the model, but it can also be applied to otherreceipt or spending categories.
TABLE 9 : KEY PARAMETERS IN QUEST II
EC15 US Japan
Consumption Function Parameters
1. Rate of time preference (Annual) .036* .04 .02
2. Share of liquidity constrainedhouseholds
0.3 0.3 0.3
3. Planning Horizon (Years) 50 50 50
Production parameters
4. Output elasticity of labour 0.65* 0.61 0.63
5. Labour augmenting technicalprogress (Annual)**
0.014* 0.006 0.032
Wage equation parameters
6. Bargaining strength ofworkers
0.50 0.25 0.50
7. Unemployment effect onwages
-0.87* -0.50 -2.50
8. L.R. elasticity of real wagesw.r.t. Productivity
1.0 1.0 1.0
9. L.R. elasticity of real wagesw.r.t. Unemployment
1.37* 0.55 3.47
* Weighted Average for the Member States.** Estimated using annual data over the period 1974-1995. Note : for the purposes of the simulations in chapters 3 and4, technical progress for the EU and Japan converges on US rates.

34
CHAPTER 3: QUEST II C ENTRAL AGEING SCENARIO2000-2050
I NTRODUCTION : This central ageing scenario, covering the period 2000-2050, isessentially a no-policy change view of the world over the next 50 years. It shows thepublic finance, employment, capital accumulation and growth implications of theageing of populations in the absence of any specific, offsetting, policy adjustments. Itshould be stressed at the outset that all figures are in GDP per capita terms i.e. livingstandards, since in QUEST II GDP growth rates are adjusted for changes in trendpopulation.
Given the extent of the demographic changes being envisaged it is accepted that theeconomic adjustment process will inevitably involve large shifts in an economies’stock variables such as physical capital, net foreign assets, money and governmentdebt, all of which are endogenously determined in QUEST. Stock adjustments of thismagnitude invariably take time to feed through with the result that a long baseline isrequired for the model to settle down in a simulation after a shock. The 70 yearbaseline used in Quest II allows enough time for these dynamic adjustmentmechanisms to work through and for the stock-flow adjustments to take place.
Finally, it is important to underline at the outset that all simulation exercisesmechanistically apply past patterns of behaviour to expected future trends and giventhe unprecedented nature of the demographic changes, caution needs therefore to beexercised with regard to interpreting the results.
QUEST’S BASELINE SCENARIO : Before going on to discuss the Central Scenarioit is important to be clear about the public finance and labour market assumptionswhich underpin Quest’s Baseline Scenario10, since it is against the latter which theCentral scenario is compared.
• Baseline Public Finance Assumptions: Stability and Growth Pact isRespected: In comparing the central ageing scenario with the baseline, it isimportant to remember that the baseline already assumes broad respect for theStability and Growth Pact (SGP). The EU’s deficit at the general government levelis assumed to disappear by 2003 and the Debt to GDP ratio is expected to bearound 60% in the same year and to stay at that level thereafter for the duration ofthe baseline. The model in fact imposes a debt rule of 60% which ensures that,once that level is achieved, it doesn’t change very much over the simulationhorizon. The imposition of such debt rules are common in most large modelssince, as mentioned earlier, public debt dynamics is an intrinsically unstableprocess, with such rules ensuring that the public finances stay on a sustainable paththroughout the simulation period. In the case of the ageing simulations, if a debtrule is not imposed the deficit and debt situations quickly reach unsustainablelevels (see section 4.1.1). As noted earlier, debt is stabilised via lump sum changesto net government transfers to households, which is the least distortionary budgetcategory in the model.
10 The QUEST II baseline incorporates the most recent short and medium term projections of theCommission services up to 2003.

35
• Baseline Labour Market Assumptions: Changes in the population of workingage are driven by the assumption that the overall population is growing in allcountries over the simulation horizon at a growth rate similar to that witnessed inthe most recent decades. Since there is no change in labour taxes and noassumption regarding structural reforms with regard to the respective labourmarkets, the unemployment rate stays close to its historical level. In addition,participation rates are assumed to stay roughly at their 2000 levels andunemployment benefits are assumed to be indexed to gross wages (see Box 4 for adiscussion on benefit rules).
CENTRAL AGEING SCENARIO : The above baseline scenario is given two agerelated shocks : alabour force shock, which encapsulates the main features of thedemographic projections over the next 50 years, and apublic expenditure shocklinked to the budgetary implications for pensions, health care and education of anageing population.
Labour Force Shock: In terms of the population changes, the central scenarioassumes that the EU’s overall population will decline slightly over the 50 year periodas opposed to an assumption in the baseline of the population continuing to growmodestly. In the case of Japan and the US the population is expected to declinesubstantially in the case of the former ( -0.3% a year), and to grow by 0.4% a year inthe US.
These overall population changes however mask important developments with regardto the structure of the population, with, as chapter one has shown, declines in therelative share of the 15-64 year old age group leading to large increases in all threeregions in overall dependency ratios. These shifts in the population structure areaccommodated in the model by changes in the labour force to population ratio whichin the baseline is assumed to remain constant but in the central ageing scenario isexpected to decline substantially in all areas as indicated in Graph 11.
Graph 11: Labour Force to Population Ratio in the EU, US and Japan
�
�
� � � � � � � � � � � � � � � � � � � � � � � � ����������� � � � � � � � � � � � � � �
2000 2005 2010 2015 2020 2025 2030 2035 2040 2045 205037.5%
39.5%
41.5%
43.5%
45.5%
47.5%
49.5%
51.5%
US Japan EU-15�

36
Public expenditure shock : In relation to the budgetary implications it is crucial tostress at the outset that these relate solely to the demographic pressures on the healthcare and pension budgets, with only about 40% of the increases in these budgets overthe last 30 years being driven by age-related spending pressures. Consequently, it isassumed that the non-age spending factors (eg eligibility rules, benefit levels, cost pushfactors on the supply side of the health system etc), which in the past have beenresponsible for 60% of the increase in their respective budgets, will not be allowed topush up spending. This is a highly unrealistic prospect but any assessment of thesenon-ageing influences goes beyond the scope of this present study. All that can be saidis that if these latter factors are allowed to grow as they have done in the past then thepublic finance burden will be more than double that indicated in the present study.
The long range forecasts for the public finance implications in terms of pensions,health and education are largely taken from existing OECD ((Liebfritz et al (1995),Roseveare et al (1996)) and Commission sources (D. Franco et al (1996 and 1997)).As stated previously the latter sources of information, derived from a partial analysisapproach, can be effectively used as the basic inputs in a general equilibriumframework. It should be pointed out that most of the latter studies draw on nationalsources, with many of the national projections in relation to the per capita publicexpenditure implications of ageing being based on research work in the area ofgenerational accounting.11
The main assumptions in relation to the direct public finance implications of ageing areshown graphically in Graphs 12 and 13. The pensions, health and educationexpenditure projections are extended where necessary by the use of empirically basedrules of thumb12, with the latter drawing on the reasonably strong econometric linksbetween the level of public expenditures on health care systems and pension schemesand changes in the populations’ age structure.
The salient features of the public expenditure projections underlying the simulation areas follows:
• Pensions: In the absence of any corrective action, age related pressures onpensions expenditure are likely to result in a progressive, ex ante, increase inGovernment expenditure equivalent to 9, 2 ¾ and 5 ¼ percentage points of GDPin Japan, the US and the EU respectively in 2050.
11 Leibfritz et al (1995) « Essentially, the generational accounting method is aimed at assessing whethertypical members of each generation would receive back in transfers and services over their lifetime whatthey have paid in taxes (in net present value terms and adjusted for productivity growth), given the needeventually to satisfy an inter-temporal budget constraint that requires the present value of future taxpayments (of existing and future generations) to equal the present value of all future governmentconsumption less the initial stock of debt »
12 An example of such a rough rule of thumb would be that referred to by Borsch-Supan (1996) whoestimates that in the absence of policy adjustments, total age-related social expenditures (i.e. pensions,health and education spending) should grow roughly in proportion to the dependency ratio. He statesthat “the rise in the dependency ratio translates into an increase in the public demand for funds as longas specific social expenditures and tax rates remain as they are now”.

37
In the case of the EU, due to the pension reforms set in place in a large number ofMember States, the above pensions expenditure to GDP ratio is now being forcedup only by demographic trends. However, despite the reforms, the demographictrends alone, as reflected in unprecedented increases in dependency ratios, result inlarge increases in the pensions expenditure to GDP ratio which raises concernsregarding the long-term sustainability of pay-as-you-go (PAYG) pension systems.
• Health Care: In relation to health expenditures, the direct effect of ageing ongovernment deficits is equivalent to an increase of about 1 ¼ to 1 ½ % of GDP inall three cases13. Given the latter, relatively small, increases which are expected, itis not surprising that the OECD (1995) estimates that “it would only be necessaryto hold growth in per capita real public health spending to around ½ to 1 percentlower than productivity growth in order to offset the impact of ageing on healthspending”
While the health care costs appear manageable it is important again to underlinethat these projections only refer to the direct effects of ageing on health budgetsand do not incorporate any estimates for the non-demographic cost push factorswhich in the past have been more responsible than any ageing effects for the sharpincrease in health care spending. In this regard it is noted that publicly fundedhealth care expenditure for the Community as a whole nearly tripled over theperiod 1960-95, a period of relatively benign demographic developments, growingfrom 2 ½ % of GDP in 1960 to 6 ¾ % in1995.
• Education: The demographic impact on education expenditure, despite fallingprimary and secondary school populations is not expected to provide anysignificant budgetary savings which could be used to alleviate the additional costpressures on the pensions and health budgets. Using OECD and Eurostat sourcesfor public expenditure on education as a percentage of GDP in 1995 allied to a percapita breakdown for the primary, secondary and tertiary sectors, it is projectedthat the direct budgetary effects of ageing will be small, on the assumption thatexpenditures per child grow in line with real productivity developments.
13Health care provision for the elderly is on average more expensive than for the non-elderly, with the1993 ratio estimated by the OECD at 4 ¾, 4 ¼ and 3 for Japan, the US and the EU, respectively.

38
Graph 12: Public Expenditures on Pensions 2000-2050
�
�
� � � � � � �� � � �
� � �� � �
� � ����������� � �
� � �� � �
� � � � � � � � � � �
2000 2005 2010 2015 2020 2025 2030 2035 2040 2045 20502.5%
7.5%
12.5%
17.5%
% of GDP
US Japan EU-15�
@
@
@ @ @@ @ @
@ @ @@ @ @
@ @ @@ @ @
@ @ @@ @ @
@ @ @@ @ @ @ @ @ @ @ @ @ @ @ @ @ @ @ @ @ @ @ @ @
2000 2005 2010 2015 2020 2025 2030 2035 2040 2045 20504.5%
5.5%
6.5%
7.5%
8.5%% of GDP devoted to Public Health Exp.
US Japan EC-15@
@
@
@ @ @ @ @ @ @ @ @ @ @ @ @ @ @ @ @ @ @ @ @ @ @ @ @ @ @ @ @ @ @ @ @ @ @ @ @ @ @ @ @ @ @ @ @ @ @ @ @
2000 2005 2010 2015 2020 2025 2030 2035 2040 2045 20502%
3%
4%
5%
6%% of GDP devoted to Public Education Exp.
Graph 13: Public Expenditure on Health and Education 2000-2050

39
The overall impact of these budgetary changes, in the pensions, health care andeducation sectors, would be to increase public expenditure as a % of GDP by 6 3/4, 10and 4 percentage points in the EU, Japan and US respectively. Left unbridled, in termsof policy corrections, the budget deficit and debt implications of these developmentswould quickly reach unsustainable proportions14.
How are the Additional Age-Related Spending Pressures Financed :The CentralScenario, as with the baseline, assumes that the SGP is respected. Consequently, withthe debt rule imposed it is clear that the imposition of the above changes ingovernment expenditures would have the effect of breaching the 60% rule and wouldhave to be financed either on the revenue or the expenditure side of the budget. Sincethe bulk of the increase in government expenditure occurs on the pensions budget andsince it is also assumed, for reasons spelt out in the next chapter, that Governmentswill make little progress over the simulation horizon in moving to a fully fundedpension system (i.e. the PAYG pension system is left broadly unchanged), it isassumed that the additional budgetary costs are financed by increases in social securitycontributions, which in Quest II has exactly the same impact economically as a directincrease in labour taxation.
MAIN RESULTS OF THE CENTRAL AGEING SCENARIO The overall impact ofthe above labour market and public finance shocks is to reduce the level of GDP overthe period 2000-2050 in the EU, US and Japan by 19, 10 and 22 percent respectivelycompared with the baseline. The evolution of these changes is indicated in Graph 14,with the greatest effects occuring after 2020.
In terms of growth rates, Table 10 shows that ageing is expected to reduce the annualaverage rate of growth, relative to the baseline, by close to ½ a percentage point in thecase of the EU and Japan and around a ¼ of a percentage point in the US. In absoluteterms the EU’s and Japan’s annual average growth rate over the period 2000-2050would fall from the baseline rate of 2 ¼ percent to roughly 1 ¾ percent in the presentscenario. As regards the US, the fall would be from the baseline figure of 2 percent to1 ¾ percent.
(Note : See box 4 for a discussion on the sensitivity of the results to differentassumptions regarding the reservation wage)
14 The overall impact of ageing on primary balances over the period 2000-2050 can be estimated bytaking the primary balance level for 2000 as the base and adding in the above expected changes topublic pensions, health and education expenditure over the next 50 years. In the latter case, theassumption is made that all government revenues as well as government expenditures that are notsensitive to the ageing phenomenon remain constant, as a percentage of GDP, at their 2000 levels.

40
TABLE 10 : CENTRAL AGEING SCENARIO *: A VERAGE PER CAPITA GROWTH RATES
OVER THE PERIOD 2000-2050**EU15 US Japan
AgeingScenario
ChangeRelativetoBaseline
AgeingScenario
ChangeRelativetoBaseline
AgeingScenario
ChangeRelativetoBaseline
GDP 1.84 -0.43 1.71 -0.21 1.67 -0.49
*In the Central Scenario unemployment benefits are assumed to be indexed to gross, as opposed to net,wages (see Box 4). In addition, no change in expected in relation to participation rates, with the resultthat the decline in the population of working age feeds through fully to the respective labour forces.**Note : A direct comparison with the results of the OECD simulations reported in Chapter 5 is notpossible since the baseline scenarios differ because of different assumptions regarding TFP growth rates.However, it should be stressed that the change in growth rates relative to the respective baselines isbroadly similar for the EU and Japan although this is not the case for the US.
GRAPH 14: IMPACT OF AGEING ON GDP IN THE EU, USAND JAPAN
�
�
� � � � � � � � � � � � � � � � � � � � � � � � � � � � � � � � � � � � � � � � � � � � � � � � � � � � � � � � � � �
2000 2005 2010 2015 2020 2025 2030 2035 2040 2045 2050 2055 2060
0
-10
-20
EU15�
2020(-4%)
�
�
������
�����������������������������������������������������
2000 2005 2010 2015 2020 2025 2030 2035 2040 2045 2050 2055 2060
0
-5
-10
US�
�
�
� � � � � � � � � � � � � � � � � � � � � � � � � � � � � � � � � � � � � � � � � � � � � � � � � � � � � � � � � � �
2000 2005 2010 2015 2020 2025 2030 2035 2040 2045 2050 2055 2060
0
-10
-20
Japan�
2040(-18%)
2040(-8%)
2020 (No Effect)
2020 (-9%)
2040 (-16%)
In terms of the decomposition of growth into its employment, capital stock and totalfactor productivity components (see Table 11), it should be stressed at the outset thatthis growth breakdown is purely indicative, with its purpose being to show where thechanges in growth are emanating from. While the breakdown can therefore be used inbroad terms to indicate what is driving average growth rates down in the respectiveregions, it should not be compared with expected changes in actual employment orcapital stock levels over the simulation period.

41
Given the comments in the previous chapter concerning the need to take a neutralposition with regard to technical progress over the time horizon of the simulation, it isnot surprising that the results regarding the contributions to growth show no changewith regard to total factor productivity. As the Table indicates the effects of ageingmanifest themselves in terms of changes to employment and the capital stock, with theformer being the most affected. In overall terms, 70% of the decline in average growthrates in the Community is expected to result from employment changes with theremaining 30% emanating from capital stock changes. A roughly similar breakdown isenvisaged for Japan with the ¼ point reduction in average US growth rates emanatingalmost entirely from employment changes.
TABLE 11 : CENTRAL AGEING SCENARIO : CONTRIBUTIONS TO PER CAPITA
GROWTH OVER THE PERIOD 2000-2050
EU15 US JapanAnnualAverage%Change
ChangeRelativeToBaseline
AnnualAverage%Change
ChangeRelativeToBaseline
AnnualAverage%Change
ChangeRelativeToBaseline
Employment -0.13 -0.30 0.03 -0.18 -0.16 -0.36
Capital Stock 0.75 -0.12 0.75 -0.05 0.72 -0.12
TotalFactorProductivity
1.22 0.00 0.94 0.02 1.12 -0.01
Totals 1.84 -0.43 1.71 -0.20 1.67 -0.49
CONCLUSIONS: In the case of the EU this central ageing simulation shows that percapita living standards are likely to fall significantly over the next 50 years. The effectof ageing populations in terms of slowing the rate of growth of potential output willalso make the budgetary implications of ageing, in terms of higher pensions and healthcare costs, more difficult for the individual economies to bear. While the above nopolicy change simulation may be unrealistic in that Governments are unlikely to standidly by, it nevertheless gives an idea of the scale of the task faced by policymakers indevising policy measures aimed at avoiding, or at least cushioning, the potential shockto peoples’ living standards.
If the scenarios prove accurate, economic agents in Europe could be looking at anannual half point reduction in potential growth rates from the present 2 ¼ percent to anaverage rate of 1 ¾ percent over the next fifty years, representing a cumulative GDPloss of nearly 20 percent. Cumulative reductions of 10% and 21½% are predicted forthe US and Japan respectively. While these large corrections are not inevitable,countries need to accept that they must act quickly to set in place a range of policies

42
and reforms, along the lines set out for the Community in the subsequent chapter, inorder to avoid such a slowdown. In relation specifically to the Community, at thisstage it is possible to say that while the broad framework for ensuring budgetarysustainability, in the face of substantial age-related spending pressures, would appearto be in place in the form of the Stability and Growth Pact (SGP), less comfort can betaken from the degree of readiness of the Community’s labour markets to withstand theinevitable shock which is looming, with labour force declines of the order of 15percent being presently predicted.

43
BOX 4 : WAGES, LABOURTAXATION AND UNEMPLOYMENT BENEFITS :ECONOMIC I MPACT OF DIFFERENT ASSUMPTIONS REGARDING THE
RESERVATIONWAGE
In the central ageing scenario described in the text a key assumption regardingunemployment benefits has been imposed, namely that the latter transfer paymentsare linked to gross, not net, wages. In other words the burden of ageing is imposedon workers, in the form of higher labour taxation levels, but not on benefitrecipients since their income is linked to the pre-tax wage level. This assumption isequivalent to assuming that the minimum wage remains constant. This box looksat the implications of this decision to change replacement ratios, in terms of theoverall assessment of the impact of ageing. Before going on to look at thesimulation results, a quick overview of wage determination in Quest II is providedas well as an examination of the key role played by taxation developments.
WAGE DETERMINATION IN QUEST II : Given the fact that market clearing is anunrealistic description of European labour markets, which are characterised bysubstantial involuntary unemployment, standard macroeconomic analysis, which isincorporated in QUEST, does not therefore rely on such a framework. In themodel it is assumed instead that wages are set in an imperfectly competitive fashion.Real wage developments are determined as a function of the reservation wage (i.e. areplacement ratio effect which impacts on the consumption / leisure choice), labourproductivity and the unemployment rate.• Reservation Wage Effect on Wages : The reservation wage is composed of
unemployment benefits and the value of leisure. Leisure can be expressed as afunction of household wealth and the average hours of work supplied perperiod15.
• Gross wages are also positively indexed to labour productivity, with indexationdepending on the bargaining power of workers16. More precisely, in the case ofperfect competition in the labour market, net wages would be linked to thereservation wage but not directly to productivity. Such a link would onlyemerge indirectly insofar as the reservation wage may rise with labourproductivity.
• Real wages also depend negatively on the unemployment rate, since a highunemployment rate increases both the risk of becoming unemployed andadversely affects the probability of finding a job.
I NTERACTION BETWEEN TAXATION AND WAGE TRENDS : Net, after tax, wages is whatworkers bargain for. In this regard, there exists various models of trade unionobjective functions. They share, however, the common feature that gross wages areset as a mark-up over a reservation wage (after tax unemployment benefits), whichis adjusted for a labour tax factor because in wage setting workers look at thedifference between unemployment benefits and their net wage. Wages areeffectively determined therefore by maximising the income differential betweenworking and unemployment. Consequently, in this scenario, as regards theinteraction between taxation and wage developments, labour taxes and social
15 In the standard parameter setting which is used in the simulations the leisure effect is zero.16 The short run elasticity of wages with respect to productivity is 0.5 for the EU countries and Japanand 0.25 for the US.

44
security contributions have an important bearing on the real wage demands ofworkers. An increase in either component would make leisure (unemploymentbenefits) more attractive relative to work and wage costs would have to rise. Exceptfor the case of zero bargaining power of workers, a decline in taxes or socialsecurity contributions will not lead to a fully proportional decline in wages sinceworkers will increase their share in total surplus.
It is also the case in Quest II that no different effects on wage costs should beexpected from a policy of reducing wage taxes as opposed to cutting social securitycontributions. It should be expected from a model with informed bargainingbehaviour that tax incidence is independent of who pays the tax. Yet, changes ineither the tax rate or social security contributions can still lead to different resultsdepending on how unemployment benefits will respond to these changes.
I MPACT OF UNEMPLOYMENT BENEFITS BEING LINKED TO GROSSV NET WAGES : Theincreased levels of labour taxation imposed in the central ageing scenario17 isassociated, as shown in Table 12, with an attempt by workers to offset the loss inliving standards with higher real wage demands. However, as also shown in thetable the rise in real wages is tempered if benefits are linked to net as opposed togross wages. This reservation wage impact is important economically, with thedownturn in GDP being less severe in the event that the financing burden of ageingis spread across both workers and benefit recipients. While Graph 15 shows thatthis effect is evident in the Community, the US and Japan, it is clear that the impacton the Community is particularly important, with the latter reflecting replacementratio and bargaining strength differences between the respective regions.
TABLE 12 : IMPACT OF THE BENEFIT RULE FOR THE EUUnemployment Benefits Linked toGross Wages
Unemployment Benefits Linkedto Net Wages
2025 2050 2025 2050% Change relative to Baseline
GDP -6.7 -18.9 -4.4 -14.0
Real Wages 5.6 2.3 3.6 1.8
Real NetConsumptionWages
-11.3 -19.2 -15.6 -24.2*
RealUnemploymentBenefits
5.7 2.6 -15.1 -25.0
% Points Change relative to BaselineLabour Taxationas a % of GDP 8.4 12.4 10.1 14.8** More employment leads to higher tax revenues
Why are unemployment benefits indexed to gross wages in the central scenario ?.The justification for this decision is an attempt to keep the living standards of benefit
17 Labour taxation as a percentage of GDP grows by over 12 percentage points in the centralscenario.

45
recipients constant i.e. effectively an unchanged minimum wage is imposed. Inaddition, an assumption of burden sharing, which would impact strongly on thepoorest sections of society, was not regarded as politically implementable, at least inthe initial stages when the effects of ageing are only starting to manifest themselves.
• What happens when labour taxes go up but benefits don’t change – real netconsumption wages decrease, the mark-up of net wages over unemploymentbenefits falls and workers try to, at least partly, restore the historical mark-uplevel by shifting the additional burden of taxation onto employers in the form ofhigher wage demands. These latter developments are negative for investmentand growth.
• If, on the other hand, governments increase labour taxation and simultaneouslylower benefits, by indexing the latter to net wages, the incentive for workers toshift the burden of the additional taxes onto employers is lessened since the netwage to benefit replacement ratio doesn’t change.
Finally, since equity considerations will increasingly play a role as the impact ofageing becomes more severe, it is assumed that the net wage benefit rule is a morerealistic scenario and consequently the latter rule is imposed for the simulations inChapter 4.
Graph 15: GDP Gains of Linking Benefits to Net Wages
2001 2006 2011 2016 2021 2026 2031 2036 2041 2046
0%
1%
2%
3%
4%
5%
6%
7%
-1%
% of GDP
US Japan EU

46
CHAPTER 4: QUEST II POLICY SCENARIOS : EASING THEECONOMIC BURDEN OF AGEING IN THE COMMUNITY
I NTRODUCTION : Given the likelihood of a substantial reduction in GDP growthrates, the Member States will have to look at a range of macro and structural policyactions to cushion the impact on living standards. The possible policy responses tooffset the negative effects of ageing can be grouped under the following three broadheadings:
• BUDGETARY : Offsetting the negative impact of ageing on national savingsthrough adherence to the provisions of the stability and growth pact. If this isactively pursued over the coming years, not only will national savings benefit but asounder fiscal position will ensure more favourable debt dynamics when the publicsector spending pressures from ageing start to emerge. In the specific case of theEU, respect of the SGP provisions will inevitably involve the introduction of wide-ranging reforms to those most age sensitive areas of government expenditure suchas pensions and health care, without which deficits will be difficult, if notimpossible, to control with consequent problems in terms of debt sustainability.Given the existence of high tax to GDP ratios in most of the Member States and thepotentially distortionary impact of the large additional tax hikes which would berequired, the simulations in this chapter assume that any budgetary adjustmentswhich take place do so on the expenditure side and not on the revenue side as in thecentral ageing scenario.
• LABOUR MARKET : Neutralizing the demographic developments through labourmarket reforms e.g. policies to raise labour force participation rates and to extendthe average working lifetime (Note: Increasing immigration is assumed not to be acredible policy option). Labour market reforms in the EU, using the vehicleprovided by the National Action Plans for Employment, must deliver a steadyreduction in the non-cyclical component of unemployment whilst promoting higherrates of labour force participation. In this regard, measures to ensure an increase inthe effective retirement age would be particularly beneficial since, in addition toraising participation rates, it would boost productive capacities and ease budgetarypressures via reduced transfer payments and additional tax revenues.
• PRODUCTIVITY : Promoting higher factor productivity growth through structuralreforms aimed at enhancing the efficiency and flexibility of goods, services andcapital markets in the Community, whilst acting to ensure open and competitivetrading conditions at the global level.
As the results of the simulations carried out in this chapter show, all the above measureswould individually, and collectively, act to counteract the projected slowdown in thegrowth of Member States living standards.

47
4.1: BUDGETARY POLICIES
This section looks at two issues: firstly, a simple illustration of the importance ofadhering to the provisions of the Stability and Growth Pact, by looking at the debt anddebt servicing implications of the “non-financing” alternative; and secondly, anexamination of the case where any age-related increases in government expendituresare financed on the expenditure side of the budget. This latter simulation, given thatthe bulk of the additional ageing costs are attributable to the pensions budget, amountsto a pension reform scenario since some movement away from the present PAYGsystem of financing is implicitly assumed.
4.1.1. BUDGETARY PRUDENCE : T HE IMPORTANCE OF RESPECTING THE SGP : It isclear that respecting the SGP’s “close-to-balance” rule demands additionalconsolidation efforts on behalf of many of the Member States, and that maintainingthat position will be difficult once the demographic situation starts to worsen after2010. Such efforts are nevertheless vital for both avoiding the development ofunsustainable debt positions and for helping to fund age-related spending increases.With regard to the latter, if the provisions of the SGP are adhered to, the declininginterest payments burden associated with shrinking public debts could be used to fundpart of the additional expenditure burden on the pensions and health sides linked to theretirement of the “baby boom” generation. In this way the primary balance adjustmentto the demands of an ageing population could be eased. Member State governmentsmust therefore use the “breathing space” available over the next decade to place thepublic finances on a durably sound footing.
Primary Balance, Interest Payments and Debt to GDP ratio implications ofAgeing in the event that the SGP is not adhered to : (i.e. the debt rule is turned offin the model and Governments resort to debt financing).The evolution of the debtratio depends on interest rate and growth rate developments as well as trends inrelation to the primary balance. While the primary balance is a crucial determinant ofoverall fiscal positions it is not the only one, with the initial stock of debt and debtservicing costs also playing a key role in the evolution of fiscal positions. When realinterest rates are greater than real growth rates, unless the surplus on the primarybalance is adequate to compensate for the increased debt interest payments, debtdynamics are unstable and a vicious circle of rising debt as a percentage of GDP willinevitably ensue. It is clear in these circumstances that the initial fiscal startingposition impacts strongly on a country’s debt evolution, with lower debt/GDP ratiosand higher primary surpluses in the base year ensuring more virtuous debt dynamics.With high debt levels in many EC Member States, and with interest payments alreadyeating up 8% points of GDP or more in some cases, it is clear that a number ofcountries are still especially vulnerable to adverse interest rate developments18.
18 The benefits of consolidation for these high debt countries are clearcut: lower debt servicing costs,emanating from lower debt levels and lower interest rates, with the latter lower rates in turn boostinggrowth. As regards the interest rate benefits, studies such as Faruquee et al (1996) for the OECDcountries and Ball and Mankiw (1995) for the US point to reductions of about 0.8-0.9 percentage pointsin real interest rates following public debt reductions of 20-25% points.

48
Using the primary balance estimates which underpin the central ageing scenario19, andthe latter’s predicted growth rates, the present simulation assesses the associated debtdynamics in the event of non-compliance with the SGP over the 50 year period. Thisscenario is for illustrative purposes only since such a full scale resorting to debtfinancing would quickly run into problems. Consequently, its only purpose is tohighlight the extent and nature of the budgetary difficulties which are likely tomanifest themselves. In addition to the primary balance and growth rate data, theeffective interest rate on the public debt has been calculated for the year 2000 and isextrapolated forward to 2050. The real interest rate / real growth rate differential is ofthe order of 2 ¼ percentage points. In overall terms, in the event of a debt financingpolicy being adopted, the EU would experience a deterioration in its primary balanceof 7 percentage points, and increases of 9 and 148 percentage points respectively in theinterest payments to GDP and the debt to GDP ratios over the fifty year period.
Graph 16: Non Respect of Stability and Growth Pact (% of GDP)
�
�
� � � � � � � � � � � � � � � � � � � � � � � � � � � � � � � � � � � � � � � � � � � � � � � � �
2000 2005 2010 2015 2020 2025 2030 2035 2040 2045 2050
0
3
-3
-6
Primary Balance
�
�
� � � � � � � � � � � � � � � � � � � � � � � � � � � � � � � � � � � � � � � � � � � � � � � � �
2000 2005 2010 2015 2020 2025 2030 2035 2040 2045 20500
5
10
�
�
� � � � � � � � � � � � � � � � � � � � � � � � � � � � � � � � � � � � � � � � � � � � � � � � �
2000 2005 2010 2015 2020 2025 2030 2035 2040 2045 20500
100
200
Interest Payments
Debt to GDP Ratio
It should be borne in mind that while the above graphs take account of the age relateddeterioration in both primary balances and real growth rates, they do not reflect anypotential deterioration in debt dynamics driven by real interest rates being higherbecause of the higher deficits and debt levels. No attempt is consequently made toassess the likely evolution of the gap or differential between real interest rates and realgrowth rates over the period because of the large uncertainties involved. While it isconceivable that if the pressures on primary balances are not adequately tackled thefiscal situation will be further stretched by higher rates of interest on Government debt,such a prediction is not clearcut in circumstances where GDP growth rates are alsoexpected to fall.
19 These primary balances can of course also be used as an indication of the SGP induced adjustmentsneeded to respect the close to balance rule.

49
4.1.2 PENSION REFORM SIMULATION i.e. economic impact of moving from thepresent PAYG system to a fully funded system. It is important to remember that it isthe public sector’s exposure to the unfunded liabilities of the PAYG-pension systemwhich is the single greatest source of expenditure pressure over the coming decades. Ifretirement income was derived from a fully funded pension system, ageing would onlysignificantly impact on health expenditures and old age poverty relief.
The “pension” reform simulation examines the economic implications emanating fromthe choice between the two competing financing options for pension systems i.e. thechoice between PAYG, which is financed by current taxes and social securitycontributions, which was the assumption underlying the Central Ageing Scenario inthe previous chapter, and the “Fully Funded” option, which is financed out of a stockof capital accumulated during one’s working lifetime20. The “fully funded” optionappears attractive at the moment as a way of reducing the public sectors exposure,under the PAYG system, to the pensions implications of a rapidly ageing populationi.e. exposure either in the form of the need to finance the additional pensionsexpenditure through higher taxes/social security contributions or via the need to seekspecific or generalised expenditure reductions21. However, while the benefits of the“fully funded” option are attractive, the inter-generational equity considerations (i.e.the switch to a fully-funded system would impose a double burden on the presentgeneration, with the latter having to fund their own pensions whilst continuing tofinance, through taxes and social security contributions, the pensions of those whoretired under the previous PAYG scheme) allied to the political fallout22 from the lattershould not be ignored.
20 Chand and Jaeger looked at thefiscal consequences of moving to a fully-funded system. They conclude « thatthe fiscal costs of undertaking such a shift may be very high, and that meeting these costs may require, in manycases, an amount of fiscal adjustment that is substantially higher than would be needed to fix the PAYG system.While there are several advantages to the PAYG system, …..the system is particularly vulnerable to the ageingphenomenon, unlike the more individually-based, defined-contribution, fully funded schemes. However, as wehave noted, it is possible to place the defined-benefit system on a satisfactory long-term footing. This course ofaction would require anticipating the demands associated with ageing through implementing a constant sustainablecontribution rate. »
21 As stated in European Economy (1994) the fully funded system carries many attractions «The considerableincrease in taxes and social security contributions that may result from some demographic and employmentscenarios has increased the attractiveness of a fully funded system. In the case of the latter systems,each cohortwould accumulate sufficient capital to finance its own pension, with no need for transfers between cohorts ; capitalaccumulation would likely be higher than under the pay-as-you–go system and the disincentive effects of high fiscaland para-fiscal pressures could be avoided or, at least, alleviated. All in all, thus, the fully funded system wouldtend to increase saving and hence capital formation during the build-up phase. »
22 The results of simulations carried out by Miles (1999) suggests that the shift to a fully funded system will poseenormous political problems « The result that the great majority alive now would be worse off if the unfunded statesystem is phased out – even though every future generation is better off – illustrates the nature of the transitionproblem rather clearly. Democratically elected governments facing voters who focus on the direct implications tothem (and not to all future generations) of changes to state pension systems would find it hard to get support for thiskind of transition plan. (The simulation results suggest) that once a transition from an unfunded to a funded schemeis complete welfare for all subsequent generations will be higher, but without relying on deficit financing thetransition will cause certain generations to be worse off, and those generations could form a majority of voters thuspermanently blocking any change. But since the value of the future benefits are permanent while the costs aretransitory it might seem that a temporary increase in fiscal deficits to compensate what would have been the loserswill solve the problem…….In general this is false……….Whether a Pareto optimal switch from unfunded tofunded pensions can be engineered is an unresolved issue of great practical importance »
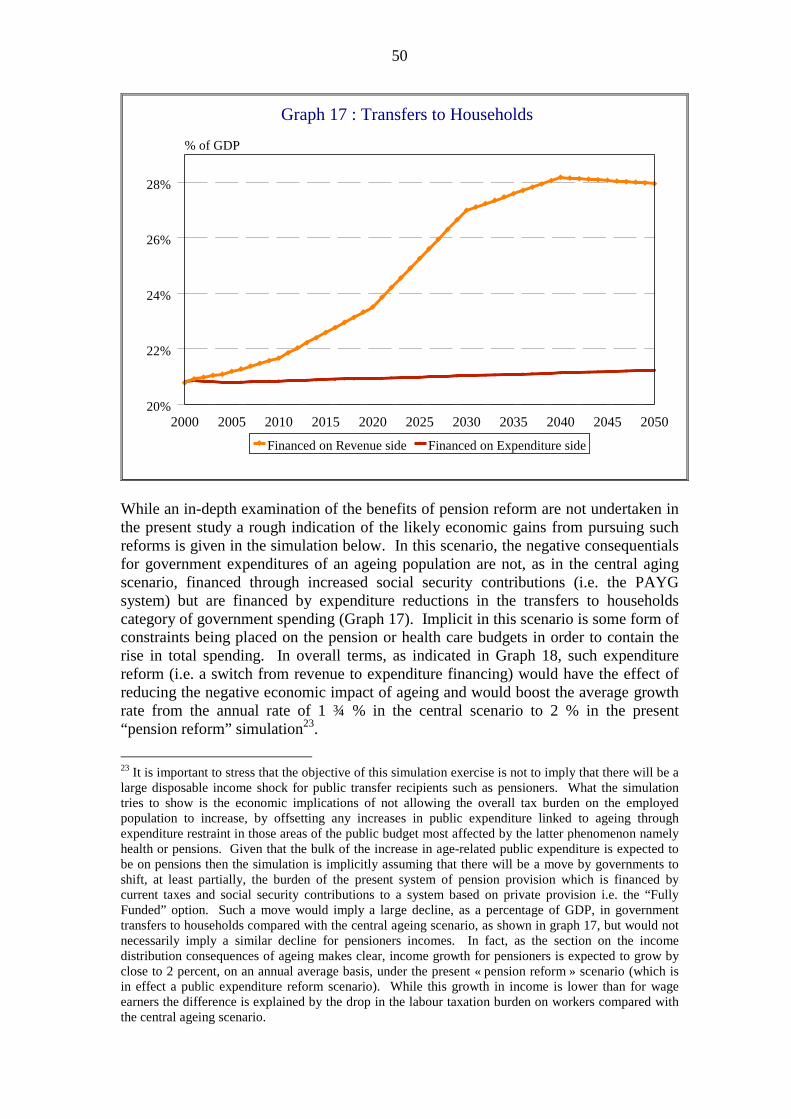
50
Graph 17 : Transfers to Households
@
@
@ @ @ @ @ @ @ @ @ @ @ @ @ @ @ @ @ @ @@ @ @ @ @ @ @ @ @ @ @ @ @ @ @
@ @ @ @ @ @ @ @ @ @ @ @ @ @ @
�
�
� � �� �
� �� �
��������������������� �
� �� �
� �� �
� � � � � � � � � �
2000 2005 2010 2015 2020 2025 2030 2035 2040 2045 205020%
22%
24%
26%
28%
% of GDP
Financed on Revenue side Financed on Expenditure side� @
While an in-depth examination of the benefits of pension reform are not undertaken inthe present study a rough indication of the likely economic gains from pursuing suchreforms is given in the simulation below. In this scenario, the negative consequentialsfor government expenditures of an ageing population are not, as in the central agingscenario, financed through increased social security contributions (i.e. the PAYGsystem) but are financed by expenditure reductions in the transfers to householdscategory of government spending (Graph 17). Implicit in this scenario is some form ofconstraints being placed on the pension or health care budgets in order to contain therise in total spending. In overall terms, as indicated in Graph 18, such expenditurereform (i.e. a switch from revenue to expenditure financing) would have the effect ofreducing the negative economic impact of ageing and would boost the average growthrate from the annual rate of 1 ¾ % in the central scenario to 2 % in the present“pension reform” simulation23.
23 It is important to stress that the objective of this simulation exercise is not to imply that there will be alarge disposable income shock for public transfer recipients such as pensioners. What the simulationtries to show is the economic implications of not allowing the overall tax burden on the employedpopulation to increase, by offsetting any increases in public expenditure linked to ageing throughexpenditure restraint in those areas of the public budget most affected by the latter phenomenon namelyhealth or pensions. Given that the bulk of the increase in age-related public expenditure is expected tobe on pensions then the simulation is implicitly assuming that there will be a move by governments toshift, at least partially, the burden of the present system of pension provision which is financed bycurrent taxes and social security contributions to a system based on private provision i.e. the “FullyFunded” option. Such a move would imply a large decline, as a percentage of GDP, in governmenttransfers to households compared with the central ageing scenario, as shown in graph 17, but would notnecessarily imply a similar decline for pensioners incomes. In fact, as the section on the incomedistribution consequences of ageing makes clear, income growth for pensioners is expected to grow byclose to 2 percent, on an annual average basis, under the present « pension reform » scenario (which isin effect a public expenditure reform scenario). While this growth in income is lower than for wageearners the difference is explained by the drop in the labour taxation burden on workers compared withthe central ageing scenario.

51
Graph 18: Government Expenditure Reform Compared with Central Scenario
�
�
�����������������������������������������������������������
2000 2005 2010 2015 2020 2025 2030 2035 2040 2045 2050 2055 2060
0%
5%
-5%
-10%
-15%
-20%
-25%
% GDP change relative to baseline
Central Ageing Scenario
Government Expenditure ReformBaseline
4.2 LABOUR MARKET REFORM: RAISING LABOUR FORCE
PARTICIPATION RATES, EXTENDING WORKING LIFETIMES AND
LOWERING STRUCTURAL UNEMPLOYMENT
Policies to increase labour supply and reduce unemployment: Policies to increasethe workforce, or to reduce non-cyclical unemployment, would be an appropriateresponse to the adverse demographic developments and would bring a triple gain, anincrease in potential output; a reduction in public expenditure on the elderly, due to theslower rate of increase in the effective dependency ratio, and higher tax revenues.Actions in this area fall under three broad policy headings24:• Extending the working lifetime beyond the present statutorily imposed limits• Labour market reform aimed at raising participation rates• Labour market reforms to tackle structural unemployment
Longer working lifetimes: With life expectancy having increased and continuing todo so, with jobs becoming less physically strenuous and with entry into the labourforce occurring at a progressively later age, there is a strong prima facie case forgovernment action to lengthen the average working lifetime.
Raising Participation Rates: The present rates of labour force participation have twodistinguishing features: the higher rate of participation for males compared withfemales (currently around 20 percentage points higher for men in the OECD as awhole), and that participation rates decline significantly, well in advance of thestatutory retirement age. Widespread adoption of early retirement programmes,
24 While increased immigration is another possibility for expanding the labour force, it is not regarded asa potent policy target because of the practical limits to such a policy due to the political sensitivitiesinvolved, not only in the host countries but also in the migrants home country because of the likely"brain drain" impact of immigration programmes geared to attracting highly skilled potential migrants.
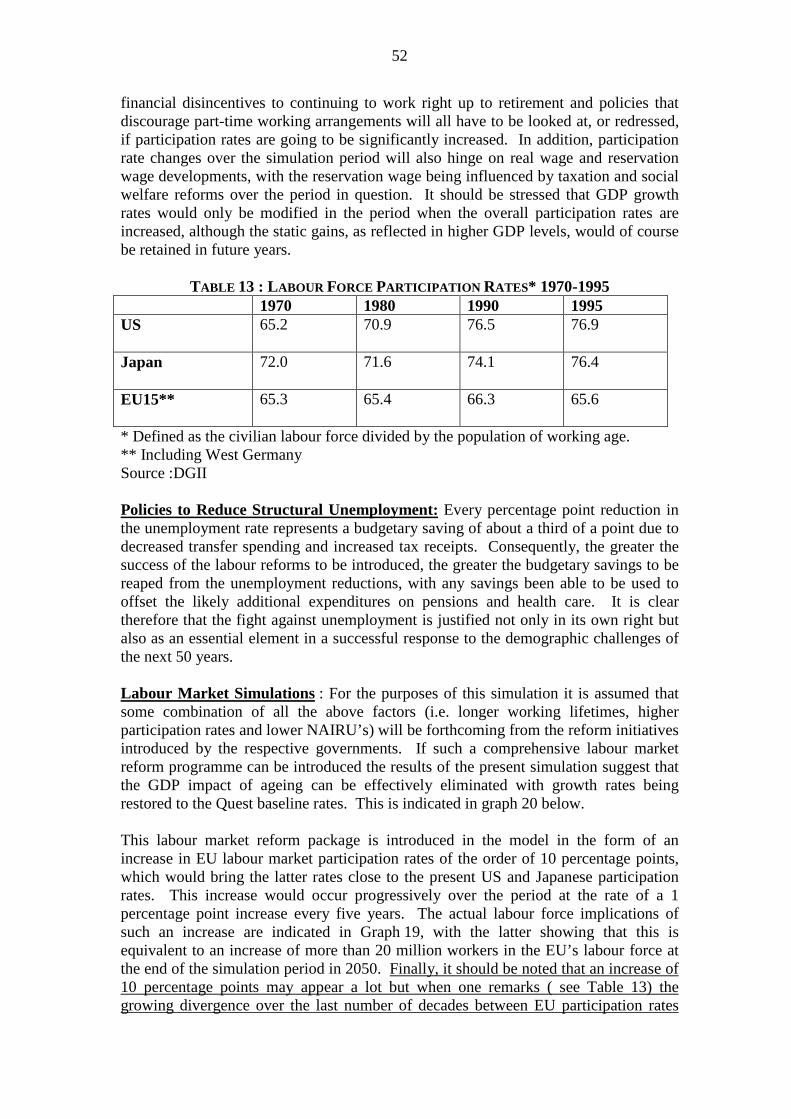
52
financial disincentives to continuing to work right up to retirement and policies thatdiscourage part-time working arrangements will all have to be looked at, or redressed,if participation rates are going to be significantly increased. In addition, participationrate changes over the simulation period will also hinge on real wage and reservationwage developments, with the reservation wage being influenced by taxation and socialwelfare reforms over the period in question. It should be stressed that GDP growthrates would only be modified in the period when the overall participation rates areincreased, although the static gains, as reflected in higher GDP levels, would of coursebe retained in future years.
TABLE 13 : LABOUR FORCE PARTICIPATION RATES* 1970-19951970 1980 1990 1995
US 65.2 70.9 76.5 76.9
Japan 72.0 71.6 74.1 76.4
EU15** 65.3 65.4 66.3 65.6
* Defined as the civilian labour force divided by the population of working age.** Including West GermanySource :DGII
Policies to Reduce Structural Unemployment:Every percentage point reduction inthe unemployment rate represents a budgetary saving of about a third of a point due todecreased transfer spending and increased tax receipts. Consequently, the greater thesuccess of the labour reforms to be introduced, the greater the budgetary savings to bereaped from the unemployment reductions, with any savings been able to be used tooffset the likely additional expenditures on pensions and health care. It is cleartherefore that the fight against unemployment is justified not only in its own right butalso as an essential element in a successful response to the demographic challenges ofthe next 50 years.
Labour Market Simulations : For the purposes of this simulation it is assumed thatsome combination of all the above factors (i.e. longer working lifetimes, higherparticipation rates and lower NAIRU’s) will be forthcoming from the reform initiativesintroduced by the respective governments. If such a comprehensive labour marketreform programme can be introduced the results of the present simulation suggest thatthe GDP impact of ageing can be effectively eliminated with growth rates beingrestored to the Quest baseline rates. This is indicated in graph 20 below.
This labour market reform package is introduced in the model in the form of anincrease in EU labour market participation rates of the order of 10 percentage points,which would bring the latter rates close to the present US and Japanese participationrates. This increase would occur progressively over the period at the rate of a 1percentage point increase every five years. The actual labour force implications ofsuch an increase are indicated in Graph 19, with the latter showing that this isequivalent to an increase of more than 20 million workers in the EU’s labour force atthe end of the simulation period in 2050. Finally, it should be noted that an increase of10 percentage points may appear a lot but when one remarks ( see Table 13) thegrowing divergence over the last number of decades between EU participation rates

53
compared with those in the US and Japan and the fact that the US, while starting at thesame rate as the EU in 1970, has been able to increase its participation rates by 11 ½percentage points over a 25 year period (1970-95)25 one realises that the objective is anattainable one.
Graph 19 : Labour Force Impact of Increasing Participation Rates
2000 2005 2010 2015 2020 2025 2030 2035 2040 2045 2050
145
150
155
160
165
170
175
Millions of Workers
Increasing EU Rates by 10% Points
Participation Rates remain at 2000 Level
Graph 20: Large Gains from Labour Market Reform
�
�
� � � � � � � � � � � � � � � � � � � � � � � � � � � � � � � � � � � � � � � � � � � � � � � � � � � � � � � � � � �
2000 2005 2010 2015 2020 2025 2030 2035 2040 2045 2050 2055 2060
0%
5%
-5%
-10%
-15%
-20%
-25%
% GDP change relative to baseline
Central Scenario
Labour Market ReformBaseline
4.3 DEMOGRAPHIC CHANGE AND PRODUCTIVITY : THE ROLE OF
TECHNICAL PROGRESS IN EASING THE DOWNTURN IN LIVING STANDARDS :One of the key areas to look at in terms of easing the threat to future living standardsare policies conducive to improvements in total factor productivity. As stressed by
25 Over the same 25 year period the EU’s participation rate remained static at around 65 ½ percent of thepopulation of working age.

54
Richardson (1997) “there may be links between human capital and technologicalinnovation, between trade policies and technology, between human capital and incomedistribution and so on. Trade openness may also be a condition for deriving thebenefits of a better-educated labour force……This suggests that in order to fosterimprovements in total factor productivity there is a need for a consistent set of policiesfounded on open trade, macroeconomic stability and encouragement for theaccumulation of human capital”. Policy reforms in this area can lead to both GDPlevel effects (i.e. static, once-off, efficiency gains) and long run, permanent, GDPgrowth rate effects (i.e. dynamic gains).26
In the case of the Community, the policy options available to permanently raise therate of growth of TFP are getting fewer and fewer. The Community has madeenormous progress over the last number of decades in putting in place the policystrategies which are most often linked in the literature with the reaping of substantialdynamic gains such as a stable macroeconomic environment (i.e. EMU) and an opentrading environment both internally (i.e. the single market programme) and externallythrough the World Trade Organisation (WTO). These openness and low inflationeffects on growth rates have already also been largely reaped in the US and Japan butall 3 areas can still continue to derive static gains from regulatory reform to improvethe functioning of product, labour and capital markets.
4.4: COMPREHENSIVE REFORMS SCENARIO
For the final simulation, “pension” plus labour market reforms allied to a smalltechnical progress shock to reflect the gains to be achieved from introducing such acomprehensive package of reforms, are introduced in the model to get an idea of theircombined impact. The overall conclusion to be drawn from this last simulation is thatif governments are successful in introducing a reform package on this scale then theeconomic implications of ageing are capable of being more than offset in theCommunity as a whole.
As shown in Graph 21, which gives an overview of the simulation results, the biggestcontribution to the easing of the economic pressures of ageing emanates from thepackage of labour market reforms. This is also reflected in table 14 which gives arough breakdown of the composition of growth in the comprehensive reform scenario.
26 An example of this split between static and dynamic gains would be the Community’s single marketprogramme with the static gains coming through in the form of economies of scale and greatercompetition and with the permanent growth rate effects resulting from the increased competition in anenlarged market having a favourable effect on technological innovation and investment.

55
Graph 21: Overview of Simulation Results
A
A
AAAAAAAAAAAAAAAAAAAAAAA
AAAAAAAAAAAAAA
AAAAAAAAAAAA
AAAAAAAAAA
A
�
�
�����������������������������������������������������������
2000 2005 2010 2015 2020 2025 2030 2035 2040 2045 2050 2055 2060
0%
5%
10%
-5%
-10%
-15%
-20%
-25%
% GDP change relative to baseline
Central Ageing Scenario
Government ExpenditureReform
Labour Market Reform
Comprehensive Reform
* NOTE: In Graph 21, the results of the central ageing scenario are not directly comparable with the other reform scenarios sinceone of the underlying assumptions of this central ageing simulation is that unemployment benefits are linked to gross wages,whereas for the other simulations the assumption is that benefits are linked to net, after tax, wages.
TABLE 14 : COMBINED REFORMS SCENARIO : CONTRIBUTIONS TO PER CAPITA
GROWTH OVER THE PERIOD 2000-2050
EU15Annual Average% Change
Change Relative ToCentral Scenario
Employment 0.18 0.30
Capital Stock 0.89 0.14
Total FactorProductivity
1.27 0.05
Total2.34 0.50
4.5: INCOME DISTRIBUTION CONSEQUENCES OFAGEING:
Given the extent of the shocks which are likely to be experienced over the next 50years and the implications which the latter will have in terms of the growth in overallliving standards, an obvious issue to be touched upon is the extent to which the livingstandards of individual income groups within society will be impacted upon. In termsof the latter, on the basis of rudimentary calculations of the average per capita real

56
income growth for those income groups most implicated in the various ageingscenarios, namely pensioners, wage earners and unemployment benefit recipients27, itis possible to assess in broad overall terms the income distribution consequencesattaching to the simulations summarised in this and the previous chapter.
As regards the specific income categories, the results of the calculations suggest thatpensioners incomes grow roughly in line with GDP growth rates in all of the scenarios.With regard to wage earners and unemployment benefit recipients, trends in relation totheir respective incomes depend on assumptions regarding the benefit rule underlyingthe individual simulations. If benefits are linked to gross wages then benefit recipientsgain relative to workers whereas if benefits are linked to net, after tax, wages then theincome growth of both groups grows roughly in proportion.
For example, in the central ageing scenario, since benefits are linked to gross asopposed to net wages, it is estimated that the income growth of benefit recipients willbe roughly half a point higher, on an annual average basis, than that of pensioners orwage earners in each year of the 50 year period. With regard to the public expenditurereform scenario, wage earners and benefit recipients gain at the expense of pensionersdue to the drop in labour taxation associated with the implicit assumption of at leastsome movement away from the present PAYG system of financing pension income.On the other hand, pensioners do relatively well out of labour market reform since,with the increase in the effective labour supply having the effect of reducing the realwage growth of workers, pensioners gain from the higher GDP growth rates emanatingfrom the reform process itself. These relative gains and losses cancel each other out inthe comprehensive reform scenario with, as assumed in the baseline, the incomegrowth of all three groups growing roughly in proportion to GDP growth.
Finally, the more equal distribution of income achieved under the latter comprehensivereform scenario (Graph 22) is an important argument in favour of this approach. Amore balanced package of reforms, compared with the more piecemeal approachassumed in the pension and labour market reform scenarios, could perhaps avoid someof the distributional conflicts which may arise when age-induced policy measures areintroduced in such a fragmented manner.
27 Calculating real incomes per worker and per unemployed person is relatively straightforward, with percapita labour income being defined as real, after tax, wage income per person employed, and with percapita benefit income being simply unemployment benefits divided by the number of unemployed. Dataproblems ensure, however, that per capita pension income calculations are not as easy. For the purposesof the present exercise it was decided to use a rough proxy and define pension income as being equal topublicly provided pension income divided by the number of over 65s in the population.
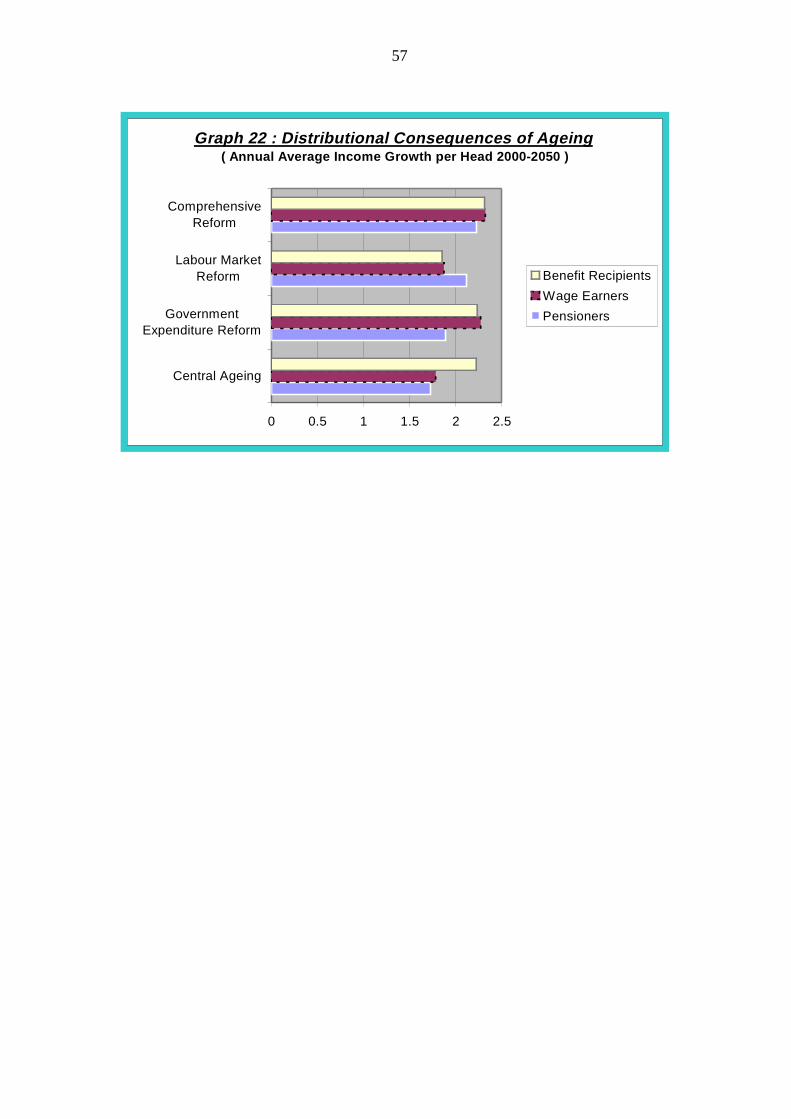
57
Graph 22 : Distributional Consequences of Ageing( Annual Average Income Growth per Head 2000-2050 )
0 0.5 1 1.5 2 2.5
Central Ageing
GovernmentExpenditure Reform
Labour MarketReform
ComprehensiveReform
Benefit Recipients
Wage Earners
Pensioners

58
CHAPTER 5: RESULTS OF COMPARABLE AGEING STUDIES
While the many partial analyses carried out on the effects of demographic change arenot comparable with the more comprehensive Quest II approach, broadly similargeneral equilibrium, multi-country, approaches to that of Quest have been carried outby other international organisations. For example the OECD (1998) using its Minilinkmodel, which was specifically set up to handle the consequences of ageing, and anearlier 1990 IMF study carried out on that institution’s Multimod model.
5.1 : OECD MINILINK MODEL STUDY OF GLOBAL CONSEQUENCES OF
AGEING
In a recent OECD Working Paper “The Macro-Economic Implications of Ageing in aGlobal Context”, Turner et al, using the OECD's new international, dynamic, andgeneral equilibrium macro model (Minilink) formulate a number of long-termscenarios which sketch out the likely national and international macro-economicconsequences of ageing in OECD countries. An attempt is also made to assess thelikely impact of policies which might be used to ameliorate or reverse the negativeeffects of ageing on the growth of productive potential and living standards.
On the basis of the available demographic projections, a baseline scenario to 2050,incorporating the main influences of ageing on the global economy, is set up whichshows that without comprehensive policy reforms on a broad range of policy fronts,leading to prolonged, trend, improvements in factor productivity growth or in labourforce participation rates, economic growth is likely to slow substantially over the next50 years in virtually all of the OECD's member states.
Minilink estimates that the projected dependency ratio increases will, using a no-policychange assumption, lead to cumulative relative reductions in the levels of GDP percapita by 2050 of about 10,18 and 23 percent for the US, the EU and Japanrespectively because of the slower annual rate of growth in living standards comparedwith the recent historical experience.
Additional simulations were run to illustrate the beneficial effects of a variety ofbudgetary and structural reform initiatives. These reforms are shown to have theirgreatest potency when implemented as a package and carried out in a timely and co-ordinated manner at the international level. Such a comprehensive approach would,according to the authors go a long way towards re-establishing earlier growth trends,with the EU likely to gain the most with an average boost of 0.7 per cent per annum inliving standards compared with gains of only 0.3 per cent per annum for the US and0.6 per cent in Japan, cumulatively raising output levels by over 40 per cent in the EUby 2050, compared with 15 and 30 per cent for the US and Japan respectively.
The relatively strong performance of the EU reflects the additional scope available inthe Community in terms of structural unemployment reductions, participation rate andlabour efficiency increases as well as in relation to budgetary consolidation. Thisscenario is particularly motivating for the Community's policy makers in that if acomprehensive policy strategy can be successfully implemented, the OECD scenariospoint to an annual average growth in living standards in the EU of two percent over the

59
period 2000-2050 compared with 1.7 per cent estimated for the period 1990-2000.Clearly on the basis of these estimates the EU has the means available to successfullytackle its upcoming dependency ratio problems.
Finally, the long-term scenarios also address the issue of whether the OECDeconomies can offset the effects of ageing on living standards by increased foreigninvestment in the non-OECD area. The conclusion on this point is that anycontribution from shifting investment away from domestic sources towards offsettingthe effects of ageing is likely to be modest given the potentially adverse effects ondomestic productivity and given the large element of uncertainty surrounding thefuture growth potential of the non-OECD region as a whole.
TABLE 15: OECD SIMULATIONS 2000 – 2050L IVING STANDARDS IN THE REFERENCE CASE AND COMBINED REFORMS SCENARIOS
EU US JapanAveragegrowth2000-50
Level by2050
1995=100
Averagegrowth2000-50
Level by2050
1995=100
Averagegrowth2000-50
Level by2050
1995=100ReferenceCaseScenario
1.3(1.7)*
195 1.1(1.7)*
176 1.1(1.5)*
176
CombinedReformsScenario
2.0 264 1.4 202 1.7 227
* Average Growth in Living Standards 1990-2000
5.2 : IMF STUDY OF G7 COUNTRIES USING THE MULTIMOD MODEL
In an article entitled “Macro-economic effects of Projected Population ageing inIndustrial Countries”, Masson and Tryon (IMF 1990) present the results of simulationsof the effects of population ageing, over the period to 2025, using the Multimod model.Multimod uses the overall dependency ratio, which combines the old age and youthratios, to capture the demographic effects, with the latter overall ratio being used withthe exogenous total population variable to determine the working age population. Thisdependency ratio variable appears in both the consumption function and on the supplyside of the model, with the labour force part of the production function being set equalto the working age population times the participation rate which is set exogenously.
The dependency ratio, acting as a proxy for population ageing effects, operates throughthree main channels in the model. Firstly, on the assumption that “life cycle” motivesfor savings operate, aggregate consumption relative to income is increased (ie savingsare reduced) by the growth in the dependency ratio. Secondly, higher dependencyratios are associated, all other things being equal, with declines in potential outputbecause of the lowering of the labour force. The outcome in terms of per capita outputis dependent upon the resulting capital stock per worker as well as on the labour forceparticipation rates. Finally, government health and pensions expenditures will be

60
increased due to the greater share of old people in the population, with the authorsspeculating that there may be some offset on education expenditure because of morefavourable youth dependency ratios.
Using estimates compiled by Heller et al. in “Ageing and Social Expenditure in theMajor Industrial Countries, 1980-2025” as inputs for the simulations, Masson andTryon simulate the net effect of ageing through the three channels alluded to earlier -reduced savings rates, a lower labour force and higher government expenditure.
In aggregate terms, the results of the simulations suggest that the macroeconomiceffects of ageing may be substantial by 2025, with all of the G7 industrial countriesexperiencing higher real interest rates and lower output over the simulation period. Inaddition, substantial long run changes in the current account and net foreign assetpositions of G7 countries are predicted due to differences in the extent and speed ofageing across countries. Finally, due in large part to endogenous tax increases, theevolution of fiscal deficits is not as dramatic as the changes which are likely to ensuein terms of external positions. Masson and Tryon conclude that the real cost to theworld economy shows up in the effect on production through a smaller labour forceand a lower capital stock.
TABLE 16 MULTIMOD RESULTS: DEMOGRAPHIC CHANGE: COMBINED
EFFECTS
(Deviations from Baseline)US JAPAN GERMANY
2000 2025 2000 2025 2000 2025Real GNP (%) -0.1 -0.1 0.4 -13.2 -0.2 -5.8
Real Interest Rate(%)
0.1 2.9 -3.3 4.8 -1.1 3.6
Current AccountBalance (% ofGDP)
1.1 2.7 -2.5 -4.0 -0.5 -0.9
Net ForeignAssets(% of GDP)
2.7 36.2 -13.4 -59.0 -3.3 -23.5
GeneralGovernmentFinancial Balance(% of GDP)
0.8 -1.3 -2.5 -1.6 -1.9 -1.5
Government Debt(% of GDP)
-1.5 3.5 7.5 27.3 6.1 19.0

61
FRANCE ITALY UK2000 2025 2000 2025 2000 2025
Real GNP (%) -0.4 -1.6 0.8 -3.3 0.0 -2.3Real InterestRate (%)
-0.3 3.0 -1.4 2.0 -0.7 2.9
Current AccountBalance (% ofGDP)
0.5 1.3 -0.4 0.2 0.4 -0.1
Net ForeignAssets(% of GDP)
2.1 11.8 -0.6 7.4 0.9 6.3
GeneralGovernmentFinancialBalance(% of GDP)
-0.3 -1.2 -0.7 -2.5 0.0 -1.1
GovernmentDebt(% of GDP)
2.2 9.0 0.3 29.0 0.2 9.5

62
SUMMARY AND CONCLUDING COMMENTS
SUMMARY OF STUDY : The essential points to be retained from the foregoinganalysis are as follows:
• Barring unexpected changes in fertility rates, or politically unthinkable migrationscenarios, Europe, and indeed the rest of the developed world, will have to livewith smaller labour forces (assuming unchanged participation rates and themaintenance of the present retirement ages) and a greater burden on those inemployment (assuming no productivity changes) due to the sharp increase in oldage dependency ratios. Furthermore, it should be underlined that in the event ofunexpected changes in the fertility rate, while in the long run the latter would bebeneficial in terms of the dependency ratio, in the short run a higher birth rateincreases the burden on the working age population.
• The report stresses the distinction between economic and demographic dependencyratios. A big problem with the demographic definition of dependency is that itdoesn’t accurately reflect the economic burden on the active proportion of thepopulation of working age and in particular on those actually in employment sinceit is only those who are in employment which are financing government transfersto the non-active population. It is clear that this latter “economic” dependencyburden on current labour income is much heavier for regions or countries with lowemployment rates. This is particularly the case with the Community relative to theUS and Japan, where the EU demographic dependency ratio in 1995 (defined asthe dependent population as a proportion of the 14-64 age group) was 49% but itseconomic dependency ratio (defined as the dependent population as a proportion ofthe overall numbers employed) was as high as 85%.
• It is also clear that these divergences between the Community, the US and Japan interms of participation rates and employment rates could have big implications interms of the economic and political sustainability of the present system of burdensharing in the Member States. For example, while the 1995 differences in terms ofdemographic dependency ratios are not that different between the three regions, thesame degree of uniformity does not apply to the economic dependency ratios. TheCommunity’s 1995 economic dependency ratio of 85% compares with ratios of75% and 59% in the US and Japan. These 10 and 26 % points differences in thetransfer burden facing EU workforces, relative to those in the US and Japanrespectively, must of course at some point reflect themselves either in higher taxes/ social security contributions in order to finance the additional transfers or in alowering of benefit payments to recipients. The latter choice between increasedtaxes or reduced benefits is a difficult one and from the scenarios presented in thepaper is one which will increasingly have to be made over the next number ofdecades. Such choices are, however, more easily made, and the solidarity betweenthe working and dependent populations is potentially less strained, when thefinancing of the ageing burden can be spread over a greater number of workers asin the US and Japan because of their higher labour force participation rates andlower unemployment rates compared with here in Europe.

63
• In assessing the extent of the budgetary challenge to be faced, an important point toremember is that, despite the relatively favourable demographics operating atpresent, the single greatest contributory factor in explaining the growth ingovernment expenditure over the last number of decades has been increases in thebudget category “Transfers to Households”. While the bulk of the spendingpressures under this latter heading have emanated from increased pensions andhealth care expenditures, less than half of the latter increases can be explicitlyattributed to demographic factors. It is clear therefore that governments will befaced not only with substantially increased age-related spending pressures in theseareas but also pressures in terms of curbing the non-demographic elements of thesebudgets. In this regard, while in the area of pensions, in general it would appearthat the period of widened eligibility and enhanced benefits, which were typical ofthe changes introduced in previous decades, is well and truly over, Governmentshave been less successful in curbing their health budgets.
• The main channels through which ageing are expected to operate are : the abovementioned expenditure pressures on the public finances; “life cycle” effects onprivate savings behaviour as well as Ricardian equivalence effects operatingthrough the deterioration in public savings; labour supply implications; potentialimpact on capital accumulation and total factor productivity; and finally theequilibrating role to be played by interest rates and exchange rates and shifts inexternal balances. All of the latter factors are discussed in some detail using apartial equilibrium framework.
• Looking at the ageing problem using the latter partial equilibrium approach, whileinteresting and elucidating in terms of highlighting the key influences at work, inthe final analysis is less than satisfactory since it fails to take account of systemic,dynamic, forces which will undoubtedly kick into action once ageing starts toimpact on the economic systems of the respective countries. Estimating the effectsof ageing using a static or partial equilibrium analysis is in fact prone to threemajor sources of problems : Firstly, policy adjustments are inevitable in order toavoid the development of unsustainable private or public sector imbalances.Secondly, the emergence of tensions or imbalances in an economy is normallyfollowed by corrective, general equilibrium, feedback effects such as changes ininterest rates or exchange rates, in the level and composition of savings, in thebehaviour of consumers and investors and even, in certain circumstances, inchanges in the rate of technical progress, all of which must be taken into account inassessing the final impact of ageing. Finally, global interdependencies ensure thatchanges in the relative current account and net foreign asset positions of countries /geographical zones need to be adequately modelled in order to assess the impact ofan ageing process which is not occurring at uniform speeds or intensity acrosscountries or regions of the world.
• The general equilibrium approach used in this paper, using the QUEST II model,overcomes, the above mentioned, key limitations of the partial approach, withQUEST’s consistent modelling of the various trade and financial linkages betweeneconomies, and especially between the Community’s Member States and the USand Japan, ensuring that all dimensions of the ageing problem can be looked at,including the crucial systemic issues, by definition excluded by partial analyses.

64
• Simulations with the QUEST II model, which take explicit account of the labourforce and public finance implications of ageing, suggest per capita living standardsin the EU, US and Japan are likely to fall significantly over the next 50 years dueto the direct influence of the ageing process. The effect of ageing populations interms of slowing the rate of growth of potential output will also make thebudgetary implications of ageing more difficult for the individual economies tobear. If the scenarios prove accurate, economic agents in Europe could be lookingat an annual half point reduction in potential growth rates from the present 2 ¼percent to an average rate of 1 ¾ percent over the period 2000-2050, representinga cumulative GDP loss of nearly 20 percent. Cumulative reductions of 10% and21½% are predicted for the US and Japan respectively. While it can be argued thatthe latter no policy change simulation may be unrealistic in that Governments areunlikely to stand idly by, it nevertheless gives an idea of the scale of the task facedby policymakers in devising policy measures aimed at avoiding, or at leastcushioning, the potential shock to peoples’ living standards.
• The degree of uniformity of the results from the Minilink, Multimod and Quest IIsimulations suggests that the only arguments emanate from the degree as opposedto the direction of the expected effects. Even allowing for private savings effects atthe lower end of the expected range, the investment and growth effects remainconsiderable. In other words, changing key savings parameters in the model (egprivate savings effect, degree of Ricardian Equivalence etc) would not radicallyalter the essential conclusions. The only area where significant doubt remains is inrelation to technical progress where both the extent and even the direction of anyageing impact is still unclear.
• Given the likelihood of a substantial reduction in GDP growth rates, the MemberStates will have to look at a range of macro and structural policy actions to cushionthe impact on living standards. The possible policy responses in the Community tooffset the negative effects of ageing are grouped under three broad headings in thepaper: budgetary, labour market and productivity, the impact of which is assessedusing QUEST II simulations:
1. BUDGETARY : If the provisions of the Stability and Growth Pact (SGP) areadhered to over the coming years, not only will national savings benefit but asounder fiscal position will ensure more favourable debt dynamics when thepublic sector spending pressures from ageing start to emerge. Assessing therole to be played by budgetary policy is carried out by looking at the results oftwo simulations: firstly, a simple illustration of the importance of adhering tothe provisions of the SGP, by looking at the debt and debt servicingimplications of the “non-financing” alternative; and secondly, an examinationof the case where any age-related increases in government expenditures arefinanced on the expenditure side of the budget. This latter simulation, giventhat the bulk of the additional ageing costs are attributable to the pensionsbudget, amounts to a pension reform scenario since some movement away fromthe present PAYG system of financing is implicitly assumed.
2. LABOUR MARKET : The possibility, through labour market reforms, ofneutralizing the labour force implications arising out of the demographicdevelopments is examined in some detail. For the purposes of this labour

65
market simulation it is assumed that some combination of longer workinglifetimes, higher participation rates and/or lower NAIRU’s will be forthcomingfrom the reform initiatives introduced by the respective governments. If such acomprehensive labour market reform programme can be introduced the resultsof the simulation suggest that the GDP impact of ageing can be effectivelyeliminated with growth rates being restored to the Quest baseline rates. Thislabour market reform package is introduced in the model in the form of anincrease in EU labour market participation rates of the order of 10 percentagepoints, which would bring the latter rates close to the present US and Japaneseparticipation rates. It should be noted that an increase of 10 percentage pointsmay appear ambitious but when one compares the present relatively low levelof EU participation rates with those pertaining internationally and the fact thata country such as the US has been able to increase its participation rates by 11½ percentage points over a 25 year period (1970-95), one realises that theobjective of a 10 % points increase over 50 years in the EU is an attainable one.
3. PRODUCTIVITY : The final avenue explored in the paper is the promotion ofhigher factor productivity growth through structural reforms aimed atenhancing the efficiency and flexibility of goods, services and capital marketsin the Community, whilst acting to ensure open and competitive tradingconditions at the global level. For this final simulation, “pension” plus labourmarket reforms allied to a small technical progress shock to reflect the gains tobe achieved from introducing such a comprehensive package of reforms, areintroduced in the model to get an idea of their combined impact. The overallconclusion to be drawn from this last simulation is that if governments aresuccessful in introducing a reform package on this scale then the economicimplications of ageing are capable of being more than offset in the Communityas a whole.
CONCLUDING COMMENTS : The unprecedented speed and extent of the ageingphenomenon presents governments with a number of important economic policychallenges28.
• First and foremost, policy-makers will need to increasingly address theconsequences of ageing for future standards of living and face up to the painfulintertemporal transfer choices to be made in this regard i.e. how much should thepresent generation transfer in terms of physical and human capital in order toensure that the retirement of the “baby boom” generation doesn't poseinsurmountable problems.
28 OECD (1996) « An ageing perspective provides policy makers with valuable insights on futurechallenges and potential directions. It is particularly powerful in understanding medium and longer-runchallenges; demography is one of the few areas where it is possible to make meaningful projections thatextend well into the next century. However, it is only a partial perspective. Ageing rarely operates inisolation from other forces of change- such as technology or trade……A longer-term perspective doesnot mean that policy action can be postponed. In many countries, a window of opportunity exists inwhich to address both short- and long-term policy goals in ways which are mutually reinforcing.Further, unless action is taken soon, problems are likely to be much worse after 2010 in most Membercountries as the heaviest effects of ageing populations begin to be felt »
66
• Secondly, as stressed consistently throughout the paper, fiscal policy will need tobe closely scrutinised in order to be able to cater for the inevitable age relatedspending pressures which will emerge, without provoking the development ofunsustainable deficit and debt positions and significant disincentive effects inrelation to work effort and labour supply decisions. The latter spending pressureshave in fact already started to manifest themselves in Japan and will becomeincreasingly evident here in the Community in about 10-15 years time. In addition,this process of fiscal policy scrutiny invariably touches on the question of intra-and intergenerational burden sharing and the extent to which the politicalunderpinnings for such budgetary transfers, both within and across generations,will be able to withstand the extent of the age-related transfers involved. This infact is one of the big unknowns in terms of predicting the future impact of ageing.With an increasing proportion of national resources being transferred to the retiredpopulation, it is difficult at this point in time to speculate as to the extent whichthese changes in the distribution of societies resources, between the employed anddependent populations, will be capable of being resolved without major crises andinter-generational conflicts.
• Thirdly, it is clear from the results of the QUEST II simulations presented earlierthat despite the normal uncertainty zones surrounding the estimates of themagnitude of the effects, that there is no “quick fix” available to reduce theinevitable economic burden of ageing. With the number of older people projectedto grow relative to those of working age, the share of the population contributing toeconomically measurable productive activities is reduced. Increases in productivecapacity or the foregoing of current consumption i.e. increased saving, representthe only means available for economies to attenuate the pressures of ageing onfuture working-age populations.
• Fourthly, in terms of policy prescriptions, governments will need to adopt a multi-faceted approach in order to moderate the economic burden of ageing, combiningfiscal consolidation; pension & health care reforms; labour market reforms,including action to boost labour force participation rates and to increase theeffective retirement age to reflect increased longevity; and finally structural reforminitiatives to enhance the efficiency of resource allocation and to stimulate higher,sustainable, rates of economic growth. The economic impact of the “greying” ofthe population over the next 50 years will only become unbearable for theCommunity in the event that its labour markets, and by implication its tax andsocial security systems, remain in their present state and if the SGP is not adheredto29.
• Finally, in operational terms, one of the key conclusions to be drawn from thisanalysis is the importance of initiating research into the practical and politicaldifficulties of introducing a fully funded pension system. While health care costsare clearly an issue, the pure ageing effects on health care budgets is dwarfed bythe expected pensions increases. While the fully funded approach raises difficult
29 As stated in Bovenberg and van der Linden « Just as with other trends that affect our society, ageingrequires countries to adapt their economies……countries have many alternative ways to do just that.Since ageing is a rather predictable trend, countries have ample time to adjust. Indeed, we advocate thatcountries spread their eggs not only over various policy measures but also over time. Gradually phasingin policy measures and announcing these measures early, avoids abrupt, painful policy corrections. »

67
political and financial market issues, as well as concerns in terms of the ownershipand prudential rules to be applied to the accumulated funds, the economic case putforward in the present paper allied to looming demographic pressures on thePAYG system must surely mean that, over the next 50 years, all countries willmove at least partially away from the latter PAYG system.

68
List of references
Auerbach, A. and L. Kotilkoff (1987), “Dynamic Fiscal Policy”, CambridgeUniversity Press.
Ball, L. and G. Mankiw (1995), “What do Budget Deficits do”, NBER WorkingPaper 5263 (September).
Blöndal, S. and S. Scarpetta (1998),“The Retirement Decision in OECD Countries”,OECD Working paper N° 202.
Börsch-Supan, A (1996),“The Impact of Population Ageing on Savings, Investmentand Growth in the OECD area” – see OECD (1996 B).
Bosworth, B., G. Burtless and J. Sabelhaus (1991),“The Decline in Saving:Evidence from Household Surveys”, Brookings Papers on Economic Activity.
Bovenberg, A.L. and A.S.M. Van der Linden (1997),“Can we afford to grow old?”,CPB Netherlands Bureau for Economic Policy Analysis.
Bryant, R. and W.J. McKibbin (1995), “Macroeconomic Effects on DevelopingEconomies of Shocks in the OECD: Evidence from Multi-Country Models” in D.Vines and D. Currie (Eds) “North-South Linkages and International Macro EconomicPolicy”.
Bernheim, D. (1987), “Ricardian Equivalence: An Evaluation of Theory andEvidence”, NBER Macro-Economics Annual, S. Fischer (Ed), MIT Press.
Card, D. (1994), “Intertemporal Labour Supply: An Assessment” in “Advances inEconometrics: Sixth World Congress”, C. Sims (Ed), Cambridge University Press.
Carrol, C. (1997), “Buffer Stock Saving and the Life Cycle / Permanent IncomeHypothesis”, Quarterly Journal of Economics, 112.
Chand, S and A. Jaeger (1996),“Ageing Populations and Public Pension Schemes”,IMF Occasional Paper No. 147 (December).
Cutler, D., J. Poterba, L. Sheiner and L. Summers (1990),“An Ageing Society:Opportunity or Challenge?”, Brookings Papers on Economic Activity, Vol 1.
Deaton, A. (1992),“Understanding Consumption” Oxford University Press.
European Economy N° 56 (1994):“Some Economic Implications of DemographicTrends up to 2020”, Study N°5.
European Economy N° 3 (1996),“Ageing and Pension Expenditure Prospects in theWestern World”.

69
European Economy, N°4 (1997),“The welfare state in Europe – Challenges andreforms”.
Eurostat (1996),Population Projections 1995-2050.
Faruquee, H., D. Laxton and S. Symansky (1996),“Government Debt, Life CycleIncome and Liquidity Constraints: Beyond Ricardian Equivalence”, IMF WorkingPaper (December)
Feldstein, M. (1980), “International Differences in Social Security and Saving”,Journal of Public Economies, Vol 14 (October).
Fougère, M. and M. Merette (1998),“Population Ageing, Intergenerational Equityand Growth: Analysis with an Endogenous Growth, Overlapping–Generations Model”,Department of Finance, Government of Canada Working Paper, June.
Franco, D. and T. Munzi (1996), “ Public Pension Expenditure Prospects in theEuropean Union: A Survey of National Projections” in European Economy N° 3 of1996.
Franco, D. and T. Munzi (1997),“Ageing and Fiscal Policies in the European Union”in European Economy, N° 4 of 1997.
Graham, J.W. (1987),“International Differences in Saving Rates and the Life CycleHypothesis”, European Economic Review, Vol 31.
Group of Ten (1998), “The Macroeconomic and Financial Implications of AgeingPopulations” (April).
Gruber, J. and D. Wise (1997),“ Social Security Programs and Retirement Aroundthe World”, NBER Working Paper N° 6134 (August).
Hagemann, R.P. and G. Nicoletti (1989),“Population Ageing: Economic Effects andSome Policy Implications for Financing Public Pensions”, OECD Economic Studies,N° 12.
Haque, N. and P. Monteil (1989),“Consumption in Developing Countries: Tests forLiquidity Constraints and Finite Horizons”, Review of Economics and Statistics(August).
Hayashi, F., A. Ando and R. Ferris (1988),“Life Cycle and Bequest Savings”,Journal of the Japanese and International Economies, Vol 2.
Heller, P. and S. Symansky (1997),“Implications for Savings of Ageing in the Asian“Tigers” , IMF Working Paper.
Heller, P., R. Hemming and P. Kohnert (1986),“Ageing and Social Expenditure inthe Major Industrial Countries, 1980 – 2025”, IMF Occasional Paper N° 47.
Horioka, C. (1986),“Why is Japan’s Private Saving Rate so High?” IMF (June).

70
Horioka, C. (1991), “The Determinants of Japan’s Saving Rate: The Impact of theAge Structure of the Population and Other Factors”, Economic Studies Quarterly, Vol42 (Sept).
Hviding, K. and M. Merette (1998), “Macroeconomic Effects of Pension Reforms inthe Context of Ageing Populations: Overlapping Generations Model Simulations forSeven OECD Countries”, OECD Working Paper N° 201.
Kohl, R. and P. O’Brien (1998), “The Macroeconomics of Ageing, Pensions andSavings: a Survey”, OECD Working Paper AWP 1.1.
Koskela, E. and M. Viren (1989),“International Differences in Saving Rates and theLife Cycle Hypothesis: A Comment”, European Economic Review, Vol 33.
Leibfritz, W., D. Roseveare, D. Fore and E. Wurzel (1995),“Ageing Populations,Pension Systems and Government Budgets: How do they Affect Saving?”, OECDWorking Paper N° 156.
Masson, P. and R.W. Tryon (1990), “Macroeconomic Effects of ProjectedPopulation Ageing in Industrial Countries”, IMF Staff Papers ( September).
Masson, P.R., T. Bayoumi and H. Samiei (1995),“International Evidence on theDeterminants of Private Saving”, IMF Working Paper N° 51.
Meredith, G. (1995), “Demographic Change and Household Saving in Japan” in“Saving Behaviour and the Asset Price “Bubble” in Japan”, IMF Occasional Paper N°124.
Miles, D. (1999), “Modelling the Impact of Demographic Change Upon theEconomy”, The Economic Journal, Vol 109 N° 452.
Modigliani, F. (1970), “The Life Cycle Hypothesis of Saving and IntercountryDifferences in the Saving Ratio”, in “Induction, Growth and Trade”, edited by W.A.Eltis, M.F. Scott and J.N. Wolfe.
Modigliani, F. and A. Sterling (1983),“Determinants of Private Savings with SpecialReference to the Role of Social Security – Cross Country Tests”, in “The Determinantsof National Saving and Wealth”, edited by F. Modigliani and R. Hemming.
Modigliani, F. (1986), “Life cycle, Individual Thrift and the Wealth of Nations”,American Economic Review, Vol 76, N° 3.
OECD (1988),“Reforming Public Pensions”.
OECD (1990),OECD Economic Surveys: Japan.
OECD (1996a),“Ageing in OECD countries – A Critical Policy Challenge’, SocialPolicy Studies N° 20.

71
OECD (1996b),“Future Global Capital Shortages – Real Threat or Pure Fiction?”.
OECD (1997),“Education Policy Analysis”, OECD Centre for Educational Researchand Innovation.
OECD (1998a), “Education at a Glance – OECD indicators”, OECD Centre forEducational Research and Innovation.
OECD (1998b),“Maintaining Prosperity in an Ageing Society”.
Oxley, H. and M. MacFarlan (1994), “Health Care Reform: Controlling Spendingand Increasing Efficiency”, OECD Working Paper N° 149.
Richardson, P. (1997),“Globalisation and Linkages: Macro-structural Challenges andOpportunities”, OECD Working Paper N° 181.
Roeger, W. and J. in ‘t Veld (1997),“Quest II: A Multi-country Business Cycle andGrowth Model”, DG II Economic Papers Series N° 123 (October).
Romer, P. (1990),“Capital, Labour and Productivity”, Brookings Papers on EconomicActivity.
Roseveare, D., W. Leibfritz, D. Fore and E. Wurzel (1996),“Ageing Populations,Pension Systems and Government Budgets: Simulations for 20 OECD countries”,OECD Working Paper N° 168.
Schmidt-Hebbel, K., S.B. Webb and G. Corsetti (1992),“Household Saving inDeveloping Countries: First Cross-Country Evidence”, World Bank EconomicReview, Vol 6 (September).
Seater, J. (1993),“Ricardian Equivalence”, Journal of Economic Literature, Vol 31,N° 1.
Seater, J. (1999),“Testing the Permanent Income – Life Cycle Hypothesis withAggregate Data”, Macroeconomic Dynamics Vol 2.
Shibuya, H. (1987),“Japan’s Household Saving Rate: An Application of the LifeCycle Hypothesis”, IMF Working Paper 87/15.
Simon, J. (1986),“Theory of Population and Economic Growth”, Oxford: Blackwell.
Tait, A. and P. Heller (1982), “International Comparisons of GovernmentExpenditure”, IMF Occasional Paper N° 10.
Turner, D., C. Giorno, A. De Serres, A. Vourc’h and P. Richardson (1998),“TheMacroeconomic Implications of Ageing in a Global Context”, OECD Working PaperN° 193.
United Nations (1996),“The Sex and Age Distribution of the World’s Populations:The 1996 Revision”, UN Population Division, New York.

72
Van den Noord, P. and R. Herd (1993),“Pension Liabilities in the Seven MajorEconomies”, OECD Working Paper N° 142.
Wattenberg, B. (1987),“The Birth Dearth”, Pharos Books, New York.