The Economic Consequences Associated with Integrated ...
47
Electronic copy available at: http://ssrn.com/abstract=2699409 The Economic Consequences Associated with Integrated Report Quality: Early Evidence from a Mandatory Setting Mary E. Barth a , Steven F. Cahan b , Li Chen b , Elmar R. Venter c,† a Graduate School of Business, Stanford University, USA b University of Auckland, Auckland, New Zealand c University of Pretoria, Pretoria, South Africa [email protected] The financial support of the Chartered Institute of Management Accountants (CIMA) is gratefully acknowledged. The authors would like to thank EY and the College of Accounting at the University of Cape Town for making their data available to us. We appreciate research assistance from Casey Cahan. We are grateful for comments from Keryn Chalmers, Jenny Hoobler, Jeong-Bon Kim, Wayne Landsman, Shiva Rajgopal, Katherine Schipper, Ann Tarca, participants at the 2014 Global Emerging Scholars Workshop of the American Accounting Association, and participants at the paper development workshops of the International Association for Accounting Education and Research in Florence (2014) and East-London (2015) on previous versions of this paper. † Corresponding author
Transcript of The Economic Consequences Associated with Integrated ...

Electronic copy available at: http://ssrn.com/abstract=2699409
The Economic Consequences Associated with Integrated Report Quality: Early Evidence from a Mandatory Setting
Mary E. Bartha, Steven F. Cahanb, Li Chenb, Elmar R. Venterc,†
a Graduate School of Business, Stanford University, USA
b University of Auckland, Auckland, New Zealand
c University of Pretoria, Pretoria, South Africa [email protected]
The financial support of the Chartered Institute of Management Accountants (CIMA) is gratefully acknowledged. The authors would like to thank EY and the College of Accounting at the University of Cape Town for making their data available to us. We appreciate research assistance from Casey Cahan. We are grateful for comments from Keryn Chalmers, Jenny Hoobler, Jeong-Bon Kim, Wayne Landsman, Shiva Rajgopal, Katherine Schipper, Ann Tarca, participants at the 2014 Global Emerging Scholars Workshop of the American Accounting Association, and participants at the paper development workshops of the International Association for Accounting Education and Research in Florence (2014) and East-London (2015) on previous versions of this paper.
† Corresponding author

Electronic copy available at: http://ssrn.com/abstract=2699409
Abstract
We examine whether integrated report quality (IRQ) is associated with stock liquidity, firm
value, expected future cash flow, and cost of capital. Our study is motivated by the recent
focus on sustainable capitalism and the global interest shown by firms, investors, and
regulators in the work of the International Integrated Reporting Council (IIRC). We use data
from South Africa because it is the only country where integrated reporting is mandated. We
use a measure of integrated reporting quality based on proprietary data from EY who rate
these reports as part of its Excellence in Integrated Reporting awards. We find that integrated
reporting is positively associated with both stock liquidity (measured using bid-ask spreads)
and firm value (measured using Tobin’s Q). Our results are consistent whether we analyze
levels or changes. When we decompose the firm value into an expected future cash flow
effect and cost of capital effect, we find that the positive association between integrated
reporting quality and firm value is driven mainly by the cash flow effect, consistent with
investors revising their estimates of future cash flows upward as a result of a better
understanding of the firm’s capitals and strategy or future cash flows increasing because of
improved internal decision making by managers. We provide results from a DuPont analyses
which are consistent with the latter conjecture.
Keywords: Integrated reporting, corporate social responsibility, firm value, cost of capital,
stock liquidity, South Africa

1
“Mandate integrated reporting.”
− Al Gore and David Blood, “A Manifesto for Sustainable Capitalism” (2011)
1. Introduction
The International Integrated Reporting Council (IIRC) (2003, 7) defines an integrated
report as a “concise communication about how an organization’s strategy, governance,
performance and prospects lead to the creation of value over the short, medium and long
term” (IIRC, 2013, 7). In a 2011 Wall Street Journal article, former US Vice President Al
Gore and David Blood identified mandating integrated reporting as one of five steps needed
to support a “sustainable capitalism” where businesses focus on long-term value creation.
They argue that integrated reports allow investors to make better resource-allocation
decisions by providing a more comprehensive view of the firm, and they state that while
“voluntary integrated reporting is gaining momentum, it must be mandated by appropriate
agencies such as stock exchanges and securities regulators to ensure swift and broad
adoption” (Gore & Blood, 2011). The purpose of our study is to provide early evidence on
the economic consequences of the quality of mandated integrated reports, in terms of stock
liquidity, firm value, expected future cash flows, and cost of equity capital, from South
Africa, which is currently the only country that requires integrated reporting on a mandated
basis.1
One motivation for our study is to better understand the implications of this new
reporting framework. Integrated reporting is gaining traction at the firm, country, and
international levels. For example, over 100 leading multinationals including Pepsi, HSBC,
Unilever, Deutsche Bank, National Australia Bank, and Tata Steel participated in the IIRC’s
voluntary pilot integrated reporting program; standard-setters and professional bodies in
1 South Africa has required integrated reporting for firms listed on the Johannesburg Stock Exchange (JSE) on an apply-or-explain basis since 2010. While this means that a firm can opt out of providing an integrate report as long as the choice is explained, KPMG (2013) finds that the 97 percent of South Africa firms provide integrated reports in 2011 and 98 percent provide them in 2013. Consequently, integrated reporting is effectively mandated in South Africa.

2
Australia, Brazil, India, Japan, and Singapore have expressed various levels of rhetorical
support for integrated reporting; and international organizations, such as the European
Commission and the Business 20 (B20) Summit, have made statements supporting integrated
reporting.2 Further, the IASB and FASB have started to engage with standard-setting bodies
focusing on alternative disclosure models, including the IIRC, as part of the Corporate
Reporting Dialogue.3 However, currently, empirical evidence on the benefits associated with
integrated reporting is sparse (e.g., see Huang & Watson, 2015).
Our second motivation is to extend the academic literature on the implications of new
accounting frameworks. For example, there is a sizeable literature on the effects of
mandatory adoption of IFRS (e.g., Daske, Hail, Leuz, & Verdi, 2008; Armstrong, Barth,
Jagolinzer, & Riedl, 2010; Li, 2010). We add to this literature by examining the effects
associated with the mandatory adoption of a new reporting model rather than a new set of
accounting standards. That is, while IFRS affects the production of financial information,
integrated reporting emphasizes non-financial information and how it is disclosed. We are
unaware of another setting where a country has mandated a new reporting model.4
We examine the association between integrated report quality (IRQ) and a firm’s
stock liquidity, firm value, expected future cash flows, and cost of capital. To measure IRQ,
we use proprietary data from EY who each year rate the quality of the integrated reports of
the top 100 firms listed on the Johannesburg Stock Exchange (JSE). We have access to each
firm’s quality category, which is released publicly, as well as the underlying scores for each
specific quality dimensions, which are not publicly available. According to the chair of the
2 B20 is a group of business leaders from large companies which tries to influence governments of the G20. 3 For example, Huguette Labelle, chair of the Dialogue, states, “The corporate reporting landscape is changing. For too long, reporting has been fragmented and disconnected from the strategic drivers of value. The Corporate Reporting Dialogue represents the coming together of organizations that have the combined power to shape the future corporate reporting landscape, creating a cohesive, meaningful and durable roadmap that builds business and investor confidence” (see http://corporatereportingdialogue.com). 4 Several studies examine the effects of qualitative information disclosed in the management discussion and analysis (MD&A) section (e.g., Bryan, 1997; Clarkson, Kao, & Richardson, 1999) which, for example, has been mandated in the US since 1980. However, the MD&A section is only a small part of a firm’s external reporting package.

3
EY panel that rates the reports, the ratings focus on the quality of the disclosure, e.g., whether
the integrated report gives readers a sense of the issues that are fundamental to the operations
of the firm.
We find IRQ is negatively associated with the bid-ask spread, our measure of stock
liquidity, after controlling for corporate governance, corporate social responsibility (CSR)
performance, accounting quality, firm complexity, overall disclosure quality, and other
factors. To provide a stronger link between IRQ and the bid-ask spread and to reduce the
likelihood of correlated omitted variables, we also run a changes model and find that firms
with larger year-to-year increases in IRQ have larger decreases in their bid-ask spreads.
We also find a positive relation between IRQ and firm value measured by Tobin’s Q.
We focus on Tobin’s Q because it measures the excess of the market value of assets over
their book values and the IIRC Framework requires firms to report on capitals, such as
intellectual, human, environmental, and social and relationship capital, which are only
partially, or not at all, reflected in the book value of assets. Our use of Tobin’s Q is also
consistent with the IIRC Framework that states that the primary purpose of an integrated
report is to explain to investors how an organization creates value over time. We find that
IRQ is positively related to Tobin’s Q whether we use levels or changes.
In our next analyses, we decompose firm value into a numerator effect (expected
future cash flows) and denominator effect (discount rate) to examine the channel(s) through
which integrated reporting quality increases firm value. Similar to Plumlee et al. (2015), we
use analysts’ estimates of future stock prices (target prices) discounted back to the current
period as a proxy for expected future cash flows. Both our levels and changes models support
a positive and significant association between IRQ and expected future cash flows. We use
the target price method of Botosan and Plumlee (2002) to estimate cost of capital. We find
evidence supporting a relation between the level of IRQ and the level of cost of capital, but

4
IRQ is not significant in the changes specification. Further, our results are weaker when
alternative measures of cost of capital are used.
Thus, we conclude that IRQ affects firm value mainly through expected cash flows.
IRQ can allow investors to better appreciate a firm’s strategy and business model, leading to
improved estimates of future cash flows. Further, integrated reporting may affect the thought
process of management – often referred to as “integrated thinking” – leading to improved
operating and investing decisions that generate higher cash flows. In our last set of analyses,
we probe the integrated thinking channel further by conducting a DuPont analysis. We find
that current changes in IRQ are positively associated with year-ahead changes in asset
turnover, return on assets, and return on equity. We take this as preliminary evidence that
integrated reporting is associated with improved decision making by managers, in particular
through better utilization of assets. Overall, our study suggests high quality integrated reports
can have positive economic consequences.
The remainder of the paper is organized as follows. Section 2 provides the
background to integrated reporting. Section 3 discusses the related literature and develops the
hypotheses. Section 4 details the research design. Section 5 presents the results and additional
analyses. Section 6 concludes.
2. Background on integrated reporting
2.1. Outside South Africa
In the wake of the global financial crisis and supported by the Accounting for
Sustainability (A4S) initiative led by HRH The Prince of Wales, the IIRC was established in
2010 to develop a framework for integrated reporting and to promote its use. Issued in 2013,
the IIRC Framework states that the primary purpose of an integrated report is to explain to
providers of financial capital how an organization creates value over time. The Framework is
principles based and does not provide a standard format for integrated reports or specify

5
specific disclosure requirements. Instead the Framework sets out seven guiding principles and
eight content elements for an integrated report. In turn, these principles and elements relate to
six capitals that the organization uses to create value, which allows managers to provide a
narrative that explains how the firm creates value.5
Integrated reporting has recently been gaining wider acceptance. Some examples at
the country level since 2013 include: a report of the Expert Committee on Desirable Market
Economy System commissioned by the Japanese Prime Minister recommending integrated
reporting for Japanese firms (IIRC, 2014), the US Sustainability Accounting Standards Board
and the IIRC reaching a memorandum of understanding to accelerate the practical
implementation of integrated reporting (SASB, 2014)6, the chief executive of the Singapore
Accountancy Commission announcing plans for Singapore to “become the hub for integrated
reporting in South-East Asia” (Kee, Larsen, & Seng, 2014, 22), the main Brazilian stock
exchange encouraging listed firms to participate in a “report or explain” campaign on
sustainability reports that includes integrated reports (BM&FBOVESPA, 2014), Australia’s
largest super funds embracing integrated reporting (Kitney, 2014), and the chairman of the
Securities and Exchange Board of India (SEBI) announcing his intention to issue guidelines
on integrated reporting for listed firms in India (Business Standard Reporters, 2014).
At the international level, in releasing a directive on environmental, governance, and
social (ESG) information in April 2014, the European Commission (EC) acknowledged that
integrated reporting is “a step ahead” of its own ESG disclosure requirements and that it is
“monitoring with great interest the evolution of the integrated reporting concept, and, in
particular, the work of the IIRC” (EC, 2014, 3). In June 2014, the B20 Summit released a
5 The seven guiding principles are: strategic focus and future orientation, connectivity of information, stakeholder relationships, materiality, conciseness, reliability and completeness, and consistency and comparability (IIRC, 2013). The eight content elements are: organizational overview and external environment, governance, business model, risks and opportunities, strategy and resource allocation, performance, outlook, and basis of preparation (IIRC, 2013). The six capitals are: financial, manufacturing, human, intellectual, social and relationship, and natural capital (IIRC, 2013). 6 The SASB is an organization that establishes and maintains industry-specific standards for use in disclosing material sustainability issues in annual filings to the Securities and Exchange Commission.

6
report on “unlocking investment in infrastructure” in which one of its key recommendations
to the G20 finance ministers is that corporate reporting should provide investors with a
“longer-term and broader perspective on shareholder value creation”, specifically referring to
integrated reporting as an example (B20, 2014, 2).7 Finally, the IIRC specifically refers to the
period 2014-2017 as the “breakthrough phase” as it aims to achieve “a meaningful shift
toward early adoption” of integrated reporting by reporting entities around the world (IIRC,
2014, 3).
Several surveys have been conducted to ascertain preparer’s and user’s views of
integrated reporting. For example, Black Sun (2014), a consulting firm, obtained survey
responses from 66 organizations that took part in the IIRC’s pilot program mentioned above.
92 percent of respondents agreed that integrated reports give users a clearer view of how their
organization creates values, 79 percent agreed that integrated reporting gives investors greater
confidence in the long-term viability of the organization’s business models, and 65 percent
agreed that integrated reporting improved the organization’s own internal decision making
(Black Sun, 2014). Moreover, Black Sun found that organizations have more positive
responses once they have prepared at least one integrated report. However, as participation in
the pilot program was voluntary, these responses may be biased upward.
Consistent with this possibility, a 2014 survey of 200 CFOs in Ireland and the UK by
the Association of Chartered Certified Accountants (ACCA) reflects more cautious views
about integrated reporting. In contrast to the Black Sun survey, almost 50 percent are waiting
to see how integrated reporting develops before deciding whether to prepare an integrated
report, and 10 percent have no intention to prepare an integrated report unless it is required
(ACCA, 2014). These responses illustrate the different attitudes of voluntary adopters from
non-voluntary adopters, and suggests the ‘benefits’ of integrated reporting for the general
7 B20 is a group of business leaders from large companies which tries to influence governments of the G20.

7
population of firms may not be as substantial as suggested by pilot program participants and
other integrated reporting advocates.
2.2. South Africa
Integrated reporting in South Africa pre-dates the establishment of the IIRC and
release of the framework. To address concerns about ineffective management in the post-
apartheid era, in 1993, the South African Institute of Directors commissioned the King
Committee with the mandate to promote the highest standards of corporate governance in
South Africa (West, 2006). Hence, South Africa’s history of apartheid has been influential in
shaping social and environmental governance (De Villiers, Rinaldi, & Unerman, 2015). The
first King Report (King I), largely based on the UK Cadbury Report, was issued during 1994.
A second report (King II) was released in 2002. With changes to South African companies
law, the King Committee issued a third report (King III) in 2009.
A key recommendation of King III is that firms are required to prepare an integrated
report to present the firm’s performance in terms of both its finance and sustainability. The
board of directors is charged with the responsibility to ensure the integrity of the integrated
report. The move towards integrated reporting was fueled by the belief of the Committee that
conventional financial reporting was no longer meeting the needs of firms’ stakeholders. For
example, Mervyn King, the chairman of the King Committee and the IIRC, states (King,
2013, 5):
At the beginning of the 21st century it was appreciated that some 80% of the value of companies was not represented by additives in a balance sheet according to International Financial Reporting Standards. To understand value, therefore, there had to be a shift in thinking from a focus in value being seen in the context of future cash flows. Value embraces the impact of the financial aspects on the non-financial aspects and vice versa and how a board has applied its collective mind to the material sustainability issues of a company in its long-term strategy.

8
Since the King Code is a JSE listing requirement, the release of King III meant that
listed firms were required to issue an integrated report for periods on or after March 1, 2010,
or explain why they do not wish to apply this principle of King. During May 2010, the
Integrated Reporting Committee of South Africa (IRC) was established to develop guidelines
on good integrated reporting practices. The IRC’s discussion paper on a framework for an
integrated report, released on January 25, 2011, was the first national initiative on integrated
reporting. During March 2014, the IRC endorsed the Framework of the IIRC for South
African firms and ceased its own guidance.
3. Hypothesis development
3.1. Research on integrated reports
As Huang and Watson (2015) note in their literature review of research on corporate
social responsibility, the research on integrated reporting is sparse. However, there are a few
recent studies that explore the implications of integrated reporting in various contexts.
For example, using a self-constructed measure of the level of alignment between the
firm’s integrated report and the 2012 draft IIRC Framework to measure IRQ, Zhou, Simnett,
and Green (2015) find a negative association between changes in the level of alignment and
subsequent changes in analyst forecast error and analyst forecast dispersion for a sample of
South African firms over their sample period from 2009 to 2012. They also find a negative
association between changes in the level of alignment with the 2012 draft IIRC Framework
and subsequent changes in cost of equity capital, but only for firms with low analyst
following. Bernardi and Stark (2015) find a significantly negative association between
Bloomberg ESG scores and analyst forecast accuracy for 40 South African firms in the post-
integrated reporting period, but not in the pre-period. Their evidence is consistent with
integrated reporting making ESG disclosures useful for analysts, although they find their
results are driven by environment-related disclosures, leading them to suggest that integrated
9
reporting may thus be less useful for some industries such as financial services. In contrast to
Zhou et al. (2015) and Bernardi and Stark (2015) who focus on financial analysts, we focus
on the effects of IRQ on investors in general as we are interested in the market-wide
implications of mandating integrating reporting.
Arguelles, Balatbat, and Green (2015) examine the benefits of integrated reporting for
early adopters using an international sample. They find that there is a stronger association
between the degree of adherence to integrated reporting principles (constructed from
Thomson Reuters’ Asset 4 data) and market value of equity for early adopters of integrated
reporting relative to non-adopters. However, this result is not surprising as the majority of the
early adopters of integrated reporting in Arguelles et al.’s (2015) sample are voluntary
adopters. By contrast, our study focuses on the capital market benefits for mandatory
adopters.
Finally, Serafeim (2015) finds that US firms that practice integrated reporting have a
longer-term oriented investor base with more dedicated and fewer transient investors than
firms that are weaker at integrated reporting. Thus, Serafeim’s (2015) focus is also on
voluntary adopters. In addition, like Bernardi and Stark (2015) and Arguelles et al. (2015)
who measure integrated reporting using publicly available data from databases, Serafeim’s
(2015) proxy for integrated reporting is based on Asset 4 data. Asset 4 (as well as
Bloomberg’s ESG data) report ESG values for all firms, regardless of whether they actually
publish an integrated report. By contrast, our proxy of integrated reporting quality is based on
an independent, external review of actual integrated reports.
3.2. Hypotheses
We commence by examining whether integrated reporting has an impact on the firm’s
information environment and, therefore, affects its stock liquidity. The agency problem posits
that information asymmetry exists between managers with superior information and

10
information disadvantaged outsiders, such as investors. This could lead to adverse selection
which increases the price of shares, reduces liquidity and increases the cost of capital as
investors demand a premium to compensate for risk (e.g., Francis, Nanda, & Olsson, 2008;
Gietzmann & Ireland, 2005). Disclosure is a mechanism which managers could use to reduce
information asymmetry thereby decreasing investors’ out-of-pocket monitoring cost.
Integrated reporting has the potential to reduce information asymmetry about the
capitals which affect value. In addition to financial capital, the IIRC Framework requires that
managers of firms think about and report on material aspects relating to manufactured,
intellectual, human, social and relationship, and natural capital. Traditional financial
reporting focuses largely on the monetary values and returns of manufactured and financial
capital, while it provides incomplete reporting on intellectual capital (e.g., intangibles) and
human capital (e.g., employee benefits). Although some of the integrated reporting capitals
may be addressed by voluntary CSR reports, a criticism of these reports is that they are
disconnected from the firm’s strategy, business model, and financial performance (Serafeim,
2015). As such, providers of financial capital obtain an incomplete and disjointed picture of
the firm’s ability to create value (in its broader sense) over the short, medium, and long term.
By contrast, the IIRC Framework’s guiding principle of the connectivity of
information requires managers to report a holistic picture of the “combination,
interrelatedness and dependencies between the factors that affect the organization’s ability to
create value over time” (IIRC, 2013, 5). Hence, integrated reports have the potential to
provide information incremental to the existing corporate reports such as annual and CSR
reports which users of the integrated reports may find useful in their capital allocation
decisions. To the extent that integrated reports provide a more comprehensive set of
information about a firm, we expect a larger decrease in information asymmetry and,
specifically, a larger increase in liquidity for firms with higher quality integrated reports:

11
H1 There is a negative association between integrated report quality and a firm’s stock
liquidity.
The IIRC Framework states that integrated reporting aims to: (1) improve the quality
of information available to the providers of financial capital to improve the efficient and
productive allocation of capital, (2) promote a cohesive and efficient approach to corporate
reporting and communicate the full range of factors that materially affect the ability of a firm
to create value, (3) enhance accountability and stewardship for the six capitals and promote
understanding of their interdependencies, and (4) support integrated thinking, decision-
making and actions that focus on the creation of value over the short, medium and long term
(IIRC, 2013). Given the focus of integrated reporting on value creation, we next consider
whether better integrated reporting quality is associated with higher firm value.
In simple terms, firm value is affected by a firm’s expected future cash flows and the
riskiness associated with those cash flows (i.e., cost of capital). Future cash flows can be
directly affected by integrated reporting by out-of-pocket implementation costs associated
with preparing integrated reports, which can be substantial for small firms (ACCA, 2014) and
by real decisions made by the firm to the extent that such decisions are different from the
decisions that would be made in the absence of integrated reporting. Indeed, one of the
benefits of integrated reporting touted by the IIRC is that its use can lead to “integrated
thinking” and integrated decision-making – e.g., by breaking down silos and focusing on
long-term, instead of short-term, strategy – resulting in better real decisions and enhanced
firm value. Similarly, Eccles and Serafeim (2015) argue that while traditional financial
reports serve mainly an information function, integrated reports extends to a transformation
function affecting internal decision making. For example, 78 percent of the respondents in the
Black Sun (2014) survey agree that their firms have benefited from increased collaborative
thinking

12
At the same time, proponents of integrated reporting argue that these reports can
improve investors’ ability to estimate future cash flows by improving the quality, range, and
connectivity of data being produced (e.g., Black Sun, 2014). Company reports are also used
by shareholders to monitor managers (Lambert, 2001). As such, higher quality reports should
improve shareholders’ monitoring ability and reduce the amount of firm cash flow that
managers appropriate for themselves. Thus, integrated reports can provide a more holistic
understanding of firm value, but can also improve monitoring of managers’ decisions. In
addition, disclosure about the six capitals is informative to stakeholders such as customers
and employees who choose to associate with firms signaling their social legitimacy. This
could result in increased sales and financial performance (Plumlee et al., 2015).
Regarding cost of capital, the IIRC (2013) contends that integrated reporting can help
investors understand the risks that the firm is exposed to and how its strategy and business
model respond to those risks. Michael Bray (2011, 7) of KPMG Australia argues that early
adopters of integrated reporting “note positive comments from their investors and they expect
their cost of capital will more closely mirror their strategy”.
A firm’s cost of capital is the sum of the risk-free return and the risk premium. A
well-established literature suggests an association between disclosure and the cost of equity
capital. In order to link disclosure with cost of equity effects, it is necessary to show how
disclosure affects a firm’s non-diversifiable risk. Lambert et al. (2007) argue that accounting
information influences cost of capital directly through the market’s assessment of the
riskiness of future cash flows.
Direct effects include at least three channels through which disclosure could affect a
firm’s cost of equity capital. First, disclosure is a mechanism managers could use to reduce
information asymmetry. As we have argued under H1, integrated reporting improves and

13
expands the information available to capital market participants. This could reduce firm-level
information asymmetry.
Second, disclosure could improve investors’ awareness of non-financial aspects of the
firm, resulting in a larger investor base with increased risk sharing amongst investors
(Merton, 1987). Merton’s (1987) capital market equilibrium model allows for incomplete
information. In this setting, investors only purchase stock that they know about because
gathering and processing information about a firm is costly. By providing an inexpensive, but
complete, overview of a firm’s activities, integrated reports may help the firm expand its
investor base, leading to a lower cost of capital.
Third, investors do not know the true value of the expected return of a firm.
Disclosure reduces parameter uncertainty and estimation risk, parts of which are non-
diversifiable (Hail & Leuz, 2006). Integrated reporting has the potential to reduce parameter
uncertainty and estimation risk, because it intends to explain to providers of financial capital
how a firm creates value over time in a concise manner by creating a holistic picture of the
interrelatedness of the six capitals a firm depends on. The “strategic focus and future
orientation” guiding principle of integrated reporting and the content elements relating to the
“business model”, “risks and opportunities”, “strategy and resource allocation” and “outlook”
could be useful to investors in reducing parameter uncertainty and estimation risk.
Thus, the preceding discussion and an extensive literature on firm value (e.g., Morck,
Shleifer, & Vishny, 1988; Yermack, 1996; Bebchuk, Cremers, & Peyer, 2011; Li, Minnis,
Nagar, & Rajan, 2014) lead to the following three hypothesis:
H2 There is a positive association between integrated report quality and firm value.
H3 There is a positive association between integrated report quality and expected future
cash flows.

14
H4 There is a negative association between integrated report quality and cost of capital.
4. Research design
4.1. Data and sample
Integrated reporting became effective for firms listed on the JSE for annual periods
beginning on or after 1 March 2010. Our sample includes the top 100 firms on the JSE based
on market capitalization on 31 December 2011, 2012 and 2013 respectively. We start in
2011, because this is the first year in which the EY’s Excellence in Integrated Reporting
Awards, which we use to construct our integrated report quality proxy, were made. The top
100 firms represent approximately 90 percent of the market capitalization of the JSE.
Table 1 contains the detail of our sample. The sample for the bid-ask and Tobin’s Q
models consist of 224 firm-year observations representing 92 firms. The ‘Financial’ (26.34
percent) and ‘Materials’ (24.55 percent) sectors have the largest number of observations in
the sample. Due to additional data constraints of analyst forecasts, the sample for the cost of
capital and expected future cash flows tests consists of 163 firm-year observations
representing 67 firms. The industry composition in this sample is similar in distribution to the
bid-ask and Tobin’s Q sample.
4.2. Dependent variables
Our hypotheses require proxies for four constructs: stock liquidity, firm value,
expected future cash flows, and cost of capital. We discuss our proxies for each of these
constructs in this section.
Leuz and Verrecchia (2000, 99) note that “the bid-ask spread is commonly thought to
measure information asymmetry explicitly”. This is because investors are less concerned
about adverse selection when information asymmetry is small and, as a result, become more
willing to trade, resulting in lower bid-ask spreads (e.g., Cheng, Dhaliwal, & Neamtiu, 2011;
Leuz & Verrecchia, 2000; Muller, Riedl, & Sellhorn, 2011; Welker, 1995). Similar to
15
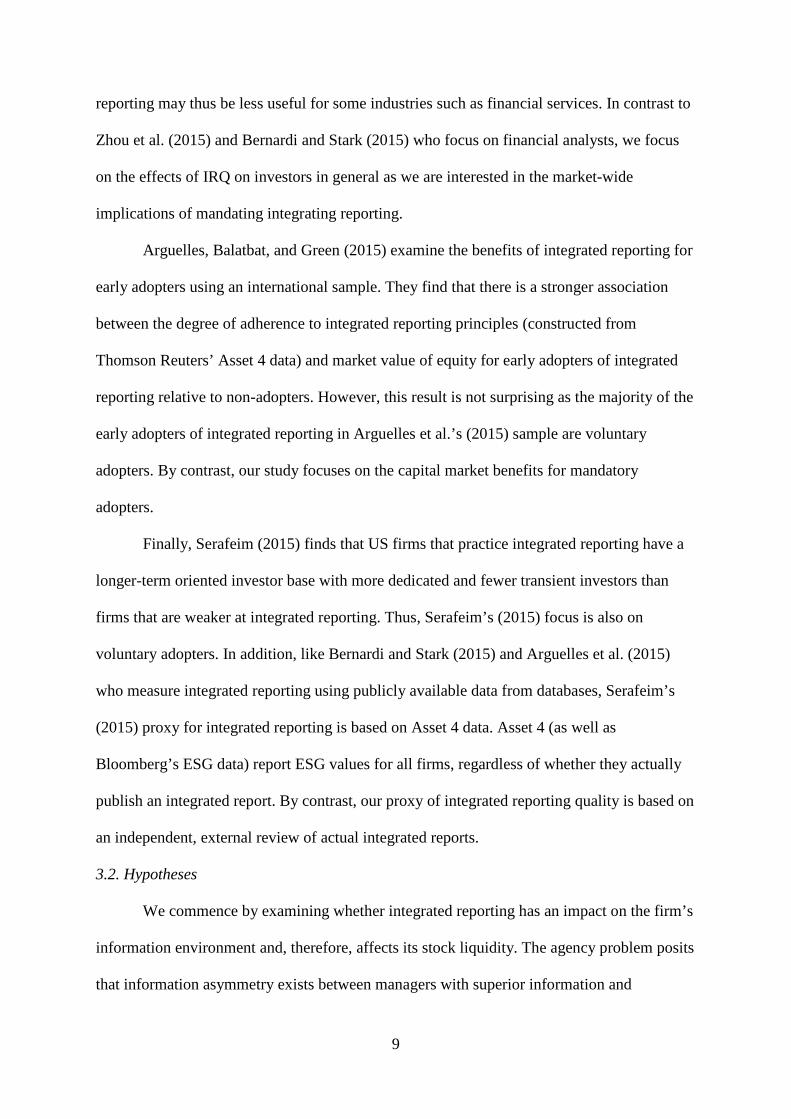
Bushee, Core, Guay, and Hamm (2010), we use the bid-ask spread as a proxy for information
asymmetry generally and stock liquidity specifically. We calculate the bid-ask spread as the
natural logarithm of the median of the daily difference between the bid and the ask prices
divided by the midpoint from month -9 to +3 relative to the end of the financial period
(Daske et al., 2008; Lang, Lins, & Maffett, 2012).
We follow an extensive literature that uses Tobin’s Q as a proxy for firm value.8
Tobin’s Q is designed to reflect the valuation placed on a firm’s assets by the market relative
to their book value (e.g., Lang & Maffett, 2011). This attribute makes Tobin’s Q a suitable
proxy for our setting, because many of the capitals of integrated reporting, such as
intellectual, human, environmental and social and relationship capital, are only partially, or
not at all, reflected in the book value of assets. Hence, we investigate whether integrated
report quality is associated with firm value beyond what is already contained in the financial
statements. We calculate Tobin’s Q as total assets minus book value of equity plus market
value of equity scaled by total assets (Daske et al., 2008; Lang, Lins, & Maffett, 2012). To
ensure that the information incorporated in the integrated reports are reflected in firm value,
we calculate the market value of equity three months after the end of the financial period.
Tobin’s Q inherently incorporates the cost of capital through the discounting of future cash
flows. Because Tobin’s Q captures both expected discount rates and expected future cash
flows, Daske et al. (2008) argue that Tobin’s Q is a more comprehensive measure of firm
value than cost of capital.
We use the next two dependent variables to separate firm value into the cash flow
component (i.e., the numerator effect) and the cost of capital component (i.e., the
denominator effect). Following Botosan and Plumlee (2002) and Plumlee et al. (2015), we
rely on one year-ahead target prices forecasted by financial analysts to construct proxies for 8 See for example, Adams and Santos (2006), Chen and Li (2013), Daske et al. (2008), Lang, Lins, and Maffett (2012), Lang, Lins, and Miller (2003), Lang and Maffett (2011), and Masulis, Wang, and Xie (2012). Lang, Lins, and Miller (2003) discuss the use of Tobin’s Q as a proxy of firm value in the academic literature in footnote 11 of their paper.

16
expected future cash flow (EFCF) and cost of capital (COC).9 IBES provides the target price
forecasts with a high and low value.
We employ the mean target price as the terminal value in combination with forecasts
of dividend pay-outs and current stock price to derive an implied cost of equity capital, which
is our cost of capital proxy. While there is no agreement in the literature about the appropriate
proxy for cost of capital (e.g., Dhaliwal, Li, Tsang, & Yang, 2014), Botosan, Plumlee, and
Wen (2011) evaluate the construct validity of cost of capital proxies based on their
association with realized returns and five known risk factors, and find that COC rates highly
in terms of construct validity based on these criteria. We discount the mean target price back
to the current period using the implied cost of equity capital (COC) to derive our measure
EFCF. 10 Consistent with the way we compute TobinQ and Bid_Ask, stock prices and analyst
forecasts are measured three months after the end of the financial period in the calculation of
COC.
4.3. Measure of integrated report quality
Our proxy for integrated report quality (IRQ) is constructed from the EY Excellence
in Integrated Reporting Awards. Since the 2011 fiscal year, EY evaluates the integrated
reports of the top 100 firms on the JSE against a list of criteria based on the IIRC Framework
(or a draft thereof prior to it being issued). We evaluated the score sheets used by the
adjudicators for consistency with the IIRC Framework and we believe that it is an appropriate
measure for integrated report quality.11 Graham (2014, 16), the chair of the adjudication
panel, states that the “marking process is not simply about ‘ticking the box’. More emphasis
is placed on the quality of information presented – the relevance, understandability,
9 IBES only provides six-month ahead or 12-month ahead target prices, which restricts us from having more than one year on the forecast horizon before the terminal period. 10 To avoid measurement error in our cost of capital proxy affecting EFCF, we also estimate our models using the undiscounted target price to measure EFCF, and the results remain qualitatively unchanged. 11 EY only publishes the considerations taken into account in scoring the reports at a high level (e.g., see page 26 of EY (2014)). EY does not want to make their detailed score sheet publicly available as they believe that this would encourage a “tick-the-box” mentality amongst firms without them engaging in the spirit of integrated reporting. As a result, we also do not include the detailed score sheets in our study.

17
accessibility and connectedness of that information, whether users of the integrated reports
would have a reasonable sense of the issues that are core to the operations of each of the
companies, and whether companies have dealt with the issues that users would have
expected.”
The integrated reports are evaluated by three adjudicators who have extensive
experience in reading and evaluating firms’ corporate reports. Two of the adjudicators have
been involved in the EY Excellence in Integrated Reporting Awards and the preceding EY
Excellence in Corporate Reporting Awards since its inception in 1997, while the other
adjudicator has been involved since 2005 (EY, 2014). Hence, the three adjudicators were the
same for all three years in our sample.12
EY do not announce the final scores of firms, but categorizes firms into five
buckets.13 We have proprietary access to the underlying scores of the three adjudicators
supporting these publicly announced buckets. Because the scores are subjective measures of
qualitative information, we calculate a firm’s score as the mean of the three adjudicators’
scores and annually rank these scores into deciles to mitigate concerns about measurement
error.14
4.4. Models
To examine the economic consequences of IRQ, our empirical strategy is to conduct
cross-sectional tests since there is wide variation in IRQ across firms. We do not utilize a
difference-in-differences design because the introduction of integrated reporting in South
12 We interviewed Graham on 21 August 2014 about the process the adjudicators follow in scoring the integrated reports. He confirmed that it takes between 30 minutes and four hours to evaluate a single report, depending on the extent to which a firm has implemented integrated reporting principles. He described that discrepancies between the scores of adjudicators are identified at a meeting between the adjudicators. Where the adjudicators are not able to resolve these discrepancies at the initial meeting, the reports of these firms are reevaluated by the adjudicators and discussed at a follow-up meeting. He also indicated that the adjudicators take care to distinguish between credible information and puffery. As Graham described during the interview: “For some firms, it is merely a public relations exercise through pictures, but we would never rate those well. It is hard for a firm to be excellent without clear key performance indicators. If a firm has a lot of green washing and narratives are too long, it is not going to be excellent.” 13 The buckets are “top 10”, “excellent”, “good”, “average”, and “progress to be made”. 14 Due to the developments within integrated reporting over the sample period, EY did not use exactly the same score sheet for the three periods in our sample. As a result, the raw scores are not directly comparable over time. To address this issue we do not include the raw scores in the regression, but the annual decile ranks instead.

18
Africa was a process rather than a point-in-time change. As a result, some firms prepared
integrated reports before they were mandated, but it is difficult to identify these firms, and
even if we could, we would not have an EY IRQ score for them. Consequently, to test the
hypotheses, we estimate the following model (firm-subscripts omitted):
Econit = β0 + β1IRQit + β2Govit + β3CSRPerfit + β4LowAQit + β5Complexit +
β6MFDiscit + ∑βjControlsit + ε
(1)
where Econ is the economic consequences we test being either the bid-ask spread (Bid_Ask),
Tobin’s Q (TobinQ), expected future cash flow (EFCF), or the implied cost of equity capital
(COC). Because Bid_Ask is increasing with illiquidity, if higher quality integrated reports are
associated with increased liquidity, we expect the coefficient of β1 to be negative and
significant in the bid-ask regression. If higher quality integrated reports are associated with
firm value and expected future cash flow, we expect the coefficient of β1 to be positive and
significant in the TobinQ and EFCF regressions. If higher quality integrated reports is
associated with lower cost of equity capital, we expect the coefficient of β1 to be negative and
significant in the cost of capital regression.
Based on the prior literature, we include control variables in our models as other
factors may be correlated with IRQ or could be associated with the economic consequences
we test (Hail & Leuz, 2006; Dhaliwal, Li, Tsang, & Yang, 2011; Dhaliwal, Radhakrishnan,
Tsang, & Yang, 2012; Dhaliwal et al., 2014).
We control for corporate governance (Gov), because Chen, Chen, and Wei (2009) find
that corporate governance is negatively associated with cost of capital (which influences firm
value through the denominator effect). Gov is the average of the board function, board
structure, compensation policy, and shareholder rights scores from Asset 4.15
15 Asset 4 is a division of Thomson Reuters which collects environmental, social and corporate governance data for over 6,000 firms globally. The over 750 individual data items are grouped into 18 categories within four pillars. The four pillars are economic, environmental, social and corporate governance performance.

19
Dhaliwal et al. (2011) and El Ghoul, Guedhami, Kwok, and Mishra (2011) show the
importance of controlling for the effect of CSR performance in tests of the association
between CSR disclosure and cost of equity capital. Similarly, Cho, Lee and Pfeiffer (2013)
find that CSR performance is negatively associated with the bid-ask spread. We include the
average of the environmental and social scores from Asset 4 to control for CSR performance
(CSRPerf) in our models.
We control for accounting quality because Francis et al. (2008) show that earnings
quality is negatively associated with cost of capital (which also affects firm value through a
denominator effect), while Lang et al. (2012) show that liquidity is higher for firms with less
incidence of earnings management. Ideally, we would like to include discretionary accruals
as a proxy for accounting quality in our models. Due to data requirements for property, plant
and equipment and inventory, discretionary accrual models are not suited to financial firms,
which constitute 26 percent of our sample. To overcome this problem, we follow Bowen,
Rajgopal and Venkatachalam (2008) by including the frequency of small positive earnings
surprises in our model. LowAQ represents the annual decile rank of the frequency of small
earnings surprises over the previous five years.
We control for firm complexity (Complex), because complex firms may find it harder
to implement the concepts of integrated reporting. For example, the extent to which firms
comply with the IIRC Framework’s guiding principles of conciseness and connectivity of
information may not be comparable across firms with multiple subsidiaries or divisions and
firms with a simple structure and operations. To control for this effect, our proxy for
complexity is the average annual decile rank of earnings volatility, stock return volatility and
the number of subsidiaries a firm has (De Franco, Hope, Vyas, & Zhou, 2015).
MFDisc measures the frequency and precision of management forecasts in the current
and preceding two years as a proxy for firms’ overall disclosure quality (Baginski & Rakow,

20
2012; Plumlee et al., 2015). We obtain management forecasts from the Capital IQ Key
Developments database.16 MFDisc is the product of the “supplier”, “frequency”, and
“precision” items from that database. “Supplier” equals one if a firm issued at least one
management forecast during the current or preceding two financial periods, and zero
otherwise. “Frequency” is the number of management forecasts issued by a firm during the
current and preceding two financial periods. “Precision” is the average of the precision of
management forecasts issued by a firm during the current and preceding two financial
periods. Forecast precision equals “one” for general impression forecasts, “two” for
minimum and maximum forecasts, “three” for range forecasts, and “four” for point forecasts.
We control for additional factors in our models (Controls). Variable definitions are
contained in the Appendix. The bid-ask model includes the incidence of losses and the book-
to-market ratio as control variables (Lang et al., 2012). We control for asset growth, the
incidence of dividends, leverage, and profitability in the Tobin’s Q model (Daske et al., 2008;
Lang et al., 2012; Lang et al., 2003). The expected future cash flow model includes control
variables for revenue growth and accruals (Doyle, Lundholm, & Soliman, 2003; Barth,Cram,
& Nelson, 2009). The cost of capital model includes control variables for beta, analyst
forecast dispersion, analyst forecast bias, and leverage (Dhaliwal et al., 2014). All of the
models include size as an additional control variable. The models include year and industry
fixed effects. Standard errors are clustered by firm and by year based on bootstrapping of
10,000 iterations.17
16 The Capital IQ Key Developments database covers 164 key developments. The following key developments contain management forecasts: “corporate guidance – lowered” (nr. 26), “corporate guidance – raised” (nr. 27) and “corporate guidance – new/confirmed” (nr. 29). We do not limit the forecasts to earnings only, because other forecasts such as production and capital expenditure are important disclosures for mining firms which is a large part of our sample. For the 2011, 2012 and 2013 years all the firms included in our sample are covered by Capital IQ Key Developments. 17 Gow, Ormazabal, and Taylor (2010) warn against using asymptotic methods, such as OLS with normal two-way clustered standard errors, in small sample settings. We implement their advice of using bootstrapping methods with two-way clustering of standard errors given the small number of clusters in our time dimension.

21
To provide a stronger link between IRQ and the dependent variables and to reduce the
likelihood of correlated omitted variables, we also run the models in their change form by
taking the first differences of all variables.18
5. Results
5.1. Descriptive statistics
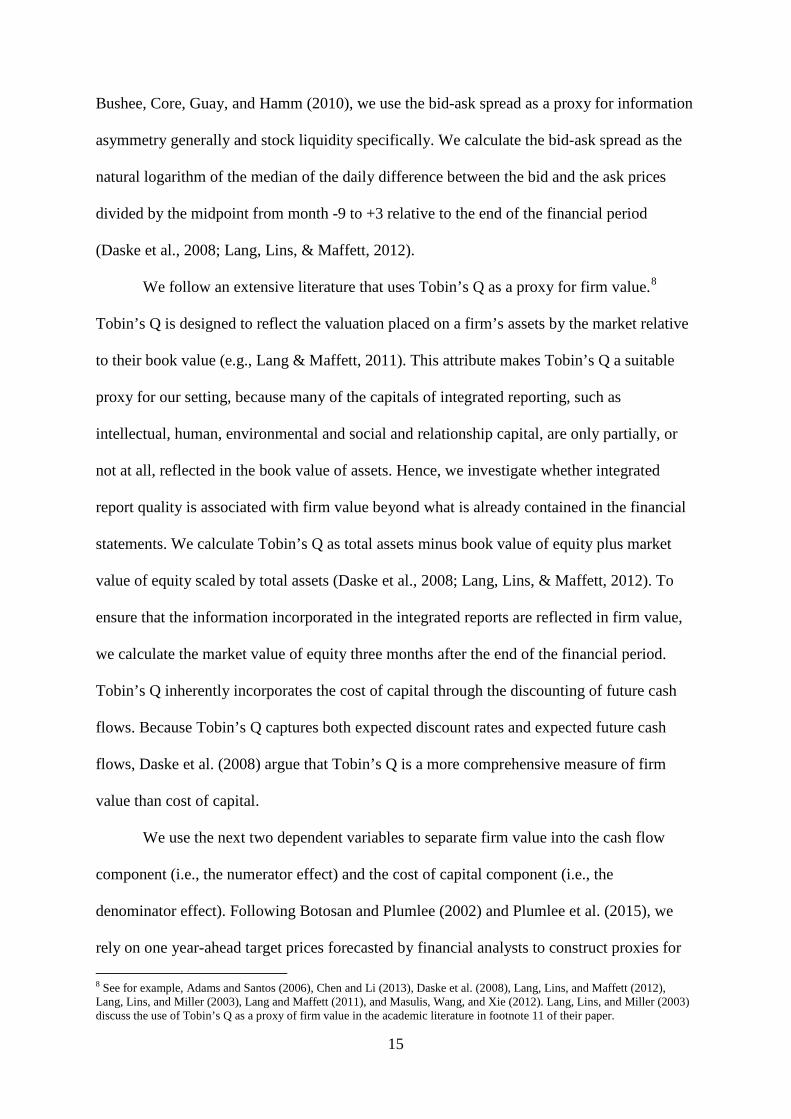
Table 2 provides descriptive statistics for the sample. Panel A contains the distribution
of the raw EY scores for each year included in our sample, and shows that our sample is
similar to the full sample of firms rated by EY in terms of central tendency, variability, and
extreme values. Panel B contains descriptive statistics for the variables used in the analysis.
The mean (median) natural logarithm of the bid-ask spread is -5.97 (-6.00), while the mean
(median) Tobin’s Q is 1.81 (1.42), and the mean (median) expected future cash flow in its
natural logarithm form is 4.23 (4.24). The mean (median) of the COC is 0.17 (0.14), which is
higher than the cost of capital in more developed countries such as the US and UK, and is
comparable with the estimate for South African firms of 0.16 reported in Hail and Leuz
(2006). The Gov and CSRPerf variables are expressed as a percentage. The mean (median)
governance percentage is 54.19 (55.25), while the mean (median) CSR performance is 66.49
(75.25). Of the total sample, 80 percent declared or paid dividends, while 8 percent had
losses.
Table 3 sets out the correlations for the independent variables included in the bid-ask
and Tobin’s Q regressions (our largest sample). IRQ is positively correlated with Gov,
CSRPerf, Complex, MFDisc, and Size. Larger firms are better governed and have better CSR
performance than smaller firms, as evidenced by the Pearson correlations of 0.28 and 0.46,
18 In the changes models we account for changes in Loss and Div through indicator variables. For Loss we create three indicator variables: (1) firms that moved from a loss to a profit, (2) firms that remained in a loss position, and (3) firms that moved from a profit to a loss. Hence, firms that remained profitable are captured in the intercept. For Div we create three indicator variables: (1) firms that remained non-dividend paying, (2) firms that paid a dividend in the prior period but not in the current period, and (3) firms that did not pay a dividend in the prior period but paid in the current period. Hence, firms that remained dividend paying are captured in the intercept.

22
respectively. Table 4 shows the year-to-year movement between IRQ deciles for our changes
models. There is considerable change in the IRQ decile rankings for firms during our sample
period. Specifically, for the Tobin’s Q and bid-ask regressions, there is at least a one decile
change in IRQ for 69 percent of the observations. Further, 34.9 percent of the sample
experienced at least a two decile shift in IRQ, indicating that the (relative) quality of a firm’s
integrated report can increase or decrease substantially from year to year. A similar pattern
exists for the expected future cash flows and cost of capital samples (not tabulated). This
analysis helps alleviate concerns that our IRQ measure is sticky over time.
5.2. Main results
We first evaluate whether integrated report quality is associated with a firm’s
information environment. Table 5 contains the results of the bid-ask regression in its levels
and changes form. In the levels regression, consistent with H1, the coefficient of IRQ is
negative and significant (coefficient = -0.028, t-stat. = -2.170), i.e., firms with better
integrated reporting quality have a smaller bid-ask spread and higher liquidity. In economic
terms, the results of the levels regression suggest that an interquartile shift in IRQ is
associated with a 2.29 percent reduction in the bid-ask spread.19 Of the control variables, Size
and CSRPerf are negatively and significantly associated with the bid-ask spread, while
Complex has a positive and significant coefficient. Thus, large firms and firms with superior
CSR performance have smaller bid-ask spreads, while more complex firms have larger
spreads. The levels regression has an adjusted R2 of 68.4 percent.
We find similar results for the changes regression. ΔIRQ has a significant and
negative coefficient (coefficient = -0.023, t-statistic = -3.249). Among the control variables,
ΔBTM and ΔLowAQ have positive and significant coefficients, indicating that increases in the
book-to-market ratio and worsening accounting quality are associated with increases in the 19 The economic significance for the bid-ask spread is calculated as follows: From Table 2, panel B, Bid_Ask has a median value of -6.00 and the interquartile shift in IRQ is 5.00 (7.00 – 2.00). The coefficient of IRQ in the bid-ask levels regression in Table 5 is -0.028. Hence, the economic significance is calculated as (-0.028 x 5.00)) / -6.00.

23
bid-ask spread and decreasing liquidity. On the other hand, firms that increase the frequency
and/or precision of their management forecasts see decreases in the bid-ask spread as
ΔMFDisc has a negative and significant coefficient. The changes model has an adjusted R2 of
18 percent, which is not surprising as changes are generally harder to explain than levels.
Overall, the results in Table 5 suggest that integrated report quality is positively associated
with firms’ liquidity, as evidenced by lower bid-ask spreads.
Table 6 contains the results of the levels and changes regressions where firm value
(TobinQ) is the dependent variable. In the levels regression, the coefficient for our variable of
interest, IRQ, is positive and significant (coefficient = 0.036, t-statistic = 2.256). This is
consistent with H2. In other words, integrated report quality is positively associated with firm
value incremental to governance, CSR performance, accounting quality, overall disclosure
quality, and the other control variables in our model. In terms of economic significance,
results of the levels regression suggest that an interquartile shift in IRQ is associated with a
12.6 percent increase in Tobin’s Q.20 The control variable, IB, also has a positive and
significant coefficient, which suggests that profitable firms have higher firm values than less
profitable firms. Div has a negative and significant coefficient, and the overall model explains
70.2 percent of the variation in Tobin’s Q. The changes specification also provides support
for H2. The relation between ΔIRQ and ΔTobinQ is positive and significant (coefficient =
0.011, t-statistic = 2.316).21
To better understand how integrated reporting quality relates to firm value, we
decompose firm value into its cash flow (numerator) and discount rate (denominator) 20 The economic significance for Tobin’s Q is calculated as follows: From Table 2 Panel B, TobinQ has a median value of 1.42, while the interquartile shift in IRQ is 5.00 (7.00 – 2.00). The coefficient of IRQ in the Tobin’s Q levels regression in Table 6 is 0.036. Hence, the economic significance is calculated as (0.036 x 5.00) / 1.42. 21 As an additional test to our Tobin’s Q results, we employ a modified Ohlson (1995) valuation model in levels (price) and changes (returns) (see Barth and Clinch, 2009). The levels-model regress share price three months after the end of the financial period on IRQ, book value of equity per share, income before extra-ordinary items per share, and other control variables. The returns model regress the percentage change in the Datastream Total Return Index for the period -9 to +3 relative to the financial year-end on ΔIRQ, earnings before extraordinary items (IB) scaled by lagged market value of equity, the change in earnings before extraordinary items scaled by lagged market value of equity, and other control variables. While the coefficient of IRQ is insignificant in the levels model, the coefficient of ΔIRQ (not tabulated) is positive and statistically significant in the returns model (coefficient = 0.0195; t-statistic = 2.304).

24
components. Table 7 presents the results of the analysis of the relation between integrated
reporting quality and expected future cash flows. In the levels regression, consistent with H2,
the association between IRQ and expected future cash flows is positive and marginally
significant (coefficient = 0.047, t-statistic = 1.583).22 Further, the economic effect is non-
trivial as an interquartile shift in IRQ is associated with a 5.5 percent increase in expected
future cash flows.23 Consistent with the levels regression, there is a positive and significant
relation between ΔIRQ and ΔEFCF (coefficient = 0.004, t-statistic = 2.868). Thus, the results
in Table 7 suggest that better integrated reporting can affect firm value through the numerator
or cash flow effect, which supports H3.
Table 8 provides the results of the levels and changes regressions examining the
relation between integrated reporting quality and cost of capital. In the levels regression, we
find that IRQ has a negative and significant coefficient in the levels test (coefficient = -0.013,
t-statistic = -1.672). Further, the coefficient for ΔIRQ in the changes test is not statistically
significant (coefficient = -0.003, t-statistic = -0.171).
Given the inconsistent cost of capital evidence across the levels and changes models,
we use alternative cost of capital proxies based on Claus and Thomas (2001), Gebhardt, Lee,
and Swaminathan (2001), Easton (2004), Ohlson and Jeuttner-Nauroth (2005), Hail and Leuz
(2006), and Mohanram and Gode (2013). For levels tests (not tabulated), we only find a
significant coefficient when the Easton’s (2004) PEG measure is used (coefficient = -0.004, t-
statistic = -1.647). For changes tests (not tabulated), we only find significant results based on
the Claus and Thomas’ (2001) and Ohlson and Jeuttner-Nauroth’s (2005) measures
(coefficient = -0.0008 and -0.0036, t-statistic = -2.3751 and -2.737, respectively). As none of
22 As an alternative, we replace discounted target price as the dependent variable with one-year ahead ex-post net cash flows from operating activities (Datastream item: WC04860) deflated by total assets (Datastream item: WC02999). We find statistically stronger results – IRQ is positively associated with one-year ahead ex-post operating cash flows (coefficient = 0.007, t-statistic = 1.831). 23 The economic significance for EFCF is calculated as follows: From Table 2 Panel B, EFCF has a median value of 4.24, while the interquartile shift in IRQ is 5.00 (7.00 – 2.00). The coefficient of IRQ in the EFCF levels regression in Table 7 is 0.047. Hence, the economic significance is calculated as (0.047 x 5.00) / 4.24.

25
these measures produce consistently significant results for both levels and changes, at best,
our results provide only weak support for the cost of capital channel. This suggests that
integrated reporting mainly increases firm value by increasing future cash flows, a view that
is consistent with integrated reporting providing managers with better information to
facilitate improved decision making.
Overall, we find that there are positive economic consequences associated with
integrated report quality. We find that integrated report quality is positively associated with
stock liquidity, consistent with integrated reporting improving a firm’s information
environment. Our evidence also suggests that integrated report quality is positively related to
firm value, and that this relation is driven by the effect of integrated reporting quality on
expected future cash flows and less by its effect on cost of capital.
5.3. Additional analyses
The evidence suggests that integrated reporting quality affects firm value through
future cash flows, which is consistent with integrated reporting improving internal decision
making by managers, a view that is supported by anecdotal and survey evidence (Black Sun,
2014; SAICA, 2015). In this section, we explore the specific channel(s) through which
integrated reporting improves cash flows.
Because managers’ decisions are not directly observable, following Patatoukas
(2012), we rely on a DuPont analysis and investigate the intertemporal association between
changes in integrated report quality and future changes in firm performance.24 Standard
DuPont analysis decomposes return on equity (ROE) into three multiplicative ratios, i.e.:
ROE = PM × ATO × LEV (2)
where ATO is the asset turnover ratio, PM is the profit margin, and LEV is financial leverage
(e.g., Soliman, 2008). In Eq. (2), the product of PM and ATO is the return on assets (ROA).
24 Patatoukas (2012) investigates the intertemporal association between changes in customer-base concentration and subsequent changes in supplier firm performance.

26
The Appendix provides detailed definitions of these variables. We examine whether ΔIRQ is
a leading indicator of one-year-ahead changes in asset turnover, profit margin, and
accounting rates of return. Thus, consistent with Soliman (2008) and Patatoukas (2012), we
estimate the following model:
ΔPerfit+1 = β0 + β1IRQt + β2PMt + β3ATOt + β4ΔPMt + β5ΔATOt + β6AT_Grt + ε (3)
where ΔPerft+1 (performance) is the one-year-ahead changes in either ATO, PM, ROA, or
ROE. We control for contemporaneous levels and changes in profit margins and asset
turnover as well as asset growth, because these have predictive power for future changes in
firm performance (e.g., Fairfield & Yohn, 2001; Soliman, 2008).
Because the DuPont analysis is not meaningful for financial firms, we exclude firms
with a GICS sector code of 40 from our analysis (Soliman, 2008; Patatoukas, 2012). This
reduces our sample to 98 observations. To mitigate the small sample size issue, we employ
the bootstrapping method using 10,000 iterations as in previous analyses.
Table 9 contains the results of our analysis of intertemporal changes. Consistent with
the notion that integrated reporting assists in improved internal decision making by managers,
changes in IRQ positively predicts one-year ahead changes in ROE (coefficient = 0.008,
t-statistic = 3.775) and ROA (coefficient = 0.003, t-statistic = 2.597). When we decompose,
ROA into ATO and PM, we find a positive and statistically significant association between
the current change in integrated report quality and the year-ahead change in asset turnover
(coefficient = 0.008, t-statistic = 2.617). Since ATO measures a firms’ efficiency in utilizing
their assets to generate revenue and is frequently considered as a measure of asset utilization
by managers, our evidence suggests that improvements in integrated report quality are
followed by efficiency gains in the form of enhanced asset utilization.
In contrast, we do not find a significant association between changes in IRQ and the
year-ahead changes in profit margin. However, this is not surprising as Soliman (2008)

27
contends that competitive forces affect asset turnover and profit margin differently. Because
high profit margins attract new entrants or imitation by rivals, any effect of integrated report
on the profit margin is likely to be transitory. On the other hand, Soliman (2008) argues it is
more difficult to imitate a firm’s efficiency in using its assets as doing so often requires
overhauls to operations, such as factories, and these overhauls can be costly.
Thus, our DuPont analysis suggests that integrated reporting can affect future cash
flows through efficiency gains in asset utilization.
6. Conclusion
Integrated reporting is a new reporting framework that extends beyond traditional
corporate reporting by focusing long-term value creation in terms of financial,
manufacturing, human, intellectual, social and relationship, and natural capital. It has its own
supporting body, the IIRC, and the IIRC has designated 2014-2017 as the “breakthrough
phase” as it aims to achieve wider acceptance for integrated reporting. However, despite the
anecdotal support integrated reporting has received at the firm, national, and international
levels, empirical evidence on the economic consequences of integrated reporting is scarce.
In this study, we examine whether integrated report quality is associated with stock
liquidity and firm value and its components, namely expected future cash flows and cost of
capital. We conduct our analyses using South African data because South Africa currently is
the only country that mandates integrated reporting. Specifically, integrated reporting has
been mandatory (on an apply-or-explain basis) for firms listed on the JSE since March 2010.
We find a positive association between integrated reporting quality and both stock
liquidity and firm value. Further, we decompose firm value into two components – expected
future cash flows (numerator effect) and cost of capital (denominator effect). We find that
integrated report quality is positively associated with expected future cash flows, while the
evidence on the association between integrated reporting quality and the cost of capital is

28
weak and inconsistent at best. Thus, on balance, our evidence suggests that integrated
reporting affects firm value mainly by increasing expected future cash flows, consistent with
investors revising their estimates of future cash flows upward because they have a better
understanding of the firm’s capitals and business strategy or with integrated reporting leading
to better decisions being made by managers as a result of “integrated thinking”. We probe the
latter possibility using a DuPont analysis. Consistent with improved internal decision making,
we find that find that changes in IRQ are positively associated with one year-ahead changes
in asset turnover, return on assets, and return on equity.
As all studies have limitations, a few caveats are in order. One limitations of our study
is the small sample size which arises because we rely on the EY IRQ ratings which are only
available for the 100 largest South African firms each period. While some researchers
examining integrated reporting use data from Thomson Reuters’ Asset 4 or Bloomberg’s
ESG file, this comes at the expense of using an indirect and relatively crude proxy for
integrated report quality. Instead, we use proprietary data from EY that reflect the assessment
of three external independent reviewers who rate each integrated report on multiple
dimensions. However, despite the small sample size, we find strong and consistent results in
our liquidity, firm value, and expected future cash flow tests using both level and change
specifications.
Another concern is that our findings are based on a single country and may not be
generalizable to other jurisdictions. While this criticism can be directed at any within-country
study, we note that South Africa has a common law tradition, strong outside investor rights,
and high accounting quality. For example, Leuz, Nanda, and Wysocki (2003) find that out of
31 countries, South Africa has the fifth most transparent earnings (i.e., least earnings
management), following the US, Australia, Ireland, and Canada. More recently, South Africa
was ranked first in terms of strength of auditing and reporting standards, second in terms of

29
protection of minority shareholders’ interests, and third in terms of the efficacy of corporate
boards out of 144 countries in the 2014-2015 World Economic Forum Global
Competitiveness Report (WEF, 2015).
Our findings should be of interest to firms, investors, regulators, and the IIRC as it
suggests that the integrated reporting model is associated with positive economic benefits,
even when it is mandated. Our results suggest that these benefits arise not only from a more
holistic and comprehensive presentation of information but, perhaps more importantly, from
changes in the decision-making processes within firms.

30
REFERENCES
Adams, R.B., & Santos, J.A.C. (2006). Identifying the effect of managerial control on firm performance. Journal of Accounting and Economics, 41, 55 – 85.
Arguelles, M.P.M., Balatbat, M., & Green, W. (2015). Is there an early-mover market value effect for signaling adoption of integrated reporting? Working paper, University of New South Wales.
Armstrong, C.S., Barth, M.E., Jagolinzer, A.D., & Riedl, E.J. (2010). Market reaction to the adoption of IFRS in Europe. The Accounting Review, 85, 31-61.
Association of Chartered Certified Accountants (ACCA). (2014). Understanding investors: The changing corporate perspective. ACCA, February.
Baginski, S.P., & Rakow, K.C. (2012). Management earnings forecast disclosure policy and the cost of equity capital. Review of Accounting Studies, 17, 279-321.
Barth, M.E., Cram, D.P., & Nelson, K.K. (2009). Accruals and the prediction of future cash flows. The Accounting Review, 76, 27-58.
Barth, M.E., & Clinch, G. (2009). Scale effects in capital markets-based accounting research. Journal of Business Finance and Accounting, 36, 253-288.
Barth, M.E., Landsman, W.R, & Lang, M.H. (2008). International Accounting Standards and accounting quality. Journal of Accounting Research, 46, 467-498.
Bebchuk, L.A., Cremers, K.J.M, & Peyer, U.C. (2011). Journal of Financial Economics, 102, 199-221.
Bernardi, C., & Stark, A.W. (2015). The transparency of environmental, social and governance disclosures, integrated reporting, and the accuracy of analyst forecasts. Working paper: Roma Tre University and University of Manchester.
BM&FBOVESPA. (2014). “Report or explain now encourages integrated reporting among listed companies”. 11 April, Available online at: http://www.bmfbovespa.com.br/en-us/News/2014/Report-or-Explain-now-encourages-integrated-reporting-among-listed-companies-2014-04-11.aspx?tipoNoticia=1&idioma=en-us
Black Sun. (2014). Realizing the benefits: The impact of integrated reporting. Black Sun Plc.
Botosan, C.A., & Plumlee, M.A. (2002). A re-examination of disclosure level and the expected cost of equity capital. Journal of Accounting Research, 40, 21-40.
Botosan, C. A., Plumlee, M. A., & Wen, H. (2011). The relation between expected returns, realized returns, and firm risk characteristics. Contemporary Accounting Research, 28, 1085-1122.
Bowen, R.M., Rajgopal, S., & Venkatachalam, M. (2008). Accounting discretion, corporate governance and firm performance. Contemporary Accounting Research, 25, 351-405.
Bray, M. (2011). The business case. Integrated Reporting, Issue 1, KPMG International: London.
Bryan, S. (1997). Incremental information content of required disclosures contained in management discussion and analysis. The Accounting Review, 72, 285-301.

31
Bushee, B.J., Core, J.E., Guay, W., & Hamm, S.J.W. (2010). The role of the business press as an information intermediary. Journal of Accounting Research, 48, 1-19.
Business 20 (B20). (2014). Unlocking investment in infrastructure: Is current accounting and reporting a barrier? June, available at: http://www.kpmg.com/Global/en/IssuesAndInsights/ArticlesPublications/Press-releases/Documents/unlocking-investment-in-infrastructure.pdf.
Business Standard Reporters. (2014). Sebi wants yearly tell-all accounts. 17 September, available at: http://www.business-standard.com/article/markets/sebi-wants-yearly-tell-all-accounts-114091701199_1.html.
Chen, K.C.W., Chen, Z., & Wei, K.C.J. (2009). Legal protection of investors, corporate governance, and the cost of equity capital. Journal of Corporate Finance, 15, 273-289.
Chen, F., & Li, Y. 2013. Voluntary adoption of more stringent governance policy on audit committees: Theory and empirical evidence. The Accounting Review, 88, 1939-1969.
Cheng, M., Dhaliwal, D.S., & Neamtiu, M. (2011). Asset securitization, securitization recourse, and information uncertainty. The Accounting Review, 86, 541-568.
Cho, S.Y., Lee, C., & Pfeiffer, R.J. (2013). Corporate social responsibility performance and information asymmetry. Journal of Accounting and Public Policy, 32, 71-83.
Clarkson, P. M., Kao, J. L., & Richardson, G. D. (1999). Evidence that management discussion and analysis (MD&A) is a part of a firm's overall disclosure package. Contemporary Accounting Research, 16, 111-134.
Claus, J., & Thomas, J. (2001). Equity premia as low as three percent? Evidence from analysts’ earnings forecasts for domestic and international stock markets. The Journal of Finance, 56, 1629-1666.
Daske, H., Hail, L., & Verdi, R. (2008). Mandatory IFRS reporting around the world: Early evidence on the economic consequences. Journal of Accounting Research, 46, 1085-1142.
De Franco, G., Hope, O., Vyas, D., & Zhou, Y. (2015). Analyst report readability. Contemporary Accounting Research, 32, 76-104.
De Villiers, C., Rinaldi, L., & Unerman, J. (2015). Integrated reporting: Insights, gaps and an agenda for future research, Accounting, Auditing & Accountability Journal, 27, 1042-1067.
Dhaliwal, D.S., Li, O.Z., Tsang, A., & Yang, Y.G. (2011). Voluntary nonfinancial disclosure and the cost of equity capital: The initiation of Corporate Social Responsibility Reporting. The Accounting Review, 86, 59-100.
Dhaliwal, D.S., Radhakrishnan, S., Tsang, A., & Yang, Y.G. (2012). Nonfinancial disclosure and analyst forecast accuracy: International evidence on corporate social responsibility disclosure. The Accounting Review, 87, 723-759.
Dhaliwal, D.S., Li, O.Z., Tsang, A., Yang, Y.G. (2014). Corporate social responsibility disclosure and the cost of equity capital: The roles of stakeholder orientation and financial transparency. Journal of Accounting and Public Policy, 33, 328-355.

32
Doyle, J.T., Lundholm, R.J., & Soliman, M.T. (2003). The predictive value of expenses excluded from Forma earnings. Review of Accounting Studies, 8, 145-174.
Easton, P. (2004). PE Ratios, PEG ratios, and estimating the implied expected rate of return on equity capital. The Accounting Review, 79, 73-95.
Eccles, R.G., & Serafeim, G. (2015). Corporate and integrated reporting: A functional perspective. In S. Mohrman, J. O’Toole, & E. Lawler (Eds.), Corporate stewardship: Organizing for sustainable effectiveness. Sheffield, UK: Greenleaf Publishing.
El Ghoul, S., Guedhami, O., Kwok, C.C.Y., & Mishra, D.R. (2011). Does corporate social responsibility affect the cost of capital? Journal of Banking and Finance, 35, 2388-2406.
European Commission. (2014). Disclosure of non-financial and diversity information by large companies and groups – Frequently asked questions. Memo/14/301. Available at: http://europa.eu/rapid/press-release_MEMO-14-301_en.htm.
EY. (2014). Excellence in integrated reporting awards 2014: A survey of integrated reports from South Africa’s top 100 JSE-listed companies and top 10 state-owned companies. EY: Johannesburg.
Francis, J., Nanda, D., & Olsson, P. (2008). Voluntary disclosure, earnings quality, and cost of capital. Journal of Accounting Research, 46, 53-99.
Gebhardt, W., Lee, C., & Swaminathan, B. (2001). Toward an implied cost of capital. Journal of Accounting Research, 39, 135-176.
Gietzmann, M., & Ireland, J. (2008). Cost of capital, strategic disclosures and accounting choice. Journal of Business Finance & Accounting, 32, 599-634.
Gore, A., & Blood, D. (2011). A manifesto for sustainable capitalism: How business can embrace environmental, social and government metrics. The Wall Street Journal, December, 14. Available at: http://www.wsj.com/articles/SB10001424052970203430404577092682864215896.
Gow, I.D., Ormazabal, G., & Taylor, D.J. (2010). Correcting for cross-sectional and time-series dependence in accounting research. The Accounting Review, 85, 483-512.
Graham, M. (2014). EY’s excellence in integrated reporting awards 2013. EY: Johannesburg.
Hail, L., & Leuz, C. (2006). International differences in the cost of equity capital: Do legal institutions and securities regulation matter? Journal of Accounting Research, 44, 485-531.
Huang, X., & Watson, L. (2015). Corporate social responsibility research in accounting. Journal of Accounting Literature, 34, 1-16.
International Integrated Reporting Council (IIRC). (2013). The International Integrated Reporting Framework.
International Integrated Reporting Council (IIRC). (2014). Creating Value: Value to the Board.
Kee, H.Y., Larsen, M., & Seng, T.B. (2014). Should S’pore firms adopt Integrated Reporting? The Business Times, 13 March: 22.

33
King, M. (2013). Foreword to the PWC publication. The value creation journey: A survey of JSE Top-40 companies’ integrated reports, PWC: Johannesburg.
Kitney, D. (2014). Super funds enthusiastic about reporting regime. The Australian, 15 July.
KPMG. (2013). The KPMG survey of corporate responsibility reporting 2013. KPMG International Cooperation.
Lambert, R. (2001). Contracting theory and accounting. Journal of Accounting and Economics, 32, 3-87.
Lambert, R., Leuz, C., & Verrecchia, R.E. (2007). Accounting information, disclosure, and the cost of capital. Journal of Accounting Research, 45(2), 385-420.
Lang, M., Lins, K.V., & Maffett, M. (2012). Transparency, liquidity, and valuation: International evidence on when transparency matters most. Journal of Accounting Research, 50, 729-774.
Lang, M., Lins, K.V., & Miller, D.P. (2003). ADRs, analysts, and accuracy: Does cross listing in the United States improve a firm’s information environment and increase market value? Journal of Accounting Research, 41, 317-345.
Lang, M., & Maffett, M. (2011). Transparency and liquidity uncertainty in crisis periods. Journal of Accounting and Economics, 52, 101-125.
Leuz, C., Nanda, D., & Wysocki, P. D. (2003). Earnings management and investor protection: an international comparison. Journal of Financial Economics, 69, 505-527.
Leuz, C., & Verrecchia, R.E. (2000). The economic consequences of increased disclosure. Journal of Accounting Research, 38, 91-124.
Li, F., Minnis, M., Nagar, V., & Rajan, M. (2014). Journal of Accounting and Economics, 58, 96-116.
Li, S. (2010). Does mandatory adoption of International Financial Reporting Standards in the European Union reduce the cost of equity capital? The Accounting Review, 85, 607-636.
Masulis, R.W., Wang, C., & Xie, F. (2012). Globalizing the boardroom – The effects of foreign directors on corporate governance and firm performance. Journal of Accounting and Economics, 53, 527-554.
Merton, R.C. (1987). A simple model of capital equilibrium with incomplete information. The Journal of Finance, 42, 483-510.
Mohanram P., & Gode, D. (2013). Removing predictable analyst forecast errors to improve implied cost of equity estimates. Review of Accounting Studies, 18, 443-478.
Morck, R., Shleifer, A., & Vishny, R. (1988). Management ownership and market valuation: An empirical analysis. Journal of Financial Economics, 20, 293-315.
Muller, K.A., Riedl, E.J., & Sellhorn, T. (2011). Mandatory fair value accounting and information asymmetry: Evidence from the European real estate industry. Management Science, 57, 1138-1153.
Ohlson, J. (1995). Earnings, book values and dividends in security valuation. Contemporary Accounting Research, 11, 661-687.

34
Ohlson, J., & Juettner-Nauroth, B. (2005). Expected EPS and EPS growth as determinants of value. Review of Accounting Studies, 10, 349–65.
Patatoukas, P.N. (2012). Customer-base concentration: Implications for firm performance and capital markets. The Accounting Review, 87, 363-392.
Plumlee, M., Brown, D., Hayes, R.M., & Marshall, R.S. (2015). Voluntary environmental disclosure quality and firm value: Further evidence. Journal of Accounting and Public Policy, 34(4), 336 – 361.
Serafeim, G. (2015). Integrated reporting and investor clientele. Journal of Applied Corporate Finance, 27, 34-51.
Soliman, M.T. (2008). The use of DuPont analysis by market participants. The Accounting Review, 83, 823-853.
South African Institute of Chartered Accountants (SAICA). (2015). Integrated thinking: An exploratory survey. SAICA, Johannesburg.
Sustainability Accounting Standards Board (SASB). (2014). SASB and IIRC announce memorandum of understanding. PR Newswire, 15 January, available at: http://www.prnewswire.com/news-releases/sasb-and-iirc-announce-memorandum-of-understanding-240298181.html.
Welker, M. (1995). Disclosure Policy, Information Asymmetry, and Liquidity in Equity Markets. Contemporary Accounting Research, 11, 801-827.
West, A. (2006). Theorising South Africa’s corporate governance. Journal of Business Ethics, 68, 433-448.
World Economic Forum (WEF). (2015). The global competitiveness report: 2014-2015.
Yermack, D. (1996). Higher market valuation of companies with small board of directors. Journal of Financial Economics, 40, 185-211.
Zhou, S., Simnett, R., & Green, W. (2015). Does integrated reporting matter to the capital market? Working paper, University of Sydney and University of New South Wales.

35
Appendix
Variable definitions
Variable Definition (data from Compustat and Datastream unless stated otherwise) Dependent variables Bid_Ask Bid-ask spread which is calculated as the natural logarithm of the median
value of daily (Ask – Bid) / ((Ask + Bid) / 2) measured over the period spanning month -9 to month +3 relative to a firm’s fiscal year-end. Ask and Bid are the daily closing ask and bid prices, respectively, obtained from the McGregor BFA database.
TobinQ Market-to-book ratio of total assets calculated as total assets minus total common equity plus common shares outstanding at year-end multiplied with share price three months after the end of the financial period, divided by total assets.
EFCF Expected future cash flow which is the terminal value (target price) from IBES discounted using COC (defined below).
COC Cost of equity capital measured as the average internal rate of return (R) based on the approach by Botosan and Plumlee (2002).
Pt =(1 + 𝑅𝑅)−1(𝐸𝐸𝑡𝑡[ 𝐷𝐷𝑡𝑡+1] )+ (1 + 𝑅𝑅)−1(𝐸𝐸𝑡𝑡[ 𝑃𝑃𝑡𝑡+1])
where Pt is the stock price, R is the implied cost of equity capital, 𝐸𝐸𝑡𝑡[ ] denotes market expectation based on the information available in year t, 𝐷𝐷𝑡𝑡+1 is the dividends in year t+1, 𝑃𝑃𝑡𝑡+1 is the target price at the end of t+1. Stock prices and analyst forecasts are measured as of month +3 after the fiscal year-end, consistent with the calculations for compute TobinQ and Bid_Ask.
Variable of interest IRQ Integrated report quality measured as the annual decile rank of the EY
Excellence in Integrated Reporting awards scores.
Control variables in all models Gov Corporate governance score calculated as the average of board function
(CGBF), board structure (CGBS), compensation policy (CGCP) and shareholder right (CGSR) scores from Asset 4.
CSRPerf Corporate social responsibility performance score calculated as the average of the environmental (ENVSCORE) and the social performance score (SOCSCORE) from the Asset 4 database.
LowAQ Low accounting quality measured by the annual decile rank of the fraction of the frequency of small earnings surprises from years t-5 to t-1. A small earnings surprise is where the difference between net income in year t and year t-1, scaled by total assets at the end of year t-2, is between 0 and 0.025.
Complex Firm complexity measured as the average decile rank of earnings volatility, number of subsidiaries and return volatility. Earnings volatility is measured as the natural logarithm of the standard deviation of income before extraordinary items per share from years t-5 to t-1. Number of subsidiaries of a firm is from the McGregor BFA database. Return volatility is measured as the standard deviation of daily stock returns over t-1.
MFDisc Overall disclosure quality measured by management forecast disclosure, computed as the product of Supplier, Frequency and Precision. Management forecast data is from the Capital IQ Key Developments database. Supplier equals 1 if a firm issued at least one management forecast during the current

36
and preceding two financial periods, and 0 otherwise. Frequency is number of management forecasts issued by a firm during the current and preceding two financial periods. Precision is the average precision of management forecasts issued by a firm during the current and preceding two financial periods. Forecast precision equals 1 for general impression forecasts, 2 for minimum and maximum forecasts, 3 for range forecasts and 4 for point forecasts.
Size Size measured as the natural logarithm of market capitalization at the beginning of the year.
Other control variables (bid-ask model) Loss Loss indicator variable which is coded 1 if income before extraordinary
items is negative and 0 otherwise.
BTM Book-to-market ratio of equity calculated as the book value of common shareholders’ interest in the firm, divided by the number of common shares outstanding multiplied by the share price at the end of the year.
Other control variables (Tobin’s Q model) AT_Gr Asset growth measured as the one-year change in total assets scaled by
lagged total assets.
Div Indicator variable coded 1 if the firm declared or paid a dividend in the current year and 0 otherwise.
IB Income before extraordinary items scaled by total assets.
Lev Leverage calculated as the ratio of total debt to the sum of total debt and the book value of common shareholders’ interest in the firm.
Other control variables (EFCF model) Accr Accruals calculated as the difference between net income before extra-
ordinary items and preference dividends and net cash flow from operating activities, scaled by total assets.
RevGr Revenue growth measured as the one-year change in revenues, scaled by lagged revenue growth.
Other control variables (cost of capital model) Beta Obtained from a firm-specific CAPM regression over the past year. Beta is
winsorized between 0 and 4.
Disp Natural logarithm of the standard deviation of the EPS forecast for period t divided by the consensus EPS forecast for period t.
FcBias The one-year-ahead analyst earnings forecast error (consensus minus actual EPS) divided by the absolute value of actual EPS.
Lev As defined above.
DuPont variables ATO Asset turnover measured as the ratio of revenue to beginning of period book
value of assets. PM Profit margin measured as the ratio of income before extraordinary items to
revenue.
ROA Return on assets calculated as the ratio of income before extraordinary items to lagged assets.
ROE Return on equity measured as the ratio of income before extraordinary items to lagged book value of common equity.
AT_Gr As defined above.

37
Table 1 Sample.
Panel A: Sample selection Firms Firm-years EY observations (3 years x 100 firms per year) 112 300 No Compustat coverage (3) (10) Missing ASSET4 data items (8) (44) Other missing data items (9) (22) Sample: Tobin’s Q and Bid-Ask 92 224 No IBES coverage for target price forecasts (25) (61) Sample: Cost of capital and Expected future cash flows 67 163 Panel B: Industry composition GICS sector Firm-years % Energy 7 3.13 Materials 55 24.55 Industrials 25 11.16 Consumer (discretionary) 27 12.05 Consumer (staples) 34 15.18 Health care 8 3.57 Financials 59 26.34 Information technology 3 1.34 Telecommunication services 6 2.68 Final sample: Tobin’s Q and Bid-Ask 224 100.00
38
Table 2 Descriptive statistics. Panel A: Distribution of raw EY scores
Mean
Median
Std. dev.
Min.
Max. % % % % % 2011 EY sample (n = 100) 58.33 59.90 16.77 24.85 90.30 Our sample (n = 65 ) 61.03 61.01 16.38 25.25 90.30 2012 EY sample (n = 100) 49.79 51.41 15.58 15.00 78.55 Our sample (n = 83) 50.49 52.61 14.87 15.00 78.55 2013 EY sample (n = 100) 49.49 48.76 16.51 16.14 75.92 Our sample (n = 76) 48.80 47.58 16.20 17.52 75.92 Panel B: Distribution of regression variables
Mean
P25
Median
P75
Std. dev. Bid_Ask -5.97 -6.29 -6.00 -5.64 0.53 TobinQ 1.81 1.11 1.42 2.15 1.09 EFCF 4.23 3.54 4.24 4.95 1.08 COC 0.17 0.07 0.14 0.24 0.16 IRQ 4.50 2.00 5.00 7.00 2.85 Gov 54.19 43.91 55.25 65.32 15.75 CSRPerf 66.49 53.86 75.25 84.30 24.79 LowAQ 4.53 2.00 5.00 7.00 2.82 Complex 4.50 3.00 4.67 6.00 1.86 MFDisc 9.43 1.00 5.00 12.00 13.10 Accr -0.02 -0.06 -0.02 0.15 0.09 AT_Gr 0.15 0.06 0.13 0.21 0.17 BTM 0.58 0.30 0.52 0.82 0.38 Div 0.80 1.00 1.00 1.00 0.40 IB 0.07 0.03 0.06 0.11 0.08 Lev 0.29 0.13 0.25 0.40 0.21 Loss 0.08 0.00 0.00 0.40 0.28 Rev_Gr 0.16 0.03 0.12 0.22 0.29 Size 10.27 9.30 10.03 10.92 1.24
The table sets out descriptive statistics for all the variables used in the regression analysis for the sample period from 2011 to 2013. The sample includes 224 firm-year observations for 92 firms, except for the COC sample (the EFCF sample) which includes 163 (164) firm-year observations for 67 (67) firms. All of the variables are defined in the Appendix.

39
Table 3 Correlations.
IRQ Gov CSRPerf LowAQ Complex MFDisc AT_Gr Div IB Lev BTM Loss Size IRQ 0.45*** 0.56*** 0.01 0.33*** 0.31*** -0.20*** 0.02 -0.02 0.07 -0.05 0.10 0.33***
Gov 0.42*** 0.39*** -0.07 0.30*** 0.44*** -0.28*** 0.00 -0.11 0.01 0.04 0.17*** 0.28***
CSRPerf 0.54*** 0.34*** 0.09 0.53*** 0.17*** -0.27*** 0.07 -0.15** 0.13** -0.03 0.16** 0.46***
LowAQ 0.01 -0.08 0.08 -0.26*** -0.21*** 0.07 -0.21*** -0.12* 0.29*** -0.25*** -0.11* 0.01 Complex 0.33*** 0.31*** 0.52*** -0.27*** 0.40*** -0.21*** -0.01 -0.08 -0.11* 0.17*** 0.23*** 0.49***
MFDisc 0.34*** 0.44*** 0.29*** -0.24*** 0.49*** -0.27*** -0.04 -0.20*** -0.08 0.25** 0.30*** 0.23***
AT_Gr -0.14** -0.31*** -0.23*** 0.05 -0.18*** -0.18*** 0.10 0.12* 0.11 -0.19*** -0.33*** -0.19***
Div 0.02 0.01 0.00 -0.22*** 0.00 -0.02 0.17*** 0.28*** -0.04 -0.18*** -0.09 0.04 IB -0.12* -0.13** -0.17*** -0.08 -0.14** -0.18*** 0.22*** 0.38*** -0.35*** -0.50*** -0.49*** 0.09 Lev 0.05 -0.05 0.16*** 0.27*** -0.01 -0.12* 0.12* 0.01 -0.31*** -0.02 0.13** 0.03 BTM -0.03 0.02 -0.03 -0.22*** 0.18*** 0.15** -0.19*** -0.23*** -0.52*** 0.04 0.30*** -0.13**
Loss 0.10 0.18*** 0.14** -0.09 0.25*** 0.22*** -0.35*** -0.09 -0.48*** 0.12* 0.20*** 0.05 Size 0.35*** 0.26*** 0.51*** 0.02 0.49*** 0.26*** -0.14** 0.02 0.04 0.02 -0.12* 0.06
The table sets out Pearson (Spearman) correlations above (below) the diagonal for the variables used in the regression analysis for the sample period from 2011 to 2013. *, ** and *** denote significance at a 10%, 5% and 1% level respectively based on a two-tailed test. The sample includes 224 firm-year observations for 92 firms. All of the variables are defined in the Appendix.

40
Table 4 Changes in integrated reporting quality deciles.
TobinQ and Bid_Ask sample
Decile changes Firm-years % Five deciles down 1 0.76 Four deciles down 3 2.27 Three deciles down 6 4.55 Two deciles down 7 5.30 One decile down 27 20.45 Unchanged 41 31.06 One decile up 18 13.64 Two deciles up 14 10.61 Three deciles up 11 8.33 Four deciles up 2 1.52 Five deciles up 1 0.76 Six deciles up 1 0.76 132 100.00
This table shows the movement in our independent variable of interest, integrated report quality (IRQ), for the changes regressions.

41
Table 5 Regression of liquidity on integrated reporting quality: levels and changes.
Bid_Ask ΔBid_Ask Variables
Predicted sign
Coefficient (t-stat.)
Variables
Coefficient (t-stat.)
IRQ − -0.028**
(-2.170) ΔIRQ -0.023***
(-3.249) BTM 0.022
(0.274) ΔBTM 0.299***
(3.422) Size -0.320***
(-9.358) ΔSize -0.214
(-0.965) Gov 0.003
(1.563) ΔGov 0.001
(0.380) CSRPerf -0.003**
(-2.068) ΔCSRPerf 0.001
(0.054) LowAQ -0.009
(-1.250) ΔLowAQ 0.018**
(2.023) Complex 0.028**
(1.994) ΔComplex 0.055
(1.292) MFDisc -0.003
(-1.375) ΔMFDisc -0.004*
(-1.696) Loss 0.022
(0.271) Loss indicator
variables
Yes Industry fixed effects
Yes
Industry fixed effects
Yes
Year fixed effects Yes Year fixed effects Yes Adjusted R2 0.684 Adjusted R2 0.180 N 224 N 132
The levels (changes) sample includes 224 (132) firm-year observations for 92 (79) firms. See the Appendix for variable definitions. All variables, excluding indicator variables, IRQ, LowAQ, Complex and MFDisc, are winsorized at the 1 and 99 percentiles. Standard errors are clustered by firm and by year based on bootstrapping methods using 10,000 iterations. *, ** and *** denote significance at a 10%, 5% and 1% level respectively based on a two-tailed test, except for IRQ which is based on a one-tailed test.

42
Table 6 Regression of Tobin’s Q on integrated reporting quality: levels and changes. TobinQ ΔTobinQ Variables
Predicted sign
Coefficient (t-stat.)
Variables
Coefficient (t-stat.)
IRQ + 0.036**
(2.256) ΔIRQ 0.011**
(2.316) AT_GR -0.097
(-0.721) ΔAT_GR 0.001
(0.013) IB 8.999***
(9.147) ΔIB 0.775
(1.103) Lev 0.121
(0.521) ΔLev 0.278
(0.829) Size -0.004
(-0.071) ΔSize -0.192*
(-1.774) Gov 0.005
(1.497) ΔGov 0.001
(0.468) CSRPerf -0.001
(-0.225) ΔCSRPerf 0.001
(0.155) LowAQ -0.013
(-0.690) ΔLowAQ 0.006
(0.292) Complex -0.053
(-1.240) ΔComplex -0.026
(-0.542) MFDisc -0.004
(-1.515) ΔMFDisc -0.003
(-0.994) Div -0.241**
(-2.451) Div indicator
variables
Yes Industry fixed effects
Yes Industry fixed effects
Yes
Year fixed effects Yes Year fixed effects Yes Adjusted R2 0.702 Adjusted R2 0.028 N 224 N 132
The levels (changes) sample includes 224 (132) firm-year observations for 92 (79) firms. See the Appendix for variable definitions. All variables, excluding indicator variables, IRQ, LowAQ, Complex and MFDisc, are winsorized at the 1 and 99 percentiles. Standard errors are clustered by firm and by year based on bootstrapping methods using 10,000 iterations. *, ** and *** denote significance at a 10%, 5% and 1% level respectively based on a two-tailed test, except for IRQ which is based on a one-tailed test.

43
Table 7 Regression of expected future cash flows on integrated reporting quality: levels and changes.
EFCF ΔEFCF Variables
Predicted sign
Coefficient (t-stat.)
Variables
Coefficient (t-stat.)
IRQ + 0.047* ΔIRQ 0.004*** (1.583) (2.868) Rev_Gr 0.307 ΔRev_Gr 0.012 (1.421) (0.332) Accr 0.405 ΔAccr 0.151 (0.533) (1.498) Size 0.416*** ΔSize 0.152* (4.536) (1.712) Gov -0.008 ΔGov -0.000 (-0.943) (-0.027) CSRPerf -0.009* ΔCSRPerf 0.000 (-1.922) (0.233) LowAQ 0.039 ΔLowAQ 0.003 (0.992) (0.836) Complex 0.278*** ΔComplex 0.012*** (3.469) (3.836) MFDisc -0.005 ΔMFDisc -0.003 (-0.452) (-1.123) Industry fixed effects Yes Industry fixed effects Yes Year fixed effects Yes Year fixed effects Yes Adjusted R2 0.538 Adjusted R2 0.274 N 163 N 95
The levels (changes) sample includes 163 (95) firm-year observations for 67 (59) firms. See the Appendix for variable definitions. All variables, excluding indicator variables, IRQ, LowAQ, Complex and MFDisc, are winsorized at the 1 and 99 percentiles. Standard errors are clustered by firm and by year based on bootstrapping methods using 10,000 iterations. *, ** and *** denote significance at a 10%, 5% and 1% level respectively based on a two-tailed test, except for IRQ which is based on a one-tailed test.

44
Table 8 Regression of cost of capital on integrated reporting quality: levels and changes.
COC ΔCOC
Variables
Predicted sign
Coefficient (t-stat.)
Variables
Coefficient (t-stat.)
IRQ − -0.013** ΔIRQ -0.003 (-1.672) (-0.171) Beta 0.036 ΔBeta 0.038 (0.934) (0.381) Disp 0.000 ΔDisp -0.034 (0.078) (-1.174) FcBias 0.005 ΔFcBias 0.002 (0.177) (0.098) Lev 0.152 ΔLev 1.018 (1.620) (1.615) Size -0.041* ΔSize -0.023 (-1.906) (-0.174) Gov -0.000 ΔGov 0.008 (-0.010) (1.063) CSRPerf 0.001 ΔCSRPerf -0.001 (1.203) (-0.304) LowAQ 0.007 ΔLowAQ 0.036 (1.386) (0.827) Complex 0.033 ΔComplex -0.014 (1.639) (-0.708) MFDisc 0.002* ΔMFDisc 0.001 (1.692) (0.206) Industry fixed effects Yes Industry fixed effects Yes Year fixed effects Yes Year fixed effects Yes Adjusted R2 0.337 Adjusted R2 0.029 N 163 N 95
The levels (changes) sample includes 163 (95) firm-year observations for 67 (59) firms. See the appendix for variable definitions. All variables, excluding indicator variables, IRQ, LowAQ, Complex and MFDisc, are winsorized at the 1 and 99 percentiles. Standard errors are clustered by firm and by year based on bootstrapping methods using 10 000 iterations. *, ** and *** denote significance at a 10%, 5% and 1% level respectively based on a two-tailed test, except for IRQ which is based on a one-tailed test.

45
Table 9 DuPont analysis of intertemporal changes.
ΔATOt+1 ΔPMt+1 ΔROAt+1 ΔROEt+1
ΔIRQt 0.008***
(2.617) 0.000
(0.171) 0.003***
(2.597) 0.008***
(3.775) PMt -0.076
(-0.252) -0.199***
(-2.964) -0.182***
(3.620) -0.328***
(-2.780) ATOt -0.030**
(-2.080) 0.001
(0.135) -0.004
(-1.240) -0.016*
(-1.870) ΔPMt 0.326
(0.787) -0.814***
(-11.046) -0.222***
(-4.620) -0.471***
(-5.211) ΔATOt -0.004
(-0.043) 0.062
(1.052) 0.023
(0.993) 0.072
(1.207) AT_GRt -0.718***
(-7.932) 0.096
(1.010) -0.009
(-0.335) -0.051
(-0.897) Industry fixed effects Yes Yes Yes Yes Year fixed effects Yes Yes Yes Yes Adjusted R2 0.234 0.352 0.336 0.257 N 98 98 98 98
The sample includes 98 firm-year observations for 58 non-financial firms. See the Appendix for variable definitions. All variables, excluding indicator variables and ΔIRQ are winsorized at the 2.5 and 97.5 percentiles. Standard errors are clustered by firm and by year based on bootstrapping methods using 10 000 iterations. *, ** and *** denote significance at a 10%, 5% and 1% level respectively based on a two-tailed test, except for ΔIRQ which is based on a one-tailed test.