
The economic benefit of the improving the UK's nuclear supply chain capabilities
122
The economic benefit of improving the UK's nuclear supply chain capabilities March 2013 March 2013
Transcript of The economic benefit of the improving the UK's nuclear supply chain capabilities
The economic benefit of improving the UK's nuclear
supply chain capabilities
March 2013
March 2013

Contents
Executive summary ................................................................................... 3
1 The Nuclear supply chain in the UK ............................................. 13
2 Consultation findings..................................................................... 17
3 International case studies ............................................................. 27
4 Economic impact of nuclear new build – gross impacts........................................................................................... 35
5 Net impact of capability improvements........................................ 61
6 Realising the potential ................................................................... 75
7 Conclusions and summary............................................................ 86
Annex A: Technical annex ...................................................................... 95
Annex B: Sectoral GVA and employment forecasts ................................................................................................. 112
Annex C: References............................................................................. 119

3
The economic benefit of improving the UK's nuclear supply chain capabilities
March 2013
Executive summary
This study by Oxford Economics and Atkins, quantifies some of the potential
economic impacts associated with developing the capabilities of the UK's nuclear supply chain1.
The study takes place against the backdrop of the UK Government's policy that new nuclear should be able to contribute as much as possible to the need for
new low carbon electricity generating capacity. It is recognised that industry has already set out its plans to develop approximately 16GW of new nuclear power in the UK. Developments of this scale would present significant opportunities in
the UK nuclear sector from which the UK supply chain can benefit. The UK Government has therefore stated its commitment to ensuring that the new nuclear build programme not only delivers much of new generating capacity
required but also that it delivers economic benefits to the UK including ensuring the nuclear supply chain is well positioned to access UK and long term export markets.
As a result of the policy aims with respect to new nuclear, the objectives of this
study were to provide:
a short review of current UK capabilities to be informed by industry consultations and a review of the literature;
international case studies;
an assessment of a range of potential levels of domestic content within new nuclear projects in UK;
a bottom-up net cost-benefit analysis of scenarios in which UK economic
activity is increased above the baseline; and
an indicative cost-benefit analysis of policies contained in the Nuclear Supply Chain Action Plan.
In this study we define the UK's supply chain capabilities as any work that can be undertaken within the UK.
Consultees’ views on current capabilities
A consultation exercise with industry bodies and private sector companies in the
supply chain was used together with Atkins’ own experience to inform the study and, in particular, the modelling assumptions. It should be noted that there is a significant degree of uncertainty around current capabilities across the various
1 In this study we define the UK's nuclear supply chain capabilities as any work that
would be undertaken within the UK. Likewise, the economic benefit to the UK from
improving the UK nuclear supply chain is additional gross output, GVA and employment
captured within UK boundaries.

4
The economic benefit of improving the UK's nuclear supply chain capabilities
March 2013
tiers and component areas of the UK nuclear supply chain, particularly given the considerable length of time since the last nuclear reactor was constructed in the UK and the early stage of the current nuclear programme.
The views expressed were however informative in deriving the necessary set of
modelling assumptions. We acknowledge that the estimated ranges expressed within this report (with respect to the share of the new nuclear programme that could be captured by the UK supply chain) represent just one view of potential
UK activity. It is recognised that it is no more or less valid than other views which various industry groups and participants may hold. It is also acknowledged that the nuclear consortia which have set out plans for new build
in the UK may set voluntary ambitions or targets for the proportion of the value of the plant which should be sourced within the UK. In doing so, the subsequent value captured by the UK supply chain could differ somewhat from the range of
results presented within this report.
Therefore the primary purpose of the subsequent analysis was to demonstrate, under a range of assumptions, the potential magnitude of economic impacts that could accrue to the UK supply chain and the UK economy from the development
of a new nuclear programme. Notwithstanding the inherent uncertainty in analysis of this type, the clear and transparent assumptions employed in this study, together with an accepted modelling framework of economic interactions,
enabled such an assessment to be made. This provides a clear picture of the potential scale of economic impacts over the period to 2030.
In reality, the eventual magnitude and timing of the benefits to the UK from a new nuclear programme will be determined largely by the scale and time horizon
of the programme as well as the level of UK supply chain involvement. The results of this analysis should therefore be viewed as illustrative of a range of possible outcomes and dependent on a number of modelling assumptions.
In summary the consultation exercise found:
There was general agreement that the UK may currently be able to deliver
around 45% supply chain requirements. It was suggested that this could rise to approximately 60% if challenges were addressed, barriers were removed, a new build programme gathers momentum and industry was
supported;
It was felt that the supply chain did not need to undertake significant levels of new R&D to deliver on the new builds. Though it was thought that additional R&D could help open export markets; and
All respondents recognised that there is currently an opportunity for the
UK’s reputation to be enhanced through delivery of Hinkley Point C. Successful delivery would strengthen the perception of the UK supply chain. This was viewed as being important given the general view that
foreign competition was strong and UK firms will face a significant challenge from overseas companies.

5
The economic benefit of improving the UK's nuclear supply chain capabilities
March 2013
The value to the UK is still significant
The results presented in this report are indicative and are driven by the
modelling assumptions on the scale and deployment profile of new nuclear reactors. They represent particular views of potential UK activity and we recognise they are no more or less valid than other informed views
which various industry groups and participants may hold.
Our modelling suggests that despite limited capability in some areas of the supply chain currently, the UK could benefit substantially from nuclear new build. For modelling purposes we assume that the UK supply chain could currently
capture 44% of the total value of a new nuclear reactor as informed by industry consultations and a review of available evidence. The same process enabled us to arrive at a view in which the UK share rises to 63% of a single reactor as a
result of government intervention and other actions undertaken by organisations involved in nuclear new build. These interventions and actions may increase the UK share of a single reactor by increasing the competitiveness of UK firms, or by
realising capabilities in areas where the UK has some potential through additional investment (e.g. capital or training).
The UK shares discussed above form the basis of two scenarios modelled in the study, representing current capabilities (Scenario A) and improved capabilities
(Scenario B) in the UK. Table 1 shows the assumed UK shares of various nuclear new build activities for an individual reactor commencing construction in 2012 and the associated values2 under Scenarios A and B.
Table 1: The UK's share of new build costs of a single 1.65GW reactor, construction commencing in 2012
2 Values are based on the total capital cost of a reactor consistent with Parson
Brinckerhoff’s Electricity Generation Cost Model developed for DECC (2012). The
breakdown of costs into activity categories was informed by the consultations and utilising
Atkins industry knowledge.
We assume the UK could capture 44% of the total value of a nuclear reactor under current capabilities, rising to a potential 63% with supply chain improvements.
UK shareUK value (£m, 2012 prices)
UK shareUK value (£m, 2012 prices)
UK share (% points)
UK value (£m, 2012 prices)
Pre-licensing technical & design 311 90% 280 90% 280 0% 0
Regulatory, licensing & public enquiry 5 90% 4 90% 4 0% 0
Programme & construction management 331 50% 166 80% 265 30% 99
Civil construction & installation 1,989 60% 1,193 80% 1,591 20% 398
Nuclear Steam Supply System 829 10% 83 25% 207 15% 124
Balance of nuclear island 829 30% 249 60% 497 30% 249
Non-nuclear island 1,326 40% 530 70% 928 30% 398
Instrumentation & control 796 35% 278 35% 278 0% 0
Fuel 209 50% 105 70% 146 20% 42
Infrastructure 6 100% 6 100% 6 0% 0
Total (single reactor, 2012 construction) 6,630 44% 2,894 63% 4,204 19% 1,310
Scenario AScenario B (from third
reactor onwards*)Scenario B relative to
Scenario A (additional)Reactor value (£m, 2012
prices)
* In Scenario B the UK only attains the higher shares from the third reactor on, with the first two reactors having UK shares equal to Scenario A.
Source: Oxford Economics and Atk ins
6
The economic benefit of improving the UK's nuclear supply chain capabilities
March 2013
Using our be-spoke model we have analysed two potential nuclear new build programme profiles:
10GW of nuclear power by 2030; and
16.5GW of nuclear power by 2030.
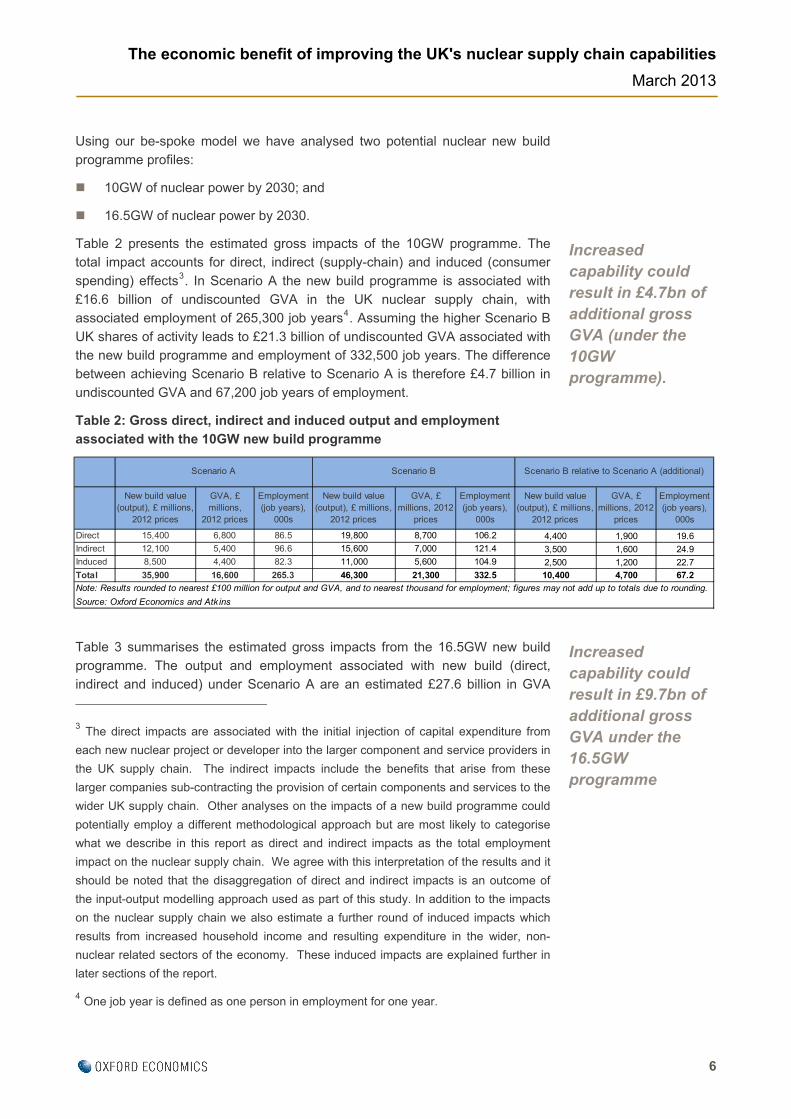
Table 2 presents the estimated gross impacts of the 10GW programme. The total impact accounts for direct, indirect (supply-chain) and induced (consumer
spending) effects3. In Scenario A the new build programme is associated with £16.6 billion of undiscounted GVA in the UK nuclear supply chain, with associated employment of 265,300 job years4. Assuming the higher Scenario B
UK shares of activity leads to £21.3 billion of undiscounted GVA associated with the new build programme and employment of 332,500 job years. The difference between achieving Scenario B relative to Scenario A is therefore £4.7 billion in
undiscounted GVA and 67,200 job years of employment.
Table 2: Gross direct, indirect and induced output and employment associated with the 10GW new build programme
Table 3 summarises the estimated gross impacts from the 16.5GW new build programme. The output and employment associated with new build (direct, indirect and induced) under Scenario A are an estimated £27.6 billion in GVA
3 The direct impacts are associated with the initial injection of capital expenditure from
each new nuclear project or developer into the larger component and service providers in
the UK supply chain. The indirect impacts include the benefits that arise from these
larger companies sub-contracting the provision of certain components and services to the
wider UK supply chain. Other analyses on the impacts of a new build programme could
potentially employ a different methodological approach but are most likely to categorise
what we describe in this report as direct and indirect impacts as the total employment
impact on the nuclear supply chain. We agree with this interpretation of the results and it
should be noted that the disaggregation of direct and indirect impacts is an outcome of
the input-output modelling approach used as part of this study. In addition to the impacts
on the nuclear supply chain we also estimate a further round of induced impacts which
results from increased household income and resulting expenditure in the wider, non-
nuclear related sectors of the economy. These induced impacts are explained further in
later sections of the report.
4 One job year is defined as one person in employment for one year.
Increased capability could result in £4.7bn of additional gross GVA (under the 10GW programme).
Increased capability could result in £9.7bn of additional gross GVA under the 16.5GW programme
New build value (output), £ millions,
2012 prices
GVA, £ millions,
2012 prices
Employment (job years),
000s
New build value (output), £ millions,
2012 prices
GVA, £ millions, 2012
prices
Employment (job years),
000s
New build value (output), £ millions,
2012 prices
GVA, £ millions, 2012
prices
Employment (job years),
000s
Direct 15,400 6,800 86.5 19,800 8,700 106.2 4,400 1,900 19.6Indirect 12,100 5,400 96.6 15,600 7,000 121.4 3,500 1,600 24.9Induced 8,500 4,400 82.3 11,000 5,600 104.9 2,500 1,200 22.7
Total 35,900 16,600 265.3 46,300 21,300 332.5 10,400 4,700 67.2
Scenario A Scenario B Scenario B relative to Scenario A (additional)
Note: Results rounded to nearest £100 million for output and GVA, and to nearest thousand for employment; figures may not add up to totals due to rounding.
Source: Oxford Economics and Atk ins

7
The economic benefit of improving the UK's nuclear supply chain capabilities
March 2013
and 444,000 job years. Attaining Scenario B, meanwhile, would result in a gross GVA impact of £37.3 billion and 587,000 job years. The difference between attaining Scenario B relative to Scenario A is therefore £9.7 billion in
undiscounted GVA and 143,000 job years.
Table 3: Gross direct, indirect and induced impacts from the 16.5GW new build programme
Figure 1 illustrates the estimated direct employment profiles under the 10GW and 16.5GW programmes. With regards to the 10GW programme employment
peaks in 2024 at around 8,300 jobs in Scenario A and 12,100 jobs in Scenario B. Under the 16.5GW programme employment peaks in 2020 at 13,700 jobs in Scenario A and 18,600 jobs in Scenario B. If there were further new build after
this programme, then the employment would continue beyond 2030.
Figure 1: Gross direct employment impacts, 2013-2030
Table 4 summarises the peak direct, indirect and induced employment impacts
(on gross basis) from the 10GW and 16.5GW programmes. As mentioned previously employment impacts peak in 2024 under the 10GW programme and in 2020 under the 16.5GW programme. In the 16.5GW programme the peak
employment impact is 42,700 jobs in Scenario A allowing for direct, indirect and induced effects, with a corresponding figure of 60,000 for Scenario B. If we
New build value (output), £ millions,
2012 prices
GVA, £ millions, 2012
prices
Employment (job years),
000s
New build value (output), £ millions,
2012 prices
GVA, £ millions, 2012
prices
Employment (job years),
000s
New build value (output), £ millions,
2012 prices
GVA, £ millions, 2012
prices
Employment (job years),
000s
Direct 25,500 11,400 144.6 34,600 15,200 186.6 9,100 3,800 42.0Indirect 20,100 9,000 161.7 27,300 12,200 214.7 7,200 3,200 53.0Induced 14,100 7,200 137.7 19,200 9,900 185.8 5,100 2,700 48.1
Total 59,700 27,600 444.0 81,100 37,300 587.0 21,400 9,700 143.0
Source: Oxford Economics and Atk ins
Scenario B Scenario B relative to Scenario A (additional)
Note: Results rounded to nearest £100 million for output and GVA, and to nearest thousand for employment; figures may not add up to totals due to rounding.
Scenario A
0
2
4
6
8
10
12
14
16
18
20
2013 2015 2017 2019 2021 2023 2025 2027 2029
Employment, job years, 000s
10GW ‐ Scenario A 16GW ‐ Scenario A
10GW ‐ Scenario B 16GW ‐ Scenario B
Source: Oxford Economics and Atkins

8
The economic benefit of improving the UK's nuclear supply chain capabilities
March 2013
consider direct and indirect (supply-chain) effects only then peak employment is 29,400 jobs in Scenario A and 40,800 jobs in Scenario B. The estimated years in which employment impacts peak are indicative and determined by the modelling
assumptions on the scale and deployment profile of the new nuclear reactors.
Table 4: Peak employment impacts of nuclear new build (gross)
Net impacts to the UK economy
Once we take account of displacement5 and additionality we estimate that the net impact of increasing UK capability is worth nearly £691 million of undiscounted additional output and £291 million of undiscounted
additional GVA over the period 2012 to 2030 for the 10GW new build programme. This increase in output and GVA is solely due to a “nuclear premium” effect whereby workers are employed in higher productivity jobs as a
result of the UK capturing more new build activity. We find that the gross employment impacts of achieving Scenario B are fully displaced under the 10GW programme as are all subsequent indirect and induced impacts and any
R&D spillovers. This is due to the output gap (i.e. spare capacity in the economy due to the recession) being assumed to have closed by the time the UK supply chain starts realising higher shares of new build activity at the time of the third
reactor.
Table 5: Net impact of achieving Scenario B relative to Scenario A, 10GW programme
5 It is worth noting that the displacement assumptions used in the modelling are at a
national level and thus could mask regional differences.
Peak yearPeak employment,
job years, 000sPeak year
Peak employment, job years, 000s
Peak yearPeak employment,
job years, 000sPeak year
Peak employment,job years, 000s
Direct 2024 8.3 2024 12.1 2020 13.7 2020 18.6Indirect 2024 10.0 2024 15.0 2020 15.7 2020 22.1Induced 2024 8.7 2024 13.3 2020 13.3 2020 19.3Total 2024 27.0 2024 40.3 2020 42.7 2020 60.0
16GW programme
Scenario A gross employment Scenario B gross employment
Source: Oxford Economics and Atkins
10GW programme
Scenario A gross employment Scenario B gross employment
UK new build value (output), £ millions
GVA, £ millionsEmployment (job
years), 000s
Direct £691 £291 0.0
Indirect £0 £0 0.0
Induced £0 £0 0.0
R&D spillovers N/A £0 N/A
Total £691 £291 0.0
Source: Oxford Economics and Atkins

9
The economic benefit of improving the UK's nuclear supply chain capabilities
March 2013
The 16.5GW programme enjoys some indirect and induced benefits given the timing of new builds and when the supply chain can capitalise on improved capabilities (e.g. 2017, before the assumed closing of the output gap, i.e. when
there is spare capacity in the economy). We estimate that the gross impact of R&D spillovers are nearly all displaced.
Table 6: Net direct, indirect and induced impacts and R&D spillovers of achieving Scenario B relative to Scenario A, 16.5GW programme
In order to calculate the present value of these impacts we have discounted the GVA benefits using a 3.5% real discount rate6. This approach takes account of
the social time preference of future benefits and costs. We find that:
Under the 10GW new build programme, the Net Present Value of the total GVA benefits to the UK from 2012 to 2030 is £194 million;
The Net Present Value of the GVA benefits rises to £468 million under the 16.5GW new build programme.
It should be noted that the NPV estimates of the net monetised benefits of
obtaining a higher share of the new nuclear supply chain do not include any costs relating to investment or training that may be required to achieve them or the potential benefits from export opportunities.
Market failures restrict growth
The consultation exercise found that there are currently a number of barriers
stopping new firms from entering the supply chain including a lack of ‘nuclear culture', the expense and time commitment of business development activities,
6 Following official guidance from “The Green Book, Appraisal and Evaluation in Central
Government”, HM Treasury (2003).
There are a number of barriers restricting capability and growth in the sector.
The net GVA benefit from improving the UK supply chain could be as much as £468m in NPV terms under the 16.5GW programme.
UK new build value (output), £ millions, 2012
prices
GVA, £ millions, 2012 prices
Employment (job years), 000s
Direct £1,485 £624 0.4
Indirect £38 £17 0.3
Induced £30 £15 0.3
R&D spillovers N/A £0.3 N/A
Total £1,554 £657 1.0
Source: Oxford Economics and Atkins
Note: it is not appropriate to estimate productivity for direct jobs in the table above
given the inclusion of the nuclear premium in the output and GVA figures. See Section 5
for further details.

10
The economic benefit of improving the UK's nuclear supply chain capabilities
March 2013
established relationships and the perception of the difficulty to break into the industry.
There were also reported barriers stopping existing firms from expanding and developing. These ranged from an inability to articulate requirements to non-
experts involved in procurement, to difficulties with understanding specifications and standards, to the slow adoption of new technology.
These barriers limit the supply chain capability and the direct benefits that the UK nuclear supply chain will receive from a new build programme. Consequently
this in turn reduces the indirect and induced benefits that the wider UK economy would enjoy. In addition, these barriers are likely to put downward pressure on R&D expenditure and hinder the market from delivering the most efficient
outcome.
Therefore, there is a clear rationale for Government intervention to support capability improvements in the UK supply chain and in doing so, encourage R&D spend.
Suggestions for realising this potential
The consultation exercise revealed that industry bodies and the private sector
were in general agreement that given the right environment, working practices and with the right support the UK's nuclear supply chain could deliver more of the new build programme. Using their feedback and our collective professional
judgement we make the following recommendations:
Table 7: Summary of recommendations
Recommendation Explanation Responsibility
Confidence and certainty in the new build programme
The private sector needs to have confidence that the new build programme will happen, and a greater understanding of what is involved. Consequently we feel that Government should continue with its clear support and commitment to nuclear power, while developers should reassure the market that they are committed to investing in a steady stream of new reactors.
Government and developers
Financial support for small and medium sized firms
The financial commitment required to be involved in nuclear new build is considerable. A staggered approach to payments, rather than payment on delivery may support further involvement by UK firms. In addition, greater financial support on R&D could encourage the private sector to become more innovative and globally competitive.
Government
Technical support for new to nuclear firms and facilitation of partnering
It was suggested that new to nuclear firms need more support. It might be beneficial to provide a facilitated platform through the NIA that keeps the new-to-nuclear supply chain informed and engaged. This should include explanation of programme timescales and changes. In addition, it should also include awareness of opportunities.
Government and the NIA.
11
The economic benefit of improving the UK's nuclear supply chain capabilities
March 2013
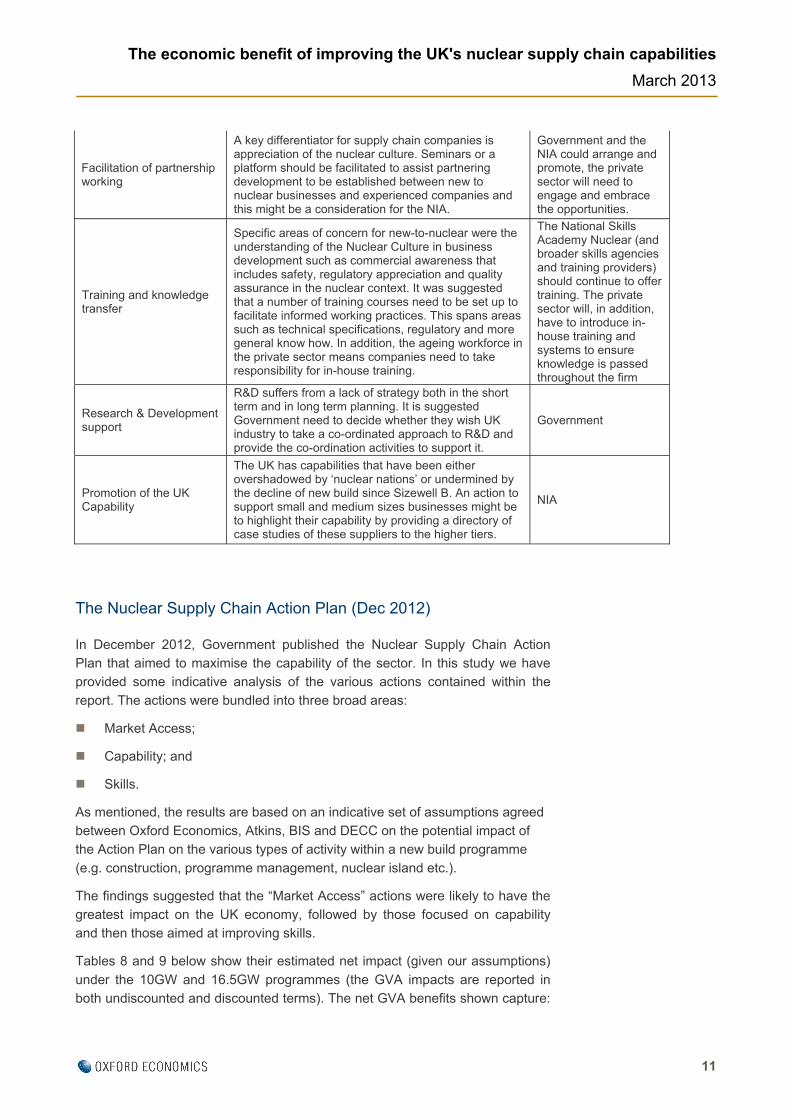
Facilitation of partnership working
A key differentiator for supply chain companies is appreciation of the nuclear culture. Seminars or a platform should be facilitated to assist partnering development to be established between new to nuclear businesses and experienced companies and this might be a consideration for the NIA.
Government and the NIA could arrange and promote, the private sector will need to engage and embrace the opportunities.
Training and knowledge transfer
Specific areas of concern for new-to-nuclear were the understanding of the Nuclear Culture in business development such as commercial awareness that includes safety, regulatory appreciation and quality assurance in the nuclear context. It was suggested that a number of training courses need to be set up to facilitate informed working practices. This spans areas such as technical specifications, regulatory and more general know how. In addition, the ageing workforce in the private sector means companies need to take responsibility for in-house training.
The National Skills Academy Nuclear (and broader skills agencies and training providers) should continue to offer training. The private sector will, in addition, have to introduce in-house training and systems to ensure knowledge is passed throughout the firm
Research & Development support
R&D suffers from a lack of strategy both in the short term and in long term planning. It is suggested Government need to decide whether they wish UK industry to take a co-ordinated approach to R&D and provide the co-ordination activities to support it.
Government
Promotion of the UK Capability
The UK has capabilities that have been either overshadowed by ‘nuclear nations’ or undermined by the decline of new build since Sizewell B. An action to support small and medium sizes businesses might be to highlight their capability by providing a directory of case studies of these suppliers to the higher tiers.
NIA
The Nuclear Supply Chain Action Plan (Dec 2012)
In December 2012, Government published the Nuclear Supply Chain Action Plan that aimed to maximise the capability of the sector. In this study we have provided some indicative analysis of the various actions contained within the
report. The actions were bundled into three broad areas:
Market Access;
Capability; and
Skills.
As mentioned, the results are based on an indicative set of assumptions agreed between Oxford Economics, Atkins, BIS and DECC on the potential impact of the Action Plan on the various types of activity within a new build programme
(e.g. construction, programme management, nuclear island etc.).
The findings suggested that the “Market Access” actions were likely to have the greatest impact on the UK economy, followed by those focused on capability and then those aimed at improving skills.
Tables 8 and 9 below show their estimated net impact (given our assumptions)
under the 10GW and 16.5GW programmes (the GVA impacts are reported in both undiscounted and discounted terms). The net GVA benefits shown capture:

12
The economic benefit of improving the UK's nuclear supply chain capabilities
March 2013
productivity benefits from the “nuclear premium”; an increase in UK employment when there is spare capacity; and R&D spillovers. Our modelling approach means the results cannot be summed to produce an overall Action Plan
estimate. The potential impact of the whole Action Plan on UK shares is assumed to be (broadly) the same as the uplift for the “Market Access” policies i.e. the policy package with the estimated potential highest impact.
Consequently, this could be viewed as a conservative assumption as it assumes little additionality from the actions in the other policy packages above that from “Market Access” actions.
Table 8: Additional benefits to the UK economy due to the Action Plan (net
impact, post-displacement), 10GW programme
Table 9: Additional benefits to the UK economy due to the Action Plan (net impact, post-displacement), 16.5GW programme
Therefore under a 10GW programme, our analysis suggests that the Action Plan could deliver net GVA benefits of around £124m (discounted) and under a
16.5GW programme around £299m (discounted). It should be noted that these monetised net impacts on the UK economy do not include any costs associated with investment and training or the potential benefits from export opportunities.
Undiscounted Discounted
Scenario B 1,554 657 468 1.0
"Market Access" actions 923 392 279 0.6
"Capability" actions 678 287 204 0.4
"Skills" actions 527 222 156 0.2
Action Plan (whole) 989 419 299 0.6
Source: Oxford Economics estimates based on Atkins, DECC and BIS assumptions
GVA, £ millions, 2012 pricesUK new build value
(output), £ millions, 2012
prices, undiscounted
Additional (net) benefit to UK relative to baseline
(direct+indirect+induced)
Employment
(job years), 000s
Undiscounted Discounted
Scenario B 691 291 194 0.0
"Market Access" actions 410 173 116 0.0
"Capability" actions 304 128 85 0.0
"Skills" actions 242 101 67 0.0
Action Plan (whole) 439 185 124 0.0
Additional (net) benefit to UK relative to baseline
(direct+indirect+induced)
GVA, £ millions, 2012 pricesUK new build value
(output), £ millions, 2012
prices, undiscounted
Employment
(job years), 000s
Source: Oxford Economics estimates based on Atkins, DECC and BIS assumptions
13
The economic benefit of improving the UK's nuclear supply chain capabilities
March 2013
1 The Nuclear supply chain in the UK
Oxford Economics and Atkins were commissioned in August 2012 by the
Department for Business Innovation and Skills (BIS) to quantify the potential economic impacts associated with developing the capabilities of the UK's nuclear supply chain7. This study takes place against the backdrop of the
Government's ambitions for new nuclear being able to contribute as much as possible to the need for new low carbon capacity.
1.1 Current policy supports nuclear
Nuclear is an important part of the UK’s energy policy, alongside reducing our energy use, increasing renewables and investing in new energy technologies.
The 2008 White Paper "Meeting the Energy Challenge" set out that nuclear should be part of the UK’s low carbon energy mix, and that private sector companies should have the option of building new nuclear power stations.
Following this, the Government made commitments to take steps to enable such private investment to be made.
It is UK Government policy that new nuclear should be able to contribute as much as possible to the UK’s need for new generation capacity. The
Government believes that nuclear power is economically competitive with other generation technologies, including the lowest cost renewable technologies, and that new nuclear is likely to become the most cost effective source of low carbon
electricity. It is therefore anticipated that industry will want to bring forward a number of applications for new nuclear power stations in the UK, with the first of these submitted by EDF for development at Hinkley Point in Somerset in
October 2011.
In a written statement to Parliament in October 2010, the Government reconfirmed its policy that there will be no public subsidy for new nuclear power. This means that there will be no levy, direct payment of market support for
electricity supplied or capacity provided by a private sector new nuclear operator, unless similar support is also made available more widely to other types of generation. The policy does not rule out the provision of support to
industry in the normal course of the business of government, and the Government will for example continue to support wider activity in the nuclear sector, including activities on research and development, supply chain and skills.
Electricity Market Reform (EMR) intends to bring about a far-reaching reform of
the UK electricity market, in order to deliver the investment needed to maintain
7 In this study we define the UK's nuclear supply chain capabilities as any work that
would be undertaken within the UK. Likewise, the economic benefit to the UK from
improving the UK nuclear supply chain is additional gross output, GVA and employment
captured within UK boundaries.
The NIA reports that the nuclear industry employs around 40,000 people in the UK.

14
The economic benefit of improving the UK's nuclear supply chain capabilities
March 2013
security of supply, meet the UK’s renewables and decarbonisation targets, and minimise consumer bills.
The key elements of EMR are Contracts for Difference (CfDs) and the Capacity Market (CM). CfDs will stimulate investment in low carbon technologies,
including renewables, nuclear and Carbon Capture and Storage (CCS), by providing predictable revenue streams that encourage investment and make it easier and cheaper to secure finance. The Capacity Market (CM) will ensure
security of supply by giving capacity providers financial incentives to provide reliable capacity.
Ahead of EMR implementation the government is committed to working with relevant nuclear developers to enable investment decisions to progress to
timetable.
The civil nuclear industry employs around 40,000 people in the UK; 25,000 jobs directly with a further 15,000 in the supply chain according to the Nuclear Industry Association's (NIA) 2012 Capability Review. Consequently the sector
can play a greater role in the UK as an employer and provider of energy. Furthermore, projections by the International Energy Agency (IEA) suggest that by 2030 global nuclear new build sales will be worth £0.93 trillion. There is
therefore potential for the UK's nuclear supply chain to export goods and services and expand further.
1.2 Though limited recent investment
The UK is considered to be one of the pioneers in civil nuclear power with the development of the Magnox station at Calder Hall in 1956, which utilised gas
cooled-technology, rather than the more common light-water designs that were being used elsewhere in the world. This helped to place the UK nuclear industry outside of international mainstream developments.
In addition, almost all of the nuclear plants that exist in the UK today are all
unique, individually designed, including the one light-water reactor – Sizewell B. While the reactor at Sizewell was based on a standard Westinghouse PWR design, it was subsequently modified during the design and construction phases
and ultimately ended up serving as prototype of a new advanced PWR reactor.
The use of a less popular technology, the uniqueness of each individual plant and the lack of plants being built has made it challenging to encourage the UK nuclear supply chain to invest in facilities and staff due to a lack of global market
for many of the components used in the UK specific reactor designs.8 Also, the lack of demand for constructing nuclear plants has led some members of the supply chain to redirect their focus away from supplying the nuclear industry.
8 IBM Business Consulting Services (2005), “An evaluation of the capability and capacity
of the UK and global supply chains to support a new nuclear build programme in the UK.”
Reluctance to invest in facilities and staff historically.

15
The economic benefit of improving the UK's nuclear supply chain capabilities
March 2013
The proposed use of a number of standardized designs in the nuclear build programme should help to encourage the UK nuclear supply chain to invest in facilities and staff, because not only will they be able to supply the UK new-build
market, but also the global market as these designs have become the standard of choice in many countries.
While there has been a considerable eroding of the capacity of some of the specialist equipment manufacturers and service suppliers in the UK nuclear
supply chain, on-going operating support service, modification, and decommissioning work has helped to maintain a high-level of nuclear engineering, manufacturing, and site installation capability. Furthermore, many
members of the nuclear supply chain have found a market in supplying non-nuclear power station, petrochemical, pharmaceutical, and off-shore oil & gas industries, which have many components that are similar to those of nuclear
plants.
Parts of the UK nuclear supply chain still have considerable manufacturing experience and facilities capable of supplying a large portion of the materials and equipment that go into a nuclear plant. Some UK companies are among the
world leaders and are currently exporting their equipment and skills overseas to support nuclear plant construction projects.
1.3 Supply chain requirements
However, the role of the UK supply chain in the proposed new build programme will partially be determined by the choice of reactor design. There is a risk that a
design owner may have an existing global supply chain which may limit the participation of the UK-based supply chain. In addition, the design of the plant itself may have implications for the local impacts resulting from the new build
programme.
1.4 Current gaps
It is commonly accepted that the UK supply chain cannot currently supply:
Reactor pressure vessel;
Steam generator and turbine;
Ultra large forgings; and
Reactor coolant pumps
Table 1.1 provides an overview of what the existing evidence suggests the UK supply chain can and cannot supply.
UK has world leaders in some areas of nuclear new build.

16
The economic benefit of improving the UK's nuclear supply chain capabilities
March 2013
Table 1.1: Overview of UK capability based on existing evidence
Supply chain Activity Currently provided in the
UK?
Architect, engineering, etc.
Programme Management Yes
Technical Support Yes
Construction Management Yes
Commissioning Management Yes
Civil engineering e.g.
Site works Yes
Site remediation Yes
Power supply network Yes
Nuclear Island e.g.
Reactor Pressure Vessel Not currently
Reactor Vessel Internals Not currently
Steam Generators Not currently
Pressuriser Not currently
Waste Management Systems Yes
Control and Protection Systems Yes
Conventional island e.g.
Turbine Not currently
Generator Not currently
Cooling Water Systems Yes
Heating Ventilation and Air Conditioning Yes
Balance of Plant Yes
Other
Mechanical and electrical erection, installation and commissioning
Yes
Fuel Supply Yes
Other (other engineering works, local content, investment in skills etc.)
Yes

17
The economic benefit of improving the UK's nuclear supply chain capabilities
March 2013
2 Consultation findings
In undertaking this study, Oxford Economics and Atkins have reviewed literature
(see the list of documents in Annex C) exploring the nuclear supply chain analysis and models in both the UK and overseas. This background analysis has supported a series of consultations with representatives of the nuclear sector
including the supply chain. In total 14 industry representatives were consulted. Individually they represent a sub-sector of the overall community and can talk authoritatively on behalf of the groupings they represent. Some interviews were
conducted face-to-face but the majority were conducted over the telephone. This section presents the respondents general perceptions on:
the capacity of the nuclear supply chain to deliver;
the barriers to entry;
the barriers to expansion; and
how to address barriers.
Key findings:
There was general agreement that the UK may currently be able to
deliver 45% to 50% of supply chain requirements rising to around 60% if
barriers were removed and industry was supported;
All respondents recognised that there is an opportunity for the UK’s
reputation to be enhanced through delivery of Hinkley Point C;
There was a general view that foreign competition was strong and UK
firms will face significant challenge from overseas;
There was general agreement on what components the UK could and
could not deliver (see body of this section for detail);
There was agreement that significant R&D was not required to deliver the
above components, but R&D was seen as important for export success;
There are currently a number of barriers stopping new firms from entering
the supply chain including a lack of ‘nuclear culture', the expense and
time commitment of business development activities, established
relationships and the perception of the difficulty to break into the industry;
There are also barriers stopping existing firms from expanding and
developing. These ranged from an inability to articulate requirements, to
non-experts involved in procurement, to difficulties with understanding
specifications and standards, to the slow adoption of new technology; and
A range of suggested measures to tackle these barriers were offered.
They include a renewed commitment by Government, up-skilling,
communication of opportunities, clear understanding of the value and
timing of new builds, partnership arrangements, and capability promotion.

18
The economic benefit of improving the UK's nuclear supply chain capabilities
March 2013
2.1 The capacity of the nuclear supply chain to deliver
There were mixed views on the capacity of the UK nuclear supply chain. In this
study we define the UK's supply chain capabilities as any work that can currently be undertaken within the UK. Some reported that the experience of delivery in all stages of the nuclear programme provides the UK with a unique capability as it
appreciates the ‘cradle to grave’ requirements of the programme.
On the other hand, there was a perception by some that given the lack of new build activity in the UK the "nuclear culture" could have been lost. Consequently it was felt by some of the respondents that the UK may have lost competency.
There was general agreement that the UK may currently be able to deliver 45% to 50% of supply chain requirements rising to around 60%9 if barriers were removed and industry was supported and that this would only be
achieved after several builds.
Those that were positive felt that the UK is considered methodical in how it operates and that there is a perception that it works well with regulators. The UK is considered very strong in the area of programme and project management.
The delivery of the London Olympic and Paralympics games was quoted as an example that has world-wide recognition. However there will be significant competition from the global market place and as such UK firms are not expected
to provide all the project management services going forward.
Transportation can be a significant cost, and some stated that if there is a modular approach to build, the UK will be able to demonstrate a track record in this type of build.
All respondents recognised that there is an opportunity for the UK’s reputation to
be enhanced through delivery of Hinkley Point C. Success here would refocus attention to the UK and eliminate any negative perceptions of UK nuclear culture. It was recognised that there is considerable risk as the first of a kind is
always problematic and alterations in scope were expected. It was felt that the nature of the contractual arrangements would be important, and the balance between adversarial change management and development of long term
relationships would have a significant impact on the management of risk.
It was felt that if the current opportunity of delivery Hinkley Point C was missed, over a relatively short period the UK will not be seen as the place to go for nuclear capability because others (specifically China and Russia) will overtake
the UK’s position. It was noted that as low cost economies establish a viable export capability then the UK supply chain will find it difficult to compete on price due to salary rates and the reduced impact of higher scrap levels in low cost
economies. China was quoted as an example.
9 The modelling assumptions employed by this study assume a particular view of UK
capabilities in which the UK supply chain can deliver 44% of the value of a reactor at
present, with this share potentially rising to 63% following government interventions and
other actions taken by organisations engaged in new build.
There was a general perception that the UK will be able to deliver 45% to 50% of a nuclear new build.

19
The economic benefit of improving the UK's nuclear supply chain capabilities
March 2013
Although some respondents felt the UK nuclear industry has a good reputation internationally others worried that the absence of recent new build experience would have a damaging effect on international perceptions. There was a
general view that foreign competition was strong in particular for all manufacturing activities and UK firms will face significant challenge from overseas. Mechanical and electrical class 1 components will face strong
competition as knowledge of foreign quality assurance regimes and how to adapt them to the UK regulatory requirements is essential.
It was further noted that nations with an established nuclear programme offering their own technology can set-up standardised supply lines realising economies
of scale and quality improvements through learning from experience. In the short term this is unlikely to be a viable approach in the UK. South Korea was quoted as an example. The general consensus from all respondents is that a significant
opportunity is available for UK suppliers but action is required urgently to realise this opportunity. It was felt that if action is not taken then the development of nuclear new build could lead to overseas suppliers gaining a foothold in the UK
which could further erode the competitiveness of the indigenous supply chain.
There was general agreement on what components the UK could and could not deliver:
Civil engineering: It was reported that there was enough civil engineering capacity (although they could perhaps be brought into the process early).
The Olympics experience was cited as evidence that the UK civil engineering sector could deliver. Though it was stated that "we have to show the nuclear throughput is there and therefore continuous demand to
ensure engineering careers are credible, stop the brain drain to the city and overseas".
Pumps and Valves: It was felt that the UK was well placed to deliver and export components like small pumps and valves outside the nuclear island.
Regulation: It was noted by several respondents that the UK's regulation is
world class and highly respected. Consequently, they felt there were export opportunities in this area specifically in new-to-nuclear countries setting up their own regulatory authorities.
Decommissioning: Feedback from the consultations suggests that UK
decommissioning is a unique offering. The UK is considered to be ahead of, and have a greater capability than overseas competitors. Since UK land is at a premium, nuclear plants are sited relatively close to residential
locations; the UK has learned the importance of stakeholder management, the socio/economic issues and how to reassure the public on new build and decommissioning. It has also developed technical expertise in delivering
novel solutions for the complex issues associated with post operational decommissioning and subsequent clean up.
Research into Small modular reactors (50 - 600MWe): The opportunities presented by the small modular market was recognised by respondents

20
The economic benefit of improving the UK's nuclear supply chain capabilities
March 2013
and some thought it could be an opportunity for the UK but they expressed uncertainty in how to realise this opportunity without access to a vendor.
Skills: The UK's training capability was perceived as being strong. It was reported that universities were gearing up for the nuclear new build
programme. It was also reported that the well-established education and training products could be exported to international markets and that there is potential to enhance distance learning capability to support such
initiatives.
Many felt that there was an intrinsic link between nuclear research and the higher level skills required to sustain the industry. Some felt this research was hidden in academia and industry was not incentivised to invest in
research. There was a general feeling however that research was an essential component in any skills strategy.
It was noted by many that Mechanical and Electrical engineering skills for the conventional island have similar requirements to other energy industry
skills (e.g. combined cycle gas turbine generation) and skills could be brought into the nuclear sector from these related sectors. However, it was also suggested that there is also a risk from this transferability in skills in
that people could easily move from the nuclear sector to related sectors and a perceived lack of progress in developing the nuclear sector was likely to stimulate this effect.
Respondents did note that the supply chain has an aging profile and steps
need to be taken to ensure nuclear is seen as a career path with a bright future. However, some respondents felt that the skills ‘map’ was fragmented. They felt labour market intelligence reports are insufficient in
enabling the supply chain to understand the sector skill requirements. It was suggested that this needs to be simplified so that it is clear what skills are required and how to engage in education and training.
Control and Instrumentation: It was felt that supply of control and
instrumentation outside the nuclear island had potential for the UK supply chain. It was noted that the UK has a reputation for developing bespoke solutions and has a world leading position in verification of safety critical
software (e.g. static analysis tools).
Turbine Generator (TG): The large TGs in modern nuclear plants are not seen as a viable offering for the UK's supply chain. However, there is scope to supply smaller elements of the TG to realise some of the £700m per
plant. Specifically, it was felt that the UK should target those elements where transportation costs make it beneficial to manufacture in country (e.g. earthing mat, connections for transmissions, etc.).
Fuel Cycle: It was felt that he UK has an international reputation and
experience in the complete fuel cycle (mining excluded) with extensive materials knowledge, expertise and capability. Specifically, fuel manufacture is of significant interest. According to respondents, EU
competition rules and limited capacity at European plants could create an

21
The economic benefit of improving the UK's nuclear supply chain capabilities
March 2013
opportunity for the UK. Westinghouse’s Springfields site near Preston is a large site with decommissioned areas readily available for regeneration. It was noted that the UK has the most advanced Centrifuges in the world at
Urenco’s enrichment facility at Capenhurst. It was commented that "others are literally a decade behind". However, it was stated that unless the UK capitalises on this advantage now, other nations would catch-up and the
UK’s position could be eroded.
Architect Engineer: It was felt that the UK is well placed to provide regulatory and licensing support due to its long history of involvement in whole nuclear life cycle. It was noted that the UK has no technology bias so
has developed extensive capabilities that can be used to support programme development regardless of technology. This experience enables the UK to undertake licensing support activities, develop safety
management arrangements for a variety of nuclear plants and nuclear site licensees including peer review of nuclear safety cases. This experience covers the whole life cycle including new build, operational plant and
decommissioning.
The consultation exercise found that the UK nuclear supply chain does not need national R&D programmes to develop the capability required to deliver the next phase of nuclear new builds in the UK. However national R&D was seen as an
important area of activity if the UK supply chain is to be successful in the export markets. It was stated: "if the UK has no R&D strategy/programme it sends the message that we are not serious about nuclear and [developers] will
look to other nations to fill the capability gaps." Although several areas were cited as potential areas for national R&D programmes two significant areas were highlighted:
decommissioning technology; and
Generation IV reactor design.
Decommissioning is considered by many respondents as a particular
strength where UK companies have been able to develop unique solutions to complex decommissioning problems. Furthermore, there was felt to be significant export potential in marketing the UK’s decommissioning skills. It was
thought that relatively minor investment in this area could stimulate significant opportunities for the UK.
Traditionally UK technology has been based around gas-cooled reactors and to some extent small pressurised water reactors for naval application. The move to
PWR technology for Sizewell B represented a move away from indigenous development to imported technology. The current new build programme will continue to be based on imported technology but there are strong signals that a
new generation of reactor technology will be developed which further enhances safety and meets demands for energy diversification towards a hydrogen based
"If we [the supply chain] invest in R&D we could be a world leader" (private sector respondent).
22
The economic benefit of improving the UK's nuclear supply chain capabilities
March 2013
economy. In addition there is the prospect of reactors being deployed in remote locations where small modular reactors will dominate.
Potential Generation IV technologies include high temperature gas reactors where the UK’s heritage in gas-cooled reactors could play a part and the move
to small modular reactors could find an application for elements of naval reactor technology in the civil market. This could create an opportunity for the supply chain, although the UK does not have an indigenous civil reactor designer and
this could limit the overall potential of this sector. However, it was suggested that this should be a target for international collaboration to jointly develop new technology with overseas reactor vendors.
The House of Lords Select Committee on Science and Technology: Nuclear
Research and Development Capabilities, stated "The real opportunity would be taking a lead now in development of some of the technologies for future systems, so that the UK had an exportable technology in two, three or four
decades time and could take advantage of the £1.7 trillion of investment worldwide in these technologies". To realise the commercial benefits "it is necessary to ... produce products that contain new technology and intellectual
property both in... design and manufacture". Critically it was noted "that this could be achieved through either a UK vendor of reactors (which the UK doesn’t have) or UK industrial involvement in the design stage of an international
reactor".
Respondents recognised this opportunity but felt that significant leadership was required from Government to define a national R&D strategy and coordinate the overall response. They pointed out that it is difficult to justify
investment in Generation IV R&D as the returns are many years away. The House of Lords report section on Building a framework to promote commercial exploitation stated "At present, the Technology Strategy Board does not have
the remit to fund work that is so far away from market. This means there is a gap for applied long-term research within the current bodies that fund, or conduct research".
Without a clear steer from Government on long-term energy policy direction,
industry is reluctant to invest. Government would need to intervene, if they wanted to create a strong and vibrant UK industry because the timescales and returns are so long there are clear market failures. The industry view is
that Government need to decide whether they wish UK industry to take a co-ordinated approach to developing this high technology, high value export market, and provide a signal to allow it to do so.
The example above illustrates how nuclear is a long-term investment, whether in
commercialisation of decommissioning technology or Generation IV technology. The French example (see the Case Studies section) shows how a coordinated approach specifically in managing R&D and education programmes provides
dividends that can only be appreciated in the future.
Many respondents felt that action was required now to define the national strategy and provide the required coordination. Some respondents

23
The economic benefit of improving the UK's nuclear supply chain capabilities
March 2013
expressed deep frustration at the lack of visible progress on some initiatives they had been invited to assist with and felt that clear ownership and accountability was required for delivering against defined targets.
Whilst some believe that Government have to take the lead on strategy, others
cited that an industry body such as the National Skills Academy Nuclear should lead on co-ordinating this. To quote ‘we should use the industry sponsored body – NSAN – they are best placed to understand the attrition issues and manage,
grow and sustain knowledge, this would de-risk the programme.’ The skills academy and NAMRC collaboration was cited as an example of how it should work. The recent expansion of the NSAN Manufacturing is co-ordinating efforts
with the NAMRC, developing the training programmes to provide the ‘nuclear delta’ for the manufacturing sector; a hub that takes everyone to the same place.
However, some academics are opposed to any central co-ordination (even by an HE establishment). Nevertheless, most respondents did believe that
simplified co-ordination and transparency of R&D and education & training programmes would be valuable.
Finally, it was felt that that key components on the Nuclear Island will not be in the UK’s reach because the manufacturing facilities are not available.
Entry to this market requires a significant learning curve and the economies of scale do not support the required investment in capability. For all nuclear island components, the quality requirements, specifically code compliance, were
perceived by some to be a barrier for many UK companies. However, this was disputed by others who felt that the UK capability was being understated and did not reflect the current position in related nuclear sectors such as
decommissioning and naval reactors.
2.2 Barriers to entry
There was a strong perception that there are currently a number of barriers stopping new firms from entering the supply chain.
Given the nature of the work it was reported that 'new-to-nuclear' companies lack a ‘nuclear culture,’ for example, the knowledge of nuclear regulation and
quality requirements. There is also a perceived lack of nuclear safety appreciation in new to nuclear suppliers.
New entrants need to appreciate some of the subtleties in the nuclear sector specifically in business development activities. It was reported that a
key difference in the nuclear sector is the time required to get on bid lists and this is only possible after an appropriate response to the ‘initial request for information’. It was evident that some business development activities can be
expensive and it may take years before contracts are realised and turnover affects the ‘bottom-line’. The bid development cost may prohibit smaller companies from entering the nuclear sector individually.
There are a number of barriers restricting capability and growth in the sector.
24
The economic benefit of improving the UK's nuclear supply chain capabilities
March 2013
Relationships within the nuclear supply chain have been built up over years. It was felt that clients tend to stick with suppliers they trust and already know to minimise the risk in supply, especially where quality is the primary
requirement. Perception issues are difficult to break in the industry, effectively acting as a barrier to entry. For smaller companies it may be necessary to either partner with a larger company or become a preferred lower
tier supplier to become involved in the nuclear programme.
2.3 Barriers to expansion
Some companies with established relationships expressed frustration at the difficulty of moving contracts forward. There is experience of contracts being ‘awarded’ for decommissioning projects where the funding is subsequently not
released. Suppliers find themselves in a position of gearing up for a contract and having to stand down or reallocate resources. Experience of this type results in displaced personnel, who are moved onto other projects or into other sectors, in
the latter case perhaps lost to nuclear completely.
It was reported that specification of what the Site Licence Companies (SLCs) and the higher Tiers want from the supply chain is currently very poor; there is an inability to articulate requirements. Discussions explored why the sector
has difficulty in specifying requirements. One possible influence is the non-prescriptive UK regulatory framework. Whilst SLCs demonstrate how site licence conditions are met it is bespoke to that licence. The approach is not ‘one-size-
fits-all’; a level of responsibility and accountability for the output is expected. The intelligent customer anticipates an intelligent supply chain, the expectation that the nuclear culture is understood and that development of a solution will be
executed with this appreciation.
It was stated that some staff involved in procurement may not be expert in the areas they are procuring and are reliant on specification of technical requirements by others in the supply chain. Relationships at the operational level
may develop whereby the closeness of a work arrangement facilitates trust and supplier understanding of the client and how to clarify a specification. Whilst this may mitigate issues when a relationship is established, it also creates a reliance
on a single source supply mentality that is an effective barrier to entry for other suppliers.
Some respondents felt that developers’ specifications did not fully define how international design standards would be adapted for use in the UK
and the supply chain was being used to develop this understanding through the bidding process. Some viewed that this acquired knowledge may be used to enable preferred suppliers to develop their own understanding of the UK context.
There was recognition that international partnerships may be a solution to this but some respondents felt that more help and guidance was required to establish these relationships.

25
The economic benefit of improving the UK's nuclear supply chain capabilities
March 2013
Some respondents felt that the UK may no longer be capable of producing safety critical equipment. Understanding the importance of quality in manufacturing safety critical items especially that the demonstration of quality
extends beyond the build phase and has through life implications, was seen as an important prerequisite for success. As a result it was reported that companies must have the necessary quality and audit systems in place and demonstrate a
real appreciation of the need to support nuclear installations from ‘cradle to grave’. Crucially companies need to demonstrate at the senior level that understanding of the safety culture will be a key differentiator. However, it was
also noted that not all of the new build components are safety critical and these can readily be supplied by the UK supply chain.
Some reported that although the UK is recognised for its innovative engineering, the nuclear industry is slow to adopt new technologies preferring to rely
on what they know and trust. There appears to be little evidence of knowledge transfer from related sectors into the nuclear sector. Furthermore, it was suggested that nuclear knowledge is often invested in individuals rather
than in a systematic or standardised approach.
There was significant concern from supply chain respondents that the upfront cost required to enter the nuclear sector was prohibitively high. The need for this investment was understood but many felt that it would be impossible to
present a sound investment plan given the uncertainty surrounding the future workload. Fundamentally it was felt that there was no guarantee of repeat business to support recovery of investment over a number of builds. The
requirement for capacity to be delivered by private investors caused concern that investment could suddenly be terminated. Overall it was considered that there was insufficient confidence to invest given the uncertainty around
the scale and timeframes of a new build programme.
2.4 How to address barriers
The consultation exercise found that engagement of the supply chain by developers was done too early in the process as vendors had started to prepare the supply chain as early as 2007. The impact of Fukushima, the subsequent
stress test exercise and the sale of Horizon Nuclear Power all delayed placing orders. Consequently, the supply chain’s expectations were raised too early and faith in the new build programme has been eroded.
It was reported by most that the commitment by Government to the new
build programme needed to be maintained. In addition, a clear demand stream needs to be demonstrated if UK firms are to justify their internal investment decisions. “If we don't take it then China will, and it won't be as easy
to step back in". It was clear that those we spoke to felt that the UK has a real opportunity to be seen as an expert in nuclear technology; to grow this capability and expand into other countries.

26
The economic benefit of improving the UK's nuclear supply chain capabilities
March 2013
When asked what the UK could do to increase its share of the new build supply chain, respondents reported a range of measures (though it was not always clear whose responsibility they would be):
Educating suppliers on how to respond to Requests for Information by Tier
1 companies – making suppliers aware how important this process is. The Nuclear Advanced Manufacturing Research Centre (NAMRC) has modelled this for the manufacturing sector and lessons can be learned from this
initiative; there is potential for an NSAN provider to develop a training programme to deliver this;
Use current nuclear skills to up-skill others, and use capability effectively in knowledge transfer for technical, regulatory, safety skills etc. This action
resides with the National Skills Academy Nuclear;
Making potential suppliers aware of opportunities and who they should be communicating with in the nuclear industry;
Giving suppliers clear indication of the value of components in the supply chain and what is benefit to suppliers;
Clear signals of the scale of the programme e.g. how many reactors/plants;
suppliers will be more willing to invest and compete for business where there is a long term opportunity; "transparency is everything";
Government could offer some relief to invest in nuclear new build and continue to support training in nuclear-related skills such as through the
Employer Ownership of Skills funds programmes;
Supply chain companies will gain nuclear experience by supporting current nuclear programmes. Delivery of a more effective resourcing/procurement strategy in existing programmes (e.g. decommissioning) will better enable
entry to market. It was felt the NDA should take the lead on this;
Support for partnering programmes, perhaps training or facilitation. The UK and foreign markets could benefit from collectives of the right composition, marrying the right nuclear skills familiar with the technology with in-country
new-to-nuclear suppliers. Respondents reported that there is evidence that this approach works; and it was noted that the major civil engineering contract for Hinkley is a partnership between a French and UK company;
and
Promotion of the UK as a centre of excellence. It is currently perceived as a nation that ‘used to do nuclear’ which is felt by many to be unfair. Sizewell B was the best new build in terms of time, cost and quality and the UK
could capitalise on this experience. The Foreign and Commonwealth Office commissioned the National Skills Academy for Nuclear to produce an education and training directory in 2012, and it was queried whether there
is potential to produce a generic UK capability directory through the Skills Academy.
"There is a clear opportunity for the UK to become a leader in nuclear" (a nuclear industry body respondent)

27
The economic benefit of improving the UK's nuclear supply chain capabilities
March 2013
3 International case studies
This section discusses the nuclear supply chain in different economies. These
international case studies draw out lessons for the UK. They also discuss how their approach to nuclear supply chain has affected economic development and how much (if any) of their supply chain has been provided by UK companies.
Figure 3.1 provides an overview of the approach used in this section.
Figure 3.1: Our approach to the case studies
Adopting the approach outlined above we identified a short list of seven possible case studies. Table 3.1 provides a brief summary of their applicability to the UK.
Table 3.1: Shortlist of possible case studies
Country Applicability
France Similar nuclear pedigree to UK but continued investment in the
last 25 years.
Significant internal supply chain and very ambitious export
ambitions.
USA Similar nuclear pedigree to UK.
Privatised nuclear utilities and a similar approach to investment
over the last 25 years.
Russia Large nuclear infrastructure with state owned nuclear industry.
Specific focus on exporting nuclear technology.
Filter 1: Leading Practice identify cases that are deemed leading practices
Filter 2: Relevance to UK Nuclear New Build – Shortlist candidates according to relevance to UK NNB
Filter 3: Action Applicability Select cases with lessons that are applicable to UK NNB
28
The economic benefit of improving the UK's nuclear supply chain capabilities
March 2013
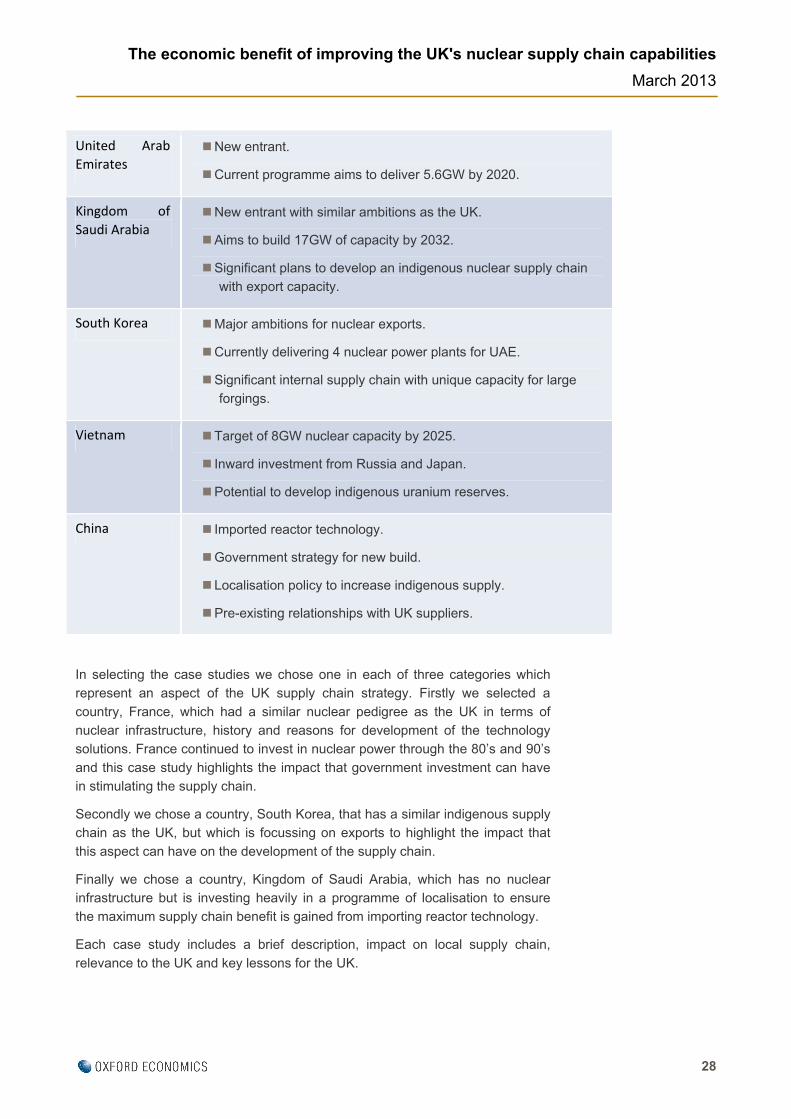
United Arab
Emirates New entrant.
Current programme aims to deliver 5.6GW by 2020.
Kingdom of
Saudi Arabia New entrant with similar ambitions as the UK.
Aims to build 17GW of capacity by 2032.
Significant plans to develop an indigenous nuclear supply chain
with export capacity.
South Korea Major ambitions for nuclear exports.
Currently delivering 4 nuclear power plants for UAE.
Significant internal supply chain with unique capacity for large
forgings.
Vietnam Target of 8GW nuclear capacity by 2025.
Inward investment from Russia and Japan.
Potential to develop indigenous uranium reserves.
China Imported reactor technology.
Government strategy for new build.
Localisation policy to increase indigenous supply.
Pre-existing relationships with UK suppliers.
In selecting the case studies we chose one in each of three categories which represent an aspect of the UK supply chain strategy. Firstly we selected a
country, France, which had a similar nuclear pedigree as the UK in terms of nuclear infrastructure, history and reasons for development of the technology solutions. France continued to invest in nuclear power through the 80’s and 90’s
and this case study highlights the impact that government investment can have in stimulating the supply chain.
Secondly we chose a country, South Korea, that has a similar indigenous supply chain as the UK, but which is focussing on exports to highlight the impact that
this aspect can have on the development of the supply chain.
Finally we chose a country, Kingdom of Saudi Arabia, which has no nuclear infrastructure but is investing heavily in a programme of localisation to ensure the maximum supply chain benefit is gained from importing reactor technology.
Each case study includes a brief description, impact on local supply chain,
relevance to the UK and key lessons for the UK.

29
The economic benefit of improving the UK's nuclear supply chain capabilities
March 2013
3.1 French Nuclear Industry – Continued investment over the last
25 years
3.1.1 Description
From the Second World War, France embarked on a nuclear development, similarly to other nations initially for military purposes and then developing a civil
capability. France’s nuclear industry’s organisation is still heavily based upon the structures created at this key period; the Commissariat à l’Énergie Atomique (CEA – Atomic Energy Commission) was set up in 1946, and was charged with
overseeing the research and development, up to the industrial stage, of all the processes necessary for the military programme and subsequently for nuclear electricity generation. . A branch of the public research body CEA was created to
manage all its industrial activities, mainly through the Compagnie Générale des Matières Nucléaires (Cogema – General Company for Nuclear Materials), a private company set up in 1976. In 2001 this merged with Framatome, the
nuclear reactor builder, to create the Areva group. Electricité de France (EDF), a company also established in 1946 by the nationalisation of the numerous state and private companies that existed at the time, with responsibility for overseeing
the development of the electricity supply across the country.
In 2005–06 EDF ceased to be a public enterprise entirely controlled by the State and was privatised, although the State retained a controlling share. The first nuclear reactors operated by EDF from the end of the 1950s were natural
uranium/graphite/gas (UNGG). These reactors, as well as several industrial-scale prototypes tested as part of the development programme during the 1960s; these have now been shut down and are being dismantled. In 1973 the
French authorities opted for a massive development of the pressurised water reactor programme, using low enriched uranium.
The French nuclear industry has endeavoured to control all stages of the nuclear process however, the last uranium mine closed in 2001. The various stages of
uranium conversion are carried out for primarily at Pierrelatte/Tricastin, where in 1976 France also established an enrichment plant, Eurodif; the manufacture of enriched uranium oxide fuel (UOX) is carried out in the FBFC factory at
Romans-sur-Isère.
3.1.2 Summary
France delivers over 75% of its electricity from nuclear energy. It has a well-established nuclear industry. Its aim is to ensure energy security through
indigenous generation. This has led to significant public purse investment in the nuclear industry with a mix of public owned organisations (e.g. CEA ), private companies with majority government shareholding (e.g. Areva and EDF) and
private listed companies (e.g. Assystem, Aosys, etc.). The direction and development of the industry is thus heavily influenced by government policy.
France is currently building one Gen III reactor at Flamanville and is also building in Finland, China and the UK. Traditionally it has exported its reactor
Similar nuclear pedigree to the UK, but continued investment in the last 25 years.

30
The economic benefit of improving the UK's nuclear supply chain capabilities
March 2013
designs to a number of countries would-wide. It invests in significant research and development and is developing Generation IV reactor technology. It has no indigenous uranium reserves but is a major producer of nuclear fuel for internal
use and export. The international thermonuclear experimental reactor (ITER) is being built at Cadarache in southern France. This has resulted in large inward investment from a consortium of countries world-wide.
France has a well-established fuel reprocessing capability and has
decommissioned a number of its old reactor sites.
3.1.3 Impact on the supply chain
The supply chain in France is robust and capable of supporting its own new build programme and the export market. It has two nuclear plant manufacturers,
Areva and DCNS (naval plant). Areva subsidiary, SFARSTEEL has a large nuclear forging capability at Creusot Forge. There are a wide range of nuclear suppliers providing a fully integrates nuclear supply chain. Such providers
include specialist boiler tube manufacturers (Valinox and PCVS), turbine –generators (Alstom), maintenance systems (COMEX) and many more.
The French nuclear supply chain has been sustained through significant investment directed through EDF and CEA and is stimulated by a Nuclear Policy
Council that has the ability to set the strategy of the key nuclear companies on matter such as international cooperation (e.g. with Japan and China) and internal collaboration (such as EDF, Areva and GDF) on the design of new
systems.
3.1.4 Relevance to the UK
France and the UK started their respective nuclear industries at a very similar time and starting place. By the mid 1980’s it could be argued that both countries
had a very similar level of capability and could be seen as equals in the marketplace. However, from the mid 1980’s the levels of investment in the French industry far exceeded the UK levels which became largely stagnant with
a small amount of “Keeping the Nuclear Option Open” funding to maintain the skills base and infrastructure at a minimum sustainable level to ensure continued confidence in the safe operation of the UK’s plants.
The French switch to PWR technology occurred well before the UK. The
difference in policy on public investment in nuclear research, design and construction has resulted in the French nuclear players having a strong global presence and being seen as market leaders. The UK’s move towards private
finance and reliance on a gas cooled technology can be seen in retrospect as a significant blocker to potential international sales.
However, the UK’s indigenous supply chain has been sustained over the last 25 years by continued investment in naval reactors and the Astute programme has
been instrumental in this. Since the cancellation of further civil PWR plant in the mid 80’s twelve naval PWRs have either been completed or ordered and this has enabled manufacturers to remain viable albeit at the minimum level of
Significant internal supply chain and export ambitions.

31
The economic benefit of improving the UK's nuclear supply chain capabilities
March 2013
sustainable investment. Whilst naval reactors do employ PWR technology, the relatively small size and restrictive US technology transfer agreements limit the export potential from this source.
3.1.5 Lessons for the UK
There are number of lessons for the UK:
The naval and civil reactor industries are often viewed as separate and to
some extent unrelated from a government policy perspective. However,
the timeline of the UK nuclear industry has clear interactions between the
two, particularly from a supply chain development point of view.
The UK nuclear supply chain grew from investment in reactor technology
to develop nuclear weapons, then into civil reactors, then submarines, a
new generation of civil reactors and finally more investment in a new
class of submarine. Without this synergy the UK supply chain would not
have been sustainable. Therefore it is worth thinking about this
interrelationship in developing the future plan for the UK nuclear supply
chain.
As the focus moves back to the development of new civil (imported)
reactor technology in the UK it may be felt that a UK presence in the
future market is not viable. However, new submarine reactor designs are
being developed by Rolls-Royce and whilst a viable Gen III PWR offering
is not available, there is the possibility of a significant offering for the Gen
IV designs or fusion reactor technology. However, that would require
significant investment in research and development, together with
possible overseas collaborations.
A clear UK strategy (similar to the French nuclear policy council) for Gen
IV and fusion that links together the defence and civil ambitions would be
useful to set the scene for supply chain development over the next 10-20
years.
3.2 South Korea – Focus on exports
3.2.1 Description
South Korea currently delivers one third of its electricity from nuclear energy. Its
aim is to increase this to 60% by 2030. Initially South Korea imported technology through agreements with US supplier Combustion Engineering (later acquired by Westinghouse). It standardised on a single technology and has
since started to evolve a Korean variant of the System 80+ design which it is now marketing internationally. Whilst Westinghouse retains some interest in this design, the Korean content will continue to increase as will its ownership of the
design IP. It should shortly be free of foreign IP in its designs.
Major ambitions for nuclear exports.

32
The economic benefit of improving the UK's nuclear supply chain capabilities
March 2013
South Korean policy is to achieve exports of 80 power reactors worth $400 billion by 2030 (20% of the global market). The $20 billion contract to supply 4 reactors to the UAE is the first export success.
3.2.2 Impact on the supply chain
South Korea has developed an indigenous nuclear supply chain and now manufactures fuel, although reprocessing and enrichment are not permitted under international agreements.
Doosan Heavy Industries is one of the world’s largest manufacturers of nuclear
components and recently installed the world’s biggest press capable of forging the largest pressure vessels. This makes it highly sought after and has a number of international contracts. Doosan was developed under Government control
with high levels of public investment. Privatised in 2001 it is one of the world’s leading nuclear construction companies.
Hyundai is a key player in the construction of nuclear power plants, being responsible for all builds in Korea and now involved in overseas projects such as
the Baraka nuclear project in the UAE.
3.2.3 Relevance to the UK
Although South Korea was not a nuclear nation it did have a manufacturing capability, which was built and developed after the Korean war. The country has
no large natural reserves of energy making the decision to adopt nuclear a national imperative for security of supply and the ability to industrialise and improve living standards. The UK is at the other end of this spectrum having
developed and operated its own design of nuclear power plant for 60+ years it has slowly de-industrialised and now relies on imported technology. The UK Energy Act identifies the need for diversity and security of energy as North Sea
oil and gas diminishes and coal is reduced because of emissions.
The Korean model has been to slowly develop their indigenous design, construction, manufacturing and operations capabilities and capacity by engaging with international collaborative research and development
programmes, strategic partnering with nuclear manufacturers e.g. Westinghouse (Fuel Assemblies, Reactor Coolant Pumps and Man Machine Interface Systems) and small evolutionary steps to improve capability. Their focus has been from
receipt of the technology, via a turn-key contract, to establish, develop and become self-sufficient in nuclear technology, with the benefit that exporting it may become an option.
The careful targeting of knowledge transfer opportunities, both physical
(manufacturing) and intellectual (design) has seen a growth of indigenous content from the use of unskilled labour, low value goods and services (cement, rebar) to exporting their own fully supported design to another country.
Significant internal supply chain, with unique capacity for large forgings.

33
The economic benefit of improving the UK's nuclear supply chain capabilities
March 2013
3.2.4 Lessons for the UK
There are number of lessons for the UK:
Develop a realistic value chain capture strategy which capitalises on the
current in-country manufacturing and intellectual capabilities and
capacity;
The adoption of nuclear technology is a strategic initiative which requires
a national perspective e.g. Determining what educational, training and
infrastructural changes and alterations are required;
Make use of the current manufacturing base and partner with the reactor
vendors to offer shorter supply lines, additional capacity and access to
niche manufacturing or design;
Develop a sound functioning internal market which has credibility on the
national and international stage before trying to export.
3.3 Saudi Arabia – From a standing start
3.3.1 Description
The Kingdom of Saudi Arabia has no indigenous nuclear programme and has
traditionally been reliant on oil for its electricity. It has adopted a policy of investment in alternative, sustainable energy sources to protect its reserves of oil and help it to industrialise its infrastructure. This investment is of strategic
importance and an integral part of the Kingdom’s plans for long-term energy security and prosperity.
Implementing this strategy, through the development of Atomic and Renewable energy sectors will require new and / or enhanced skills and capabilities. These
will include appropriate scientific, technical, managerial and leadership skills that will need to be developed across the Kingdom. These skills and capabilities will need to be focused on the long-term sustainability of both sectors (along with
their associated supply chains) as well as promoting energy efficiency across the Kingdom.
3.3.2 Impact on the supply chain
The Kingdom is investing $80 billion in developing 17GW of nuclear capacity by
2032. This investment is also intended to produce side benefits of up skilling the workforce and developing an industrial infrastructure. There is no intention to establish a nuclear export capability but the newly developed industrial base will
be well placed to tender for major manufacturing contracts to support other nuclear developers.
A new city, the King Abdulla City for Atomic and Renewable Energy (KA-CARE) is to be developed and this will provide the platform for growth in this sector.
New entrant with similar ambitions as the UK, aiming to build 17GW of capacity by 2032.

34
The economic benefit of improving the UK's nuclear supply chain capabilities
March 2013
There are plans to develop a significant research and development programme to underpin the growth in skills supported by education and training.
3.3.3 Relevance to the UK
The development of the UK’s nuclear industry was a publically funded activity
with a clear aim to develop indigenous capability, driven by national security requirements. The Kingdom of Saudi Arabia intends to adopt a similar approach to the development of its nuclear industry, albeit driven by socio-economic
factors rather than national security.
The Kingdom of Saudi Arabia has, like the UK, a well-developed oil and gas industry and supply chain which has operated for a considerable time. It is currently experiencing large growth in its energy demand and is slowly using
more of its exportable product for internal use. Oil and gas producers are very commercially aware companies that make investments to secure resources whether they are human (intellectual) or physical (manufacturing and
exploration). This is not always conducive to the host country’s requirements for providing long-term high-end educational and commercial opportunities for local people and supply chains. This business approach means that resources are
procured on the international market where there is provenance and credibility to deliver.
3.3.4 Lessons for the UK
There are number of lessons for the UK:
The Oil and Gas industry is used to working in a regulated environment,
similar to nuclear, where specific safety and performance standards must
be demonstrated, thus enabling skills to be drawn across from this sector;
Changing the energy mix in a carbon based economy is a bold and
strategic step that requires careful planning, investment and political
engagement and support;
Alignment between commercial and national aspirations is difficult to
achieve and can be a serious threat to national strategies for skills and
industrial development.
The UK is currently projecting a significant nuclear skills gap that could be
exacerbated if overseas nuclear programmes are seen as preferable to
the UK for career and financial reasons’.
Significant plans to develop an indigenous nuclear supply chain with export capacity.

35
The economic benefit of improving the UK's nuclear supply chain capabilities
March 2013
4 Economic impact of nuclear new build – gross impacts
Oxford Economics developed a bespoke economic impact model to measure the
value of the nuclear new build programme captured by the UK supply chain and the impact on the UK economy in terms of output, GVA and employment.
Two potential profiles for the UK new build programme were modelled: one delivering 10GW by 2030 and another delivering 16.5GW by 2030. In addition,
two indicative scenarios around the UK supply chain’s share of new build activity were examined, one based on current UK supply chain capabilities (Scenario A) and one based on views about the potential for the UK to increase its share due
to policy intervention and actions taken by organisations and firms involved in new build (Scenario B).
The scenario assumptions on the UK share of activity were informed by the consultations undertaken for the study, a review of relevant literature on the UK
nuclear sector and by utilising the expertise of Atkins. Overall the view presented shows the UK capturing 44% of the cost of a single nuclear reactor in Scenario A, rising to 63% in Scenario B. Assumptions on reactor costs are consistent with
estimates published by DECC.
The estimates reported in this chapter are “gross impacts” of nuclear new build, in the sense that they do not take into consideration the fact that new build activity may displace other economic activity in the UK economy and thus the
“net impact” is likely to be smaller.
Key findings:
The direct gross impact of the 10GW programme captured by the UK is
an estimated £15.4 billion in Scenario A in cumulative terms from 2012-
2030 (2012 prices, undiscounted). This generates GVA (gross value
added) of £6.8 billion over the period, with associated direct gross
employment of 86,500 job years10.
Accounting for supply-chain effects in the wider UK economy (indirect
effects) and consumer spending effects of those employed by new build
(induced effects), the gross output impact of the 10GW programme in
Scenario A rises to £35.9 billion, gross value added rises to £16.6 billion
and the employment impact increases to 265,000 job years.
Under the 10GW programme achieving Scenario B means direct output in
the nuclear supply chain captured by the UK is an estimated £4.4 billion
higher than under the Scenario A. Direct value added in the supply chain
captured by the UK is £1.9 billion higher and there are an additional
10 One job year is defined as one person in employment for one year.

36
The economic benefit of improving the UK's nuclear supply chain capabilities
March 2013
19,600 direct job years. Accounting for multiplier effects (indirect and
induced) the additional impact of Scenario B on gross output, GVA and
employment are £10.5 billion, £4.7 billion and 67,200 job years
respectively (all figures additional to Scenario A);
The direct impact on gross output of the 16.5GW programme captured by
the UK is an estimated £25.5 billion (2012 prices, undiscounted) over the
period 2012-2030. In GVA terms the direct impact is worth £11.4 billion,
with associated direct employment of 144,600 job years.
Accounting for multiplier effects (indirect and induced) the total impact of
the 16.5GW programme on gross output rises to £59.7 billion, with
associated GVA of £27.6 billion and an employment impact of 444,000
job years.
Achieving Scenario B under the 16.5GW programme results in direct
gross output being £9.1 billion higher than in Scenario A. Direct GVA is
£3.8 billion higher and there are an additional 42,000 gross direct job
years. Accounting for multiplier (indirect and induced) effects, gross
output, GVA and employment are £21.4 billion, £9.7 billion and 143,000
job years higher respectively in Scenario B relative to Scenario A.
This chapter provides gross estimates of the economic value of UK nuclear new build activity that could be secured by the UK supply chain. These estimates are
“gross” in the sense that they do not take into consideration the fact that nuclear new build activity may displace other economic activity in the UK economy and thus the “net” impact is likely to be smaller. Estimates of net impacts, accounting
for displacement effects, are reported in Chapter 5.
Two views of the potential value of nuclear new build are presented:
Scenario A: This represents a “lower” scenario based a view of how much the UK nuclear supply chain could potentially capture at present; and
Scenario B: This represents an “upper” view of how much the UK supply chain could potentially deliver.
We provide estimates for both a single reactor and two possible new build
programmes:
A 10GW by 2030 new build programme; and
A 16.5GW by 2030 new build programme.
Under our modelling we make no assumptions around which of these new build programmes (10GW or 16.5GW) is more likely to occur.
Our modelling assumptions are based on the consultation findings, a review of existing evidence/studies and our own experience and have been independently reviewed.

37
The economic benefit of improving the UK's nuclear supply chain capabilities
March 2013
4.1 How does the model work?
Oxford Economics developed a bespoke economic impact model to measure the
value of the nuclear new build programme captured by the UK supply chain and the impact on the UK economy in terms of output, GVA and employment. This section presents the methodology and results relating to the “gross” impact of
nuclear new build. The key components of the model are:
The cost (i.e. value) of a single reactor split by component or activity type (e.g. plant equipment, construction) and associated timelines;
The profile of the new build programme in terms of the number of reactors and a timeline of development/construction;
The estimated share of the programme delivered by the UK supply chain
under Scenario A and B split by component and activity type. This provides an estimate of the value of nuclear new build to the UK, equivalent to the impact on UK gross output;
Gross Value added (GVA) and productivity assumptions to convert the UK-
delivered part of the programme (i.e. gross output) into estimated GVA and employment impacts; and
Input-output modelling based on the ONS’ 2005 UK Input-Output tables to enable estimation of indirect and induced benefits across the UK.
The assumptions and results of the modelling are reported in the following
sections, showing the estimated contribution of indicative 10GW and 16.5GW new build programmes to the UK economy under Scenarios A and B. A more detailed discussion of the methodology can be found in Annex A.
Range of results and interpretation
The results presented in this section represent two possible views of the
impact of nuclear new build on the UK economy. The first, Scenario A, is a
view based on estimates/assumptions around current UK capabilities. The
second, Scenario B, is based on informed considerations of how much more
the UK could capture by improving current capabilities.
The assumptions embedded within Scenarios A and B on the UK share of
activity have been based on consultations with industry experts, a review of
existing studies on UK capabilities (e.g. by the Nuclear Industry Association)
and Atkins’ own expertise. They have also been agreed with a nuclear
industry expert, BIS and DECC. Nevertheless, it is just one view of potential
UK activity and we recognise it is no more or less valid than other informed
views which various industry groups and participants may hold. It is also
acknowledged that the nuclear consortia which have set out plans for new
build in the UK may set voluntary ambitions or targets for the proportion of
the value of the plant which should be sourced within the UK. In doing so

38
The economic benefit of improving the UK's nuclear supply chain capabilities
March 2013
the subsequent value captured by the UK supply chain could be higher than
presented under the scenarios.
As such one may consider our assumptions as existing within a range
reflecting the uncertainties about the level of new build which may be
delivered by the UK supply chain. The UK share realised may be above or
below our view, however, we believe our estimates are within the range of
sensible assumptions given the information available for the study.
Similarly, there will be uncertainties regarding the economic assumptions
used to derive the economic results such as gross value added and
employment. These assumptions represent Oxford Economics’ best view
based on their professional experience and judgment, and take on board
Atkins’ knowledge of the nuclear sector. However, these economic
assumptions also exist within a range of possible outcomes.
4.2 Gross economic impacts from nuclear new build
4.2.1 Nuclear new build timelines
Tables 4.1 and 4.2 present the outlooks for the 10GW and 16.5GW new build programmes. Twin-reactor units are assumed for each plant/site. While it is recognised that different reactor technologies of variable capacity could be
deployed by developers in the UK, for the purposes of the modelling each reactor is assumed to have installed capacity of 1.65 GW (3.3 GW twin-unit plant). The development timeframes for each reactor are consistent with
independent estimates provided to DECC for the purposes of modelling electricity generation costs11, and consist of two phases:
Pre-development phase (green) lasting 5 years, capturing the categories “Pre-licensing costs, Technical & design” and “Regulatory, licensing &
public enquiry”; and
Construction phase (blue) lasting 6 years for FOAK reactors and 5 years for NOAK reactors, capturing EPC (Engineering, Procurement and Construction) and “infrastructure” costs12.
For the purposes of the modelling it is assumed that the costs of the first three
plants (six reactors) are consistent with FOAK (first-of-a-kind) costs. While
11 Parsons Brinckerhoff, Electricity Generation Cost Model, 2012 Update of Non-
renewable Technologies, DECC, 2012.
http://www.decc.gov.uk/en/content/cms/about/ec_social_res/analytic_projs/gen_costs/gen
_costs.aspx
12 Substation and overhead power lines to connect nuclear plants to the electrical grid.

39
The economic benefit of improving the UK's nuclear supply chain capabilities
March 2013
subsequent reactors (16.5GW programme only) are built at NOAK (Nth-of-a-kind) costs.
The modelled deployment profiles for the 10GW and 16.5GW new build programmes shown below are indicative only. While industry has set out plans
to develop approximately 16.5GW of new nuclear in the UK, there is uncertainty with regard to the scale, timeframe and phasing of the new build programme. These factors will determine the actual economic impact in any given year and
therefore the estimated year in which new build activity and associated economic impacts reach their peak as shown in the results below is illustrative only and determined by the assumed deployment profiles used in the modelling.
Table 4.1: New build timeline for 10GW by 2030
Table 4.2: New build timeline for 16.5GW by 2030
4.2.2 The cost of the new build programme
The UK nuclear new build programme will deliver a mix reactor types to the UK. These reactors may have different supply chain strategies and therefore the value to the UK will differ depending on the mix and number of reactors
deployed. In modelling the value of the UK's nuclear supply chain we have considered the cost (i.e. value) of an indicative reactor. We assume each reactor has a capacity of 1.65GW and is a twin-unit plant. Cost assumptions and the
pre-development and construction timescales are consistent with the broad categories contained within Parson Brinckerhoff’s Electricity Generation Cost Model. The broad categories of expenditure were broken down to provide a
more disaggregated profile of new nuclear build costs using information from a number of sources:
2009
2010
2011
2012
2013
2014
2015
2016
2017
2018
2019
2020
2021
2022
2023
2024
2025
2026
2027
2028
2029
2030
Reactor 1 FOAK
Reactor 2 FOAK
Reactor 1 FOAK
Reactor 2 FOAK
Reactor 1 FOAK
Reactor 2 FOAK
Plant 1
Plant 2
Plant 3
Source: DECC; Parsons Brinckerhoff Electricity Generation Cost Model
2009
2010
2011
2012
2013
2014
2015
2016
2017
2018
2019
2020
2021
2022
2023
2024
2025
2026
2027
2028
2029
2030
Reactor 1 FOAK
Reactor 2 FOAK
Reactor 1 FOAK
Reactor 2 FOAK
Reactor 1 FOAK
Reactor 2 FOAK
Reactor 1 NOAK
Reactor 2 NOAK
Reactor 1 NOAK
Reactor 2 NOAK
Plant 1
Plant 2
Plant 3
Plant 4
Plant 5
Source: DECC; Parsons Brinckerhoff Electricity Generation Cost Model

40
The economic benefit of improving the UK's nuclear supply chain capabilities
March 2013
consultation with industry experts;
a review of the existing literature on nuclear new build, in particular reports by NAMTEC13 and the NIA14; and
utilising the expert knowledge of Atkins and independent verification by an expert within a key industry body.
Table 4.3 presents illustrative costs of a reactor if it were entering the
construction phase at the time of writing (i.e. late 2012). The total value of a reactor (i.e. both pre-development and construction phases) is estimated to be just over £6.6 billion, based on central estimates from the Parsons Brinckerhoff
report15.
It should be noted that the total cost level are generic UK nuclear estimates based on the Parsons Brinckerhoff report and other evidence as set out above. The levels and breakdown for any particular UK project may be quite different.
We have included fuel costs as part of the capital expenditure, as an order for a reactor includes the first fuel load - therefore it will be capitalised. Subsequent fuel orders would be defined as operational expenditure.
Table 4.3: Total cost of a new reactor, £ millions, 2012 prices
13 “The Supply Chain for a UK Nuclear New Build Programme”, NAMTEC, 2009.
14 “UK capability to deliver a new nuclear build programme”, NIA, 2006/2008.
15 Parsons Brinckerhoff, Electricity Generation Cost Model, 2012 Update of Non-
renewable Technologies, DECC, 2012.
http://www.decc.gov.uk/en/content/cms/about/ec_social_res/analytic_projs/gen_costs/gen
_costs.aspx
Cost of single reactor, starting
construction in 2012 (£
millions, 2012 prices)
Share of total
Pre‐licensing costs, Technical and design 311 5%
Regulatory, licensing & public enquiry 5 0.1%
Programme & construction management 331 5%
Civil construction and installation 1,989 30%
Nuclear Steam Supply System 829 12.5%
Balance of nuclear island 829 12.5%
Non‐nuclear island 1,326 20%
Instrumentation and control 796 12%
Fuel 209 3%
Infrastucture cost 6 0.1%
Total (single reactor, 2012) 6,630 100%
Source: Atkins and Oxford Economics estimates

41
The economic benefit of improving the UK's nuclear supply chain capabilities
March 2013
4.2.3 The UK supply chain’s share of a single reactor
Consultations with industry bodies and the private sector and a review of the existing literature for the study suggested that the UK supply chain could at present realistically deliver 44% of new build. Guidance from the consultations
and literature on the individual activities has helped us to allocate the UK supply chain's share of new build costs across each component. This process also enabled us to identify components/areas of new build activity in which the UK
may increase its share over and above its present capabilities, through policy interventions and actions taken by organisations and companies participating in new build. These interventions/actions may increase the UK share of a single
rector by increasing the competitiveness of UK firms, or by realising capabilities in areas where the UK has some potential through additional investment (e.g. capital or training). Using this knowledge we have developed a scenario in which
the UK's share of activity is higher than suggested by current capabilities, at 63% overall for a single reactor. The lower 44% figure and higher 63% form the basis for the assumptions in Scenarios A and B respectively. However, it should
be noted under Scenario B it is assumed the UK only achieves the higher 63% share from the third reactor onwards.
As stated previously the scenarios in this study are particular views of the potential UK content within nuclear new build agreed between Oxford
Economics, Atkins, BIS, DECC and an industry expert. These views are no more or less valid than other informed views which have been published or exist within the industry. As such they may be considered indicative of the magnitudes
involved given the range of opinions on the UK's capability.
The scenario assumptions are summarised in Table 4.4 along with an illustration of what the scenarios means for a single indicative reactor (starting the construction phase in 2012) in terms of the value captured. A brief explanation of
the evidence used to derive the shares for each component is given below:
Pre-licensing, technical and design: The UK has strong capabilities in programme management, safety analysis, environmental analysis, planning and dealing with UK regulators. In addition much activity in this area is likely
to require employees to be located in the UK. Thus most of the activity should be captured within the UK, with little scope to see increases over current capabilities.
Regulatory, licensing & public enquiry: Justification for assumptions is
similar to those for “Pre-licensing, technical and design”.
Programme & construction management: Although the UK has strong capabilities in this area, there is scope for overseas competitors (if they win work) to perform much of the management activities in their overseas
bases. As a result the current share captured within the UK is likely to be lower than for Pre-licensing, regulatory etc. activities. Any potential increase will be from the delivery of on-the-site management activity.
Civil construction and mechanical/electrical installation: Based on
consultations the Westinghouse AP1000’s modular approach may mean
The UK supply chain could capture between 44% and 63% of the cost of a new reactor in our scenarios.

42
The economic benefit of improving the UK's nuclear supply chain capabilities
March 2013
significant construction work is done off-site overseas and then modules transported to the UK. This differs from the Areva EPR reactor for which most construction activity may be expected to take place on-site and
therefore captured within the UK. It must also be recognised that the ABWR needs to be submitted for design approval and the impact of this technology implementation is subject to an amount of ‘educated assessment’. However
consultation with the industry representatives for this area agreed that an assumption of 60% share was reasonable for initial activities (Scenario A). The consultations also highlighted this as a possible area that may in
subsequent build programmes increase to 80%, subject to implementation of skills development initiatives for both corporate (executive) and the discreet technical skills.
Nuclear Steam Supply System (NSSS): The UK is unable to supply
components such as reactor pressure vessels, large forgings and reactor coolant pumps, but can potentially supply other components such as pipework, valves and castings for coolant pumps; hence the 10%
assumption in Scenario A. The potential comes from developing capabilities to deliver components such as reactor vessel internals and increasing competitiveness and market share in other components. It was felt that that
there would need to be some support in developing business strategy (capability enhancement, new factories etc.) in parallel with implementation of the longer term skills for this area’s potential share to increase. It was
also assumed that if there was some ingress within the UK market there was very minimal potential for this to be transferred to overseas new build programmes, and as a result we assume the share can rise from 10% to
25%.
Balance of nuclear island: expert consultation suggested the UK could at
present capture 30% of the balance of nuclear island spending, including from fuel handling, auxiliary radioactive waste buildings and cranes. Consultations suggested the UK has potential to increase share in a greater
range of components within the Balance of Nuclear Island compared with NSSS. Enhancement in capability will be built over several builds when an understanding of the interfaces of components to nuclear safety is
embedded thus developing the ‘nuclear culture’. We therefore assume the share could rise from 30% to 60%.
Non-nuclear island: the UK does not have the capability to deliver turbines, but can deliver components such as pipework modules. The elicitation suggested that 40% could currently be delivered by the UK.
Potential comes from developing skills specifically in understanding the issues in providing confidence in the quality of supply, developing the ‘nuclear culture’ to erode the effective ‘barriers’ to gain market access.
Should the implementation of such initiatives be realised the UK market share could increase to 70%.

43
The economic benefit of improving the UK's nuclear supply chain capabilities
March 2013
Instrumentation and control: The 35% assumption is based on expert elicitation, which advised there is no potential to increase capability because of the strength of the current overseas supply chain and
prohibitive entry costs.
Fuel: From the consultations this was considered an area of strength and potential, specifically if Westinghouse can make use of its nuclear fuel processing facilities at Springfields. The EPR reactor meanwhile would
make use of AREVA’s overseas facilities until the UK capability was seen as a credible supplier. Based on the assumption that ABWR is successful and that EPR’s will eventually use the Springfields products a figure of 50%
has been assumed for the average reactor initially, rising to 70% under Scenario B for later reactors.
Infrastructure: It is assumed all civil construction work on substation and overhead power lines will take place within the UK.
Table 4.4: The UK's share of new build (single reactor)
4.2.4 Nuclear new build programme value
The timelines for the new build programmes (Section 4.2.1) are the same in both
Scenario A and B. The following assumptions are made with regard to the UK shares when modelling the 10GW and 16.5GW programmes for Scenarios A and B:
In Scenario A the UK shares for a reactor stay constant for the entire
programme at the Scenario A values reported in Table 4.4 (i.e. 44% per reactor).
In Scenario B the first two reactors (of the first twin-unit plant) to be
completed will have UK shares equivalent to Scenario A shares (i.e. 44% per reactor). Subsequent reactors (2024 onwards) assume the (higher) Scenario B UK shares.
UK shareUK value (£m, 2012 prices)
UK shareUK value (£m, 2012 prices)
UK share (% points)
UK value (£m, 2012 prices)
Pre-licensing technical & design 311 90% 280 90% 280 0% 0
Regulatory, licensing & public enquiry 5 90% 4 90% 4 0% 0
Programme & construction management 331 50% 166 80% 265 30% 99
Civil construction & installation 1,989 60% 1,193 80% 1,591 20% 398
Nuclear Steam Supply System 829 10% 83 25% 207 15% 124
Balance of nuclear island 829 30% 249 60% 497 30% 249
Non-nuclear island 1,326 40% 530 70% 928 30% 398
Instrumentation & control 796 35% 278 35% 278 0% 0
Fuel 209 50% 105 70% 146 20% 42
Infrastructure 6 100% 6 100% 6 0% 0
Total (single reactor, 2012 construction) 6,630 44% 2,894 63% 4,204 20% 1,310
* In Scenario B the UK only attains the higher shares from the third reactor on, with the first two reactors having UK shares equal to Scenario A.
Source: Oxford Economics and Atk ins
Scenario AScenario B (from third
reactor onwards*)Scenario B relative to
Scenario A (additional)Reactor value (£m, 2012
prices)

44
The economic benefit of improving the UK's nuclear supply chain capabilities
March 2013
The assumptions above mean that the UK will only start realising additional benefits in the Scenario B (relative to Scenario A) when the construction phase of the first reactor of the second plant gets underway (i.e. the third reactor to be
deployed). That is Scenario B diverges from Scenario A only from the third reactor onwards. This modelling assumption is consistent with the consultation feedback that successful delivery of the first reactor/plant and subsequent trust
in UK capabilities is one of the key drivers of future success of the UK's nuclear supply chain.
Combining the nuclear new build programme profiles, cost per reactor and UK shares together enables the value of the 10GW and 16.5GW programmes to be
estimated under Scenario A and B assumptions (see Annex A for more details).
The total (cumulative) cost of the 10GW new build programme will be an estimated £35.1 billion from 2012 to 203016 17, with an estimated £15.4 billion (44%) and £19.8 billion (56%) captured by the UK supply chain in Scenarios A
and B respectively18. Thus, if the UK supply chain can achieve Scenario B it would lead to an additional £4.4 billion in gross output for the UK economy.
Table 4.5: 10GW programme – total value share captured by the UK supply chain
16 The modelling approach in the study also produced some UK economic impacts pre-
2012 from the 10GW and 16.5GW programmes due to development of the first reactor.
However these have not been included in the results reported in this chapter.
17 All figures reported are undiscounted unless otherwise stated.
18 Note the UK share of the overall 10GW programme in Scenario B (56%) is less than
the Scenario B share for a single reactor (63%) reported in Table 4.4. This is because
under Scenario B of the 10GW programme the UK only achieves the higher 63% share
from the third reactor onwards, with the first two reactors having UK shares in line with
the Scenario A shares (i.e. 44% of a single reactor). As a result, the average UK share
across all reactors in the programme will be less than 63%.
The UK supply chain could capture between £15.4 billion and £19.8 billion of the value of a 10GW new build programme.
UK shareUK value (£m, 2012
prices)UK share
UK value (£m, 2012
prices)
UK share (% points)
UK value (£m, 2012
prices)
Pre-licensing technical & design 1,678 90% 1,510 90% 1,510 0% 0Regulatory, licensing & public enquiry 26 90% 23 90% 23 0% 0Programme & construction management 1,755 50% 878 69% 1,215 19% 337Civil construction & installation 10,531 60% 6,319 73% 7,668 13% 1,349Nuclear Steam Supply System 4,388 10% 439 20% 860 10% 422Balance of nuclear island 4,388 30% 1,316 49% 2,160 19% 843Non-nuclear island 7,021 40% 2,808 59% 4,157 19% 1,349Instrumentation & control 4,212 35% 1,474 35% 1,474 0% 0Fuel 1,108 50% 554 63% 696 13% 142Infrastructure 35 100% 35 100% 35 0% 0
Total 10GW programme 35,140 44% 15,355 56% 19,798 13% 4,443
New build programme value
(gross output), 2012-2030, 2012 prices
Scenario A Scenario BScenario B relative to
Scenario A (additional)
Source: Oxford Economics and Atk ins

45
The economic benefit of improving the UK's nuclear supply chain capabilities
March 2013
For the 16.5GW programme, the cost of the new build programme will be an estimated £58.6 billion with the UK capturing £25.5 billion (44%) in Scenario A and £34.6 billion (59%) in Scenario B19. Attaining Scenario B will therefore mean
the UK supply chain captures an additional £9.1 billion in value (i.e. gross output) from nuclear new build.
Table 4.6: 16.5GW programme – total value and share captured by the UK supply chain
The average cost per reactor is almost identical between the 10GW and 16.5GW programmes. This is due to two opposite effects negating each other. The first is that the additional reactors under the 16.5GW programme are Nth-of-
a-kind and therefore cheaper. The second is that profile of reactors under the 16.5GW programme is relatively skewed towards the early years of the new build horizon (2030) compared with 10GW - this tends to increase costs as costs
are assumed to fall over time (following Parsons Brinckerhoff/DECC assumptions).
The time profiles of the value of the potential new build programmes are presented in Figures 4.1 and 4.2. The two charts show activity tailing-off by 2030
as only reactors with assumed completion dates of 2030 or before have been
19 As under the 10GW programme the UK share of the overall 16.5GW programme in
Scenario B is less than the Scenario B share for a single reactor (63%) reported in Table
4.4. This is because under Scenario B the UK only achieves the higher 63% share from
the third reactor onwards, with the first two reactors having UK shares in line with the
Scenario A shares (i.e. 44% of a single reactor). As a result, the average UK share
across all reactors in the programme will be less than 63%. Under Scenario B of the
16.5GW programme the average UK share is 59%. This is higher than the 56% estimated
for the 10GW programme (Table 4.5) as the 16.5GW programme contains a greater
number of reactors (after the second reactor) achieving the higher 63% share.
The UK supply chain could capture between £25.5 billion and £34.6 billion of the value of a 16.5GW new build programme.
UK shareUK value (£m, 2012
prices)UK share
UK value (£m, 2012
prices)
UK share (% points)
UK value (£m, 2012
prices)
Pre-licensing technical & design 2,669 90% 2,402 90% 2,402 0% 0Regulatory, licensing & public enquiry 43 90% 39 90% 39 0% 0Programme & construction management 2,934 50% 1,467 74% 2,158 24% 691Civil construction & installation 17,604 60% 10,563 76% 13,327 16% 2,764Nuclear Steam Supply System 7,335 10% 734 22% 1,597 12% 864Balance of nuclear island 7,335 30% 2,201 54% 3,928 24% 1,727Non-nuclear island 11,736 40% 4,695 64% 7,458 24% 2,764Instrumentation & control 7,042 35% 2,465 35% 2,465 0% 0Fuel 1,852 50% 926 66% 1,217 16% 291Infrastructure 58 100% 58 100% 58 0% 0
Total 16.5GW programme 58,609 44% 25,548 59% 34,648 15% 9,101
Source: Oxford Economics and Atk ins
New build programme value
(gross output), 2012-2030, 2012 prices
Scenario A Scenario BScenario B relative to
Scenario A (additional)
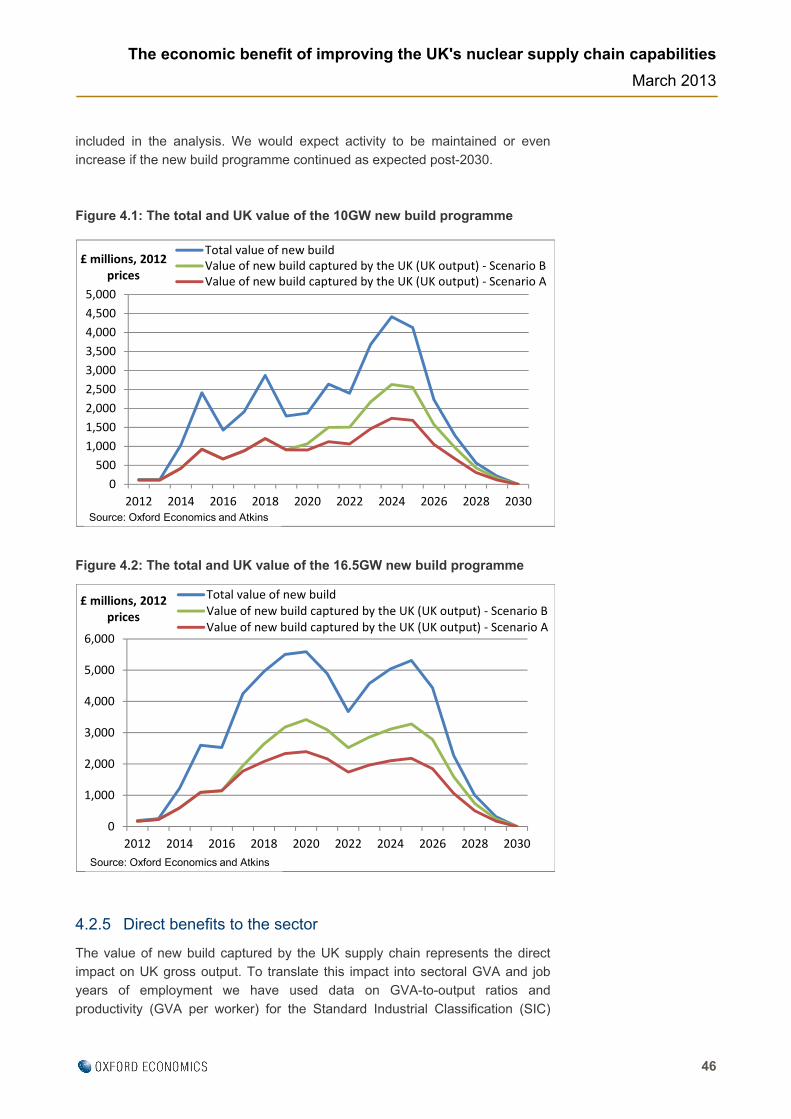
46
The economic benefit of improving the UK's nuclear supply chain capabilities
March 2013
included in the analysis. We would expect activity to be maintained or even increase if the new build programme continued as expected post-2030.
Figure 4.1: The total and UK value of the 10GW new build programme
Figure 4.2: The total and UK value of the 16.5GW new build programme
4.2.5 Direct benefits to the sector
The value of new build captured by the UK supply chain represents the direct impact on UK gross output. To translate this impact into sectoral GVA and job years of employment we have used data on GVA-to-output ratios and
productivity (GVA per worker) for the Standard Industrial Classification (SIC)
0
500
1,000
1,500
2,000
2,500
3,000
3,500
4,000
4,500
5,000
2012 2014 2016 2018 2020 2022 2024 2026 2028 2030
£ millions, 2012 prices
Total value of new buildValue of new build captured by the UK (UK output) ‐ Scenario BValue of new build captured by the UK (UK output) ‐ Scenario A
Source: Oxford Economics and Atkins
0
1,000
2,000
3,000
4,000
5,000
6,000
2012 2014 2016 2018 2020 2022 2024 2026 2028 2030
£ millions, 2012 prices
Total value of new buildValue of new build captured by the UK (UK output) ‐ Scenario BValue of new build captured by the UK (UK output) ‐ Scenario A
Source: Oxford Economics and Atkins

47
The economic benefit of improving the UK's nuclear supply chain capabilities
March 2013
industry (or industries) which most closely corresponded with activity in each of the new build nuclear categories (i.e. balance of plant, NSSS, instrumentation & control etc.).
Mapping activities to industries
This industry correspondence first involved matching the NIA’s 60 work
packages20 to detailed SIC industries. Then, by analysing the
correspondence between NIA work packages and our categories we
obtained a mapping of categories to SIC industries. Please see Annex A for
more details.
As the categories we were working with were quite broad (NSSS, balance of
plant etc.) some broad assumptions had to be made regarding the
correspondence.
In particular, we assume that NSSS, Balance of Nuclear Island and Non-
nuclear Island activity corresponds with the aggregate of SIC industry 28
(Manufacture of Fabricated Metal Products) and SIC industry 29
(Manufacture of Machinery and Equipment). Analysis suggested the
components (e.g. valves, pumps, vessels etc.) within these three broad
categories are captured within SIC industries 28 and 29, but we did not have
enough detail on spend by individual component (e.g. valves) to obtain a
mapping to more detailed SIC codes.
Using the industry correspondence described above, appropriate GVA-to-output ratios were taken from the latest 2005 ONS Input-Output tables for the UK, while
productivity forecasts for relevant industries were based on Oxford Economics UK industry service and ONS ABS (Annual Business Survey) data.
Adjusting productivity
Cogent’s “Next Generation, Skills for New Build Nuclear”21 report provides
an estimate of the profile of new build manufacturing employment by skill
area/competence. These skill areas correspond to various engineering
professions (e.g. design engineering) or skilled trade occupations (e.g.
welders). Each skill area was therefore mapped to a Standard Occupational
Code (SOC) to obtain an occupational profile of new build manufacturing
employment. This profile was applied to data on average earnings by
occupation from the ONS’s Annual Survey of Hours and Earnings (ASHE) to
estimate average earnings of new build manufacturing employees. We
20 “UK capability to deliver a new nuclear build programme”, NIA, 2006/2008.
21 Next Generation, Skills for New Build Nuclear; Renaissance Nuclear Skills Series:2;
Cogent; March 2010.

48
The economic benefit of improving the UK's nuclear supply chain capabilities
March 2013
estimate average earnings in nuclear new build manufacturing to be £40,600
in 2010. This is compared to £28,800 for manufacturing as a whole.
Using this approach of adjusting for occupational wages, we find that on
average over the last 3 years nuclear manufacturing wages were about 15%
higher than the average for manufacturing.
In addition to the different occupational structure of nuclear activity, (i.e.
nuclear requires higher skilled professional occupations) there may also be a
nuclear premium in that people in the nuclear sector earn more than people
in similar occupations in other industries as the demands on high
product/service quality require the most highly skilled workers.
We have drawn from US data to identify the scale of the premium. The
Bureau of Labor Statistics in the US publishes detailed occupational
earnings data in its Occupational Employment Statistics publication. This
includes earnings for “Nuclear engineers”, “Nuclear technicians” and
“Nuclear reactor operators”. These were compared with engineers or
technicians in other sectors. We found that:
Nuclear engineers earned around 20% more than the average of
engineers;
Nuclear technicians earned around 25% more than the average of
technicians; and
Nuclear plant operators earned around 25% more than the average of
other plant operators (e.g. gas, other power plant).
Based on the above evidence we assume the nuclear premium to be 20%.
Combining the 15% occupational uplift with the 20% nuclear pay premium
(i.e. 1.15 multiplied by 1.2) gives a final figure of 1.38 indicating that nuclear
manufacturing earnings are around 38% higher than average manufacturing.
We applied this to the average manufacturing productivity estimates used in
the model.
With respect to programme management, pre-development and
regulatory/licensing we obtained a first estimate by using each category’s
correspondence to UK industry sectors and Oxford Economics’ productivity
forecasts by industry sector. We then applied the 20% nuclear premium to
these initial estimates. Given the focus on quality and skills, it is reasonable
to assume that these activities will also command a premium over and above
the same activities in non-nuclear sectors.
Focussing first on the 10GW programme, we have seen that the UK supply chain captures £15.4 billion of the value of new build in Scenario A and £19.8 billion in Scenario B. Based on our methodology the gross impact on GVA is an
estimated £6.8 billion in Scenario A and £8.7 billion in Scenario B (Figure 4.3). Thus, the improved UK supply chain represented by Scenario B results in an

49
The economic benefit of improving the UK's nuclear supply chain capabilities
March 2013
additional £1.9 billion in direct GVA in the nuclear supply chain in the UK (on a “gross” measure i.e. not accounting for displacement effects).
With respect to the 16.5GW programme (Figure 4.4), the estimated GVA impact from Scenarios A and B are £11.4 billion and £15.2 billion respectively, meaning
achieving Scenario B leads to an additional £3.8 billion in direct nuclear supply chain GVA in the UK.
Figure 4.3: New build direct output and GVA, 10GW programme, cumulative to 2030
Figure 4.4: New build direct output and GVA, 16.5GW programme,
cumulative to 2030
Tables 4.7 and 4.8 detail the direct GVA and employment impacts by broad component/activity type. Employment effects represent “job years” where one
job year is one person in employment for one year. The 10GW programme
Under the 10GW programme we estimate a direct impact of £6.8 billion in GVA captured by the UK economy in Scenario A and £8.7 billion in Scenario B. Scenario B therefore results in an additional £1.9 billion in direct GVA captured by the UK.
Under the 16.5GW programme we estimate a direct impact of £11.4 billion in GVA captured by the UK in Scenario A and £15.2 billion in Scenario B. Scenario B therefore results in an additional £3.9 billion in direct GVA captured by the UK.
35,140
15,355
6,833
19,798
8,719
0
5000
10000
15000
20000
25000
30000
35000
40000
Total value of new build UK value of new build(UK output)
GVA impact (direct) onnuclear supply chain
£ millions, 2012 prices
Scenario A Scenario B
Source: Oxford Economics and Atkins
58,609
25,548
11,355
34,648
15,218
0
10000
20000
30000
40000
50000
60000
70000
Total value of new build UK value of new build(UK output)
GVA impact (direct) onnuclear supply chain
£ millions, 2012 prices
Scenario A Scenario B
Source: Oxford Economics and Atkins

50
The economic benefit of improving the UK's nuclear supply chain capabilities
March 2013
provides 86,500 job years of employment within the nuclear supply chain from 2012-2030 under Scenario A and 106,200 job years under the higher Scenario B. This is equivalent to 4,600 permanent jobs in Scenario A over the period of
analysis (2012-2030), and 5,600 permanent jobs in Scenario B. Achieving Scenario B by improving the UK supply chain’s capabilities therefore leads to an additional 19,600 job years within the UK nuclear supply chain, or just over
1,000 permanent jobs from 2012-2030 compared to Scenario A. As with the GVA impacts reported above this estimate of additional employment is “gross” and does not take account of potential displacement effects on the wider
economy.
Table 4.7: 10GW new build gross direct impacts, 2012-2030, 2012 prices.
The 16.5GW programme leads to a UK employment impact of 144,600 job years from 2012-2030 under Scenario A and 186,600 job years under Scenario B. This is equivalent to 7,600 permanent jobs in Scenario A and 9,800 permanent jobs
in Scenario B over the period. Our modelling therefore shows that attaining Scenario B could lead to an additional 42,000 job years or 2,200 permanent jobs from 2012-2030 within the UK nuclear supply chain compared to Scenario A. As
with the GVA impacts reported above this estimate of additional employment is “gross” and does not take account of potential displacement effects on the wider economy.
GVA (£ millions, 2012 prices)
Employment (job years, 000s)
GVA (£ millions, 2012 prices)
Employment (job years, 000s)
GVA (£ millions, 2012 prices)
Employment (job years, 000s)
Pre-licensing technical & design 842 14.1 842 14.1 0 0.0
Regulatory, licensing & public enquiry 13 0.2 13 0.2 0 0.0
Programme & construction management 454 6.4 628 8.7 174 2.3
Civil construction & installation 2,454 39.1 2,978 47.1 524 8.0
Nuclear Steam Supply System 185 1.7 363 3.1 178 1.4
Balance of nuclear island 556 4.7 912 7.5 356 2.7
Non-nuclear island 1,185 10.8 1,755 15.5 569 4.7
Instrumentation & control 802 7.3 802 7.3 0 0.0
Fuel 329 2.0 413 2.5 84 0.5
Infrastructure 13 0.3 13 0.3 0 0.0
Total 10GW programme 6,833 86.5 8,719 106.2 1,886 19.6
Scenario A Scenario BScenario B relative to Scenario A
(additional)
Source: Oxford Economics and Atk ins
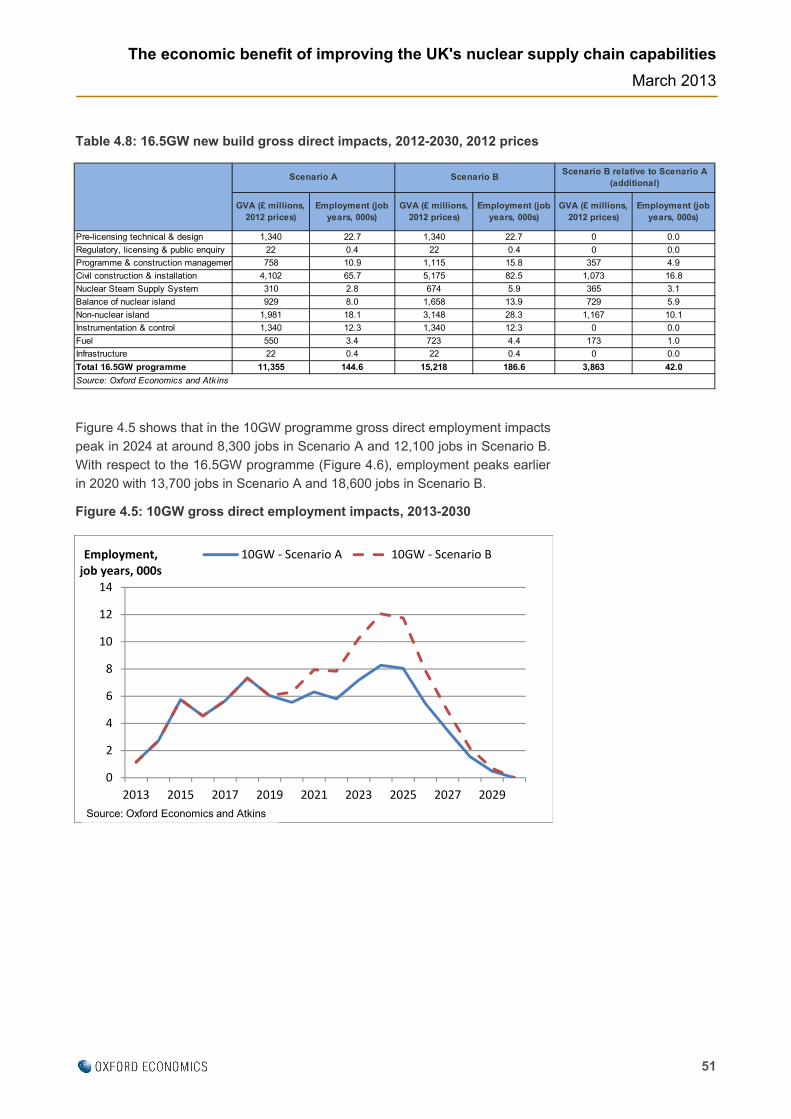
51
The economic benefit of improving the UK's nuclear supply chain capabilities
March 2013
Table 4.8: 16.5GW new build gross direct impacts, 2012-2030, 2012 prices
Figure 4.5 shows that in the 10GW programme gross direct employment impacts peak in 2024 at around 8,300 jobs in Scenario A and 12,100 jobs in Scenario B. With respect to the 16.5GW programme (Figure 4.6), employment peaks earlier
in 2020 with 13,700 jobs in Scenario A and 18,600 jobs in Scenario B.
Figure 4.5: 10GW gross direct employment impacts, 2013-2030
GVA (£ millions, 2012 prices)
Employment (job years, 000s)
GVA (£ millions, 2012 prices)
Employment (job years, 000s)
GVA (£ millions, 2012 prices)
Employment (job years, 000s)
Pre-licensing technical & design 1,340 22.7 1,340 22.7 0 0.0
Regulatory, licensing & public enquiry 22 0.4 22 0.4 0 0.0
Programme & construction managemen 758 10.9 1,115 15.8 357 4.9
Civil construction & installation 4,102 65.7 5,175 82.5 1,073 16.8
Nuclear Steam Supply System 310 2.8 674 5.9 365 3.1
Balance of nuclear island 929 8.0 1,658 13.9 729 5.9
Non-nuclear island 1,981 18.1 3,148 28.3 1,167 10.1
Instrumentation & control 1,340 12.3 1,340 12.3 0 0.0
Fuel 550 3.4 723 4.4 173 1.0
Infrastructure 22 0.4 22 0.4 0 0.0
Total 16.5GW programme 11,355 144.6 15,218 186.6 3,863 42.0
Scenario A Scenario BScenario B relative to Scenario A
(additional)
Source: Oxford Economics and Atk ins
0
2
4
6
8
10
12
14
2013 2015 2017 2019 2021 2023 2025 2027 2029
Employment, job years, 000s
10GW ‐ Scenario A 10GW ‐ Scenario B
Source: Oxford Economics and Atkins

52
The economic benefit of improving the UK's nuclear supply chain capabilities
March 2013
Figure 4.6: 16.5GW gross direct employment impacts, 2013-2030
4.2.6 Indirect and induced effects to the UK
In addition to the above direct effects to the UK's nuclear supply chain, there will be indirect impacts as the nuclear supply chain demands products/services from
the wider economy. While employment generated by the programme leads to additional (induced) effects through consumer spending. These “multiplier effects” have been estimated by utilising the latest 2005 ONS Input-Output
tables.
Table 4.9 presents the results of the multiplier analysis for the 10GW programme (again these are indicative estimates based on our modelling assumptions). Indirect and induced GVA associated with Scenario A are £5.4
billion and £4.4 billion respectively. Together with the direct effect of £6.8 billion this gives a total GVA impact of £16.6 billion in Scenario A. The total employment effect in Scenario A is 265,300 job years, consisting of 86,500
direct, 96,600 indirect and 82,300 induced job years. If the UK supply chain were to achieve Scenario B our modelling suggests the total GVA impact (direct, indirect and induced) could be £21.3 billion, with associated employment of
332,500 job years. The additional total benefit within the UK nuclear supply chain from attaining Scenario B relative to Scenario A, accounting for direct and multiplier effects, is therefore an estimated £4.7 billion in GVA and 67,200 job
years. As with the rest of the analysis in this chapter the impacts do not consider displacement effects, which would reduce the final net benefit to the UK economy (this is considered in Chapter 5).
0
2
4
6
8
10
12
14
16
18
20
2013 2015 2017 2019 2021 2023 2025 2027 2029
Employment, job years, 000s
16GW ‐ Scenario A 16GW ‐ Scenario B
Source: Oxford Economics and Atkins

53
The economic benefit of improving the UK's nuclear supply chain capabilities
March 2013
Table 4.9: Gross direct, indirect and induced impacts over the 10GW new build programme, 2012 prices
The total impact of Scenarios A and B under the 16.5GW programme profile are
reported in Table 4.10. The results for Scenario A suggest, given the UK supply chain’s current capabilities, the impact of the programme would be £27.6 billion in direct GVA and 444,000 job years in the nuclear supply chain (accounting for
direct and multiplier effects). In Scenario B the total GVA impact (direct, indirect and induced) is an estimated £37.3 billion, with associated employment of 587,000 job years. Thus, achieving Scenario B would boost GVA in the UK
nuclear supply chain by £9.7 billion and employment by 143,000 job years relative to Scenario A once multiplier effects are accounted for.
Table 4.10: Gross direct, indirect and induced impacts over the 16.5GW new build programme, 2012 prices
Table 4.11 summarises the peak direct, indirect and induced employment impacts (on gross basis) from the 10GW and 16.5GW programmes. As mentioned previously employment impacts peak in 2024 under the 10GW
programme and in 2020 under the 16.5GW programme. In the 16.5GW programme the peak employment impact is 42,700 jobs in Scenario A allowing for direct, indirect and induced effects, with a corresponding figure of 60,000 for
Scenario B. If we consider direct and indirect (supply-chain) effects only then peak employment is 29,400 jobs in Scenario A and 40,800 jobs in Scenario B.
New build value (output), £ millions,
2012 prices
GVA, £ millions,
2012 prices
Employment (job years),
000s
New build value (output), £ millions,
2012 prices
GVA, £ millions, 2012
prices
Employment (job years),
000s
New build value (output), £ millions,
2012 prices
GVA, £ millions, 2012
prices
Employment (job years),
000s
Direct 15,400 6,800 86.5 19,800 8,700 106.2 4,400 1,900 19.6Indirect 12,100 5,400 96.6 15,600 7,000 121.4 3,500 1,600 24.9Induced 8,500 4,400 82.3 11,000 5,600 104.9 2,500 1,200 22.7
Total 35,900 16,600 265.3 46,300 21,300 332.5 10,400 4,700 67.2
Scenario A Scenario B Scenario B relative to Scenario A (additional)
Note: Results rounded to nearest £100 million for output and GVA, and to nearest thousand for employment; figures may not add up to totals due to rounding.
Source: Oxford Economics and Atk ins
New build value (output), £ millions,
2012 prices
GVA, £ millions, 2012
prices
Employment (job years),
000s
New build value (output), £ millions,
2012 prices
GVA, £ millions, 2012
prices
Employment (job years),
000s
New build value (output), £ millions,
2012 prices
GVA, £ millions, 2012
prices
Employment (job years),
000s
Direct 25,500 11,400 144.6 34,600 15,200 186.6 9,100 3,800 42.0Indirect 20,100 9,000 161.7 27,300 12,200 214.7 7,200 3,200 53.0Induced 14,100 7,200 137.7 19,200 9,900 185.8 5,100 2,700 48.1
Total 59,700 27,600 444.0 81,100 37,300 587.0 21,400 9,700 143.0
Source: Oxford Economics and Atk ins
Scenario B Scenario B relative to Scenario A (additional)
Note: Results rounded to nearest £100 million for output and GVA, and to nearest thousand for employment; figures may not add up to totals due to rounding.
Scenario A

54
The economic benefit of improving the UK's nuclear supply chain capabilities
March 2013
Table 4.11: Peak employment impacts of nuclear new build (gross)
Figures 4.7 and 4.8 illustrate the estimated combined direct and indirect employment impacts of the 10GW and 16.5GW programmes. The direct employment impacts are those impacts on the companies which directly capture
the initial injection of capital from a new build programme. The indirect impacts include the benefits that arise from these companies sub-contracting the provision of certain components and services to the wider UK nuclear supply
chain22. Thus, the combined direct and indirect estimate may be closer to the definition of nuclear supply chain employment in other studies.
Figure 4.7: 10GW gross direct and indirect employment impacts (combined), 2013-2030
22 Indirect employment as defined in this study will also include employment in the wider
non-nuclear UK supply chain (e.g. recruitment services for sub-contractors), which is
dependent on activity in the nuclear supply chain itself. See footnote 3 for more details.
Peak yearPeak employment,
job years, 000sPeak year
Peak employment, job years, 000s
Peak yearPeak employment,
job years, 000sPeak year
Peak employment, job years, 000s
Direct 2024 8.3 2024 12.1 2020 13.7 2020 18.6Indirect 2024 10.0 2024 15.0 2020 15.7 2020 22.1Induced 2024 8.7 2024 13.3 2020 13.3 2020 19.3Total 2024 27.0 2024 40.3 2020 42.7 2020 60.0
16GW programme
Scenario A gross employment Scenario B gross employment
Source: Oxford Economics and Atkins
10GW programme
Scenario A gross employment Scenario B gross employment
0
5
10
15
20
25
30
2013 2015 2017 2019 2021 2023 2025 2027 2029
Employment, job years, 000s
10GW ‐ Scenario A 10GW ‐ Scenario B
Source: Oxford Economics and Atkins

55
The economic benefit of improving the UK's nuclear supply chain capabilities
March 2013
Figure 4.8: 16.5GW gross direct and indirect employment impacts (combined), 2013-2030
Under the 10GW programme the peak of combined direct and indirect
employment is 18,300 job years in Scenario A (occurring in 2024), which rises to 27,000 job years in Scenario B. Assuming the 16.5GW programme meanwhile gives peak employment of 29,400 job years in 2020 in Scenario A, increasing to
40,800 job years in Scenario B.
4.3 The value of R&D
It is likely that the nuclear new-build programme will involve an investment in R&D spending by local suppliers (despite the consultations suggesting that it was not currently necessary for current capabilities). The knowledge gained
through this spending on R&D activities can then be transferred to other sectors of the economy. This, in turn, will generate substantial spillover benefits that would increase the productivity of the other sectors.
There is a substantial body of economic literature that has found that the R&D
spending undertaken by a private business has the potential to generate external benefits to society in excess of the private returns captured by the investing business. This stems from the fact that the various innovations
developed to match the specific needs of one business can often be applied more widely by other firms in other sectors of the economy. This will allow the R&D investment to generate additional benefits to society as a whole.
R&D spend provides substantial spillover benefits to the economy.
0
5
10
15
20
25
30
35
40
45
2013 2015 2017 2019 2021 2023 2025 2027 2029
Employment, job years, 000s
16GW ‐ Scenario A 16GW ‐ Scenario B
Source: Oxford Economics and Atkins
The direct plus indirect employment peak ranges from 29,400 job years to 40,800 job years in our scenarios under the 16.5 GW programme.

56
The economic benefit of improving the UK's nuclear supply chain capabilities
March 2013
4.3.7 R&D spending under nuclear new build
Using estimates of the R&D intensity (R&D spending per £ of sales) for manufactured products23 we can estimate an indicative level of investment in R&D spending that will be required to meet the demands of the UK nuclear new-
build program under both the 10GW and 16.5GW programmes.
Using the 10GW spending profiles developed above, we estimate that the cumulative spending on R&D will amount to £207 million over the 2014 to 2030 period in Scenario A, peaking at £112 million in 2026 and averaging £12 million
per year. In Scenario B cumulative spending rises to £268 million over the same period, with a peak of £154 million in 2026 and an average of just under £16 million per year. The impact of achieving Scenario B is therefore an additional
£62 million in R&D spending over the period of the 10GW programme.
Under the 16.5GW programme, we estimate that the cumulative spending on R&D will equal £345 million between 2014 and 2030 in Scenario A, peaking at £161 million in 2027 and averaging £20 million per year. In Scenario B
cumulative spending rises to £472 million over the same period, with a peak of £228 million in 2027 and an average of just under £28 million per year. The additional impact of achieving Scenario B is therefore an extra £127 million in
R&D spending over the period of the 16.5GW programme.
4.3.8 R&D spillovers
In order to quantify the size of the R&D spillover, we took the year-by-year estimated R&D spending based on the new-build spending profiles and turned
this ‘flow’ into an associated R&D ‘stock’. This ‘stock’ is calculated as the cumulative spending on R&D over a run of years. We depreciate our stock of R&D spend each year by 15%, and apply an annual leakage rate of 25% per
year and finally assume a gross external return of 25%. The approach of our analysis follows official guidance (see Annex A)24.
Under the 10GW programme the total cumulative spillover benefit on UK GVA would approach £191 million over the entire period in Scenario A, with a
corresponding figure of £240 million in Scenario B. Achieving Scenario B by improving the share of new build captured by the UK supply chain would therefore result in an additional £49 million in spillover benefits for UK GVA.
With the 16.5GW programme cumulative spillover benefits would equal £321
million over the entire period in Scenario A. In Scenario B this benefit would be an estimated £430 million. Reaching Scenario B therefore provides an additional £108 million in spillover benefits for the UK economy.
23 Office for National Statistics. 2011. “UK Business Enterprise Research and
Development, 2010.” Office of National Statistics Statistical Bulletin. 09 November 2011.
24 “Competing in the global economy: the innovation challenge”, DTI, December 2003.
http://webarchive.nationalarchives.gov.uk/+/http://www.dti.gov.uk/files/file12093.pdf

57
The economic benefit of improving the UK's nuclear supply chain capabilities
March 2013
Tables 4.12 and 4.13 summarise the gross R&D benefits discussed in the preceding sections.
Table 4.12: Gross R&D benefits from 10GW programme
Table 4.13: Gross R&D benefits from 16.5GW programme, 2012 prices
Note: It is important to note that these estimates do not include any
additional R&D that would be required to develop the technology necessary
for the GEN IV plants. Developing the technologies associated with GEN IV
might result in significant additional R&D spending. Spillover estimates also
do not include any impacts that will result from UK firms being able to
capture a portion of the worldwide new-build export market.
4.4 The value of exports
The World Nuclear Association (WNA) estimates that in addition to the 61 units currently under construction internationally an additional 160 will be constructed by 2025 (See Table 4.14 for a distribution of the new build by region). The WNA
estimates that the value of this nuclear new-build is on the order US$1.5 trillion (£0.93 trillion25), with significant international procurement expected to be approximately US$530 billion (£330 billion), US$40 billion (£25 billion) per year
through 2030. Approximately $500 billion (£310 billion) will be for equipment
25 Figures reported by the World Nuclear Association are in US dollars. A long-run
exchange rate of US$1.6 per pound sterling has been assumed in this section.
The WNA estimates that the global value of nuclear new-build is in the order £0.93 trillion.
Scenario A Scenario BScenario B relative to
Scenario A (additional)
R&D spending from new build (£millions, 2012 prices)
206.6 268.4 61.8
Spillover benefits (£millions, 2012 prices)
191.1 240.4 49.3
Source: Oxford Economics and Atkins
Scenario A Scenario BScenario B relative to
Scenario A (additional)
R&D spending from new build (£millions, 2012 prices)
345.4 472.0 126.5
Spillover benefits (£millions, 2012 prices)
321.2 429.7 108.4
Source: Oxford Economics and Atkins
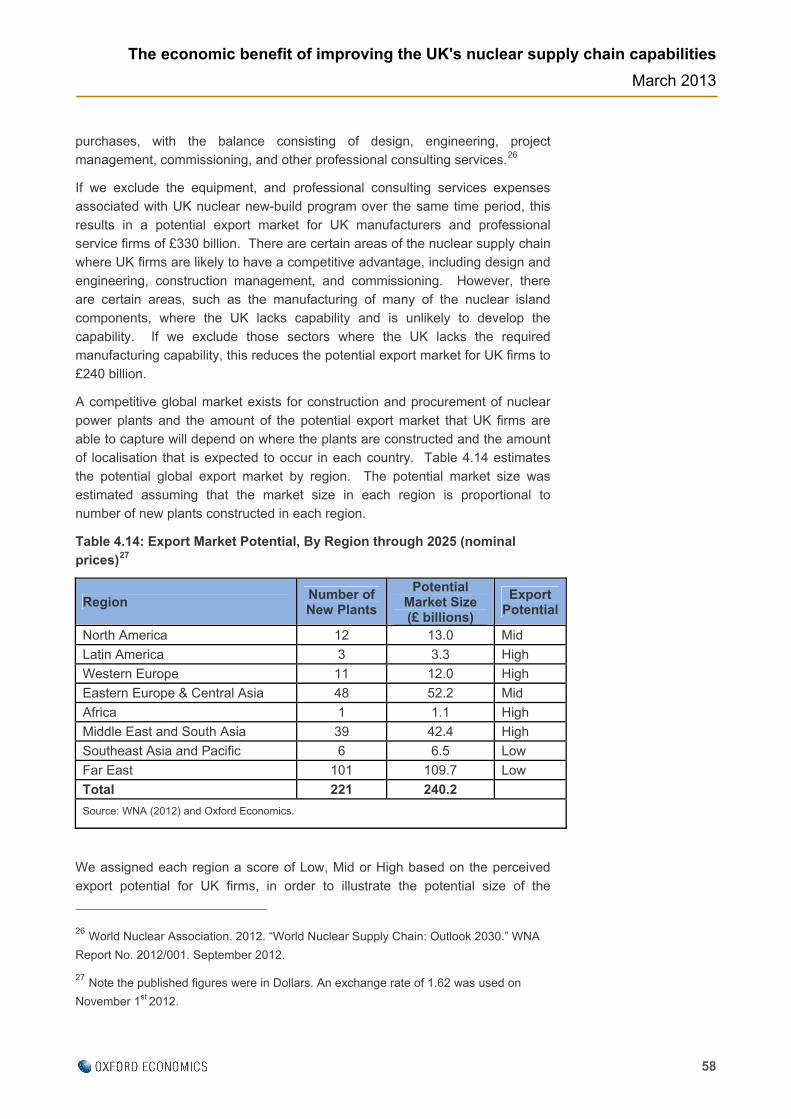
58
The economic benefit of improving the UK's nuclear supply chain capabilities
March 2013
purchases, with the balance consisting of design, engineering, project management, commissioning, and other professional consulting services.26
If we exclude the equipment, and professional consulting services expenses associated with UK nuclear new-build program over the same time period, this
results in a potential export market for UK manufacturers and professional service firms of £330 billion. There are certain areas of the nuclear supply chain where UK firms are likely to have a competitive advantage, including design and
engineering, construction management, and commissioning. However, there are certain areas, such as the manufacturing of many of the nuclear island components, where the UK lacks capability and is unlikely to develop the
capability. If we exclude those sectors where the UK lacks the required manufacturing capability, this reduces the potential export market for UK firms to £240 billion.
A competitive global market exists for construction and procurement of nuclear
power plants and the amount of the potential export market that UK firms are able to capture will depend on where the plants are constructed and the amount of localisation that is expected to occur in each country. Table 4.14 estimates
the potential global export market by region. The potential market size was estimated assuming that the market size in each region is proportional to number of new plants constructed in each region.
Table 4.14: Export Market Potential, By Region through 2025 (nominal
prices)27
Region Number of New Plants
Potential Market Size (£ billions)
Export Potential
North America 12 13.0 Mid
Latin America 3 3.3 High
Western Europe 11 12.0 High
Eastern Europe & Central Asia 48 52.2 Mid
Africa 1 1.1 High
Middle East and South Asia 39 42.4 High
Southeast Asia and Pacific 6 6.5 Low
Far East 101 109.7 Low
Total 221 240.2
Source: WNA (2012) and Oxford Economics.
We assigned each region a score of Low, Mid or High based on the perceived
export potential for UK firms, in order to illustrate the potential size of the
26 World Nuclear Association. 2012. “World Nuclear Supply Chain: Outlook 2030.” WNA
Report No. 2012/001. September 2012.
27 Note the published figures were in Dollars. An exchange rate of 1.62 was used on
November 1st 2012.

59
The economic benefit of improving the UK's nuclear supply chain capabilities
March 2013
opportunity. In Asia and the Far East it will likely be difficult for UK firms to be able to capture a significant portion of materials and equipment spending. The most recent plants completed in Japan have seen local content raise to over
90% of the total project costs. South Korea has set a goal of being fully self-reliant by 2012, and China has set the goal of full self-reliance by 201528. In addition, in 2007, China struck a landmark agreement with Westinghouse for the
transfer of technology to Chinese companies for the AP100 design. This should give China an advantage in supplying projects located in other countries located in the Far East and Southeast Asia and Pacific and to a lesser extent Eastern
Europe and Central Asia.
While, North America has the capacity to manufacture significant portions of the nuclear supply chain they have made the decision to not become fully self-reliant which should provide some potential export opportunities for UK suppliers. In
addition, while some countries in Eastern Europe and Central Asia have specialized in certain components of the supply chain where they enjoy a competitive advantage, they will still likely need to import large portions of
equipment. For example, several plants planned in Belarus and Hungry have expected local content of 30% and several plants in India have planned localisation goals of 40%.29 This should supply a high amount of potential
export opportunities for UK firms; however they are likely to face significant stiff competition from China and other Asia countries that have been investing in their nuclear supply chains.
Finally, the UK has the potential to capture a portion of spending for countries
that are in their infancy in terms of nuclear development. These include countries located in Africa, Middle East and South Asia, and Latin America. These countries currently lack significant manufacturing capability for most
components of the nuclear supply and as result will initially be reliant on imports for a large portion of the equipment related spending. However, as these countries develop their own nuclear sectors, the export potential for UK firms is
likely to decrease over time. In addition, the UK firms have the potential to capture some of the spending associated with nuclear plant construction in Western Europe.
For illustrative purposes, if we assume that UK firms are able to capture 1.0% of
the potential export market in regions where the UK has a Low potential, 2.5% in regions where the UK has a Mid potential, and between 5.0% and 10.0% in regions where the UK has a High potential, this could amount to approximately
£8 billion in exports (Table 4.15) in total through to 2030.
28 World Nuclear Association. 2012. “World Nuclear Supply Chain: Outlook 2030.” WNA
Report No. 2012/001. September 2012.
29 World Nuclear Association. 2012. “World Nuclear Supply Chain: Outlook 2030.” WNA
Report No. 2012/001. September 2012.

60
The economic benefit of improving the UK's nuclear supply chain capabilities
March 2013
Table 4.15: Potential Export Market for UK Firms
Region Number of New Plants
Potential Market Size
(£ billions)
Percent Captured
Exports (£ billions)
North America 12 13.0 2.5% 0.33
Latin America 3 3.3 5.0% 0.17
Western Europe 11 12.0 5.0% 0.60
Eastern Europe & Central Asia 48 52.2 2.5% 1.31
Africa 1 1.1 10.0% 0.11
Middle East and South Asia 39 42.4 10.0% 4.24
Southeast Asia and Pacific 6 6.5 1.0% 0.07
Far East 101 109.7 1.0% 1.10
Total 221 240.2 7.91
Source: WNA (2012) and Oxford Economics.
4.5 A new build programme could offer significant benefits
The total impact (i.e. direct, indirect and induced) of the 10GW programme in Scenario A is estimated to be £35.9 billion in terms of output, £16.6 billion in
GVA terms and generate an employment impact of 265,000 jobs. Under the 10GW programme achieving Scenario B would result in additional gross output, GVA and employment of £10.5 billion, £4.7 billion and 67,200 job years
respectively (all figures additional to Scenario A). These estimates of additional GVA and employment are “gross” and do not take account of potential displacement effects on the wider economy.
The total impact of the 16.5GW programme in Scenario A is estimated to be
£59.7 billion in output terms, with associated GVA of £27.6 billion and an employment impact of 444,000 job years. Achieving Scenario B under the 16.5GW programme would result in additional gross benefits. These are
estimated to be an additional £21.4 billion output, £9.7 billion additional GVA and 143,000 additional job years higher respectively in Scenario B relative to Scenario A. As under the 10GW programme these economic impacts are
“gross” and do not take account of potential displacement effects on the wider economy.

61
The economic benefit of improving the UK's nuclear supply chain capabilities
March 2013
5 Net impact of capability improvements
This section considers the net economic impact of achieving Scenario B as
discussed in Chapter 4.
Key findings:
The consultations highlighted current market failures (as discussed in
Chapter 2) and offer a rationale for Government intervention;
The current and future size of the output gap and unemployment in the
UK suggest there is currently spare capacity in the economy. This is
assumed to be eroded by 2020;
Scenario B in Chapter 4 modelled the impact of raising the share of UK
content within the new build programme above a view of what the UK
supply chain can currently deliver, as represented by Scenario A. In
Scenario B it is assumed the UK will achieve the higher shares only from
the third reactor of the programme onwards.
Under the 10GW programme the UK supply chain only achieves higher
shares of new build activity after the output gap has closed in 2020.
Consequently the benefits to the UK economy (of increasing the UK
nuclear supply chain's capabilities) are concentrated solely on the direct
impacts, such as the “nuclear premium” of having people employed in
more productive jobs and R&D spillovers (the rest of the benefits are fully
displaced).
We estimate that the potential net impact of increasing UK nuclear supply
chain capability could be worth £468 million of GVA to the UK over the
period to 2030 under the 16.5GW programme in discounted terms (or
nearly £194 million under the 10GW programme);
Gross employment impacts are fully displaced in the 10GW programme
given our displacement assumptions and the timing of new builds. The
net employment impacts under the 16.5GW new build programme total
less than 400 job years of employment over the period; and
If the output gap were to take longer to erode (and therefore full
displacement to be realised in later years) the size of the net impacts
would increase.
5.1 Why the market alone will not deliver the optimal level of
investment in the UK nuclear supply chain
The consultations have identified a number of market failures and other barriers that will prevent the private sector from capturing more of the supply chain and
hence delivering the higher Scenario B. Figure 5.1 provides a high level

62
The economic benefit of improving the UK's nuclear supply chain capabilities
March 2013
overview of barriers to entry and expansion. The nuclear market is unique. The technical know-how and requirements for proven quality limit the ability of new firms to enter the market. This asymmetric information is just one source of
market failure in the UK nuclear supply chain. Another is the strength of established relationships in the supply chain form a further a barrier to entry.
Figure 5.1: Barriers to entry and expansion
For existing firms and for small to medium sized business the length of time
involved in being awarded a contract, to the date of delivery and ultimately payment, can be prohibitively long. Combined with the requirement to be able to cope with high initial costs means that there is a real risk of 'market power'30.
These barriers limit supply chain capability and the direct benefits that the UK
nuclear supply chain will receive from a new build programme. Consequently this in turn reduces the indirect and induced benefits that the wider UK economy would enjoy.
30 Her Majesty's Treasury guidance in "The Green Book" describes market power "as a
result of insufficient actual or potential competition to ensure that the market continues to
operate efficiently. High start-up costs can deter entry by competitors in the first place,
and therefore create market power".
Barriers to entry and expansion
Lack of nuclear
culture by new to nuclear companies
Skills and knowledge transfer
Lead times for new builds
Established relationships
Lack of regulation and
safety understanding
FinancialMarket failure restricts entry and expansion of the sector.

63
The economic benefit of improving the UK's nuclear supply chain capabilities
March 2013
This reduced level of activity could also translate through to reduced levels of R&D. Evidence shows that R&D spending by firms often leads to wider social benefits in excess of the private benefits enjoyed by the firm. This has led
academics to suggest that generally, expenditure on R&D will be below optimum levels (given the greater social return). If the barriers in Figure 5.1 prevent the UK from achieving higher levels of output then they are also likely to constrain
R&D spend and its potential spillovers. As such there is a clear market failure as the nuclear supply chain will not deliver the most efficient outcome.
Consequently, there is a clear rationale for Government intervention to support capability improvements in the UK supply chain and in doing so, encourage R&D
spend.
5.2 Displacement
5.2.1 Is spare capacity here to stay?
Figure 5.2 shows the historical ILO unemployment rate in the UK and a forecast to 2030. The effects of the recession are evident in the sharp increase in unemployment rates in 2009. Indeed we expect the rate of unemployment to
continue rising and peak in 2013 at 8.4%. This equates to an additional 1.07 million people unemployed since 2007.
Figure 5.2: UK ILO unemployment rate, 2000 to 2030
The magnitude of this increase suggests there is currently plenty of spare capacity in the economy. Over the short to medium term unemployment rates
are expected to moderate and fall to 5.7% by 2020. However, we do not expect unemployment to return to the record low levels enjoyed before the financial crisis.
Unemployment is expected to remain above record lows over the forecast period.
0.0%
1.0%
2.0%
3.0%
4.0%
5.0%
6.0%
7.0%
8.0%
9.0%
2000
2002
2004
2006
2008
2010
2012
2014
2016
2018
2020
2022
2024
2026
2028
2030
UK ILO unemployment
rate
Source: Oxford Economics, ONS
Forecast

64
The economic benefit of improving the UK's nuclear supply chain capabilities
March 2013
An analysis of the output gap in the UK (i.e. the current level of GDP versus the potential level of GDP) shows that the UK economy has had spare capacity since 2009 when it was some 4.8% below what it could have been producing.
Figure 5.3 shows Oxford Economics estimates of the output gap. Although there were some improvements in 2010 and 2011, the difficult macroeconomic environment widened the output gap in 2012. The sluggish nature of the
recovery and exogenous pressures suggest the UK will only slowly eradicate the output gap by 2029.
Figure 5.3: Oxford Economics' estimate of the UK output gap (% of potential GDP), 2000 to 2030
Measuring the output gap
The size of the output gap and the strength of potential output growth is hard
to estimate. As such, most commentators agree that the best approach is to
use a range of different indicators to try and proxy for the level of spare
capacity. But these indicators do not always corroborate one another, so a
high degree of judgment is often required on behalf of the forecaster.
Furthermore, economic data can often be subject to revision for many years
after the event, which makes ‘real-time’ estimates of the output gap
particularly difficult.
The Office of Budget Responsibility (OBR) last published their estimates of
the output gap in early December 2012 while the IMF published estimates in
October 2012 (see Table 5.1 for the short-term forecasts). There is a notable
difference between our estimates and those of the OBR. The differences are
due to the differing assumptions on degree to which the financial crisis has
permanently reduced potential output. The notion that the UK economy has
endured a permanent loss of potential output has significant implications for
economic policy.
The UK is operating below its potential capacity.
‐6.0%
‐5.0%
‐4.0%
‐3.0%
‐2.0%
‐1.0%
0.0%
1.0%
2.0%
3.0%
4.0%
2000
2002
2004
2006
2008
2010
2012
2014
2016
2018
2020
2022
2024
2026
2028
2030
UK output gap, % of potential
GDP
Source: Oxford Economics
Forecast
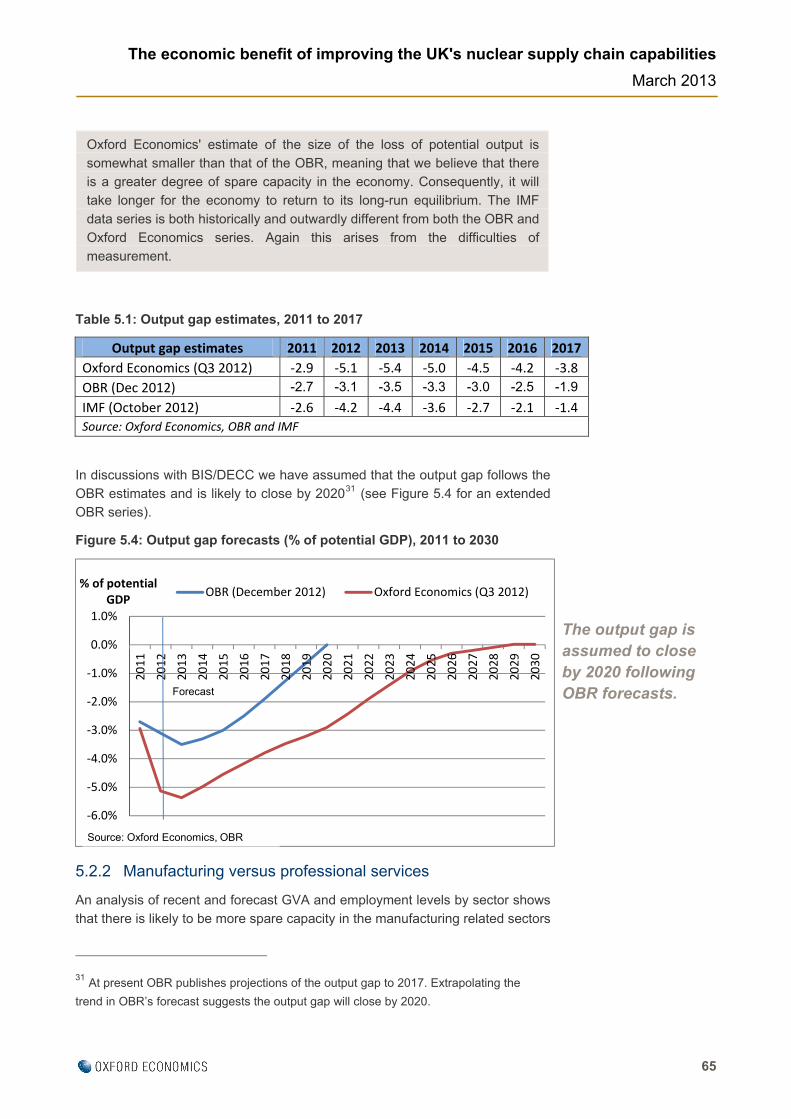
65
The economic benefit of improving the UK's nuclear supply chain capabilities
March 2013
Oxford Economics' estimate of the size of the loss of potential output is
somewhat smaller than that of the OBR, meaning that we believe that there
is a greater degree of spare capacity in the economy. Consequently, it will
take longer for the economy to return to its long-run equilibrium. The IMF
data series is both historically and outwardly different from both the OBR and
Oxford Economics series. Again this arises from the difficulties of
measurement.
Table 5.1: Output gap estimates, 2011 to 2017
Output gap estimates 2011 2012 2013 2014 2015 2016 2017
Oxford Economics (Q3 2012) ‐2.9 ‐5.1 ‐5.4 ‐5.0 ‐4.5 ‐4.2 ‐3.8
OBR (Dec 2012) -2.7 -3.1 -3.5 -3.3 -3.0 -2.5 -1.9
IMF (October 2012) ‐2.6 ‐4.2 ‐4.4 ‐3.6 ‐2.7 ‐2.1 ‐1.4
Source: Oxford Economics, OBR and IMF
In discussions with BIS/DECC we have assumed that the output gap follows the OBR estimates and is likely to close by 202031 (see Figure 5.4 for an extended OBR series).
Figure 5.4: Output gap forecasts (% of potential GDP), 2011 to 2030
5.2.2 Manufacturing versus professional services
An analysis of recent and forecast GVA and employment levels by sector shows that there is likely to be more spare capacity in the manufacturing related sectors
31 At present OBR publishes projections of the output gap to 2017. Extrapolating the
trend in OBR’s forecast suggests the output gap will close by 2020.
The output gap is assumed to close by 2020 following OBR forecasts.
‐6.0%
‐5.0%
‐4.0%
‐3.0%
‐2.0%
‐1.0%
0.0%
1.0%
2011
2012
2013
2014
2015
2016
2017
2018
2019
2020
2021
2022
2023
2024
2025
2026
2027
2028
2029
2030
% of potential GDP
OBR (December 2012) Oxford Economics (Q3 2012)
Forecast
Source: Oxford Economics, OBR

66
The economic benefit of improving the UK's nuclear supply chain capabilities
March 2013
of the nuclear supply chain than the professional services related sectors. Annex B contains plots of GVA and employment for the following sectors of the UK economy (all of which contain an element of the nuclear supply chain):
Manufacture of basic metals;
Manufacture of fabricated metal products;
Manufacture of computer electronic and optical;
Manufacture of electrical equipment;
Manufacture of machinery and equipment (not elsewhere classified);
Other manufacturing;
Repair and installation of machinery and equipment;
Construction of buildings;
Civil engineering;
Specialised construction activities;
Computer programming, consultancy and related;
Architectural and engineering activities;
Scientific research and development; and
Other professional, scientific and technical.
We have undertaken an analysis of each sector to determine the likely level of
spare capacity currently and over the forecast period. We have then used this to make an assumption on the potential level of displacement over time.
Applying displacement assumptions
English Partnerships' October 2008 "Additionality Guide Third Edition"
provides guidance on making assumptions on these types of projects. It
notes that investments with a low level of displacement should be assigned a
25% displacement effect. This compared to a 50% displacement effect for
medium displacement and 75% for high levels of displacement.
Why adjust displacement assumptions over time?
In the absence of a new build programme (i.e. the counterfactual), over time
the economy will recover and labour and capital will be utilised in other parts
of the economy. The output gap will narrow (Figure 5.2) and unemployment
rates will fall (Figure 5.1). Those that could have been employed in the
nuclear supply chain if there was a new build programme will find
themselves in employment anyway, most likely in the similar broad sectors.
If this is the case then displacement will be higher in the future than it will be
in the shorter-term. Consequently, we have adjusted our displacement
assumptions over time.

67
The economic benefit of improving the UK's nuclear supply chain capabilities
March 2013
However, given nuclear activity tends to be more productive and higher paid
than similar jobs (see Section 4) we need to take account of this 'nuclear
premium'. The additional productivity offered through a nuclear job will lift
output above the counterfactual position; while higher wages will push up
consumer spending (therefore indirect and induced impacts will move in
line). Furthermore, if nuclear related activity requires more R&D than the
average activity in these sectors then the economy will enjoy greater
spillover benefits.
Broadly speaking all the manufacturing sub-sectors have been shedding jobs
and losing output over the last decade due to continued restructuring towards a service-based economy. The recession has sped up this trend. Consequently, current levels of displacement are likely to be 'low' in the manufacturing sub-
sectors. English Partnership's guidance would suggest an initial assumption of 25%. In agreement with BIS and DECC, to account for the more skilled nature of nuclear manufacturing we have raised this initial level of displacement to 30%.
Given this, and our forecasts for further contraction in manufacturing sub-sectors, we believe that there is likely to be some degree of spare capacity in these sectors until approximately 2020 when the output gap is eradicated in the
UK. As such we assume displacement rises gradually to 100% in 2020 (see Table 5.2).
Construction and manufacturing assumed to have notably spare capacity relative to professional services.

68
The economic benefit of improving the UK's nuclear supply chain capabilities
March 2013
Table 5.2: Displacement assumptions (2012 to 2030)
Manufacturing Construction Professional services
2012 30% 25% 60%
2013 39% 34% 68%
2014 48% 44% 76%
2015 56% 53% 84%
2016 65% 63% 92%
2017 74% 72% 100%
2018 83% 81% 100%
2019 91% 91% 100%
2020 100% 100% 100%
2021 100% 100% 100%
2022 100% 100% 100%
2023 100% 100% 100%
2024 100% 100% 100%
2025 100% 100% 100%
2026 100% 100% 100%
2027 100% 100% 100%
2028 100% 100% 100%
2029 100% 100% 100%
2030 100% 100% 100%
Source: Oxford Economics based on discussions with BIS and DECC.
Construction related sectors have been significantly affected by the downturn and will also have spare capacity. Consequently, current levels of displacement are also likely to be 'low (i.e. 25%)'. We have assumed construction activity, like
manufacturing experiences a steady increase in displacement until it reaches 100% in 2020.
The professional services sectors that incorporate elements of the nuclear supply chain have experienced very different trends. All have grown rapidly
since the mid-1990s and although the downturn has had some impact, the outlook is for continued growth (see Annex B for detailed forecasts). Despite higher education providing a good annual supply of new graduates with the
relevant skills required in these sectors, the pace of anticipated growth in the UK over the forecast period suggests that spare capacity will be eroded more quickly in the professional services sectors. Displacement is therefore likely to
be somewhere between 'medium' and high (50% and 75% levels of displacement respectively according to English Partnerships) and rise to 100% by 2017. We have therefore assumed an initial level of displacement of 60%.
It is worth noting that the displacement assumptions used in the modelling
are at a national level and thus could mask regional differences.

69
The economic benefit of improving the UK's nuclear supply chain capabilities
March 2013
Again, nuclear related activities offer above average productivity and earnings. As noted earlier in the report we adjusted productivity in the model to take account of this 'nuclear premium' (though we assume that 50% of the gross jobs
attract labour from other high value added energy producing sectors and therefore the jobs do not offer a premium). The premium arises partially due to the higher occupational structure of the sector and partially due to nuclear wage
premiums. Our earlier estimates of this nuclear premium suggest that manufacturing activity enjoys a 20% premium while professional services related activity enjoys a 10% premium. This means that despite there being 100%
displacement (i.e. no net new jobs) the level of direct economic output and consumption is higher relative to the counterfactual.
5.3 The net impact to the UK economy
In modelling the net impacts of the UK nuclear supply chain capturing the higher (Scenario B) share of the new build programme, we have modelled the
following:
Net direct output, GVA and jobs: these are the output, GVA and jobs created that otherwise would not exist if the nuclear new build had not gone ahead i.e. the counterfactual. Job chain theory suggests that
unemployment should fall in line with the number of net new jobs, as long as there is spare capacity in the economy;
What are job-chains?
Most impact studies measure job creation and the associated welfare
benefits. But who actually takes a job? Is it someone from the pool of the
unemployed or someone else currently in employment in a different part of
the economy? In reality of course it can be both. So how do we measure the
impact of job creation?
Job-chain theory describes the process where the creation of a new job in
the economy will lead to a reduction in the unemployed by a similar amount.
If the new job is taken up by someone already currently employed then their
previous position will need filed. If this now vacant job is filled by someone
who was also currently unemployed then their previous job will need filled
also, and so on.
We can assume that individuals will move only to take on better paid or more
senior positions. Consequently there is 'vertical' movement of labour. In
theory, if we follow this process, then someone in the economy will
eventually have to come off the ranks of the unemployed to fill a job
vacancy.
Of course in practice there will be issues of skills mismatch and experience
that may restrict the fluidity and accuracy of the process. However, in this
type of analysis we often assume that for every net new job created in the

70
The economic benefit of improving the UK's nuclear supply chain capabilities
March 2013
economy, there will be a similar fall in unemployment. Therefore the impact
of the job is the total output that they produce.
The nuclear premium of the displaced direct jobs: we assume that a nuclear related job has replaced a job that would have occurred in the wider sub-sector. The benefits of these jobs are the nuclear premium i.e. the
additional output/GVA over and above what would have been created by a similar non-nuclear job due to nuclear-related jobs being more productive on average.
The indirect and induced output arising from the net direct impacts
above; and
R&D spillovers: these benefits capture the wider social return from investment in R&D. The analysis is consistent with BIS guidance (see Annex A). We depreciate our stock of R&D spend each year by 15%, apply
an annual displacement assumption of 25% that rises to 100% by 2020 (i.e. when the UK output gap is eroded), apply an annual leakage rate of 25% per year and finally assume a gross external return of 25%.
The modelling has not included the following:
A nuclear R&D premium: like the nuclear premium on jobs, there may be
an R&D nuclear premium. In other words R&D spending in the nuclear supply chain results in more spillovers than those experienced in non-nuclear sectors. Given a lack of data recent or historic data we are unable
to estimate this potential area of benefits;
Costs: we have not included any cost estimation in this analysis. We have estimates of the potential R&D and capital costs to the private sector however these costs would also be benefits to the wider economy as they
would stimulate demand outside the sector. Given the focus of this section is on the net impact to the UK economy we felt it was appropriate to exclude these. In addition the modelling does not include any public sector
costs (for example the costs of training).
5.3.1 Net direct impacts
Table 5.3 shows our estimates of the net direct impact of achieving Scenario B relative to Scenario A under the 10GW programme. The figures exclude the
GVA impact of the R&D spillovers which are discussed in more detail below. The overall gross employment impacts are estimated to be completely displaced in the 10GW programme given our assumptions on when the reactors are built, the
speed of increase in UK capabilities and the sectoral displacement assumptions. The “nuclear premium” accounts for the net benefits on output and GVA of achieving Scenario B. Overall gross output and GVA impacts are reduced by
over 84% to nearly £691 million and £291 million respectively. Discounting the
Net impacts are notably lower than the gross impacts given our assumptions around displacement.

71
The economic benefit of improving the UK's nuclear supply chain capabilities
March 2013
net direct GVA benefits using a 3.5% real discount rate32 gives a Net Present Value (NPV) of £194 million.
Table 5.3: Net impact of Scenario B relative to Scenario A, 10GW
programme, 2012 to 2030 cumulative
We find the similar trends for the 16.5GW programme with gross output and GVA being reduced by 83% to nearly £1.5bn and just over £600 million respectively (see Table 5.4). On a discounted basis the NPV of the net direct
GVA impact is £441 million. Given our displacement assumptions (i.e. full displacement by 2020), the gross employment estimates shown in the previous section are nearly all displaced. We estimate that net employment impacts are
likely to be less than 400 job years over the period (the vast majority from activity on the non-nuclear island).
32 Following official guidance from “The Green Book, Appraisal and Evaluation in Central
Government”, HM Treasury (2003).
Output, £m (2012
prices)
GVA, £m (2012
prices)
Pre‐licensing costs, Technical & design £0 £0
Regulatory, licensing & public enquiry £0 £0
Programme & construction management £34 £17
Civil construction & installation £135 £52
Nuclear Steam Supply System £84 £36
Balance of nuclear island £169 £71
Non‐nuclear island £270 £114
Instrumentation & control £0 £0
Fuel £0 £0
Infrastucture cost £0 £0Total £691 £291
Net impact (2012 to 2030), excludes
R&D spillovers
Source: Oxford Economics and Atkins
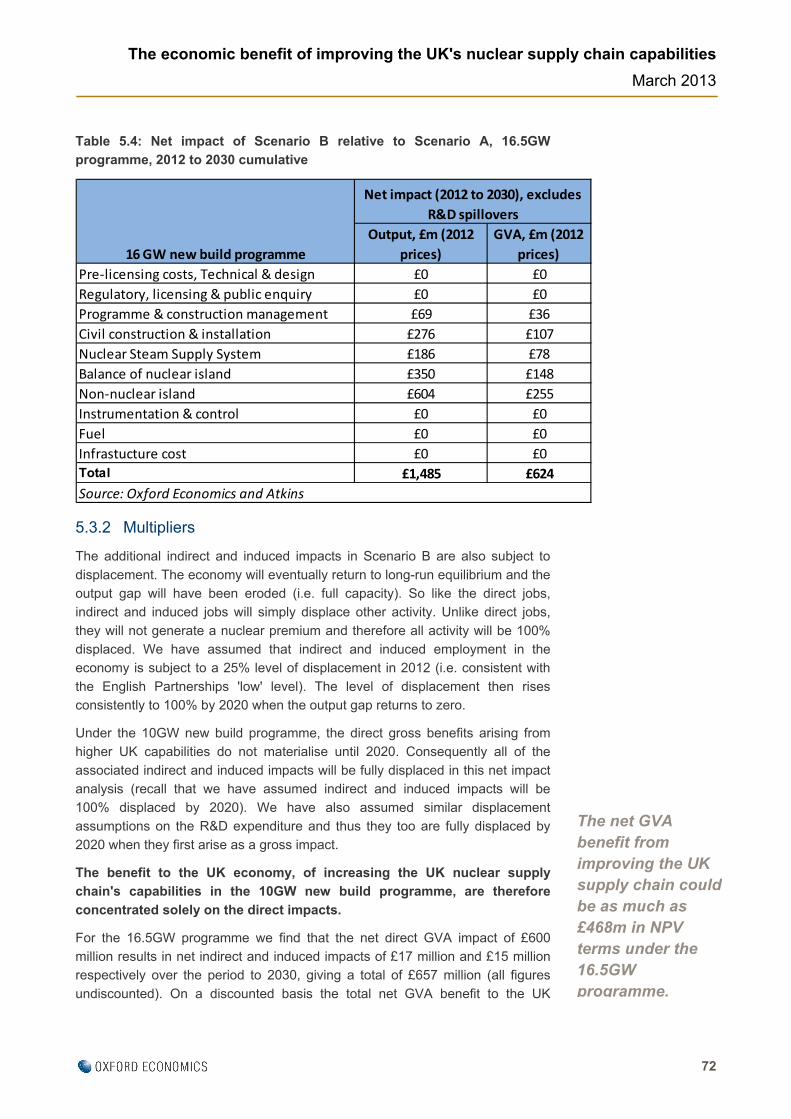
72
The economic benefit of improving the UK's nuclear supply chain capabilities
March 2013
Table 5.4: Net impact of Scenario B relative to Scenario A, 16.5GW programme, 2012 to 2030 cumulative
5.3.2 Multipliers
The additional indirect and induced impacts in Scenario B are also subject to
displacement. The economy will eventually return to long-run equilibrium and the output gap will have been eroded (i.e. full capacity). So like the direct jobs, indirect and induced jobs will simply displace other activity. Unlike direct jobs,
they will not generate a nuclear premium and therefore all activity will be 100% displaced. We have assumed that indirect and induced employment in the economy is subject to a 25% level of displacement in 2012 (i.e. consistent with
the English Partnerships 'low' level). The level of displacement then rises consistently to 100% by 2020 when the output gap returns to zero.
Under the 10GW new build programme, the direct gross benefits arising from higher UK capabilities do not materialise until 2020. Consequently all of the
associated indirect and induced impacts will be fully displaced in this net impact analysis (recall that we have assumed indirect and induced impacts will be 100% displaced by 2020). We have also assumed similar displacement
assumptions on the R&D expenditure and thus they too are fully displaced by 2020 when they first arise as a gross impact.
The benefit to the UK economy, of increasing the UK nuclear supply chain's capabilities in the 10GW new build programme, are therefore
concentrated solely on the direct impacts.
For the 16.5GW programme we find that the net direct GVA impact of £600 million results in net indirect and induced impacts of £17 million and £15 million respectively over the period to 2030, giving a total of £657 million (all figures
undiscounted). On a discounted basis the total net GVA benefit to the UK
Output, £m (2012
prices)
GVA, £m (2012
prices)
Pre‐licensing costs, Technical & design £0 £0
Regulatory, licensing & public enquiry £0 £0
Programme & construction management £69 £36
Civil construction & installation £276 £107
Nuclear Steam Supply System £186 £78
Balance of nuclear island £350 £148
Non‐nuclear island £604 £255
Instrumentation & control £0 £0
Fuel £0 £0
Infrastucture cost £0 £0
Total £1,485 £624
Source: Oxford Economics and Atkins
16 GW new build programme
Net impact (2012 to 2030), excludes
R&D spillovers
The net GVA benefit from improving the UK supply chain could be as much as £468m in NPV terms under the 16.5GW programme.

73
The economic benefit of improving the UK's nuclear supply chain capabilities
March 2013
economy is an estimated £468 million. The net indirect and induced employment impacts associated with these levels of GVA are estimated to around 300 job years in both cases.
Table 5.5: Net direct, indirect and induced impacts and R&D spillovers of Scenario B relative to Scenario A, 16.5GW programme, 2012 to 2030 cumulative
We estimate that the gross impacts of R&D spillovers are fully displaced in all
years except 2018 and 2019. The total net impact however only totals £0.3m, meaning that the bulk of the 16.5GW new build programme impacts are concentrated in the direct GVA.
5.4 An additional £468 million to the UK
We estimate that the potential net impact of increasing UK nuclear supply
chain capability (i.e. achieving Scenario B) could be worth £468 million of GVA to the UK by 2030 on a discounted basis under a 16.5GW new build programme, or £194 million under the 10GW programme.
Assumptions on the scale of the output gap and associated displacement
assumptions mean that the gross employment impacts are effectively displaced in the 16.5GW programme (and fully displaced in the 10GW programme). Similar assumptions for R&D spillovers mean they too are lost in the net impact
analysis.
If the output gap were to take longer to erode (and therefore full displacement to be realised in later years) the size of the net impacts would increase. Under the 10GW programme, the UK nuclear supply chain is not assumed to realise gross
additional benefits from the improved capabilities until 2020 (and peak in 2024). Under the 16.5GW programme, improved capabilities and additional gross benefits are not expected until 2017 and to peak in 2020.
UK new build value (output), £ millions, 2012
prices
GVA, £ millions, 2012 prices
Employment (job years), 000s
Direct £1,485 £624 0.4
Indirect £38 £17 0.3
Induced £30 £15 0.3
R&D spillovers N/A £0 N/A
Total £1,554 £657 1.0
Source: Oxford Economics and Atkins
Note: it is not appropriate to estimate productivity for direct jobs in the table above
given the inclusion of the nuclear premium in the output and GVA figures. See Section 5
for further details.

74
The economic benefit of improving the UK's nuclear supply chain capabilities
March 2013
It should be noted that this indicative calculation of net benefits at £194m and £468m (discounted) for the 10GW and 16.5GW programmes respectively does not include the potential costs of investment and training which may be required
to achieve the increased UK content scenario or the potential benefits from export opportunities.

75
The economic benefit of improving the UK's nuclear supply chain capabilities
March 2013
6 Realising the potential
There is clearly scope for the UK nuclear supply chain to deliver greater shares
of the new build programme. To achieve our upper scenario (Scenario B) all nuclear supply chain stakeholders will have a role to play. This section provides suggestions on how the public sector and industry bodies can help support the
supply chain in realising its potential.
It then considers the recently launched Nuclear Supply Chain Action Plan33, and provides some indicative analysis of the potential impact of the broad packages of Actions contained within it.
6.1 Supporting the sector: findings from this study
The consultation exercise revealed that industry bodies and the private sector
were in general agreement that without intervention the UK nuclear supply chain would only deliver between 45% and 50% of the new build requirements. They were also in general agreement that this share could be higher given the right
environment, working practices and with the right support. Using their feedback and our collective professional judgement we make a number of recommendations. Figure 6.1 below provides an overview of how the UK nuclear
supply chain could deliver additional components of the new build programme and strengthen its export performance.
33https://www.gov.uk/government/uploads/system/uploads/attachment_data/file/65658/71
76-nuclear-supply-chain-action-plan.pdf
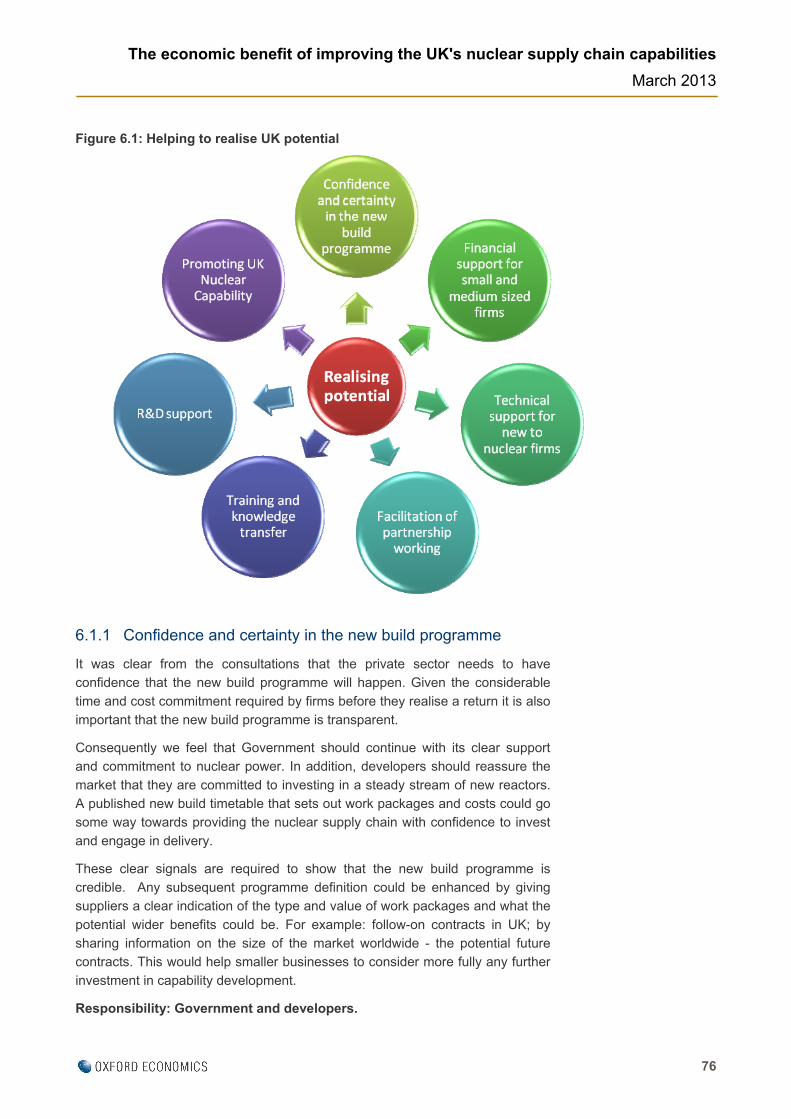
76
The economic benefit of improving the UK's nuclear supply chain capabilities
March 2013
Figure 6.1: Helping to realise UK potential
6.1.1 Confidence and certainty in the new build programme
It was clear from the consultations that the private sector needs to have confidence that the new build programme will happen. Given the considerable
time and cost commitment required by firms before they realise a return it is also important that the new build programme is transparent.
Consequently we feel that Government should continue with its clear support and commitment to nuclear power. In addition, developers should reassure the
market that they are committed to investing in a steady stream of new reactors. A published new build timetable that sets out work packages and costs could go some way towards providing the nuclear supply chain with confidence to invest
and engage in delivery.
These clear signals are required to show that the new build programme is credible. Any subsequent programme definition could be enhanced by giving suppliers a clear indication of the type and value of work packages and what the
potential wider benefits could be. For example: follow-on contracts in UK; by sharing information on the size of the market worldwide - the potential future contracts. This would help smaller businesses to consider more fully any further
investment in capability development.
Responsibility: Government and developers.

77
The economic benefit of improving the UK's nuclear supply chain capabilities
March 2013
6.1.2 Financial support for small and medium sized firms
Industry and private sector consultations reported that the financial commitment required to be involved in nuclear new build is considerable. As noted above, the time it takes to realise returns puts small and medium firms who require a
regular cash flow at a disadvantage. The issue of financial support becomes even more significant if companies need to invest in business R&D before they can compete and capture work packages.
A staggered approach to payments, rather than payment on delivery may
support further involvement by UK firms. In addition, greater financial support on R&D could encourage the private sector to become more innovative and globally competitive. Some consideration of financial incentives (e.g. tax relief or grants)
should be considered to support small to medium enterprises in ‘first-of-a-kind’ business development activities. This could help offset the cost where there is a risk of relatively huge expenditure and potential overspend in ‘loss leader’
implementation, effectively supporting the learning and development during the commercial process.
Responsibility: Government.
6.1.3 Technical support for new to nuclear firms and facilitation of partnering
It was suggested that new to nuclear firms need more support than they currently receive to help them understand the nuclear culture and the key considerations in engaging in business development activities. There is a
perception that since the initial vendor engagement with the supply chain, only limited commercial activity has been achieved. It might be beneficial to provide a facilitated platform through the NIA that keeps the potential supply chain (in
particular the new-to-nuclear) informed and engaged. This should include explanation of programme timescales and changes.
This would include making potential suppliers aware of opportunities and who they should be communicating with in the nuclear industry to develop the
appropriate relationships. This should be complemented by the development of relevant training programmes / seminars.
Responsibility: Government and the NIA.
6.1.4 Facilitation of partnership working
A key differentiator for supply chain companies is appreciation of the nuclear
culture. Whilst training activities may support this, gaining the knowledge required could be achieved through partnership arrangements. Partnerships between new to nuclear businesses and experienced companies should be
facilitated. This might be a consideration for the NIA. For partnering with overseas companies it is probable that UKTI and FCO could help.
Responsibility: Government and the NIA could arrange and promote, the private sector will need to engage and embrace the opportunities.
78
The economic benefit of improving the UK's nuclear supply chain capabilities
March 2013
6.1.5 Training and knowledge transfer
Specific areas of concern for new to nuclear were the understanding of the nuclear culture in business development such as commercial awareness that includes safety, regulatory appreciation and quality assurance in the nuclear
context. It was suggested that a number of training courses need to be set up to facilitate informed working practices. This spans areas such as technical specifications, regulatory and more general know how. For example, there is a
strong argument that companies at Tier 2 or below need training on how to respond to requests for information from Tier 1 companies.
In addition, most consultees commented on the ageing workforce in nuclear activities. In most cases they made it clear to Oxford Economics and Atkins that
more was needed to be done to ensure knowledge transfer between experienced and inexperienced staff. This was more likely to be lead internally within firms, however, it is hoped that the initiative under the Nuclear Research
and Development Board, Academic Skills, sub group will promote best practice following their review.
The current training and development (including Higher Education and R&D) is confusing as there are too many interested parties. Some academics expressed
concern at mandatory affiliations; however, the only body suggested by the respondents to support co-ordination and facilitation was the National Skills Academy Nuclear. As the industry body representative it is already engaged in
facilitating some training development, through its quality assured provider network, and is considered best placed to ensure the industry buy-in and support of any initiatives.
It should be noted that the skills academy is undertaking a development of the
Nuclear Skills Passport (NSP) to capture the nuclear ‘skills taxonomy’ for use in the supply chain. The ambition is to use the NSP platform to enable companies to develop staff with the skills appropriate for the sector. The platform will also
serve as a repository of benchmarked skills and will aid identification of the sector experts, providing a mechanism to highlight areas of declining capability that requires intervention.
Responsibility: The National Skills Academy Nuclear (and broader skills
agencies and training providers) should continue to offer training. The private sector will, in addition, have to introduce in-house training and systems to ensure knowledge is passed throughout the firm.
6.1.6 Research & Development support
R&D suffers from a lack of strategy both in the short term and in long term planning. In addition, funding appears to be available for the near term projects -The House of Lords report section on Building a framework to promote
commercial exploitation stated "At present, the Technology Strategy Board does not have the remit to fund work that is so far away from market. This means there is a gap for applied long-term research within the current bodies that fund,

79
The economic benefit of improving the UK's nuclear supply chain capabilities
March 2013
or conduct research". Private investment also struggles because the lack of clarity of a long-term energy policy.
It is suggested Government need to decide whether they wish UK industry to take a co-ordinated approach to R&D, specifically the Generation IV
technologies. If so, Government should provide the co-ordination activities to support them. The output could be decisions on what, why and how R&D should be undertaken with relevant targets to monitor progress.
Responsibility: Government
6.1.7 Promotion of the UK Capability
The UK has capabilities that have been either overshadowed by ‘nuclear nations’ or undermined by the decline of new build since Sizewell B. It would aid UK business if an initiative similar to the FCO’s ‘The UK Education, Skills and
Training Directory’ was produced to expand on the UK delivery capabilities. Whilst many large companies are able to promote their own capability, small and medium size enterprises are less able.
One approach could be to highlight supplier experience through a directory of
case studies and experience statements.
Responsibility: NIA
6.2 The Nuclear Supply Chain Action Plan (Dec 2012)
The Nuclear Supply Chain Action Plan has been developed by Government in partnership with industry to maximise UK benefits from activity associated with the whole nuclear fuel cycle, including nuclear new build. The Action Plan has
the following key objectives:
To maximise UK economic activity and growth from the nuclear sector at national and local level, including employment and business opportunities for the UK supply chain;
To boost job creation in the nuclear industry, and to ensure that potential
skills shortages do not act as a barrier to the future development of the industry in the UK;
To use the domestic nuclear market to provide a platform for enhancing a sustainable and successful UK civil nuclear industry, with areas of global
commercial advantage built on a domestic platform for export, economic growth and jobs;
To maintain and develop a vibrant supply chain covering key capabilities to deliver safe, innovative and cost effective clean-up of the legacy facilities
and to exploit synergies with new build; and
To raise awareness across the supply chain, including UK industry, of nuclear sector opportunities, to identify barriers preventing access to those

80
The economic benefit of improving the UK's nuclear supply chain capabilities
March 2013
opportunities and to develop actions for Government and Industry that will help place the supply chain in a stronger position to compete for those opportunities.
The Action Plan therefore addresses many of the issues and recommendations
highlighted in this study which would enable the UK to deliver more of the nuclear new build programme. The Action Plan consists of 30 specific actions, involving government and industry bodies, categorised into three broad areas:
1) Market Access: Consists of actions to tackle issues such as:
confidence in Government’s commitment to nuclear new build; improving companies’ understanding of nuclear opportunities (in the UK and abroad), how to get involved and the requirements of suppliers; and
clarity on new build timetables;
2) Capability: Actions aimed at: enhancing capabilities and competitiveness within the UK chain; ensuring UK companies understand quality requirements of nuclear products/services; improving
collaboration between clients and contractors to reduce risks, ensure best practices and increase productivity.
3) Skills: Actions in this area are aimed at: encouraging industry to define and articulate skills requirement; improving market intelligence on skills
demand/supply and gaps; and ensuring funding is available for training; and ensuring the availability and retention of labour with necessary nuclear-related skills.
This study has undertaken illustrative modelling of the potential economic
impacts of the Action Plan in each of these three areas. The modelling was based on analysis of the potential effectiveness of individual actions within each area, and their impact on the UK share of nuclear new build by activity type
(e.g., Nuclear Steam Supply System, Nuclear Island etc.). This analysis was conducted by Atkins, peer-reviewed by an industry expert and finalised with the agreement of DECC/BIS. However, the impacts of the actions are still subject to
a high level of uncertainty and consequently the results are intended to be indicative of the potential effects of the three main packages of policy actions and the Action Plan policies as a whole.
6.2.1 Action Plan modelling assumptions
Oxford Economics and Atkins, along with BIS and DECC, reviewed the various actions in the Action Plan and agreed on a series of assumptions on the potential impact that each bundle of actions could have on the UK's share of the
nuclear supply chain. Table 6.1 summarises the assumptions on the extent to which the policy packages and the Action Plan policies as a whole could potentially increase the level of UK content within a single reactor. The Scenario
A share representing current UK capabilities (modelled and presented in Section 4) is shown in the first row, representing the estimated share of activity which the UK will provide under current conditions (44%). The remaining rows present the

81
The economic benefit of improving the UK's nuclear supply chain capabilities
March 2013
potential indicative increase in the total UK share of a single reactor as a result of the actions in each Action Plan area.
As mentioned above the approach adopted means the three areas (Market Access, Capability and Skills) are considered on their own. It is NOT possible to
add up the impact of the three areas to give an estimate of the total impact of the Action Plan as this would result in double counting of some effects where there are inter-linkages between policies across the three packages. However the
table does show an estimated impact for all the policies in the Action Plan. This is also highly illustrative and based on the assumption that the impact of the whole Action Plan is (broadly) the same as the assumed uplift from the “Market
Access” policies i.e. the policy package with the estimated potential highest impact. Consequently, this could be viewed as a conservative assumption as it assumes little additionality from the actions in the other policy packages above
that from “Market Access” actions. The assumptions under the higher Scenario B (presented in Section 4) are also shown in the table for comparison.
Table 6.1: Action Plan assumptions on the potential UK share of nuclear new build for a single reactor
Market Access: This area provides the greatest opportunity to increase the
UK share of new build activity. The consultations found that companies needed confidence in Government’s commitment to nuclear new build; while potential new-to-nuclear suppliers also needed to be aware of the
opportunities available to them and how to get involved, and have an appreciation of the nuclear safety culture and tender requirements in order to bid successfully work new build work. Actions which should help resolve
such issues include the setting up of the Nuclear Industry Council (NIC), upgrading of the SC@Nuclear website to act as an information portal, the work of the Nuclear AMRC on improving capabilities of firms during the
tender/bid process, and the work of the NIA/NIC to encourage transparency regarding contracts, procurement and timings.
Capability: The NIA, NIC and Nuclear AMRC will be important to improving the capabilities of potential UK suppliers of work throughout the nuclear
cycle. However, the scope to improve market share is limited in some areas
“Market Access” actions are assumed to have most potential to raise the UK supply chain’s share of nuclear new build.
Share of value of a single reactor
44%
"Market Access" impact 11%
"Capability" impact 8%
"Skills" impact 7%
Action Plan (whole) 12%
Scenario B impact 19%
Scenario A UK share
Source: Atk ins, DECC, BIS, Oxford Economics
Additional UK share relative to Scenario A
(% points)

82
The economic benefit of improving the UK's nuclear supply chain capabilities
March 2013
(e.g. non-nuclear island and programme management) as capability is already high and is not the main issue.
Skills: the area of skills has been seen as an area of relative strength for the UK (see the consultation findings earlier in this report), though there are
issues with an aging workforce and support to business to understand future skill requirements. The Action Plan includes measures for Cogent and NESA to support work within the industry to ensure availability of skills.
They also include actions for the NAMRC to run workshops and offer training for example. Skills development and capability are inter-dependent.
Action Plan (whole): The modelling of the Action Plan as a whole assumes the impact on each activity category (e.g. programme
management, construction etc.) is equal to the impact from the most effective Action Plan area (Market Access, Capability or Skills) in each activity category. The scale of impact is very close to “Market Access”, as
this policy area has the highest impact on nearly all activity categories. As mentioned previously this could be viewed as a conservative assumption as it assumes little additionality over and above “Market Access” impacts.
6.2.2 Action Plan modelling results: gross impacts
The following sub-section summarises the economic impact of the three Action Plan areas and the Action Plan as a whole relative to Scenario A. The results therefore illustrate the potential uplift from the Action Plan from the UK’s current
capabilities. Again these estimates are indicative only and the results for each package cannot be summed together to estimate the overall likely impact of the Action Plan (and any associated private sector activity required to support it).
The figures presented are the gross “total” impacts, consisting of the sum of direct, indirect and induced effects. As with the modelling of Scenario B under the 10GW and 16GW programme, we assume that the UK nuclear supply chain
only achieves the increased share corresponding with each Action Plan area (and the Action Plan as a whole) from the third reactor onwards. The first two reactors assume the lower Scenario A UK shares in all cases
Table 6.2 presents the additional output, GVA and employment (before
accounting for displacement) which result from the Action Plan modelling under the 10GW programme. The Scenario B results from Section 5 are also presented for comparison. “Market Access” actions are expected to have the
greatest impact on the share of nuclear new build captured by the UK and hence the greatest benefit to UK economic activity. “Market Access” actions are estimated to result in an additional £2.7 billion in UK GVA compared with
Scenario A under the 10GW programme (on a gross basis before accounting for displacement effects). By comparison “Capability” actions are expected to boost UK GVA by £1.9 billion and “Skills” actions by £1.7 billion. The Action Plan as a
whole is estimated to boost UK GVA by £6.4 billion.
In employment terms, “Market Access” actions lead to an additional 38,800 job years for the UK, compared with 25,900 jobs years from “Capability” actions and

83
The economic benefit of improving the UK's nuclear supply chain capabilities
March 2013
25,700 from “Skills” actions. The whole Action Plan is expected to lead to an additional 40,700 job years for the UK. Note the estimates above do not take into account any export benefits that could be realised with improvements to UK
capability.
Table 6.2: Additional benefits to the UK economy due to the Action Plan (pre-displacement), 10GW programme
Table 6.3 reports the additional impacts resulting from the three Action areas under the 16.5GW programme. Market Access actions lead to an additional £5.6 billion in UK GVA over and above Scenario A under the 16.5GW programme
(before accounting for displacement effects). “Capability” actions are expected to raise UK GVA by £3.8 billion and “Skills” actions by £3.6 billion. The Action Plan as a whole, meanwhile, is expected to increase GVA by £5.9 billion. In terms of
employment “Market Access” actions lead to an additional 82,600 job years for the UK, compared with 55,200 jobs years from “Capability” actions and 54,700 from “Skills” actions. The Action Plan in its entirety is estimated to boost
employment by 86,800 job years.
Table 6.3: Additional benefits to the UK economy due to the Action Plan (pre-displacement), 16.5GW programme
UK new build value
(output), £ millions,
2012 prices
GVA, £ millions,
2012 prices
Employment (job
years), 000s
Scenario B 10,451 4,720 67.2
"Market Access" actions 6,052 2,740 38.8
"Capability" actions 4,126 1,857 25.9
"Skills" actions 3,894 1,747 25.7
Action Plan (whole) 6,383 2,888 40.7
Additional (gross) benefit to UK relative to baseline
(direct+indirect+induced)
Source: Oxford Economics estimates based on Atkins, DECC and BIS assumptions
UK new build value
(output), £ millions,
2012 prices
GVA, £ millions,
2012 prices
Employment (job
years), 000s
Scenario B 21,409 9,669 143.0
"Market Access" actions 12,399 5,612 82.6
"Capability" actions 8,453 3,804 55.2
"Skills" actions 7,976 3,579 54.7
Action Plan (whole) 13,075 5,916 86.8
Additional (gross) benefit to UK relative to baseline
(direct+indirect+induced)
Source: Oxford Economics estimates based on Atkins, DECC and BIS assumptions

84
The economic benefit of improving the UK's nuclear supply chain capabilities
March 2013
6.2.3 Action Plan modelling results: net impacts
Table 6.4 summarises the impact of Action Plan areas on the 10GW programme once displacement effects have been taken into consideration (i.e. the net impact). GVA estimates are presented in undiscounted and discounted terms.
As mentioned the results are based on an indicative set of assumptions agreed between Oxford Economics, Atkins, BIS and DECC on the potential impact of the Action Plan on the various types of activity within a new build programme
(e.g. construction, programme management, nuclear island etc.). Also the estimates above do not take into account any export benefits that could be realised with improvements to UK capability.
In line with the pre-displacement results reported in Table 6.2, “Market Access”
actions have the largest effect on UK activity on a net basis. “Market Access” actions are expected to provide a net boost of £116 million to UK GVA relative to Scenario A in discounted terms. By comparison “Capability” actions are
expected to boost UK GVA by £85 million and “Skills” actions by £67 million. As a whole the Action Plan is expected to increase UK GVA by £124 million. With respect to employment, as discussed in Section 5.3.1, all gross impacts are
displaced under the 10GW programme.
Table 6.4: Additional benefits to the UK economy due to the Action Plan (net impact, post-displacement), 10GW programme
Table 6.5 illustrates the net impact of Action Plan areas on the 16.5GW. “Market
Access” actions are estimated to provide a net boost of £279 million to UK GVA relative to Scenario A on a discounted basis. Meanwhile “Capability” actions are expected to boost UK GVA by £204 million and “Skills” actions by £156 million.
The whole Action Plan is expected to increase UK GVA by £299 million. In employment terms “Market Access” actions lead to a net additional 600 job years for the UK (the same as for the entire Action Plan), compared with 400
jobs years from “Capability” actions and 200 from “Skills” actions.
Undiscounted Discounted
Scenario B 691 291 194 0.0
"Market Access" actions 410 173 116 0.0
"Capability" actions 304 128 85 0.0
"Skills" actions 242 101 67 0.0
Action Plan (whole) 439 185 124 0.0
Additional (net) benefit to UK relative to baseline
(direct+indirect+induced)
GVA, £ millions, 2012 pricesUK new build value
(output), £ millions, 2012
prices, undiscounted
Employment
(job years), 000s
Source: Oxford Economics estimates based on Atkins, DECC and BIS assumptions

85
The economic benefit of improving the UK's nuclear supply chain capabilities
March 2013
Table 6.5: Additional benefits to the UK economy due to the Action Plan (net impact, post-displacement), 16.5GW programme
It should be noted that this indicative calculation of net benefits at £124m and £299m (discounted) for the 10GW and 16.5GW programmes respectively does
not include the potential costs of investment and training which may be required to achieve the increased UK content scenario or the potential benefits from export opportunities.
Undiscounted Discounted
Scenario B 1,554 657 468 1.0
"Market Access" actions 923 392 279 0.6
"Capability" actions 678 287 204 0.4
"Skills" actions 527 222 156 0.2
Action Plan (whole) 989 419 299 0.6
Source: Oxford Economics estimates based on Atkins, DECC and BIS assumptions
GVA, £ millions, 2012 pricesUK new build value
(output), £ millions, 2012
prices, undiscounted
Additional (net) benefit to UK relative to baseline
(direct+indirect+induced)
Employment
(job years), 000s
86
The economic benefit of improving the UK's nuclear supply chain capabilities
March 2013
7 Conclusions and summary
7.1 Current policy supports nuclear
Nuclear is an important part of the UK’s energy policy, alongside reducing our energy use, increasing renewables and investing in new energy technologies.
The 2008 White Paper "Meeting the Energy Challenge" set out that nuclear should be part of the UK’s low carbon energy mix, and that private sector companies should have the option of building new nuclear power stations.
Following this the Government made commitments to take steps to enable such private investment to be made.
Consequently the sector can play a greater role in the UK as an employer and provider of energy. Furthermore projections by the International Energy Agency
(IEA) suggest that by 2030 global nuclear new build sales will be worth £0.93 trillion. There is therefore great potential for the UK's nuclear supply chain to export goods and services and expand further.
7.2 Current supply chain capabilities are limited
There was general agreement that the UK may currently only be able to deliver
45% to 50% of supply chain requirements, though this could rise over time. It was suggested that this could rise to around 60% if barriers were removed and industry was supported.
It was noted that that there is an opportunity for the UK’s reputation to be
enhanced through delivery of Hinkley Point C. Success here would refocus attention to the UK and eliminate many if not all of the negative perceptions of UK nuclear culture.
All respondents felt the UK had a unique opportunity to increase its capability. It
was felt that if this opportunity is not realised the UK will be reliant on other nations for a critical energy supply, while delays in the UK new build programme will hurt public opinion and momentum. An incredible opportunity may be missed
with effective consignment to foreign supply of not just energy, but of the expertise that supports it.
Many felt that the momentum of the UK's new build programme had already stalled. Engagement with the supply chain occurred to too early. In addition the
impact of Fukushima and revisiting the GDA and the sale of Horizon delayed placing orders.
The respondents to our consultation exercise felt that the supply chain did not require any additional R&D to deliver the current new build programme. It was
felt that additional R&D could however help unlock export markets.
"Hinkley is in the spotlight and has to happen right" (private sector respondent).

87
The economic benefit of improving the UK's nuclear supply chain capabilities
March 2013
7.3 The value to the UK is still significant
Consultations with industry experts and the review of existing studies on the new build sector have enabled us to identify components/areas of new build activity which the UK can currently deliver and also those areas in which the UK has the
potential to increase its share. The realisation of increased UK content within the new build programme will be achieved by a combination of policy interventions and actions by private sector organisations involved in new build. Using this
knowledge we have developed two scenarios – Scenario A and B – the first of which represents a view of the current UK capabilities, the second of which represents a view of the upper potential of the UK supply chain. In Scenario A
the UK supply chain captures 44% of the value of each reactor in a new build programme. In Scenario B the UK manages to increase its share to around 63% from the third reactor onwards.
Using our be-spoke model we have analysed two potential nuclear new build
programme profiles:
10GWs of nuclear power by 2030; and
16.5GWs of nuclear power by 2030.
Table 7.1 presents the estimated gross impacts of the 10GW programme. The total impact accounts for direct, indirect (supply-chain) and induced (consumer spending) effects. In Scenario A the total impact of the programme on GVA in
the UK nuclear supply chain is £16.6 billion, with associated employment of 265,300 job years. Assuming the higher Scenario B UK shares of activity leads to a total GVA impact of £21.3 billion and employment of 332,500 job years
(within the UK nuclear supply chain). The (gross) impact of achieving Scenario B relative to Scenario A is therefore £4.7 billion in GVA and 67,200 job years of employment.
Table 7.1: Gross direct, indirect and induced impacts from the 10GW new
build programme
Table 7.2 summarises the estimated gross impacts from the 16.5GW new build programme. The total impact (direct, indirect and induced) under Scenario A is an estimated £27.6 billion in GVA and 444,000 job years. Attaining Scenario B,
meanwhile, would result in a gross GVA impact of £37.3 billion and 587,000 job
New build value (output), £ millions,
2012 prices
GVA, £ millions,
2012 prices
Employment (job years),
000s
New build value (output), £ millions,
2012 prices
GVA, £ millions, 2012
prices
Employment (job years),
000s
New build value (output), £ millions,
2012 prices
GVA, £ millions, 2012
prices
Employment (job years),
000s
Direct 15,400 6,800 86.5 19,800 8,700 106.2 4,400 1,900 19.6Indirect 12,100 5,400 96.6 15,600 7,000 121.4 3,500 1,600 24.9Induced 8,500 4,400 82.3 11,000 5,600 104.9 2,500 1,200 22.7
Total 35,900 16,600 265.3 46,300 21,300 332.5 10,400 4,700 67.2
Scenario A Scenario B Scenario B relative to Scenario A (additional)
Note: Results rounded to nearest £100 million for output and GVA, and to nearest thousand for employment; figures may not add up to totals due to rounding.
Source: Oxford Economics and Atk ins

88
The economic benefit of improving the UK's nuclear supply chain capabilities
March 2013
years. The gross benefit of attaining Scenario B relative to Scenario A is therefore £9.7 billion in GVA and 143,000 job years captured by the UK economy.
Table 7.2: Gross direct, indirect and induced impacts from the 16.5GW new
build programme
Figure 7.1 illustrates the estimated direct employment profiles under the 10GW
and 16.5GW programmes. With regards to the 10GW programme employment peaks in 2024 at around 8,300 jobs in Scenario A and 12,100 jobs in Scenario B. Under the 16.5GW programme employment peaks in 2020 at 13,700 jobs in
Scenario A and 18,600 jobs in Scenario B.
Figure 7.1: Gross direct employment impacts, 2013-2030
Table 7.3 summarises the peak direct, indirect and induced employment impacts (on gross basis) from the 10GW and 16.5GW programmes. In the 16.5GW programme the peak employment impact is 42,700 job years in Scenario A
allowing for direct, indirect and induced effects, with a corresponding figure of 60,000 for Scenario B. If we consider direct and indirect (supply-chain) effects only then peak employment is 29,400 jobs years in Scenario A and 40,800 job
years in Scenario B.
New build value (output), £ millions,
2012 prices
GVA, £ millions, 2012
prices
Employment (job years),
000s
New build value (output), £ millions,
2012 prices
GVA, £ millions, 2012
prices
Employment (job years),
000s
New build value (output), £ millions,
2012 prices
GVA, £ millions, 2012
prices
Employment (job years),
000s
Direct 25,500 11,400 144.6 34,600 15,200 186.6 9,100 3,800 42.0Indirect 20,100 9,000 161.7 27,300 12,200 214.7 7,200 3,200 53.0Induced 14,100 7,200 137.7 19,200 9,900 185.8 5,100 2,700 48.1
Total 59,700 27,600 444.0 81,100 37,300 587.0 21,400 9,700 143.0
Source: Oxford Economics and Atk ins
Scenario B Scenario B relative to Scenario A (additional)
Note: Results rounded to nearest £100 million for output and GVA, and to nearest thousand for employment; figures may not add up to totals due to rounding.
Scenario A
0
2
4
6
8
10
12
14
16
18
20
2013 2015 2017 2019 2021 2023 2025 2027 2029
Employment, job years, 000s
10GW ‐ Scenario A 16GW ‐ Scenario A
10GW ‐ Scenario B 16GW ‐ Scenario B
Source: Oxford Economics and Atkins
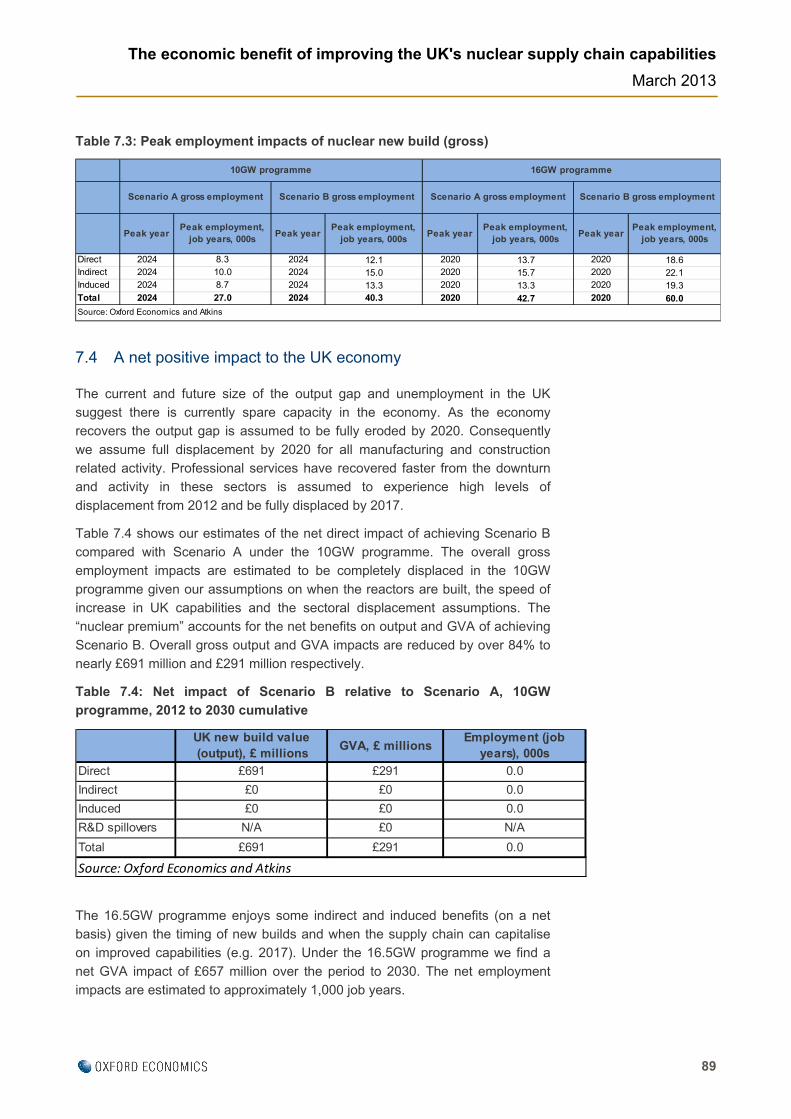
89
The economic benefit of improving the UK's nuclear supply chain capabilities
March 2013
Table 7.3: Peak employment impacts of nuclear new build (gross)
7.4 A net positive impact to the UK economy
The current and future size of the output gap and unemployment in the UK suggest there is currently spare capacity in the economy. As the economy recovers the output gap is assumed to be fully eroded by 2020. Consequently
we assume full displacement by 2020 for all manufacturing and construction related activity. Professional services have recovered faster from the downturn and activity in these sectors is assumed to experience high levels of
displacement from 2012 and be fully displaced by 2017.
Table 7.4 shows our estimates of the net direct impact of achieving Scenario B compared with Scenario A under the 10GW programme. The overall gross employment impacts are estimated to be completely displaced in the 10GW
programme given our assumptions on when the reactors are built, the speed of increase in UK capabilities and the sectoral displacement assumptions. The “nuclear premium” accounts for the net benefits on output and GVA of achieving
Scenario B. Overall gross output and GVA impacts are reduced by over 84% to nearly £691 million and £291 million respectively.
Table 7.4: Net impact of Scenario B relative to Scenario A, 10GW programme, 2012 to 2030 cumulative
The 16.5GW programme enjoys some indirect and induced benefits (on a net basis) given the timing of new builds and when the supply chain can capitalise on improved capabilities (e.g. 2017). Under the 16.5GW programme we find a
net GVA impact of £657 million over the period to 2030. The net employment impacts are estimated to approximately 1,000 job years.
Peak yearPeak employment,
job years, 000sPeak year
Peak employment, job years, 000s
Peak yearPeak employment,
job years, 000sPeak year
Peak employment,job years, 000s
Direct 2024 8.3 2024 12.1 2020 13.7 2020 18.6Indirect 2024 10.0 2024 15.0 2020 15.7 2020 22.1Induced 2024 8.7 2024 13.3 2020 13.3 2020 19.3Total 2024 27.0 2024 40.3 2020 42.7 2020 60.0
16GW programme
Scenario A gross employment Scenario B gross employment
Source: Oxford Economics and Atkins
10GW programme
Scenario A gross employment Scenario B gross employment
UK new build value (output), £ millions
GVA, £ millionsEmployment (job
years), 000s
Direct £691 £291 0.0
Indirect £0 £0 0.0
Induced £0 £0 0.0
R&D spillovers N/A £0 N/A
Total £691 £291 0.0
Source: Oxford Economics and Atkins

90
The economic benefit of improving the UK's nuclear supply chain capabilities
March 2013
Table 7.5: Net impact of Scenario B relative to Scenario A, 16.5GW programme, 2012 to 2030 cumulative
In order to calculate the present value of these impacts we have discounted the GVA benefits using a 3.5% real discount rate in line with HMT Green Book Guidance. This approach takes account of the time preference of money. We
find that:
Under the 10GW new build programme achieving Scenario B (relative to Scenario A) leads to a net present value of GVA benefits to the UK of £194 million from 2012 to 2030.
This rises to £468 million under the 16.5GW new build programme.
It should be noted that this indicative calculation of net benefits at £194m and £468m (discounted) for the 10GW and 16.5GW programmes respectively does not include the potential costs of investment and training which may be required
to achieve the increased UK content scenario or the potential benefits from export opportunities.
7.5 Market failure and Government intervention
The consultations identified a number of market failures. Figure 7.2 provides a high level overview of barriers to entry and expansion. These barriers limit
supply chain capability and the direct benefits that the UK nuclear supply chain will receive from a new build programme. Consequently this in turn reduces the indirect and induced benefits that the wider UK economy would enjoy. In
addition, these barriers are likely to put downward pressure on R&D expenditure and hinder the market from delivering the most efficient outcome.
The potential net GVA impact of increasing UK nuclear supply chain capability could be worth £468 million to the UK by 2030 in discounted terms.
UK new build value (output), £ millions, 2012
prices
GVA, £ millions, 2012 prices
Employment (job years), 000s
Direct £1,485 £624 0.4
Indirect £38 £17 0.3
Induced £30 £15 0.3
R&D spillovers N/A £0 N/A
Total £1,554 £657 1.0
Source: Oxford Economics and Atkins
Note: it is not appropriate to estimate productivity for direct jobs in the table above
given the inclusion of the nuclear premium in the output and GVA figures. See Section 5
for further details.

91
The economic benefit of improving the UK's nuclear supply chain capabilities
March 2013
Figure 7.2: Barriers to entry and expansion
Consequently, there is a clear rationale for Government intervention to support
capability improvements in the UK supply chain and in doing so, encourage R&D spend.
7.6 Recommendations
The consultation exercise revealed that industry bodies and the private sector were in general agreement that given the right environment, working practices
and with the right support the UK's nuclear supply chain could deliver more of the new build programme. Using their feedback and our collective professional judgement we make the following recommendations:
Barriers to entry and expansion
Lack of nuclear
culture by new to nuclear companies
Skills and knowledge transfer
Lead times for new builds
Established relationships
Lack of regulation and
safety understanding
Financial

92
The economic benefit of improving the UK's nuclear supply chain capabilities
March 2013
Table 7.6: Summary of recommendations Recommendation Explanation Responsibility
Confidence and certainty in the new build programme
The private sector needs to have confidence that the new build programme will happen, and a greater understanding of what is involved. Consequently we feel that Government should continue with its clear support and commitment to nuclear power, while developers should reassure the market that they are committed to investing in a steady stream of new reactors.
Government and developers
Financial support for small and medium sized firms
The financial commitment required to be involved in nuclear new build is considerable. A staggered approach to payments, rather than payment on delivery may support further involvement by UK firms. In addition, greater financial support on R&D could encourage the private sector to become more innovative and globally competitive.
Government
Technical support for new to nuclear firms and facilitation of partnering
It was suggested that new to nuclear firms need more support. It might be beneficial to provide a facilitated platform through the NIA that keeps the new-to-nuclear supply chain informed and engaged, This should include explanation of programme timescales and changes. In addition, it should also include awareness of opportunities.
Government and the NIA.
Facilitation of partnership working
A key differentiator for supply chain companies is appreciation of the nuclear culture. Seminars or a platform should be facilitated to assist partnering development to be established between new to nuclear businesses and experienced companies and this might be a consideration for the NIA.
Government and the NIA could arrange and promote, the private sector will need to engage and embrace the opportunities.
Training and knowledge transfer
Specific areas of concern for new-to-nuclear were the understanding of the Nuclear Culture in business development such as commercial awareness that includes safety, regulatory appreciation and quality assurance in the nuclear context. It was suggested that a number of training courses need to be set up to facilitate informed working practices. This spans areas such as technical specifications, regulatory and more general know how. In addition, the ageing workforce in the private sector means companies need to take responsibility for in-house training.
The National Skills Academy Nuclear (and broader skills agencies and training providers) should continue to offer training. The private sector will, in addition, have to introduce in-house training and systems to ensure knowledge is passed throughout the firm
Research & Development support
R&D suffers from a lack of strategy both in the short term and in long term planning. It is suggested Government need to decide whether they wish UK industry to take a co-ordinated approach to R&D and provide the co-ordination activities to support it.
Government
Promotion of the UK Capability
The UK has capabilities that have been either overshadowed by ‘nuclear nations’ or undermined by the decline of new build since Sizewell B. An action to support small and medium sizes businesses might be to highlight their capability by providing a directory of case studies of these suppliers to the higher tiers.
NIA
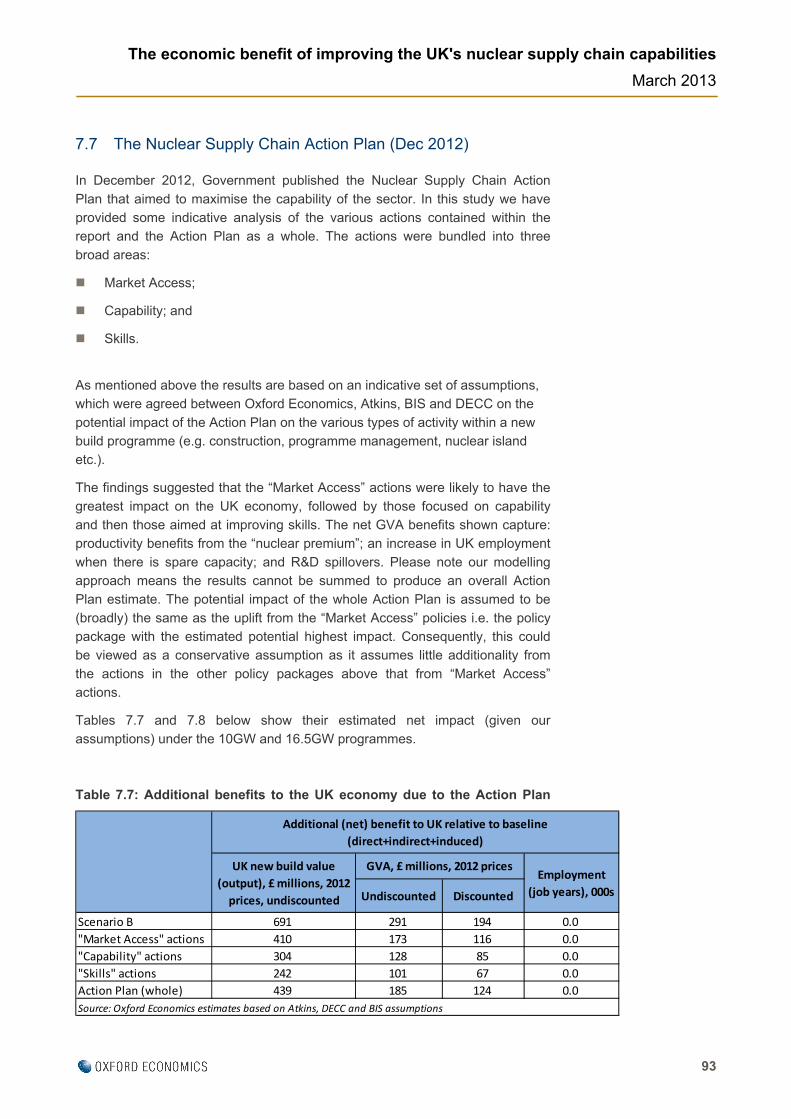
93
The economic benefit of improving the UK's nuclear supply chain capabilities
March 2013
7.7 The Nuclear Supply Chain Action Plan (Dec 2012)
In December 2012, Government published the Nuclear Supply Chain Action
Plan that aimed to maximise the capability of the sector. In this study we have provided some indicative analysis of the various actions contained within the report and the Action Plan as a whole. The actions were bundled into three
broad areas:
Market Access;
Capability; and
Skills.
As mentioned above the results are based on an indicative set of assumptions, which were agreed between Oxford Economics, Atkins, BIS and DECC on the
potential impact of the Action Plan on the various types of activity within a new build programme (e.g. construction, programme management, nuclear island etc.).
The findings suggested that the “Market Access” actions were likely to have the
greatest impact on the UK economy, followed by those focused on capability and then those aimed at improving skills. The net GVA benefits shown capture: productivity benefits from the “nuclear premium”; an increase in UK employment
when there is spare capacity; and R&D spillovers. Please note our modelling approach means the results cannot be summed to produce an overall Action Plan estimate. The potential impact of the whole Action Plan is assumed to be
(broadly) the same as the uplift from the “Market Access” policies i.e. the policy package with the estimated potential highest impact. Consequently, this could be viewed as a conservative assumption as it assumes little additionality from
the actions in the other policy packages above that from “Market Access” actions.
Tables 7.7 and 7.8 below show their estimated net impact (given our assumptions) under the 10GW and 16.5GW programmes.
Table 7.7: Additional benefits to the UK economy due to the Action Plan
Undiscounted Discounted
Scenario B 691 291 194 0.0
"Market Access" actions 410 173 116 0.0
"Capability" actions 304 128 85 0.0
"Skills" actions 242 101 67 0.0
Action Plan (whole) 439 185 124 0.0
Additional (net) benefit to UK relative to baseline
(direct+indirect+induced)
GVA, £ millions, 2012 pricesUK new build value
(output), £ millions, 2012
prices, undiscounted
Employment
(job years), 000s
Source: Oxford Economics estimates based on Atkins, DECC and BIS assumptions

94
The economic benefit of improving the UK's nuclear supply chain capabilities
March 2013
(net impact, post-displacement), 10GW programme
Table 7.8: Additional benefits to the UK economy due to the Action Plan (net impact, post-displacement), 16.5GW programme
It should be noted that this indicative calculation of net benefits at £124m and
£299m (discounted) of GVA for the 10GW and 16.5GW programmes respectively does not include the potential costs of investment and training which may be required to achieve the increased UK content scenario or the
potential benefits from export opportunities.
Undiscounted Discounted
Scenario B 1,554 657 468 1.0
"Market Access" actions 923 392 279 0.6
"Capability" actions 678 287 204 0.4
"Skills" actions 527 222 156 0.2
Action Plan (whole) 989 419 299 0.6
Source: Oxford Economics estimates based on Atkins, DECC and BIS assumptions
GVA, £ millions, 2012 pricesUK new build value
(output), £ millions, 2012
prices, undiscounted
Additional (net) benefit to UK relative to baseline
(direct+indirect+induced)
Employment
(job years), 000s

95
The economic benefit of improving the UK's nuclear supply chain capabilities
March 2013
Annex A: Technical annex
This annex details the approach used to estimate the gross output, value added
and employment impacts of nuclear new build. It focuses on how the Scenario A and B results reported in Sections 4 and 5 were generated.
As described in Section 4.1 the key elements of the approach are:
The profile of the new build programme in terms of the number of plants/reactors and a timeline of development and construction;
The cost (i.e. value) of a single reactor split by component or activity type
(e.g. plant equipment, construction) and associated timelines;
The share of the programme delivered by the UK supply chain split by component and activity type. This provides an estimate of the value of nuclear build to the UK, which is equivalent to the impact on UK gross
output;
Value added and productivity assumptions to convert the UK-delivered part of the programme (i.e. gross output) into estimated GVA and employment impacts; and
Input-output modelling to estimate indirect and induced benefits across the
UK.
The components of the approach are discussed in detail in the following sections.
Nuclear Programme profiles
All assumptions follow guidance provided by BIS and DECC for the study, and are consistent with independent estimates provided to DECC for the purposes of
modelling electricity generation costs34. Twin-reactor units are assumed for each plant/site. Each reactor has a 1.65GW capacity, giving a total capacity of 3.3GW for a twin-unit plant. For the purposes of the modelling it is assumed that the
cost of the first three plants (six reactors) are consistent with FOAK (first-of-a-kind) costs. While subsequent reactors (16.5GW programme only) are built at NOAK (Nth-of-a-kind) costs.
Tables A.1 and A.2 present the timelines of the 10GW and 16.5GW programmes
modelled in the report. Under both programmes the relevant generation capacity is delivered by 2030. The timeframe for each reactor consists of two phases:
34 Parsons Brinckerhoff, Electricity Generation Cost Model, 2012 Update of Non-
renewable Technologies, DECC, 2012.
http://www.decc.gov.uk/en/content/cms/about/ec_social_res/analytic_projs/gen_costs/gen
_costs.aspx

96
The economic benefit of improving the UK's nuclear supply chain capabilities
March 2013
Pre-development phase (green) lasting 5 years, capturing the following broad categories of activity: “Pre-licensing costs, Technical & design” and “Regulatory, licensing & public enquiry”; and
Construction phase (blue) lasting 6 years for FOAK reactors and 5 years
for NOAK reactors, capturing “EPC” (Engineering, Procurement and Construction) and “infrastructure” costs35.
Table A.1: New build timeline for 10GW by 2030
Source: DECC; Parsons Brinckerhoff, Electricity Generation Cost Model, 2012 Update of
Non-renewable Technologies, DECC, 2012.
Table A.2: New build timeline for 16.5GW by 2030
Source: DECC; Parsons Brinckerhoff, Electricity Generation Cost Model, 2012 Update of
Non-renewable Technologies, DECC, 2012.
Reactor costs
Reactor costs are consistent with official guidance and are based on independent estimates of costs provided to DECC36. As explained above reactor
35 Substation and overhead power lines to connect nuclear plants to the grid.
36 Parsons Brinckerhoff, Electricity Generation Cost Model, 2012 Update of Non-
renewable Technologies, DECC, 2012.
2009
2010
2011
2012
2013
2014
2015
2016
2017
2018
2019
2020
2021
2022
2023
2024
2025
2026
2027
2028
2029
2030
Reactor 1 FOAK
Reactor 2 FOAK
Reactor 1 FOAK
Reactor 2 FOAK
Reactor 1 FOAK
Reactor 2 FOAK
Plant 1
Plant 2
Plant 3
2009
2010
2011
2012
2013
2014
2015
2016
2017
2018
2019
2020
2021
2022
2023
2024
2025
2026
2027
2028
2029
2030
Reactor 1 FOAK
Reactor 2 FOAK
Reactor 1 FOAK
Reactor 2 FOAK
Reactor 1 FOAK
Reactor 2 FOAK
Reactor 1 NOAK
Reactor 2 NOAK
Reactor 1 NOAK
Reactor 2 NOAK
Plant 1
Plant 2
Plant 3
Plant 4
Plant 5

97
The economic benefit of improving the UK's nuclear supply chain capabilities
March 2013
build is split into two phases - a pre-development phase and a construction phase - with associated broad activity categories within each phase. Real
from initial plants and improve efficiency of
ctivity and are able to deliver services and equipment at reduced costs.
view of past literature and utilising Atkins’ knowledge of the
actors, assuming 2012 commencement of the construction phase start
nd NOAK reactor costs, assuming 2012 start for
(inflation-adjusted) costs vary according to:
Whether the reactor is FOAK or NOAK – equipment, management, and
construction costs are expected to be lower on NOAK reactors as companies/organisations learntheir activities and processes.
A price adjustment on engineering, procurement and construction
(EPC) costs reflecting the year in which the construction phase starts. A plant starting the construction phase in 2020 will have different EPC real costs from plant starting construction in 2012. EPC costs consist of
manufacturing equipment procurement, equipment installation, civil engineering and construction/programme management. The price adjustment reflects an expected fall in EPC costs over time, as the general
construction and manufacturing industries improve their efficiency/produ
We were also able to break down EPC costs into more detailed categories by
using information gained from: consultations with industry experts conducted for the study; a renuclear sector.
Table A.3 shows the cost breakdown by category of activity for FOAK and
NOAK rein 2012:
Table A.3: FOAK aconstruction phase
Phase* Broad category* Category**
FOAK reactor (2012
start for
construction
phase), £ millions,
2012 prices
NOAK reactor
(2012 start for
construction
phase), £ millions,
2012 prices
Pre‐development Pre‐licensing costs, Technical & design Pre‐licensing costs, Technical and design 311 263
Pre‐development Regulatory & licensing & public enquiry Regulatory & licensing & public enquiry 5 5
Construction EPC Programme and construction management 331 282
Construction EPC Civil construction & electrical/mechanical installation 1,989 1,691
Construction EPC NSSS 829 704
Construction EPC Balance of nuclear island 829 704
Construction EPC Non‐nuclear island 1,326 1,127
Construction EPC Instrumentation and control 796 676
Construction EPC Fuel 209 178
Construction Infrastucture Infrastucture 6 6
Total Total Total 6,630 5,636
* Source: Parsons Brinckerhoff, Electricity Generation Cost Model, 2012 (DECC commissioned estimates).
** Source: Oxford Economics and Atkins estimates consistent with DECC estimates.

98
The economic benefit of improving the UK's nuclear supply chain capabilities
March 2013
Combining the reactor costs with an assumed price adjustment over time (to account for an expectation that capital costs decline over time due to learning effects) and with the programme timelines gives the total cost of the 10GW and
16.5GW programmes split by category of activity. This approach gives a figure of £35.1 billion for the total value of the 10GW programme from 2012-2030, and £58.6 billion for the value of the 16.5GW programme.
struction dates by reactor;
ity associated with the NSSS takes place in each year. For
onstruction nd Electrical/mechanical Installation, which is based on employment profiles for
struction activity under nuclear new build published by Cogent37.
Time profile of reactor costs
The preceding sections have given:
A high-level timeline of pre-development and con
The estimated total cost of each reactor; and
An indicative breakdown of costs by category of activity.
The final element was to estimate the annual (year-by-year) profile of costs by
category of activity. For example, we had an estimate of the cost of the NSSS, and that these costs are incurred within the five or six-year construction phase (depending on whether the reactor is FOAK or NOAK). But we needed to
estimate how much of the costs will be incurred in each year, or more precisely how much of the activthe study this estimated annual profile of costs was based on the expert
knowledge of Atkins.
Tables A.4 and A.5 detail how the costs of a FOAK and NOAK reactor are distributed across the 10 or 11 year timetable of pre-development and construction. The figures represent the percentage of the costs of each category
which occur in each year. For example, two-thirds (67%) of NSSS spending takes place in the second year of the construction phase. For most categories we have assumed the total cost is evenly divided across the periods (quarters)
in which activity is expected to take place. The exception is Civil Cacon
37 Next Generation, Skills for New Build Nuclear; Renaissance Nuclear Skills Series:2;
Cogent; March 2010.

99
The economic benefit of improving the UK's nuclear supply chain capabilities
March 2013
Table A.4: Annual distribution of costs for FOAK reactors
Table A.5: Annual distribution of costs for NOAK reactors
The profiles in Tables A.4 and A.5 was the final piece of information required to estimate a time series of the costs (spending) of the 10GW and 16.5GW build programmes for each year from 2012-2030 broken down by category of activity.
Table A.6 summarises the annual profile of total costs under the 10GW and 16.5GW programmes.
Year 1 Year 2 Year 3 Year 4 Year 5 Year 6 Year 7 Year 8 Year 9 Year 10 Year 11
Pre‐licensing costs, Technical and design 20% 20% 20% 20% 20% 0% 0% 0% 0% 0% 0% 100%
Regulatory & licensing & public enquiry 20% 20% 20% 20% 20% 0% 0% 0% 0% 0% 0% 100%
Programme and construction management 0% 0% 0% 0% 0% 17% 17% 17% 17% 17% 17% 100%
Civil construction & electrical/mechanical installation 0% 0% 0% 0% 0% 6% 19% 31% 26% 14% 3% 100%
NSSS 0% 0% 0% 0% 0% 17% 67% 17% 0% 0% 0% 100%
Balance of nuclear island 0% 0% 0% 0% 0% 0% 0% 67% 33% 0% 0% 100%
Non‐nuclear island 0% 0% 0% 0% 0% 33% 67% 0% 0% 0% 0% 100%
Instrumentation and control 0% 0% 0% 0% 0% 33% 67% 0% 0% 0% 0% 100%
Fuel 0% 0% 0% 0% 0% 0% 0% 0% 0% 33% 67% 100%
In
So
frastucture 0% 0% 0% 0% 0% 17% 17% 17% 17% 17% 17% 100%
urce: Atkins and Oxford Eocnomics estimates
Spend by category
Pre‐development phase Construction phase All
years
Year 1 Year 2 Year 3 Year 4 Year 5 Year 6 Year 7 Year 8 Year 9 Year 10
Pre‐licensing costs, Technical and design 20% 20% 20% 20% 20% 0% 0% 0% 0% 0% 100%
Regulatory & licensing & public enquiry 20% 20% 20% 20% 20% 0% 0% 0% 0% 0% 100%
Programme and construction management 0% 0% 0% 0% 0% 20% 20% 20% 20% 20% 100%
Civil construction & electrical/mechanical installation 0% 0% 0% 0% 0% 11% 24% 37% 20% 8% 100%
NSSS 0% 0% 0% 0% 0% 17% 67% 17% 0% 0% 100%
Balance of nuclear island 0% 0% 0% 0% 0% 0% 0% 67% 33% 0% 100%
Non‐nuclear island 0% 0% 0% 0% 0% 33% 67% 0% 0% 0% 100%
Instrumentation and control 0% 0% 0% 0% 0% 33% 67% 0% 0% 0% 100%
Fuel 0% 0% 0% 0% 0% 0% 0% 0% 33% 67% 100%
In
So
frastucture 0% 0% 0% 0% 0% 20% 20% 20% 20% 20% 100%
Pre‐development phase Construction phase All
yearsSpend by category
urce: Atkins and Oxford Eocnomics estimates

100
The economic benefit of improving the UK's nuclear supply chain capabilities
March 2013
Table A.6: Annual costs of 10GW and 16.5GW programme, 2012-2030, £ millions, 2012 prices
UK share of expenditure
The previous sections of this annex have demonstrated how the assumptions
regarding the costs (i.e. value of the capital expenditure) of the 10GW and 16.5GW new build programmes were derived. The next step of the modelling was to estimate that part of the costs which would be captured by the UK supply
chain. The assumptions around the UK shares were informed by consultations with industry experts and also utilised Atkins’ own knowledge of the nuclear supply chain. They were shared with BIS and DECC throughout the early stages
of the study, and finally to ensure we incorporated an independent expert view we fine-tuned the shares with the Nuclear AMRC at the end of the process. As such they are based on industry views, agreed by the public sector and
independently quality assured by experts, though we do acknowledge that there will still be some margin of error and as a result the estimates should be viewed as indicative.
The shares were disaggregated by category of activity, and consisted of:
10GW programme 16.5GW programme
2012 126 189
2013 126 252
2014 1,033 1,222
2015 2,412 2,601
2016 1,430 2,526
2017 1,910 4,247
2018 2,867 4,954
2019 1,799 5,503
2020 1,875 5,589
2021 2,637 4,889
2022 2,398 3,677
2023 3,686 4,571
2024 4,417 5,040
2025 4,128 5,311
2026 2,230 4,434
2027 1,286 2,278
2028 565 1,006
2029 214 317
2030 ‐ ‐
All years* 35,140 58,609
Source: Oxford Economics estimates based on DECC assumptions
* Only counting costs occurring from 2012‐2030
Annual costs (spend), £ millions, 2012 prices

101
The economic benefit of improving the UK's nuclear supply chain capabilities
March 2013
a set of shares representing a view of how much the UK could capture at present given current capabilities, which function as the “Scenario A” shares; and
and a set of shares, “Scenario B”, representing a view of what the UK could
feasibly achieve if barriers limiting the amount of UK content were to be alleviated, through a combination of policy interventions and actions undertaken by the organisations and companies within the nuclear industry
itself (e.g. investment in equipment, upskilling of workers).
The shares for each category of activity are summarised in Table A.7 below. A detailed discussion of the evidence and reasoning behind the shares can be found in the main report (Section 4).
Table A.7: Scenario A and B UK shares of nuclear new build by category of
activity
For both the 10GW and 16.5GW programmes two views of economic impact
were modelled:
Scenario A outlook: this assumes the Scenario A UK shares for all reactors in both programmes; and
Scenario B outlook: this assumes the Scenario A shares for the first two reactors (of the first plant). All subsequent reactors utilise the Scenario B
shares.
The assumptions regarding the Scenario B outlook are summarised in Table A.8 below.
Scenario A UK share
Scenario B UK share
Pre‐licensing technical & design 90% 90%
Regulatory, licensing & public enquiry 90% 90%
Programme & construction management 50% 80%
Civil construction & installation 60% 80%
Nuclear Steam Supply System 10% 25%
Balance of nuclear island 30% 60%
Non‐nuclear island 40% 70%
Instrumentation & control 35% 35%
Fuel 50% 70%Infrastructure 100% 100%
Source: Oxford Economics and Atkins

102
The economic benefit of improving the UK's nuclear supply chain capabilities
March 2013
Table A.8: Scenario B UK shares of nuclear new build by category of activity
By applying the UK share assumptions to the 10GW and 16.5GW programme costs one can then obtain the 2012-2030 profile of the value of new build
captured within the UK split by activity type. Table A.9 reports the cumulative (2012-2030) value of new build to the UK under Scenarios A and B.
Table A.9: UK value of new build, 10GW and 16.5GW programmes, 2012-2030 cumulative
Type 10GW programme 16.5GW programme
Plant 1 Reactor 1 FOAK Scenario A shares Scenario A shares
Plant 1 Reactor 2 FOAK Scenario A shares Scenario A shares
Plant 2 Reactor 3 FOAK Scenario B shares Scenario B shares
Plant 2 Reactor 4 FOAK Scenario B shares Scenario B shares
Plant 3 Reactor 5 FOAK Scenario B shares Scenario B shares
Plant 3 Reactor 6 FOAK Scenario B shares Scenario B shares
Plant 4 Reactor 7 NOAK ‐ Scenario B shares
Plant 4 Reactor 8 NOAK ‐ Scenario B shares
Plant 5 Reactor 9 NOAK ‐ Scenario B shares
Plant 5 Reactor 10 NOAK ‐ Scenario B shares
Scenario B outlook assumptions
Source: DECC assumptions
Scenario A Scenario B Scenario A Scenario B
Pre‐licensing costs, Technical and design 1,510 1,510 2,402 2,402
Regulatory & licensing & public enquiry 23 23 39 39
Programme and construction management 878 1,215 1,467 2,158
Civil construction & electrical/mechanical installation 6,319 7,668 10,563 13,327
NSSS 439 860 734 1,597
Balance of nuclear island 1,316 2,160 2,201 3,928
Non‐nuclear island 2,808 4,157 4,695 7,458
Instrumentation and control 1,474 1,474 2,465 2,465
Fuel 554 696 926 1,217
Infrastucture 35 35 58 58
UK total 15,355 19,798 25,548 34,648
UK total as % of total programme 44% 56% 44% 59%
Source: Oxford Economics estimates
UK value of 10GW programme,
2012‐2030 cumulative, £
millions, 2012 prices
UK value of 16GW programme,
2012‐2030 cumulative, £
millions, 2012 prices

103
The economic benefit of improving the UK's nuclear supply chain capabilities
March 2013
Converting the UK value of new build to value added and
employment
The value of nuclear new build captured within the UK represents the impact on UK gross output (revenue). Assuming nuclear new build activity follows
fundamental economic relationships it is possible to estimate value added38 (i.e. contribution to UK GDP) and employment effects associated with the level of gross output. Essentially two variables are required:
The value added to gross output ratio - this represents the value added
generated per unit of output (revenue); and
Productivity - defined as value added per worker (employee). This tells you the value added generated by the average worker per year. Given an estimate of value added one can use productivity to calculate the number of
workers required to generate that level of value added.
The requirement is therefore to find appropriate estimates of value added ratios and productivity associated with the 10 activity categories in the model:
Pre-licensing costs, technical and design;
Regulatory & licensing & public enquiry;
Programme and construction management;
Civil construction and electrical/mechanical installation;
NSSS;
Balance of nuclear island;
Non-nuclear island;
Instrumentation and control;
Fuel; and
Infrastructure.
Although the requirements of nuclear new build in terms of equipment and services may be considered unique (at least in the quality of the final products),
there will be similarities to other broader activities/industry groupings in the UK economy. For example, programme management of nuclear new build may be similar to programme management of other civil engineering projects; metal
forging activity required for nuclear components may be comparable to metal forging work undertaken elsewhere. Thus, it is appropriate to derive a correspondence of the 10 new build categories in the model to the Standard
Industrial Classification (SIC2003). Estimates of value added ratios and
38 Value added (i.e. a sector’s contribution to GDP) is calculated as the difference
between total pre-tax revenue and total bought-in costs (costs excluding wages and
salaries).

104
The economic benefit of improving the UK's nuclear supply chain capabilities
March 2013
productivity are available for the UK by SIC2003 industries. This provided a starting point for assessing the appropriate value added ratios and productivity to use for nuclear new build activity categories.
Industry mapping
The industry correspondence first involved matching the NIA’s 60 work
packages (as stated in: “UK capability to deliver a new nuclear build programme”, NIA, 2006/2008”) to detailed SIC2003 industries. Then, by analysing the correspondence between NIA work packages and our 10
categories we obtained a mapping of categories to SIC industries.
Details of the SIC2003 correspondence for each activity category are provided below:
Table A.10: Nuclear new build activity category mapping to SIC2003 industries
Activity category SIC2003 industriesWeight of SIC industry
within categoryNotes
74.2 Architectural and engineering
activities and related technical
consultancy
20% Covers management of construction projects
74.11: Legal activities 20% Covers legal activities
74.14/2 Financial management 20% Covers financial services/advice
74.3 Technical testing and analysis 20% Covers safety and testing
74.20/6 Engineering related scientific
and technical consulting activities20% Covers engineering design
74.2 Architectural and engineering
activities and related technical
consultancy
25% Covers management of construction projects
74.11: Legal activities 25% Covers legal activities
74.3 Technical testing and analysi 25% Covers safety and testing
74.20/6 Engineering related scientific
and technical consulting activities25% Covers engineering design
Programme and construction management
74.2 Architectural and engineering
activities and related technical
consultancy
100% Covers management of construction projects
Civil construction & electrical/mechanical installation 45 Construction 100% Covers civil engineering
Nuclear Steam Supply System
28 & 29 ("Manufacture of Fabricated
Metal Products, Except Machinery and
Equipment" & "Manufacture of
Machinery and Equipment Not
Elsewhere Classified")
100%
Components of NSSS mostly captured by
various detailed industries within SIC28 and
SIC29
Balance of nuclear island
28 & 29 ("Manufacture of Fabricated
Metal Products, Except Machinery and
Equipment" & "Manufacture of
Machinery and Equipment Not
Elsewhere Classified")
100%
Components of Balance of Nuclear Island
mostly captured by various detailed industries
within SIC28 and SIC29
Non‐nuclear island
28 & 29 ("Manufacture of Fabricated
Metal Products, Except Machinery and
Equipment" & "Manufacture of
Machinery and Equipment Not
Elsewhere Classified")
100%
Components of Non‐nuclear Island mostly
captured by various detailed industries within
SIC28 and SIC29
33.3 Manufacture of industrial process
control equipment50%
72: Computer and related activities 50%
Fuel 23.3 Processing of nuclear fuel 100%
Infrastucture 45 Construction 100%
Pre‐licensing costs, technical and design
Regulatory & licensing & public enquiry
Instrumentation and control
Source: Oxford Economics and Atkins

105
The economic benefit of improving the UK's nuclear supply chain capabilities
March 2013
Of particular note is that Nuclear Steam Supply System, Balance of Nuclear Island and Non-nuclear Island activity corresponds with the average of SIC industry 28 (Manufacture of Fabricated Metal Products) and SIC industry 29
(Manufacture of Machinery and Equipment). Analysis of the NIA packages suggested the detailed components (e.g. valves, pumps, vessels etc) within these three categories could be mapped to various detailed 4-digit SIC
industries. For example “Stud Fasteners” can be mapped to SIC industry 28.74 “Manufacture of fasteners, screw machine products, chain and springs”. However, cost (revenue) data by detailed components/packages could not be
obtained for the study. The maximum level of disaggregation that could be obtained was by the 10 broad activity categories. Therefore the data did not permit a more detailed mapping to finer SIC industries. The analysis found that
most components within NSSS, Balance of Nuclear Island and Non-nuclear Island corresponded to various detailed (3 or 4-digit) industries within SIC 28 and SIC 29. The aggregate of SIC 28 and 29 was therefore used as an
approximation of NSSS, Balance of Nuclear Island and Non-nuclear Island for the purposes of estimating value added ratios and productivity.
Value added ratios
Value added to gross output ratios were used to convert the UK value of nuclear new build (i.e. the new build costs captured within the UK) into value added
estimates. The ratios are based on estimates contained in ONS’ 2005 UK Input-Output. ONS Input-Output tables divide activity into 123 Input-Output sectors which correspond to various groupings of SIC2003 industries. The method was
therefore to match the nuclear activity categories to Input-Output sectors by making use of the SIC industry mapping shown in Table A.10. This gave the relevant value added ratios to use for each nuclear activity category, reported in
Table A.11.
Table A.11: Value added to gross output ratios
Activity category Value added to gross output ratio
Pre-licensing costs, technical & design 0.56Regulatory & licensing & public enquiry 0.56Programme and construction management 0.52Civil construction & electrical/mechanical installation 0.39NSSS 0.42Balance of nuclear island 0.42Non-nuclear island 0.42Instrumentation and control 0.54Fuel 0.59Infrastructure cost 0.39
Oxford Economics estimates based on ONS' 2005 UK Input‐Ouput tables

106
The economic benefit of improving the UK's nuclear supply chain capabilities
March 2013
Productivity
Given the estimated impact of nuclear new build on UK value added, productivity (value added per employee) is then used to produce the associated UK employment impact. The general approach and data sources used for deriving
the productivity estimates and forecasts in the model are outlined below:
1) The underlying productivity time series (history and forecasts) for each nuclear category is based on estimates from Oxford Economics’ UK Industry Model. Estimates are available by broad industry groupings (of
2-digit SIC industries). The closest matching industry group based on the industry mappings (Table A.10) is used to provide an approximate “first-step” estimate of productivity by nuclear category. Historical
estimates from Oxford Economics’ Industry Model are generated from a variety of official sources, including national accounts, BRES and LFS. Forecasts of industry productivity are determined by factors at the UK
macro level and within specific industries such as labour skills, investment in capital and technological trends.
2) The approximate “first-step” productivity series from above were then adjusted to better reflect the mapping of nuclear categories to detailed
SIC industries. This was achieved by making use of historical Annual Business Survey, which permits the estimation of detailed 4-digit SIC level historical productivity
3) With respect to nuclear categories associated with the manufacturing
sector activity (NSSS, Balance of Nuclear Island, Non-nuclear Island and Instrumentation & Control39) a different approach was adopted to the one described in Step 2 above. Cogent's "Next Generation, Skills
for New Build Nuclear" report provides an estimate of the profile of new build manufacturing employment by skill area/competence. These skill areas correspond to various engineering professions (e.g. design
engineering) or skilled trade occupations (e.g. welders). Each skill area was therefore mapped to a Standard Occupational Code (SOC) to obtain an occupational profile of nuclear new build manufacturing
employment. This profile was applied to data on average earnings by occupation from the ONS's Annual Survey of Hours and Earnings (ASHE) to estimate average earnings of new build manufacturing
employees. We estimate average earnings in nuclear new build manufacturing to be £40,600 in 2010. This is compared to £28,800 for manufacturing as a whole. Using this approach of adjusting for
occupational wages, we find that on average over the last 3 years nuclear manufacturing wages were about 15% higher than the average
39 For simplification we categorised Instrumentation & Control as a wholly manufacturing-
related sector for the productivity estimates, even though our mapping had assigned 50%
to Computer and related activities (see Table A10). Thus Instrumentation & Control
productivity is for the other manufacturing-related nuclear activity categories (e.g. NSSS).

107
The economic benefit of improving the UK's nuclear supply chain capabilities
March 2013
for manufacturing. This factor of 15% was used to scale up the “first-step” estimates of productivity for NSSS, Balance of Nuclear Island, Non-nuclear Island and Instrumentation & Control. This 15% factor
accounts for the unique occupational structure of manufacturing-related new build activity.
4) In addition to the adjustments described in Steps 2 and 3 above there is also likely to be a “Nuclear premium”. People involved in nuclear new
build are likely to earn more than other people employed in similar occupations or industries, as the demands on product/service quality require the most highly skilled workers. For example an engineer
working on a nuclear component, or a programme director overseeing a particular part of the project, are likely to earn more than the average employee of their types. Assuming this difference in earnings
associated with nuclear-related work reflects the higher value nature of their work one can use this as an estimate of the “nuclear premium”.
5) We have drawn from US data to identify the scale of the premium. The Bureau of Labor Statistics in the US publishes detailed occupational
earnings data in its Occupational Employment Statistics publication. This includes earnings for "Nuclear engineers", "Nuclear technicians" and "Nuclear reactor operators". These were compared with engineers
or technicians in other sectors. We found that:
i. Nuclear engineers earned around 20% more than the average of engineers;
ii. Nuclear technicians earned around 25% more than the average of technicians; and
iii. Nuclear plant operators earned around 25% more than
the average of other plant operators (e.g. gas, other power plant).
6) Based on the above evidence we assume the nuclear premium to be 20% and adjusted up productivity estimates accordingly. We do not
apply the premium to “Civil construction and electrical/mechanical installation”, “Infrastructure” and “Fuel”. The first two because we assume construction activity related to nuclear build has the same
productivity as the average of all other construction activity in the economy. The latter because the productivity estimates we derived for “Fuel” from Steps 1 and 2 already specifically relates to the nuclear
industry (SIC2003 industry 23.3: Processing of Nuclear Fuel).
Table A.12 gives an overview of productivity assumptions for each nuclear category based on the methodology above. Only 2012 and 2030 figures are presented. In the modelling a complete time series from 2012-2030 is utilised,
thus the average productivity for the entire programme will lie in between the 2012 and 2030 estimates reported below.

108
The economic benefit of improving the UK's nuclear supply chain capabilities
March 2013
Table A.12: Productivity estimates by nuclear new build activity, 2012 and 2030
Multipliers
Indirect and induced multiplier effects are estimated from the ONS’ 2005 Input-Output tables. These tables report activity by 123 IO sectors which can be corresponded to SIC2003 industries. The full 123 sector detail of the Input-
Output tables are used in the multiplier analysis. The approach is outlined below:
1) Allocate the UK gross output impact by nuclear activity category to the appropriate IO sectors using the nuclear category mapping to SIC2003 industries (Table A10).
2) Apply multipliers based on above allocation to derive indirect and
induced gross output effects by the 123 IO sectors. Some adjustments are made to the construction multipliers as in the IO tables the data may include civil engineering projects where purchases of
manufacturing equipment are included in intermediate purchases. However all such purchases are already include in the direct costs of the nuclear programme (i.e. there are figures for NSSS, Balance of
Plant equipment etc). Thus there is the possibility of double-counting if the raw ONS IO multipliers are used.
3) Estimate GVA to gross output ratios for each of the 123 IO sectors from data contained in the ONS IO tables. Apply these ratios to estimated
indirect and induced gross output from above to arrive at value added impacts by the 123 IO sectors
4) Map the IO 123 sectors to the closest matching industry/sector for which productivity estimates (history and forecasts) are available from Oxford
Economics’ UK Industry Model. This provides an estimate of current and future productivity levels for each of the 123 IO sectors. Apply the
2012 2030
Pre‐licensing costs, Technical and design 55.2 83.3
Regulatory & licensing & public enquiry 55.2 83.3
Programme and construction management 57.7 87.0
Civil construction and electrical/mechanical installation 53.4 71.0
NSSS 81.5 157.8
Balance of nuclear island 81.5 157.8
Non‐nuclear island 81.5 157.8
Instrumentation and control 81.5 157.8
Fuel 104.8 202.9
Infrastructure cost 44.5 59.2
Productivity, £000s, 2012 real prices
Oxford Economics estimates

109
The economic benefit of improving the UK's nuclear supply chain capabilities
March 2013
productivity figures to indirect and induced GVA to produce estimates of indirect and induced employment.
Net economic impacts
The modelling and analysis described so far enabled us to make estimates of the gross value of UK nuclear supply chain involvement under Scenario A and B
outlooks. The difference between the two scenarios was thus the gross additional impact of the improved capabilities.
To estimate the net impacts we needed to account for:
1) Displacement of these direct gross impacts;
2) Displacement of any indirect and induced gross impacts;
3) Displacement and leakage of R&D expenditure and spillovers; and
4) Additionality through the nuclear premium that nuclear supply chain jobs offer.
In making displacement assumptions we analysed Oxford Economics forecasts
of the UK's unemployment rate and output gap. Section 5 provides a detailed discussion of the output gap, however by way of summary:
1) The output gap is difficult to measure. It is dependent on a range of data series and on the judgement of the forecaster;
2) Most commentators would agree that the financial crisis has
permanently reduced potential UK output; however there is a disagreement over the scale of this reduction. Oxford Economics forecasts of the output gap are much larger than those of the OBR. Our
forecasts suggest it will be reduced gradually over time and fully eroded by 2029;
Table A.13: Output gap estimates, 2010 to 2017
Output gap estimates 2010 2011 2012 2013 2014 2015 2016 2017
Oxford Economics (Q3 2012) ‐3.1 ‐2.9 ‐5.1 ‐5.4 ‐5.0 ‐4.5 ‐4.2 ‐3.8
OBR (Dec 2012) -3.0 -2.7 -3.1 -3.5 -3.3 -3.1 -2.6 -1.9
IMF (October 2012) ‐1.8 ‐2.6 ‐4.2 ‐4.4 ‐3.6 ‐2.7 ‐2.1 ‐1.4
Source: Oxford Economics, OBR and IMF
3) For this study, BIS and DECC asked Oxford Economics to assume OBR projections of the output gap. When extrapolated the OBR trend suggests the output gap will close by 2030.
With an overall view of spare capacity in the economy, we then undertook a
more detailed sectoral analysis. In particular we looked at the manufacturing,

110
The economic benefit of improving the UK's nuclear supply chain capabilities
March 2013
construction and professional service sectors of the economy that contain parts of the nuclear supply chain. Annex B contains plots of GVA and employment for 14 sectors of the economy.
English Partnerships' October 2008 "Additionality Guide Third Edition" provides
guidance on making displacement assumptions. It notes that low levels of displacement should be assigned a 25% displacement effect, compared to a 50% displacement effect for medium displacement and 75% for high levels of
displacement.
We used this as a starting point for our displacement assumptions, and with guidance from BIS / DECC adjusted these to reflect the likely current market conditions (based on the data in Annex B). Table A.14 presents our broad
sectoral assumptions. Section 5 provides a detailed rationale for these assumptions, though it is worth noting that because the output gap is expected to close in 2020, we assume full displacement in both manufacturing and
construction activity by then. Professional services experience this slightly sooner due to their faster recovery.
Table A.14: Displacement assumptions (2012 to 2030)
Manufacturing Construction Professional services
2012 30% 25% 60%
2013 39% 34% 68%
2014 48% 44% 76%
2015 56% 53% 84%
2016 65% 63% 92%
2017 74% 72% 100%
2018 83% 81% 100%
2019 91% 91% 100%
2020 100% 100% 100%
2021 100% 100% 100%
2022 100% 100% 100%
2023 100% 100% 100%
2024 100% 100% 100%
2025 100% 100% 100%
2026 100% 100% 100%
2027 100% 100% 100%
2028 100% 100% 100%
2029 100% 100% 100%
2030 100% 100% 100%
Source: Oxford Economics
We applied these displacement assumptions to the direct impacts and isolated the nuclear premium on those that were displaced. As noted earlier, nuclear

111
The economic benefit of improving the UK's nuclear supply chain capabilities
March 2013
related activities offer above average productivity and earnings. This means that despite there being 100% displacement (i.e. no net new jobs) the level of direct economic output and consumption could be higher.
The nuclear premium was then halved to account for the fact that some of the
displaced jobs would have come from other high-value added energy producing sectors. The exact quantity or share is unknown (so too is the energy sector they would have come from) so this halving is an assumption that can be alter in the
future if more information becomes available.
In working out the net indirect and induced impacts we use the same input-output system that was developed for the gross impacts. To this we add further displacement assumptions. We assume the same displacement levels as those
applied to construction to reflect the general economic environment.
Finally R&D spillover estimates are based on the academic literature, a summary of which can be found in DTI paper “Competing in the global economy: the innovation challenge”40. We depreciate our stock of R&D spend each year
by 15%, apply an annual displacement assumption of 25% that rises to 100% by 2020 (i.e. when the UK output gap is eroded), apply an annual leakage rate of 25% per year and finally assume a gross external return of 25%.
40 “Competing in the global economy: the innovation challenge”, DTI, December 2003.
http://webarchive.nationalarchives.gov.uk/+/http://www.dti.gov.uk/files/file12093.pdf

112
The economic benefit of improving the UK's nuclear supply chain capabilities
March 2013
Annex B: Sectoral GVA and employment forecasts
Figure B.1: GVA and employment in the Manufacture of basic metals
Source: Oxford Economics
Figure B.2: GVA and employment in the Manufacture of fabricated metal products, except machinery
Source: Oxford Economics
40
50
60
70
80
90
100
110
120
130
140
2000
2002
2004
2006
2008
2010
2012
2014
2016
2018
2020
2022
2024
2026
2028
2030
(000s)
Employment in Manufacture of basic metals
Forecast
3,000
3,500
4,000
4,500
5,000
5,500
6,000
2000
2002
2004
2006
2008
2010
2012
2014
2016
2018
2020
2022
2024
2026
2028
2030
£M (2009 prices)
GVA in Manufacture of basic metals
Forecast
12,000
14,000
16,000
18,000
20,000
22,000
24,000
2000
2002
2004
2006
2008
2010
2012
2014
2016
2018
2020
2022
2024
2026
2028
2030
£M (2009 prices)
GVA in Manufacture of fabricated metal products,except machinery
Forecast
200
250
300
350
400
450
2000
2002
2004
2006
2008
2010
2012
2014
2016
2018
2020
2022
2024
2026
2028
2030
(000s)
Employment in Manufacture of fabricated metal products,except machinery
Forecast

113
The economic benefit of improving the UK's nuclear supply chain capabilities
March 2013
Figure B.3: GVA and employment in the Manufacture of computer, electronic and optical products
Source: Oxford Economics
Figure B.4: GVA and employment in the Manufacture of electrical equipment
Source: Oxford Economics
6,000
7,000
8,000
9,000
10,000
11,000
12,000
2000
2002
2004
2006
2008
2010
2012
2014
2016
2018
2020
2022
2024
2026
2028
2030
£M (2009 prices)
GVA in Manufacture of computer, electronic and optical products
Forecast
50
80
110
140
170
200
230
260
2000
2002
2004
2006
2008
2010
2012
2014
2016
2018
2020
2022
2024
2026
2028
2030
(000
s)
Employment in Manufacture of computer, electronic and optical products
Forecast
3,000
3,500
4,000
4,500
5,000
5,500
6,000
6,500
7,000
2000
2002
2004
2006
2008
2010
2012
2014
2016
2018
2020
2022
2024
2026
2028
2030
£M (2009 prices)
GVA in Manufacture of electrical equipment
Forecast
50
70
90
110
130
150
170
2000
2002
2004
2006
2008
2010
2012
2014
2016
2018
2020
2022
2024
2026
2028
2030
(000s) Employment in
Manufacture of electrical equipment
Forecast

114
The economic benefit of improving the UK's nuclear supply chain capabilities
March 2013
Figure B.5: GVA and employment in the Manufacture of machinery and equipment not elsewhere classified
Source: Oxford Economics
Figure B.6: GVA and employment in Other manufacturing
Source: Oxford Economics
8,000
9,000
10,000
11,000
12,000
13,000
14,000
15,000
16,000
17,000
2000
2002
2004
2006
2008
2010
2012
2014
2016
2018
2020
2022
2024
2026
2028
2030
£M (2009 prices)
GVA in Manufacture of machinery and equipment n.e.c
Forecast
130
150
170
190
210
230
250
270
290
310
2000
2002
2004
2006
2008
2010
2012
2014
2016
2018
2020
2022
2024
2026
2028
2030
(000s)
Employment in Manufacture of machinery and equipment n.e.c
Forecast
4,000
4,500
5,000
5,500
6,000
6,500
2000
2002
2004
2006
2008
2010
2012
2014
2016
2018
2020
2022
2024
2026
2028
2030
£M (2009 prices)
GVA in Other manufacturing
Forecast
60
70
80
90
100
110
120
130
140
2000
2002
2004
2006
2008
2010
2012
2014
2016
2018
2020
2022
2024
2026
2028
2030
(000s)
Employment in Other manufacturing
Forecast

115
The economic benefit of improving the UK's nuclear supply chain capabilities
March 2013
Figure B.7: GVA and employment in the Repair and installation of machinery and equipment
Source: Oxford Economics
Figure B.8: GVA and employment in the Construction of buildings
Source: Oxford Economics
4,000
5,000
6,000
7,000
8,000
9,000
10,000
11,000
12,000
13,000
14,000
2000
2002
2004
2006
2008
2010
2012
2014
2016
2018
2020
2022
2024
2026
2028
2030
£M (2009 prices)
GVA in Repair and installation of machinery and equipment
Forecast
80
90
100
110
120
130
140
150
160
2000
2002
2004
2006
2008
2010
2012
2014
2016
2018
2020
2022
2024
2026
2028
2030
(000s)
Employment in Repair and installation of machinery and equipment
Forecast
15,000
20,000
25,000
30,000
35,000
40,000
45,000
50,000
55,000
2000
2002
2004
2006
2008
2010
2012
2014
2016
2018
2020
2022
2024
2026
2028
2030
£M (2009 prices)
GVA in Construction of buildings
Forecast
250
350
450
550
650
750
850
2000
2002
2004
2006
2008
2010
2012
2014
2016
2018
2020
2022
2024
2026
2028
2030
(000s)
Employment in Construction of buildings
Forecast

116
The economic benefit of improving the UK's nuclear supply chain capabilities
March 2013
Figure B.9: GVA and employment in Civil engineering
Source: Oxford Economics
Figure B.10: GVA and employment in Specialised construction activities
Source: Oxford Economics
10,000
11,000
12,000
13,000
14,000
15,000
16,000
17,000
18,000
19,000
2000
2002
2004
2006
2008
2010
2012
2014
2016
2018
2020
2022
2024
2026
2028
2030
£M (2009 prices)
GVA in Civil engineering
Forecast
200
210
220
230
240
250
260
270
280
290
300
2000
2002
2004
2006
2008
2010
2012
2014
2016
2018
2020
2022
2024
2026
2028
2030
(000s)
Employment in Civil engineering
Forecast
40,000
45,000
50,000
55,000
60,000
65,000
70,000
75,000
80,000
2000
2002
2004
2006
2008
2010
2012
2014
2016
2018
2020
2022
2024
2026
2028
2030
£M (2009 prices)
GVA in Specialised construction activities
Forecast
1,100
1,200
1,300
1,400
1,500
1,600
1,700
1,800
2000
2002
2004
2006
2008
2010
2012
2014
2016
2018
2020
2022
2024
2026
2028
2030
(000s)
Employment in Specialised construction activities
Forecast
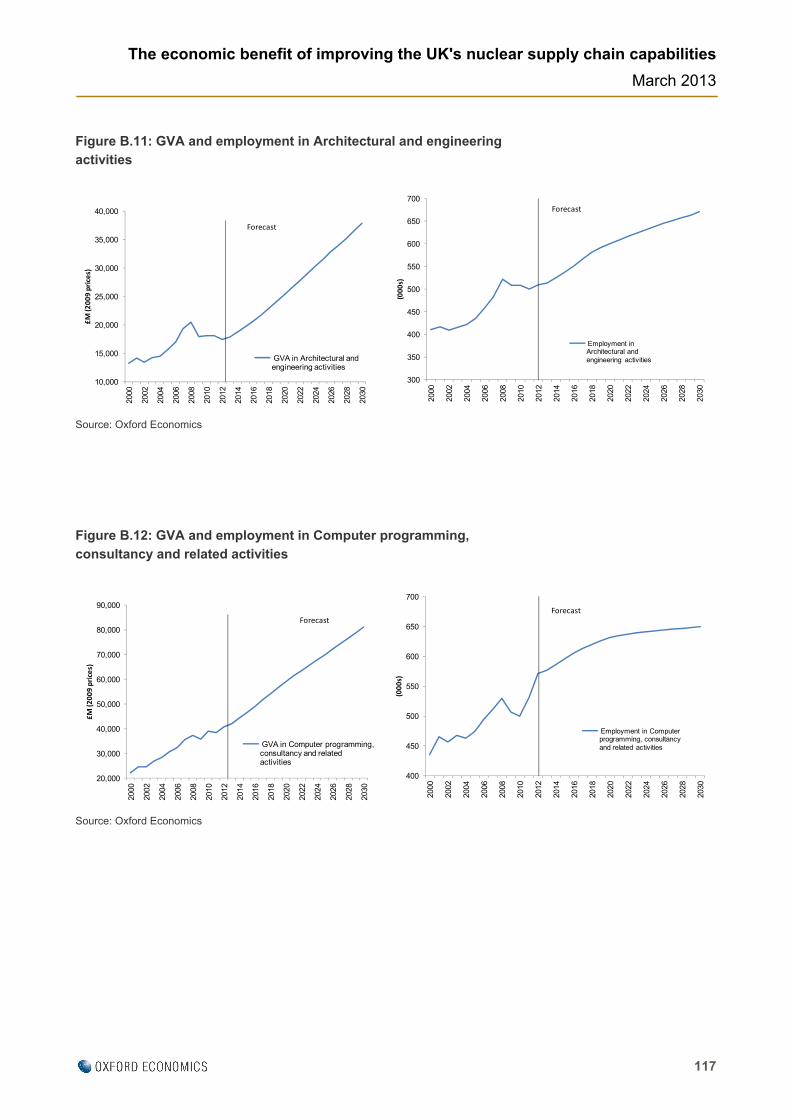
117
The economic benefit of improving the UK's nuclear supply chain capabilities
March 2013
Figure B.11: GVA and employment in Architectural and engineering activities
Source: Oxford Economics
Figure B.12: GVA and employment in Computer programming,
consultancy and related activities
Source: Oxford Economics
10,000
15,000
20,000
25,000
30,000
35,000
40,000
2000
2002
2004
2006
2008
2010
2012
2014
2016
2018
2020
2022
2024
2026
2028
2030
£M (2009 prices)
GVA in Architectural and engineering activities
Forecast
300
350
400
450
500
550
600
650
700
2000
2002
2004
2006
2008
2010
2012
2014
2016
2018
2020
2022
2024
2026
2028
2030
(000s)
Employment in Architectural and engineering activities
Forecast
400
450
500
550
600
650
700
2000
2002
2004
2006
2008
2010
2012
2014
2016
2018
2020
2022
2024
2026
2028
2030
(000s)
Employment in Computer programming, consultancy and related activities
Forecast
20,000
30,000
40,000
50,000
60,000
70,000
80,000
90,000
2000
2002
2004
2006
2008
2010
2012
2014
2016
2018
2020
2022
2024
2026
2028
2030
£M (2009 prices)
GVA in Computer programming, consultancy and related activities
Forecast

118
The economic benefit of improving the UK's nuclear supply chain capabilities
March 2013
Figure B.13: GVA and employment in Scientific research and development
Source: Oxford Economics
Figure B.14: GVA and employment in Other professional, scientific and technical activities
Source: Oxford Economics
3,000
5,000
7,000
9,000
11,000
13,000
15,000
2000
2002
2004
2006
2008
2010
2012
2014
2016
2018
2020
2022
2024
2026
2028
2030
£M (2009 prices)
GVA in Scientific research and development
Forecast
90
100
110
120
130
140
150
160
170
180
2000
2002
2004
2006
2008
2010
2012
2014
2016
2018
2020
2022
2024
2026
2028
2030
(000s)
Employment in Scientific research and development
Forecast
0
2,000
4,000
6,000
8,000
10,000
12,000
14,000
16,000
18,000
20,000
2000
2002
2004
2006
2008
2010
2012
2014
2016
2018
2020
2022
2024
2026
2028
2030
£M (2009 prices)
GVA in Other professional, scientific and technical activities
Forecast
100
150
200
250
300
350
2000
2002
2004
2006
2008
2010
2012
2014
2016
2018
2020
2022
2024
2026
2028
2030
(000s)
Employment in Other professional, scientific and technical activities
Forecast

119
The economic benefit of improving the UK's nuclear supply chain capabilities
March 2013
Annex C: References
Area Title Source Date Capability Construction and Nuclear New Build Adrian Worker March 2010Capability Enhancing Nuclear Safety Institut De Radioprotection 2010Capability Fit For Nuclear Questionnaire Nuclear AMRC July 2011
Capability Manufacturing: New Challenges, New Opportunities
Department of Business, Enterprise & Regulatory Reform
September 2008
Capability Materials Supply Chains for UK Power Generation
Sheffield Forgemasters International
Capability Materials Supply Chains in the UK Power Generation Sector D Buckthorpe (AMEC) May 2008
Capability Materials Supply Chains in the UK's Power Generation Sector Materials UK May 2008
Capability Nuclear Energy Materials Materials UK 2007Capability Nuclear-Powered Ships August 2012
Capability Supply Chain Map - Nuclear Reactor Components Nuclear Energy Institute
Capability The Government's Manufacturing Strategy
Capability
The mapping of materials supply chains in the UK's power generation sector Materials UK 2008
Capability The Supply Chain for a UK Nuclear New Build Programme
Dr. Stephen A. Court (NAMTEC) February 2009
Capability The UK Capability to Deliver a New Nuclear Build Programme Nuclear Industry Association 2006
Capability WIPO IP Facts and Figures World Intellectual Property Organization (WIPO) 2012
Market AP1000 in the UK - Supply Chain Opportunities
Dr Rita C Bowser & Reg Edwards May 2010
Market
New Nuclear Plants Create Opportunities To Expand U.S. Manufacturing, Create Jobs Nuclear Energy Institute
Market NIA New Build Working Group Alan Cumming (EDF) May 2010
Market Building New Nuclear: The Challenges Ahead EDF Energy May 2012
Market
Regional and National Economic Benefits from the UK's Nuclear Decommissioning Programme
Professor Frank Peck, CRED Research Director
September 2010
Market
Regional and National Economic Benefits from the UK's Nuclear Decommissioning Programme Nuclear Industry Association
September 2010
Market Supply Chain Strategy Magnox March 2010
Market The Essential Guide to the new build nuclear supply chain Nuclear Industry Association February 2011
Market UK Delivery Model Robert Davies (AREVA) March 2010OS Market Nuclear Power in France July 2012OS Market Nuclear Power in Russia August 2012OS Market Nuclear Power in Saudi Arabia June 2012

120
The economic benefit of improving the UK's nuclear supply chain capabilities
March 2013
OS Market
Nuclear Power in the United Arab Emirates August 2012
OS Market
Nuclear renaissance and the global supply chain
Nathan Ives, Steve McCabe, Gary Gilmartin (Deloitte) 2010
OS Market
Policy of the United Arab Emirates on the Evaluation and Potential Development of Peaceful Nuclear Energy
OS Market
Report of the Committee for Nuclear Energy Competence in Finland
Ministry of Employment and the Economy 2012
R&D A Policy Framework for Micro-Nuclear Technology Rice University August 2001
R&D A Review of the UK's Nuclear R&D Capability Dalton Nuclear Institute
R&D Nuclear Research and Development Capabilities
House of Lords - Select Committee on Science and Technology
November 2011
R&D
Small Modular Reactors – Key to Future Nuclear Power Generation in the U.S.
Energy Policy Institute of Chicago (EPIC) July 2011
R&D
Small Modular Reactors – Key to Future Nuclear Power Generation in the U.S.
Energy Policy Institute of Chicago (EPIC)
November 2011
R&D
Technical Innovation Needs Investment (TINA) - Nuclear Fission Summary Report LCICG June 2012
R&D UK Nuclear Fission Technology Roadmap National Nuclear Laboratory February 2012
Skills Age Profile of Civil Nuclear Workforce 2009 COGENT 2009
Skills Assurance: Skills for Nuclear Defence COGENT August 2009
Skills Civil Nuclear Industry Job Role Demand Forecast COGENT 2009
Skills Civil Nuclear Workforce by Region and Nation 2009 COGENT 2009
Skills Demand Forecast of Civil Nuclear Workforce 2008-2025 COGENT 2009
Skills I2EN and Skills Academy Workshop National Skills Academy / COGENT July 2012
Skills New-Build Nuclear - A Review of Labour Market Research
Dr. Brian P Murphy (COGENT) July 2009
Skills Next Generation - Skills for New Build Nuclear July 2009
Skills Next Generation: Skills for New Build Nuclear COGENT March 2010
Skills Nuclear Fact Sheet COGENT 2009Skills Nuclear LMI Highlights COGENT June 2009
Skills Nuclear New Build - Scenario 1: 16GWe - (12 Single PWR Units) COGENT
Skills Nuclear New Build - Scenario 2: 16GWe - (6 Twinned PWR Units) COGENT
Skills Nuclear Skills - A Review COGENT June 2009
Skills Occupational Skill Level of Civil Nuclear Workforce 2009 COGENT 2009

The economic benefit of improving the UK's nuclear supply chain capabilities
March 2013
121
Skills Power People: The Civil Nuclear Workforce 2009-2025 COGENT
September 2009
Skills Retirement Profile of Civil Nuclear Workforce COGENT 2009
Skills Skills Oracle 2010: The Nuclear Industry COGENT May 2010
Strategy Analysis of GW-Scale Overnight Capital Costs
Energy Policy Institute of Chicago (EPIC)
November 2011
Strategy
Benefits from Infrastructure Investment: A Case Study in Nuclear Energy
IPPR Trading LTD report for EDF Energy June 2012
Strategy
Business Orders for Early Orders of New Nuclear Reactors: Section 2: Industry Analysis Scully Capital
Strategy
Business Orders for Early Orders of New Nuclear Reactors: Section 5: Scenarios and Sensitivity Analysis Scully Capital
Strategy Comprehensive Assessment of Energy Systems (GaBE) Paul Scherrer Institut
December 2004
Strategy Economic Situation and Outlook The Federation of Finnish Technology Industries February 2012
Strategy
Economic, Employment and Environmental Benefits of Renewed U.S. Investment in Nuclear Energy Oxford Economics 2008
Strategy Emerging Nuclear Energy Countries June 2012Strategy Nuclear Energy's Economic Benefits Nuclear Energy Institute April 2012Strategy Nuclear Power Joint Fact-Finding The Keystone Center June 2007
Strategy
Stabilisation Wedges: Solving the Climate Problem for the Next 50 Years with Current Technologies The IMPEE Project August 2004

122
OXFORD Abbey House, 121 St Aldates Oxford, OX1 1HB, UK Tel: +44 1865 268900 LONDON Broadwall House, 21 Broadwall London, SE1 9PL, UK Tel: +44 207 803 1400 BELFAST Lagan House, Sackville Street Lisburn, BT27 4AB, UK Tel: +44 28 9266 0669 NEW YORK 5 Hanover Square, 19th Floor New York, NY 10004, USA Tel: +1 646 786 1863 PHILADELPHIA 303 Lancaster Avenue, Suite 1b Wayne PA 19087, USA Tel: +1 610 995 9600 SINGAPORE No.1 North Bridge Road High Street Centre #22-07 Singapore 179094 Tel: +65 6338 1235 PARIS 9 rue Huysmans 75006 Paris, France Tel: + 33 6 79 900 846 email: [email protected]
www.oxfordeconomics.com