The East European Consumer Paul Flatters, CEO, The Future Foundation June 2007.
33
The East European Consumer Paul Flatters, CEO, The Future Foundation June 2007
-
Upload
violet-york -
Category
Documents
-
view
216 -
download
2
Transcript of The East European Consumer Paul Flatters, CEO, The Future Foundation June 2007.
The East European Consumer
Paul Flatters, CEO, The Future FoundationJune 2007
Presentation structure
• Economic well being and life satisfaction• Socio-demographics• Values and attitudes• Leisure, tourism and travel

Presentation structure
• Economic well being and life satisfaction• Socio-demographics• Values and attitudes• Leisure, tourism and travel

24643: Mobility and Movement
Correlation between satisfaction with life vs. satisfaction with the economy
By countrySee notes pages for an explanation of this map
Luxembourg
Norway
FinlandIreland
Denmark
Sweden
NetherlandsBelgium
AustriaSpainUK
Slovenia
Germany
Czech Rep.Greece
France
Poland
Portugal
Slovakia
Hungary
Estonia
2
3
4
5
6
7
8
5 5.5 6 6.5 7 7.5 8 8.5 9Satisfaction with life – mean score
Sat
isfa
ctio
n w
ith e
cono
my
–m
ean
scor
e
Northern
Western Central
Southern
Eastern
Northern
Western Central
Southern
Eastern
Source: European Social Survey/nVision ResearchBase: 1,000 per country aged 15+, 2005

24803: Mobility and Movement
Satisfaction with life forecast: CEE 13 vs EU 15% who are very satisfied or fairly with the life that they lead2006-based nVision forecast – “On the whole are you very satisfied, fairly satisfied or not at all satisfied with the life you lead?”
0%
10%
20%
30%
40%
50%
60%
70%
80%
90%
100%1
99
9
20
00
20
00
20
01
20
01
20
01
20
01
20
02
20
02
20
02
20
03
20
03
20
04
20
04
20
05
20
06
20
07
20
08
20
09
20
10
20
11
20
12
20
13
20
14
20
15
CC-13 EU 15
Source: Eurobarometer/nVisionBase: 29,000 aged 15+

17035: Mobility and Movement
Positive expectations for the next 12 months – Life in generalIndex by age in relation to the national average who thinks that their life in general will get better in the next 12 months “What are your expectations for the next twelve months: will he next twelve months be better, worse or the same, when it comes to…your life in general?”
0
20
40
60
80
100
120
140
160
180
200
220
Po
rtu
ga
l
Gre
ece
Ge
rma
ny
Ne
the
rla
nd
s
Sp
ain
UK
De
nm
ark
Fra
nce
Italy
Sw
ed
en
Ire
lan
d
Bu
lga
ria
Slo
vaki
a
Lith
ua
nia
Po
lan
d
Slo
ven
ia
Cze
ch R
ep
La
tvia
Cro
atia
Est
on
ia
Hu
ng
ary
Ro
ma
nia
15-24 25-39 40-54 55+
Source: Eurobarometer/nVisionBase: 1,000 per country aged 15+, 2007

Yet for affluent consumers life is already changing beyond recognition

Presentation structure
• Economic well being and life satisfaction• Socio-demographics• Values and attitudes• Leisure, tourism and travel

Size of CEE economies (population)
38 Million
10 Million
10 Million
5 Million
2 Million
3.7 Million2.7 Million
1.3 Million
22 Million
8 Million
148 Million

Population over 65 years as a % of total
0%
5%
10%
15%
20%
25%
30%
35%
Slo
ve
nia
Cze
ch
Re
p
Hu
ng
ary
Lit
ha
nia
Ro
ma
nia
La
tvia
Po
lan
d
Slo
va
kia
Ru
ss
ian
Fe
d
2000 2005 2010 2015 2020
2030 2035 2040
Source: World Bank/nVision
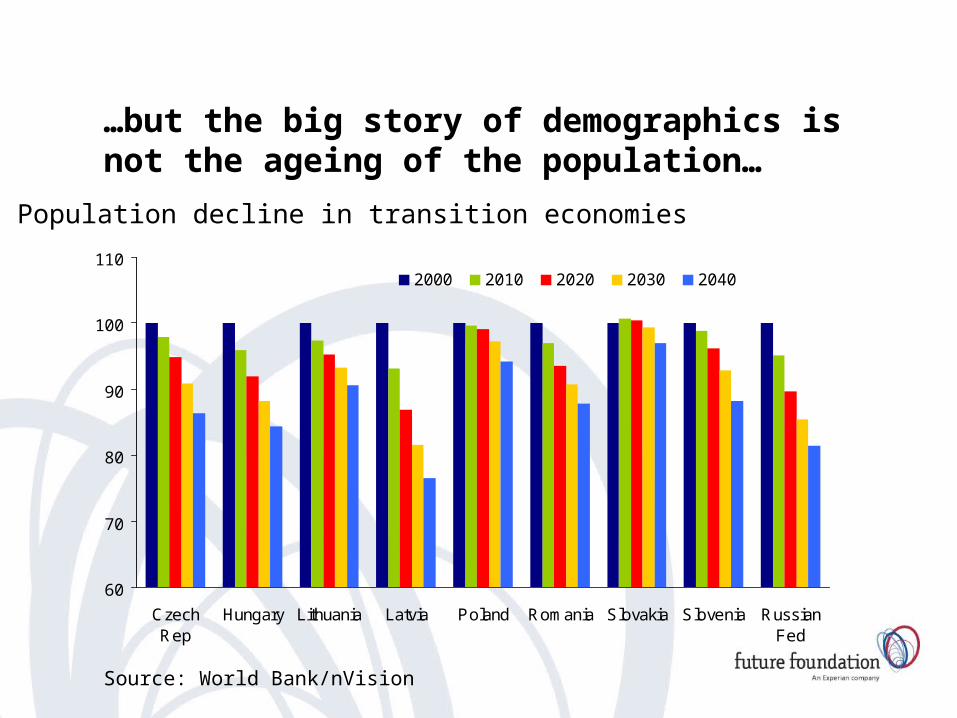
…but the big story of demographics is not the ageing of the population…
Population decline in transition economies
60
70
80
90
100
110
CzechRep
Hungary Lithuania Latvia Poland Romania Slovakia Slovenia RussianFed
2000 2010 2020 2030 2040
Source: World Bank/nVision

Russia’s demographic meltdown
80000
90000
100000
110000
120000
130000
140000
150000
20
05
20
10
20
15
20
20
20
25
20
30
20
35
20
40
20
45
20
45
20
50
20
55
20
60
20
65
20
70
20
75
20
80
20
85
20
90
Number of people, World Bank forecast
Source: World Bank/nVision

Life expectancy
60
62
64
66
68
70
72
74
76
78
80
19
70
19
72
19
74
19
76
19
78
19
80
19
82
19
84
19
86
19
88
19
90
19
92
19
94
19
96
19
98
20
00
20
02
Russia UK
Source: WHO/nVision 2003
At Birth

Presentation structure
• Economic well being and life satisfaction• Socio-demographics• Values and attitudes• Leisure, tourism and travel
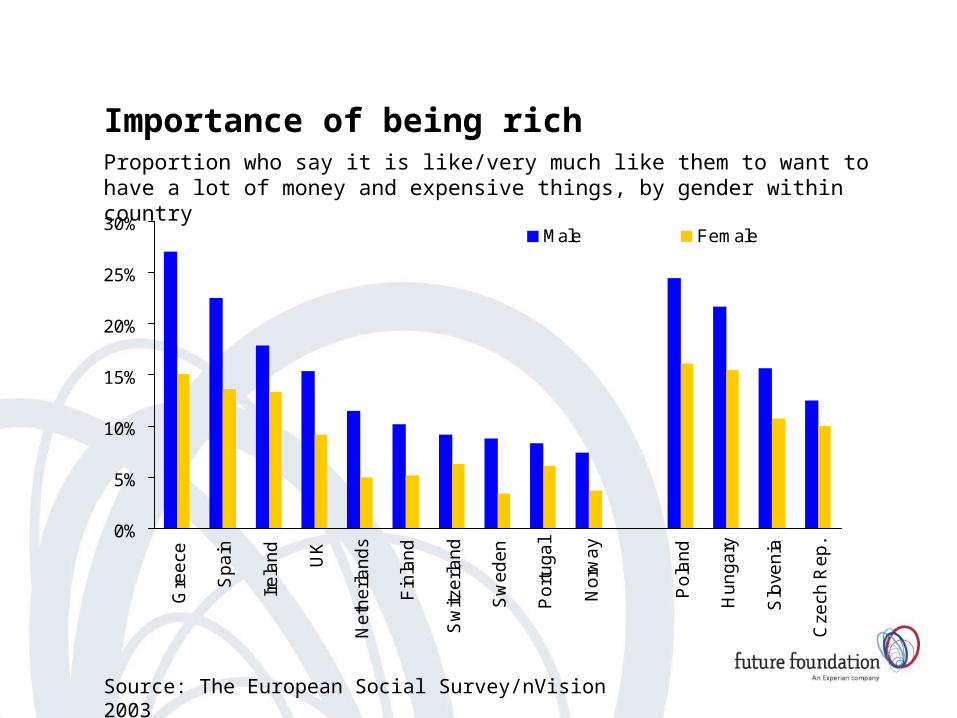
Importance of being rich
0%
5%
10%
15%
20%
25%
30%
Gre
ece
Sp
ain
Ire
lan
d
UK
Ne
the
rlan
ds
Fin
lan
d
Sw
itze
rlan
d
Sw
ed
en
Po
rtu
ga
l
No
rwa
y
Po
lan
d
Hu
ng
ary
Slo
ven
ia
Cze
ch R
ep
.
Male Female
Proportion who say it is like/very much like them to want to have a lot of money and expensive things, by gender within country
Source: The European Social Survey/nVision 2003

0%
10%
20%
30%
40%
50%
60%D
en
ma
rk
Italy
Sp
ain
GB
No
rwa
y
Ire
lan
d
Ne
the
rlan
ds
Sw
ed
en
Fra
nce
Ge
rma
ny
Po
lan
d
Ru
ssia
Cze
ch R
ep
.
Hu
ng
ary All
To be able to afford something To fulfil yourself
Proportion who chose a main wish from a list of five given options, by country
"If you had just one wish, which one of these would you choose?"
Source: nVision ResearchBase: 11,000 aged 15+ / 3,500 aged 16+ (Nordic), 2007

0%
10%
20%
30%
40%
50%
60%
70%
80%
90%
Sp
ain
Ire
lan
d
Italy
Ge
rma
ny
Ne
the
rlan
ds
Fra
nce
No
rwa
y
Sw
ed
en
De
nm
ark
GB
Po
lan
d
Hu
ng
ary
Cze
ch R
ep
.
Ru
ssia All
15-34 35-54 55+
Source: nVision ResearchBase: 11,000 aged 15+ / 3,500 aged 16+ (Nordic), 2007
Proportion who feel a strong or moderate need to own more things than they have now, by age“For each item, will you tell me whether you feel the need for it strongly, moderately, slightly, or not at all?” To own more things than I have now

20316:
Perception of luxury in Europe: East Vs. West“Looking at all these things, can you tell me, for you, which of the following things would be the best description of ‘luxury’ in your life?… and which of the others is the second best description, if any?"
0%
10%
20%
30%
40%
50%
60%
70%
80%
Materialism Enrichment Time
Western Europe Eastern Europe
Source: nVision ResearchBase: 11,000 aged 15+ / 3,500 aged 16 + (Nordic), 2007

19753: Mobility and Movement
‘Going on expensive holidays’ as the best description of luxury% who choose it as the best or second best description of ‘luxury’ in their life, by country“I would now like you to think about what ‘luxury’ means to you. Looking at all these things, can you tell me, for you, which of the following things would be the best description of 'luxury' in your life? And which of the others is the second best description of luxury in your life?”
0%
5%
10%
15%
20%
25%
30%
35%
40%S
pa
in
Italy
No
rwa
y
Sw
ed
en
Fra
nce
Ne
the
rlan
ds
Ire
lan
d
Ge
rma
ny
GB
De
nm
ark
Hu
ng
ary
Cze
ch R
ep
Ru
ssia
Po
lan
d
All
Source: nVision ResearchBase: 11,000 aged 15+ / 3,500 aged 16+ (Nordics), 2007

0%
10%
20%
30%
40%
50%
60%
70%
80%
90%
100%
Ge
rma
ny
UK
Ita
ly
Fra
nce
Sp
ain
Sw
ed
en
Ru
ssia
Po
lan
d
Hu
ng
ary
Cze
ch
Re
p
Traditional attitudes towards gender roles
Proportion who agree slightly or strongly that a man’s role is to earn money and a woman’s to look after the home, by country
Source: Changing Lives in Europe’, nVisionBase: 1000 aged 15+ per country, 2003
“Please indicate how much you agree or disagree with each of the following statements I read out…A man’s job is to earn money; a woman’s job is to look after the home and family?”

Ethical purchasing
0%
10%
20%
30%
40%
50%
60%
Po
rtu
ga
l
Gre
ec
e
Sp
ain
Ire
lan
d
Ne
the
rla
nd
s
UK
No
rwa
y
Fin
lan
d
Sw
itze
rla
nd
Sw
ed
en
Slo
ve
nia
Po
lan
d
Hu
ng
ary
Cze
ch
Re
p.
Source: The European Social Survey 2003
% Bought product for political /ethical/ environment reason last 12 months

Presentation structure
• Economic well being and life satisfaction• Socio-demographics• Values and attitudes• Leisure, tourism and travel
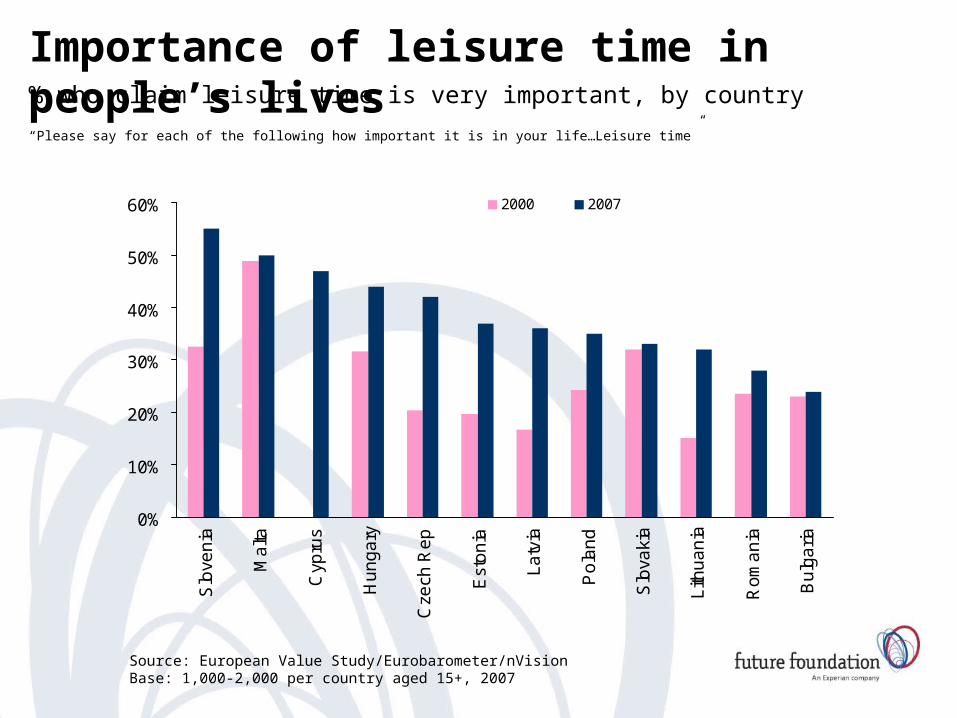
Importance of leisure time in people’s lives % who claim leisure time is very important, by country
“Please say for each of the following how important it is in your life…Leisure time”
0%
10%
20%
30%
40%
50%
60%S
love
nia
Ma
lta
Cyp
rus
Hu
ng
ary
Cze
ch R
ep
Est
on
ia
La
tvia
Po
lan
d
Slo
vaki
a
Lith
ua
nia
Ro
ma
nia
Bu
lga
ria
2000 2007
Source: European Value Study/Eurobarometer/nVisionBase: 1,000-2,000 per country aged 15+, 2007

Tourists to other countries in Europe, % by region
E a s te rn E u ro p e
3 9 %E U 1 56 1 %
Source: World Tourism Organisation/nVision
Czech Rep23%
Russia18%
Poland26%
Hungary12%
Turkey5%
Romania*5%
Bulgaria3%
Lithuania*2% Other
6%
In 2005 there were 1 million Polish tourists visiting the UK
CEE tourists to other countries in Europe, % by country
In 2005 there were 13 million more
tourist from the CEE than in 2002
22010: Mobility and Movement
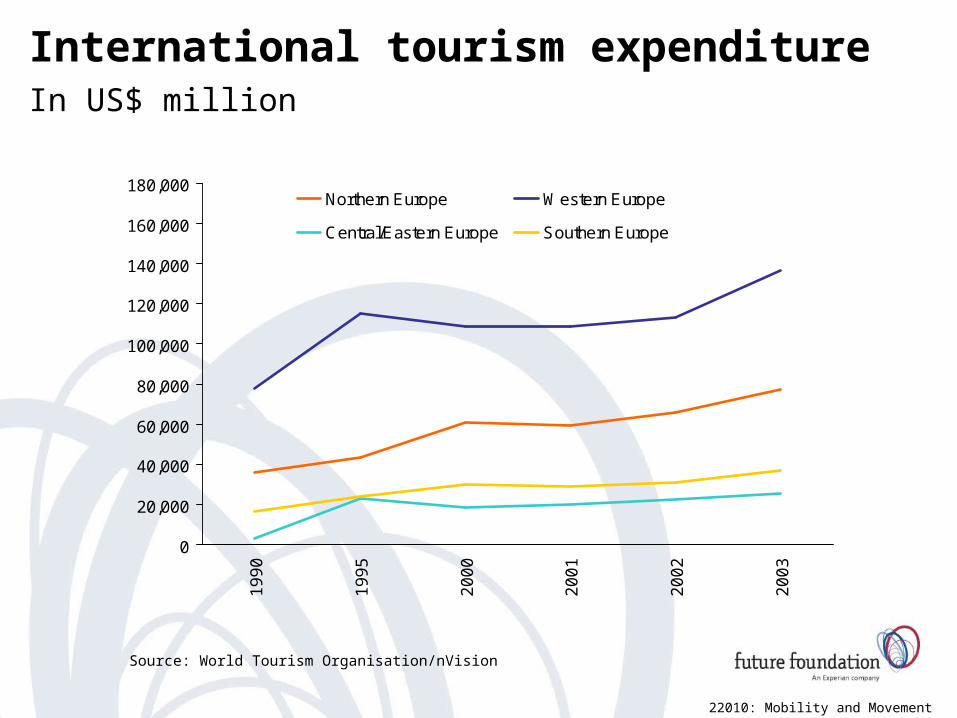
International tourism expenditureIn US$ million
0
20,000
40,000
60,000
80,000
100,000
120,000
140,000
160,000
180,000
19
90
19
95
20
00
20
01
20
02
20
03
Northern Europe Western Europe
Central/Eastern Europe Southern Europe
Source: World Tourism Organisation/nVision

23860: Travel and Tourism in Europe
% who have bought package holidays, by countryIn the last 12 months“In the last 12 months, have you purchased a package holiday that is a combination of transport and accommodation from a company based in the EU?”
0%
10%
20%
30%
40%D
en
ma
rk
Lu
xem
bo
urg
Au
stria
Ire
lan
d
Sw
ed
en
Be
lgiu
m
Ne
the
rlan
ds
Ge
rma
ny
Fin
lan
d
UK
Italy
Sp
ain
Fra
nce
Po
rtu
ga
l
Cze
ch R
ep
Slo
ven
ia
Slo
vaki
a
Cyp
rus
Est
on
ia
Ma
lta
Hu
ng
ary
La
tvia
Po
lan
d
Lith
ua
nia
EU
25
Source: Eurobarometer/nVisionBase: 1,000 per country aged 15+, 2006

19753: Mobility and Movement
Interest in different types of holiday in Czech Rep. and Poland
EU= 12 countries
0%
5%
10%
15%
20%
25%
30%
35%
40%
45%
50%
55%
60%
Cze
ch R
ep
Po
lan
d
EU
Cze
ch R
ep
Po
lan
d
EU
Cze
ch R
ep
Po
lan
d
EU
Cze
ch R
ep
Po
lan
d
EU
Source: nVision ResearchBase: 1,000 per country aged 15+, 2005
Cultural Health farm SpecialistAdventure
23000: Mobility and Movement
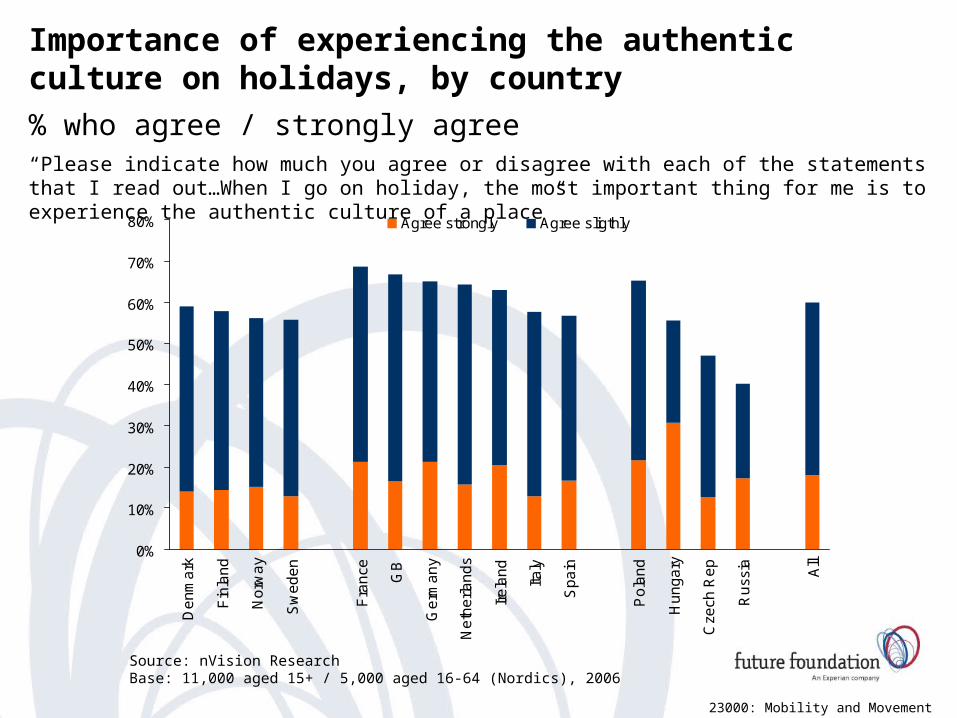
Importance of experiencing the authentic culture on holidays, by country
% who agree / strongly agree“Please indicate how much you agree or disagree with each of the statements that I read out…When I go on holiday, the most important thing for me is to experience the authentic culture of a place”
0%
10%
20%
30%
40%
50%
60%
70%
80%
De
nm
ark
Fin
lan
d
No
rwa
y
Sw
ed
en
Fra
nce GB
Ge
rma
ny
Ne
the
rlan
ds
Ire
lan
d
Italy
Sp
ain
Po
lan
d
Hu
ng
ary
Cze
ch R
ep
Ru
ssia All
Agree strongly Agree sligthly
Source: nVision ResearchBase: 11,000 aged 15+ / 5,000 aged 16-64 (Nordics), 2006

Using the internet for travel related activities
% of internet users who have used the internet for travel services or to order travel and accommodation
0%
10%
20%
30%
40%
50%
60%
70%
Fin
lan
d
No
rwa
y
UK
Sw
ed
en
Ne
the
rlan
ds
Ge
rma
ny
Ire
lan
d
Au
stria
Sp
ain
Fra
nce
Italy
Gre
ece
Slo
ven
ia
Cze
ch R
ep
Slo
vaki
a
Est
on
ia
Hu
ng
ary
La
tvia
Cyp
rus
Lith
ua
nia
Po
lan
d
Bu
lga
ria
EU
25
EU
15
Services related to travel ans accommodation Ordered travel and accommodation
Source: Eurostat annual survey on ICT/nVisionBase: Internet users aged 15+

22829: Mobility and Movement
Language skills% who can speak at least another language, by country“Which languages do you speak well enough in order to be able to have a conversation, excluding your mother tongue?”
0%
10%
20%
30%
40%
50%
60%
70%
80%
90%
100%
Slo
vaki
a
La
tvia
Lith
ua
nia
Slo
ven
ia
Est
on
ia
Cze
ch R
ep
.
Po
lan
d
Hu
ng
ary
Speaks at least one foreigh language Speaks English
Source: Eurobarometer/nVisionBase: 1,000 per country aged 15+, 2006

23515: Mobility and Movement
% considering moving to another EU country to work or study or after retirement, by country
0%
5%
10%
15%
20%
25%
30%
35%
Sw
ed
en
De
nm
ark
Lu
xem
bo
urg
Fin
lan
d
Be
lgiu
m
UK
Ge
rma
ny
Ne
the
rlan
ds
Au
stria
Fra
nce
Ire
lan
d
Italy
Gre
ece
Po
rtu
ga
l
Sp
ain
La
tvia
Lith
ua
nia
Po
lan
d
Est
on
ia
Slo
vaki
a
Slo
ven
ia
Hu
ng
ary
Cze
ch R
ep
EU
25
After retirement To work Study
Source: Eurobarometer/nVisionBase: 24,642 aged 15+, 2005
“Have you, yourself, ever considered living in another Member State in order to study/work/after retirement?”

23515: Mobility and Movement
Willingness to move to another EU country to find employment
% who answered 'yes'"Would you be willing to move to another EU country to find employment if you were unemployed?"
0%
10%
20%
30%
40%
50%
60%
Lu
xem
bo
urg
Sw
ed
en
Ne
the
rlan
ds
Fin
lan
d
UK
Italy
Fra
nce
Be
lgiu
m
Sp
ain
Ge
rma
ny
De
nm
ark
Gre
ece
Po
rtu
ga
l
Ire
lan
d
Au
stria
Po
lan
d
Lith
ua
nia
La
tvia
Ma
lta
Slo
ven
ia
Slo
vaki
a
Est
on
ia
Cyp
rus
Cze
ch R
ep
Hu
ng
ary
EU
25
Source: Eurobarometer/nVisionBase: 24,642 aged 15+, 2005

Summary
• CEE consumers still display distinctive characteristics – but attitudes and behaviours are converging with those in the west
• Continued convergence not inevitable – highly dependent on continued economic growth
• CEE not at the leading edge of many trends such as ethical purchasing and show more traditional attitudes towards consumption, materialism and luxury
• Leisure and tourism is an increasing consumer spending priority – though again not as likely to be looking for ‘leading edge’ holiday experiences
• Highly mobile younger populations create a strong VFR market