The east african bribery index trends analysis (2010 2014)
87
THE EAST AFRICAN BRIBERY INDEX TRENDS ANALYSIS (2010 - 2014) TRANSPARENCY INTERNATIONAL UGANDA ABUCO TRANSPARENCY INTERNATIONAL BURUNDI TRANSPARENCY INTERNATIONAL UGANDA
-
Upload
transparency-international-kenya -
Category
Documents
-
view
214 -
download
0
description
The East Africa Bribery Index Trends Analysis is a presentation of the patterns that have emerged from the East African Bribery Index reports published between 2010 and 2014. The trends analysis focused on five sectors: the Police, Judiciary, Registry and licensing services, Land services, and Tax services.
Transcript of The east african bribery index trends analysis (2010 2014)
t h e e a s t a f r i c a n b r i b e r y i n d e x
t r e n d s a n a l y s i s ( 2 0 1 0 - 2 0 1 4 )
TRANSPARENCYINTERNATIONALUGANDA
ABUCOTRANSPARENCYINTERNATIONALBURUNDI
TRANSPARENCYINTERNATIONAL
UGANDA
2 | .......................................................................................................THE EAST AFRICAN BRIBERY INDEX TRENDS ANALYSIS (2010-2014)
THE EAST AFRICA BRIBERY INDEX TRENDS ANALYSIS
(2010-2014)

2 | .......................................................................................................THE EAST AFRICAN BRIBERY INDEX TRENDS ANALYSIS (2010-2014) THE EAST AFRICAN BRIBERY INDEX TRENDS ANALYSIS (2010-2014)........................................................................................ | 3
Transparency International Kenya, 2015
Every effort has been made to verify the accuracy of the information contained in this report. All information was believed to be correct as of December 2015. Transparency International Kenya does not accept responsibility for the consequences of the use of the report’s contents
for other purposes or in other contexts.

4 | .......................................................................................................THE EAST AFRICAN BRIBERY INDEX TRENDS ANALYSIS (2010-2014)
Table of ContentsList of figures. ..........................................................................................................................................................2
List of tables...............................................................................................................................................................4
ACKNOWLEDGEMENT.......................................................................................................................................6
EXECUTIVE SUMMARY......................................................................................................................................7
INTRODUCTION..................................................................................................................................................8
METHODOLOGY............................................................................................................................................11
COUNTRY ANALYSIS..........................................................................................................................16
BURUNDI....................................................................................................................................................16
KENYA..................................................................................................................................................29
RWANDA......................................................................................................................................................47
TANZANIA..................................................................................................................................................61
UGANDA.....................................................................................................................................................74
CONCLUSION..............................................................................................................................90
OVERALL RECOMMENDATIONS......................................................................................................91
ANNEX 1: Country Rankings..............................................................................................................92
Annex 2 : Percentage of those who reported corruption incidents across the region....................94
Annex 3 : Reasons for not reporting bribes...........................................................................................94
Annex 4: Reason for paying bribes..........................................................................................................96
REFERENCES..................................................................................................................................98
4 | .......................................................................................................THE EAST AFRICAN BRIBERY INDEX TRENDS ANALYSIS (2010-2014) THE EAST AFRICAN BRIBERY INDEX TRENDS ANALYSIS (2010-2014)........................................................................................ | 5
LIST OF FIGURESFigure 1: Five year Gender breakdown – Regional..............................................................................................13
Figure 2: Five year residence breakdown – Regional .................................................................................14
Figure 3: Five year Age breakdown – Regional.............................................................................................14
Figure 4: Five year income breakdown – regional.........................................................................................15
Figure 5: Percentage of those who reported in Burundi..................................................................................16
Figure 6: Aggregate Score trends– Burundi Judiciary..................................................................................18
Figure 7: Various indicator trends – Burundi Judiciary..................................................................................18
Figure 8: Aggregate score trends – Burundi Land services..................................................................................19
Figure 9: Various indicators – Burundi land services..................................................................................20
Figure 10: Aggregate score trends – Burundi police..................................................................................21
Figure 11: Various indicator trends – Burundi police..................................................................................21
Figure 12: Aggregate score – Burundi registry and licensing services................................................................22
Figure 13: Various indicator trends - Burundi registry and licensing services...........................................23
Figure 14: Aggregate score trends – Burundi tax services..................................................................................24
Figure 15: Various indicator trends –Burundi tax services..................................................................................24
Figure 16: Perceived levels of corruption – Burundi ..................................................................................26
Figure 17: Perceived change in corruption levels - Burundi..................................................................................27
Figure 18: Perceived government efforts to fight corruption................................................................................27
Figure 19: Percentage of those who reported in Kenya...................................................................................30
Figure 20: Aggregate score trends – Kenya Judiciary..................................................................................32
Figure 21: Various indicator trends – Kenya Judiciary..................................................................................32
Figure 22: Aggregate score trends – Land services Kenya..................................................................................34
Figure 23: Various indicator trends – Land services –Kenya..................................................................................35
Figure 24: Aggregate score trends – Kenya police..................................................................................36
Figure 25: Various indicator scores – Kenya police..................................................................................37
Figure 26: Aggregate score trends – Registry and licensing services Kenya..........................................................39
Figure 27: Various indicator trends - Registry and licensing services Kenya........................................................40
Figure 28: Aggregate score trends – Tax services Kenya..................................................................................41
Figure 29: Various indicator scores -Tax services Kenya..................................................................................42
Figure 30: Perceived levels of corruption –Kenya..................................................................................44
Figure 31: Perceived change of corruption levels –Kenya..................................................................................45
Figure 32: Perceived Government effort to fight corruption.............................................................................45
Figure 33: Corruption reporting levels –Rwanda..................................................................................50
Figure 34: Aggregate score trend – Rwanda Judiciary..................................................................................51
Figure 35: Various indicator trends – Rwanda Judiciary..................................................................................51
Figure 36: Aggregate score trends – Rwanda land services..................................................................................52
Figure 37: Various indicators – Rwanda land services..................................................................................52
Figure 38: Aggregate score trends – Rwanda Police..................................................................................54
6 | .......................................................................................................THE EAST AFRICAN BRIBERY INDEX TRENDS ANALYSIS (2010-2014)
Figure 39: Various indicators – Rwanda Police............................................................................................54
Figure 40: Aggregate score trends – Rwanda registration and licensing services.............................................56
Figure 41: Various indicators - Registry and licensing services –Rwanda......................................................56
Figure 42: Aggregate score- Tax services Rwanda..................................................................................58
Figure 43: Various indicators – Tax services – Rwanda..................................................................................58
Figure 44: Perceived levels of corruption – Rwanda..................................................................................60
Figure 45: Projected change in levels of corruption - Rwanda...................................................................60
Figure 46: Perceived government effort to fight corruption –Rwanda............................................................61
Figure 47: Percentage of those who reported bribery in Tanzania................................................................62
Figure 48: Aggregate score trends – Tanzania Judiciary..................................................................................63
Figure 49: Various indicators – Tanzania Judiciary......................................................................................64
Figure 50: Aggregate score trends – Tanzania Land services......................................................................65
Figure 51: Various indicator trends - Tanzania Land services....................................................................66
Figure 52: Aggregate score trends – Tanzania Police ..................................................................................67
Figure 53: Various indicator trends – Tanzania Police..................................................................................67
Figure 54: Aggregate score trends – Tanzania registry and licensing.................................................................68
Figure 55: Various indicator trends – Tanzania registry and licensing services ......................................69
Figure 56: Aggregate Score trends – Tanzania revenue authority..............................................................70
Figure 57: Various indicator trends – Tanzania tax services......................................................................70
Figure 58: Perceived levels of corruption – Tanzania..................................................................................72
Figure 59: Perceived change in corruption levels –Tanzania......................................................................72
Figure 60: Is the government doing enough to fight corruption? - Tanzania..............................................73
Figure 61: Percentage of those who reported bribery in Uganda...............................................................75
Figure 62: Aggregate score trends – Uganda Judiciary..................................................................................76
Figure 63: Various indicator trends – Uganda Judiciary..................................................................................77
Figure 64: Aggregate score trends – Land services- Uganda.....................................................................78
Figure 65: Various indicators – Uganda Land services..................................................................................78
Figure 66: Aggregate score trends – Uganda Police..................................................................................80
Figure 67: Various indicator trends – Uganda police..................................................................................81
Figure 68: Aggregate score trends – Uganda Registry and licensing services...................................................82
Figure 69: Various indicator trends - Uganda Registry and licensing services..........................................83
Figure 70: Aggregate score trends – Uganda tax services..................................................................................84
Figure 71: Various indicator trends - Uganda tax services..................................................................................85
Figure 72: Perceived levels of corruption – Uganda.....................................................................................87
Figure 73: Perceived change in corruption levels – Uganda.....................................................................88

6 | .......................................................................................................THE EAST AFRICAN BRIBERY INDEX TRENDS ANALYSIS (2010-2014) THE EAST AFRICAN BRIBERY INDEX TRENDS ANALYSIS (2010-2014)........................................................................................ | 7
LIST OF TABLESTable 1: Reasons for not reporting corruption – Burundi............................................................................17
Table 2: Average Size of bribe – Burundi Judiciary........................................................................................19
Table 3: Average Size of bribe – Burundi land services....................................................................................20
Table 4: Average size of bribe – Burundi police...........................................................................................22
Table 5: Average size of bribes- Burundi registry and licensing services...................................................23
Table 6: Average size of bribe – Burundi tax services................................................................................25
Table 7: Reasons for paying bribes – Burundi...............................................................................................26
Table 8: Reasons for not reporting corruption – Kenya...........................................................................31
Table 9: Average size of bribe – Kenya Judiciary........................................................................33
Table 10: Average size of bribery – Land Services Kenya........................................................................35
Table 11: Average size of bribe – Kenya Police........................................................................37
Table 12: Average size if bribe - Registry and licensing services Kenya...................................................40
Table 13: Average size of bribe - Tax services Kenya ........................................................................42
Table 14: Reason for paying bribes – Kenya . . . . . . . . . . . . . . . . . . . . . . . . . . . . . . . . . . . . . . . . . . . . . . . . . . . . . . . . . . . . . . . . . . . . . . . . 43
Table 15: Reasons for not reporting corruption........................................................................50
Table 16: Average size of bribery – Rwanda Judiciary........................................................................51
Table 17: Average size of bribe – Rwanda land services.....................................................................................53
Table 18: Average size of bribe – Rwanda police..........................................................................................54
Table 19: Average size of bribe- Registry and licensing services –Rwanda....................................................57
Table 20: Average size of bribe –Rwanda Tax services................................................................................58
Table 21: common reasons for paying bribes- Rwanda...............................................................................59
Table 22: Reason for not reporting bribery -Tanzania.................................................................................63
Table 23: Average size of bribe – Tanzania Judiciary ........................................................................64
Table 24: Average size of bribes - Tanzania Land services..............................................................................66
Table 25: Average size of bribe – Tanzania Police.............................................................................68
Table 26: Average size of bribery – Tanzania registry and licensing services.................................................69
Table 27: Average size of bribe – Tanzania tax services..........................................................................70
Table 28: Reasons for paying bribes in Tanzania...................................................................................71
Table 29: Reason for not reporting corruption in Uganda...............................................................................75
Table 30: Average size of bribe – Uganda Judiciary.........................................................................................77
Table 31: Average size of bribe – Lands service –Uganda...............................................................................78
Table 32: Average size of bribe – Uganda Police.........................................................................................81
Table 33: Average size of bribery -Uganda Registry and licensing services.............................................83
Table 34: Average size if bribe -Uganda tax services.................................................................................85
Table 35: Reason for paying bribes ...............................................................................................................86
8 | .......................................................................................................THE EAST AFRICAN BRIBERY INDEX TRENDS ANALYSIS (2010-2014)
ACKNOWLEDGEMENT
The East Africa Bribery Index Trends Analysis is a collaborative effort between Transparency International chapters in Burundi, Kenya, Rwanda and Uganda. We particularly wish to recognise invaluable contribution from Vaclav Prusa in Rwanda, Gerald Padde in Uganda, Ella Ndikumana in Burundi, Job Munyua ,Harriet Wachira and Collins Baswony in Kenya for their various roles during the preparation of the report.
We are grateful to the Embassy of the Kingdom of Netherlands in Kenya and the Democratic Governance Facility (DGF) in Uganda for the financial support that enabled the production of this report.
8 | .......................................................................................................THE EAST AFRICAN BRIBERY INDEX TRENDS ANALYSIS (2010-2014) THE EAST AFRICAN BRIBERY INDEX TRENDS ANALYSIS (2010-2014)........................................................................................ | 9
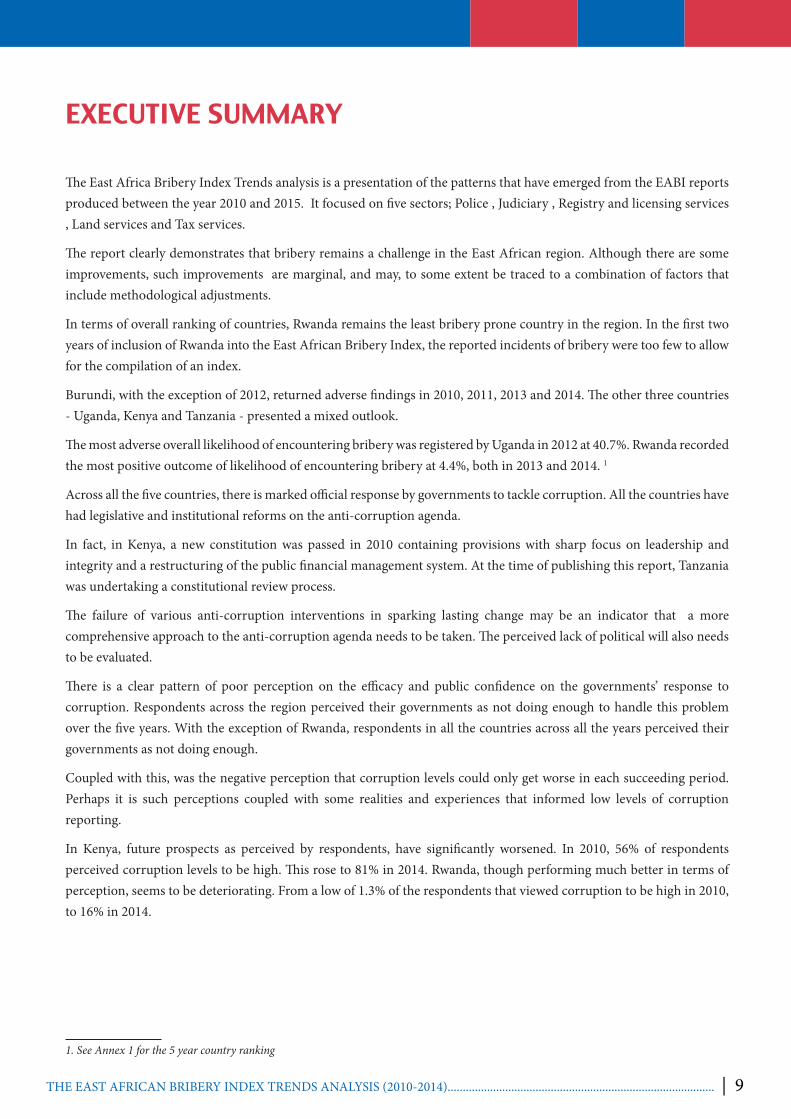
EXECUTIVE SUMMARY
The East Africa Bribery Index Trends analysis is a presentation of the patterns that have emerged from the EABI reports produced between the year 2010 and 2015. It focused on five sectors; Police , Judiciary , Registry and licensing services , Land services and Tax services.
The report clearly demonstrates that bribery remains a challenge in the East African region. Although there are some improvements, such improvements are marginal, and may, to some extent be traced to a combination of factors that include methodological adjustments.
In terms of overall ranking of countries, Rwanda remains the least bribery prone country in the region. In the first two years of inclusion of Rwanda into the East African Bribery Index, the reported incidents of bribery were too few to allow for the compilation of an index.
Burundi, with the exception of 2012, returned adverse findings in 2010, 2011, 2013 and 2014. The other three countries - Uganda, Kenya and Tanzania - presented a mixed outlook.
The most adverse overall likelihood of encountering bribery was registered by Uganda in 2012 at 40.7%. Rwanda recorded the most positive outcome of likelihood of encountering bribery at 4.4%, both in 2013 and 2014. 1
Across all the five countries, there is marked official response by governments to tackle corruption. All the countries have had legislative and institutional reforms on the anti-corruption agenda.
In fact, in Kenya, a new constitution was passed in 2010 containing provisions with sharp focus on leadership and integrity and a restructuring of the public financial management system. At the time of publishing this report, Tanzania was undertaking a constitutional review process.
The failure of various anti-corruption interventions in sparking lasting change may be an indicator that a more comprehensive approach to the anti-corruption agenda needs to be taken. The perceived lack of political will also needs to be evaluated.
There is a clear pattern of poor perception on the efficacy and public confidence on the governments’ response to corruption. Respondents across the region perceived their governments as not doing enough to handle this problem over the five years. With the exception of Rwanda, respondents in all the countries across all the years perceived their governments as not doing enough.
Coupled with this, was the negative perception that corruption levels could only get worse in each succeeding period. Perhaps it is such perceptions coupled with some realities and experiences that informed low levels of corruption reporting.
In Kenya, future prospects as perceived by respondents, have significantly worsened. In 2010, 56% of respondents perceived corruption levels to be high. This rose to 81% in 2014. Rwanda, though performing much better in terms of perception, seems to be deteriorating. From a low of 1.3% of the respondents that viewed corruption to be high in 2010, to 16% in 2014.
1. See Annex 1 for the 5 year country ranking

10 | .......................................................................................................THE EAST AFRICAN BRIBERY INDEX TRENDS ANALYSIS (2010-2014)
INTRODUCTION
The idea of conducting a regional survey on bribery was conceptualised in 2008. Transparency International national chapters in Kenya and Uganda partnered with Concern for Development Initiatives in Africa (ForDia), a contact organisation in Tanzania, to roll out the inaugural index. The East African Bribery Index was thus born.
Due to initial logistical challenges, the East African Bribery Index could not be rolled out to cover all the five East African countries in the first edition. However, in 2010, the survey covered all the five countries (Burundi , Kenya , Rwanda , Tanzania and Uganda ) and has since been conducted in the region annually.
The motivation towards a regional approach to bribery measurement was informed by dynamics in regional integration that culminated in the coming into force of the East African Customs Union in July 2010. The interconnectedness in trade and commerce also implied the sharing of governance challenges across the region. The index was therefore a good barometer on how the different countries in the region fared in regard to bribery.
In the last six years, the East African Bribery Index has been an important tool to inform advocacy on improving service delivery in the East African region. The results have received attention by citizens, the media, policymakers, governments and civil society players. One of the notable pointers was an opportunity to present the report to the East African Legislative Assembly in 2012. Some institutions in the region have also adopted the annual survey as an indicator to their performance.
The bribery patterns captured under the East African Bribery Index closely mirror outcomes of related surveys. The World Bank’s Ease of Doing Business studyfor example, ranks Rwanda in a substantially better position than her peers in the region. For the last four years, only Rwanda managed a rank below 50 out of about 180 countries on business climate. On the other extreme, Burundi ranks least unfavourable in that survey.
Patterns in the East African Bribery Index reflect the same outlook for Burundi across the review period. Even though the World Bank survey is oriented towards business practice, the different study areas like payment of taxes, business licensing and registration of property reflect strongly on EABI’s interest areas like tax authorities, land, local authorities and registration and licensing.
The Mo Ibrahim Index on Africa governance portrays a similar pattern. Rwanda ranks higher across the review period. Although the index is composite derived from such indicators like rule of law, participation and human rights and sustainable development, the individual components are strongly influenced by corruption practices. Countries in the region fare worse compared to others like Cape Verde, Mauritius and Botswana. The Corruption Perception Index published annually by Transparency International likewise portrays a similar pattern.
The Global Corruption Barometer (GCB) conducted by Transparency International ranks police as the most bribery prone institution across the region for both 2011 and 2013 versions corresponding to the period under review. EABI results likewise rank police as the most bribery prone institution across the region in all the countries with some very marginal exception.
CORRUPTION AS A CHALLENGE TO DEVELOPMENT IN THE REGION
The economies in East Africa have been on a growth trajectory in the last decade. The region is one of the fastest growth frontiers in the world2. In the coming decades, member states are projected to have higher GDP and income per capita3.
The rosy outlook may however eclipse concerns about equality and whether that growth will benefit the poor majority. Corruption, especially in essential services, remains a threat likely to dilute any benefits brought about by this growth to the citizens. Bribery trends in the East Africa Bribery Index across the years demonstrate bribery as being rife in key sectors like the Police, Judiciary and land services.
2 http://www.institutionalinvestor.com/article/3478383/banking-and-capital-markets-emerging-markets/impact-investing-powers-up-east-african-economies.html#.VlvtX7XfrIU3 https://www.google.com/?gws_rd=ssl#q=east+africa+economies+growing

10 | .......................................................................................................THE EAST AFRICAN BRIBERY INDEX TRENDS ANALYSIS (2010-2014) THE EAST AFRICAN BRIBERY INDEX TRENDS ANALYSIS (2010-2014)........................................................................................ | 11
Over the last five years, there has not been significant progress in the official government approach and commitment to tackling corruption. In the 2010 - 2014 period, the five East African countries have had general elections, with pledges to eradicate corruption and promote good governance featuring prominently. These pledges however seem not to have translated into practical solutions to tackle the vice.
Further, Kenya promulgated a new constitution in 2010 that created new governance frameworks. However, despite this, the overall situation has not significantly improved as initially envisaged. The political situation in Burundi is likely to enhance executive control of main governance institutions. This may create fertile grounds for corrupt practices. The United Nations election observers’ declaration of the June elections as not free or fair is likely to cause donor hesitation in supporting basic service delivery. Corruption in such sectors amid falling investments is likely to severely affect access to basic services.
As the regional integration process continues to roll on, member states have over the last five years, engaged on joint large scale infrastructural projects. This may be a pointer to a stronger and more stable region where citizens can develop resilience to demand for accountability. The formation of the East African Association of Anti-Corruption Authorities (EAAAC) is particularly an indication of the recognition of the importance and commitment towards a regional approach to anti-corruption. However, there is not much evidence on how much the the East African Association of Anti-Corruption Authorities has achieved.
The East African Community (EAC), through its law making organ, the East Africa Legislative Assembly (EALA), has considering enacting three bills to deal with corruption: The EAC Integrity and Anti-Corruption Bill, 2015; the EAC Procurement Bill, 2015 and the EAC Whistleblowers Bill 2015. These bills will be a welcome addition to the draft EAC protocol on combating and preventing corruption that is yet to be ratified by partner states.
Past research by Transparency International has indicated corruption affects the poor disproportionately. The implication of the concentration of bribery incidents in the provision of basic services therefore indicates reduced accessibility for the poor. In a region where close to half of the population lives below the poverty line4 and depends hugely on public services, bribery is likely to further worsen poverty levels.
The expressed commitment by the individual member states to tackle corruption over the last decade does not seem to have resulted into real change. There may be need to audit anti-corruption institutions, policies and practices in order to reinvigorate these campaigns.
This report captures the bigger picture in bribery trends across the region between 2010 and 2014. It is hoped that the patterns arising from the publication will shed light on the challenges related to bribery as a barrier to public service delivery in the region.
METHODOLOGYThe EABI 2010 - 2014
In the five year period that we have conducted the East African Bribery Index, 53,784 respondents, randomly sampled from the five East African countries were interviewed for the survey. Interviews were conducted face to face in all the five countries, incorporating citizens from rural and urban settings and from both genders as broken down in the demographics section. The objective of the survey was to map out bribery experiences of respondents across the five East African countries during interactions with key public service delivery institutions and sectors in the preceding 12 months by establishing the following:
i. Which institutions the respondent interacted with in the preceding 12 months while seeking services.
ii. Whether a bribe was explicitly asked (demanded), implicitly asked (expected) or offered by the respondent during the interaction.
4 http://data.worldbank.org/topic/poverty
12 | .......................................................................................................THE EAST AFRICAN BRIBERY INDEX TRENDS ANALYSIS (2010-2014)
iii. Whether the respondent paid the bribe that was demanded/ expected.
iv. Public perception on whether the services sought would have been rendered if a bribe was not paid.
From these questions, the survey derived five key indicators:
Indicator 1: Likelihood of encountering bribery
This indicator measures the likelihood of a respondent being asked or expected to pay a bribe when interacting with a particular sector. It also includes respondents who offered to pay a bribe. It is derived from the number of all bribery situations (demanded, expected, offered) registered in a sector as a proportion of all the interactions registered in that particular sector.
Indicator 2: Prevalence of bribery
This indicator measures the probability that a respondent would pay a bribe upon interacting with a particular sector. It is calculated as the proportion of the number of bribes recorded in a particular sector to the total number of interactions registered in that sector. A higher value indicates the high prevalence of bribery in a sector.
Indicator 3: Average size of bribe
This indicator captures the average amount of bribes paid by respondents while seeking services in a particular sector. It is the arithmetic mean of all bribes paid to a sector, relative to all the respondents reporting having paid a bribe to that sector. The values have also been provided in US dollars.
Indicator 4: Share of ‘national’ bribe
This is the proportion of bribes a sector accounts for relative to the total amount of bribes recorded by the survey across all sectors in a particular country. It reflects the proportional culpability of a sector as measured by the amount of bribes received.
Indicator 5: Perceived Impact of bribery
This indicator is derived from the respondent’s perception on whether they would have received the services they were seeking if they had not paid the bribe. It highlights the value that the respondents have on the bribes paid as the only means to access a service.
Aggregate Index
The aggregate index is a composite index resulting from the five different indicators of the survey. It ranges between 0 and 100, with a score of 100 being the worst score. It is a result of the different indicators of the survey, with the final score dependent on how the sector performed in the individual indicator.
CHANGE IN METHODOLOGY
Between 2010 and 2014, the survey has undergone some changes in methodology to respond to the needs and interests of the consumers and to better inform advocacy responses for Transparency International. In the initial versions, the survey studied and reported bribery practices within specific institutions. However, it was realised that due to interconnected nature of related institutions, advocacy could only be effective from a sectoral approach, which was adopted in 2012. The survey institutions were clustered into eight sectors namely education, health, registration and licensing, police, tax services, land, judiciary and local authorities.
There have also been some minor methodological adjustments across the period. It is therefore notable that whereas the overall trends are comparable, there may be need to appreciate the slight implications these changes have had over time. The methodological changes had more prevalent effect on the results of the likelihood as one of the indicators. This particular indicator fell substantially after the methodological changes in 2013.
12 | .......................................................................................................THE EAST AFRICAN BRIBERY INDEX TRENDS ANALYSIS (2010-2014) THE EAST AFRICAN BRIBERY INDEX TRENDS ANALYSIS (2010-2014)........................................................................................ | 13
THE EAST AFRICAN BRIBERY INDEX 2010 - 2014 TRENDS ANALYSIS METHODOLOGY
The trends analysis focused on five sectors: Judiciary, Police, Tax services, Land Services and Registry & Licensing Services. The institutions in these sectors have been ranked among the most bribery prone by the EABI since 2010.
These sectors also represent issues at the heart of the EAC integration and are relevant to regional trade that is vital to the economic prosperity of the region. The trends analysis therefore, traced the patterns of bribery that emerged across the five year period in the five sectors mentioned.
DEMOGRAPHICS
Gender
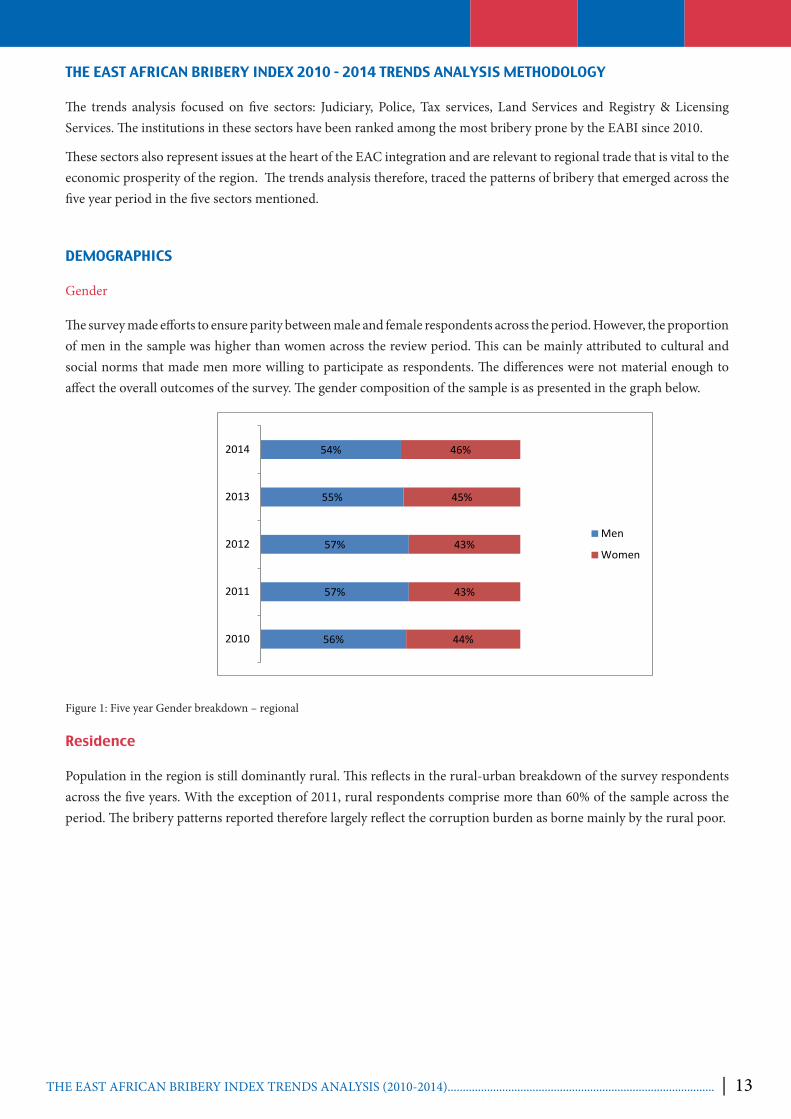
The survey made efforts to ensure parity between male and female respondents across the period. However, the proportion of men in the sample was higher than women across the review period. This can be mainly attributed to cultural and social norms that made men more willing to participate as respondents. The differences were not material enough to affect the overall outcomes of the survey. The gender composition of the sample is as presented in the graph below.
56%
57%
57%
55%
54%
44%
43%
43%
45%
46%
2010
2011
2012
2013
2014
Men
Women
Figure 1: Five year Gender breakdown – regional
Residence
Population in the region is still dominantly rural. This reflects in the rural-urban breakdown of the survey respondents across the five years. With the exception of 2011, rural respondents comprise more than 60% of the sample across the period. The bribery patterns reported therefore largely reflect the corruption burden as borne mainly by the rural poor.

14 | .......................................................................................................THE EAST AFRICAN BRIBERY INDEX TRENDS ANALYSIS (2010-2014)
Figure 2: Five year residence breakdown – regional
Age The middle aged group (30-49 years) comprised the bulk of the respondents. Though the survey employs simple random sampling, this age group represents a critical source of information due to social and economic realities. The group is more active in the work place due to late labour market entry arising from high unemployment rates in the region. Secondly, the group is more likely to comprise parents with young children that need social services such as education and health as provided by the public sector. The age group above fifty years was less prominent due to purposeful deselection and as a reflection of demographic realities.
38%
41%
23%
19%
30%
62%
59%
77%
81%
61%
2010
2011
2012
2013
2014
Urban
Rural
40%
38%
35%
35%
33%
50%
52%
52%
50%
51%
10%
11%
12%
15%
15%
2010
2011
2012
2013
2014
18-29
30-49
50+
Figure 3: Five year Age breakdown – regional
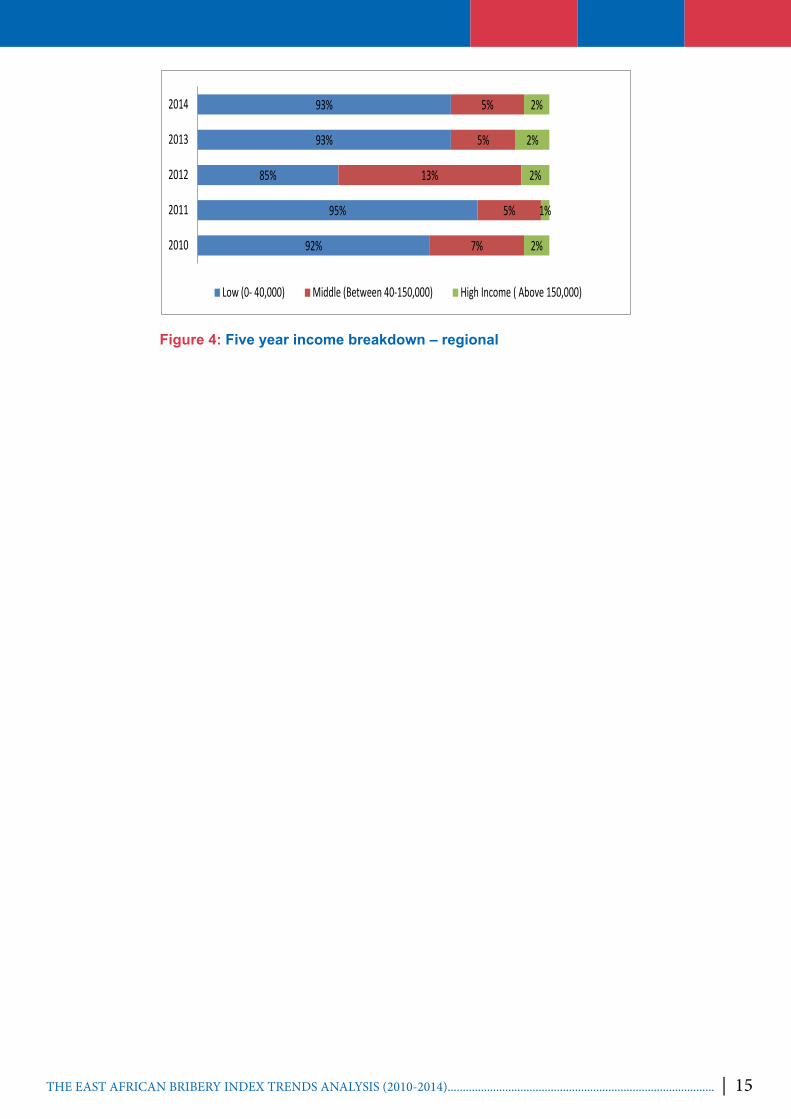
Income level The bulk of the respondents comprised low income earners. Although there was some degree of purposeful sampling for the low income earners, this also generally reflects the income situation across the region with obvious differences between the rural and urban segments. The negative effects of bribery and the artificial barriers to service delivery are therefore a bigger concern to the poor in the region. Ironically, it is the majority poor who have to rely on public services due to their inability to afford alternatives in the private sector that come at a premium.
14 | .......................................................................................................THE EAST AFRICAN BRIBERY INDEX TRENDS ANALYSIS (2010-2014) THE EAST AFRICAN BRIBERY INDEX TRENDS ANALYSIS (2010-2014)........................................................................................ | 15
92%
95%
85%
93%
93%
7%
5%
13%
5%
5%
2%
1%
2%
2%
2%
2010
2011
2012
2013
2014
Low (0- 40,000) Middle (Between 40-150,000) High Income ( Above 150,000)
Figure 4: Five year income breakdown – regional
16 | .......................................................................................................THE EAST AFRICAN BRIBERY INDEX TRENDS ANALYSIS (2010-2014)
BURUNDI
Background
Corruption has continued to be a key area of concern in Burundi. Various studies conducted on corruption indicate that Burundi is greatly affected. Corruption has affected service delivery with key sectors such as the Judiciary and the Police being particularly vulnerable5.
There however exist mechanisms in place to combat corruption in the country. Burundi’s constitution gives special attention through the fundamental principles namely, the establishment and consolidation of a democratic system of governance and compliance by the government, separation of powers, the rule of law, the principle of good governance and transparency in conduct of public affairs.
The 2005 constitution was developed with the hindsight of the strong role to be played by improved governance practices in promoting peace and stability. As a post conflict document, the constitution contains vital provisions like separation of powers, a specialised anti-corruption court and decentralisation6.
Further, a National Strategy of good governance and fight against corruption was developed and adopted by the government in October 2011. The implementation of this strategy has appealed to all the partners who were involved in its development to ensure the successful implementation of this strategy. This was a definite boost to the already existing legislation such as Law No 1/12 of 18/4/2006 for preventing and fighting corruption and related offences which is currently under review.
There are also other systems in place to fight corruption such as the Anti-corruption brigade and the anti-corruption court but the main challenge that remains is in the implementation and utilization of these systems.
5 http://www.ipstc.org/media/documents/IPSTC_OPNo3.pdf 6 http://www.icla.up.ac.za/images/country_reports/burundi_country_report.pdf

16 | .......................................................................................................THE EAST AFRICAN BRIBERY INDEX TRENDS ANALYSIS (2010-2014) THE EAST AFRICAN BRIBERY INDEX TRENDS ANALYSIS (2010-2014)........................................................................................ | 17
Corruption reporting in Burundi
8%
3%
11%11%
7%
Y2010 Y2011 Y2012 Y2013 Y2014
Figure 5: Percentage of those who reported in Burundi
During the period under review, on average only 8% of respondents reported the bribery incidents they encountered. This situation was not unique to Burundi as other countries in the region also had low reporting levels7. The lowest percentage of respondents reporting bribery was however recorded in 2011 in Burundi at 3%. The most common reason for not reporting bribery as put forward by respondents was fear of intimidation and reprisal8.
Table 1: Reasons for not reporting corruption - Burundi
According to Burundian law, bribery is regarded from two perspectives; it is either passive or active. This is in account of the person who initiates the act and whether the person has formal public position. Where the person soliciting, offering or accepting a bribe is a holder of public office, then this is viewed as active form of bribery. In terms of sanctions provided in law, both of these dimensions are equally punishable.
Burundi has specialised institutions mandated to handle bribery reports. These include the anti- corruption brigade and the Prosecutor General in the Anti-Corruption Court. The efficacy of the institutions is however put to test by the adverse levels of corruption in the country. Additionally, Burundi does not have a specific legislation to protect whistleblowers. This situation is likely to hold back citizens from reporting incidents of bribery.
The general view is that little or no action will be taken against the parties involved. Further, there is constant fear of harm and intimidation against those who report. This arises from differential power relations between the perpetrators
of bribery who are mainly persons in authority and the ordinary citizens.
7. See Annex 2 for regional comparison of reporting levels8 See Annex 3 for reasons for not reporting
Year Reasons for not reporting corruption Percentage 2010 Fear of intimidation 32%2011 Fear of intimidation 25%2012 It did not occur to me that I should report 26%2013 Fear of Intimidation / reprisal 31%2014 Fear of Intimidation / reprisal 18%2014 Fear of self-incrimination 18%2014 I was a beneficiary 18%
18 | .......................................................................................................THE EAST AFRICAN BRIBERY INDEX TRENDS ANALYSIS (2010-2014)
SECTOR ANALYSIS
JUDICIARY
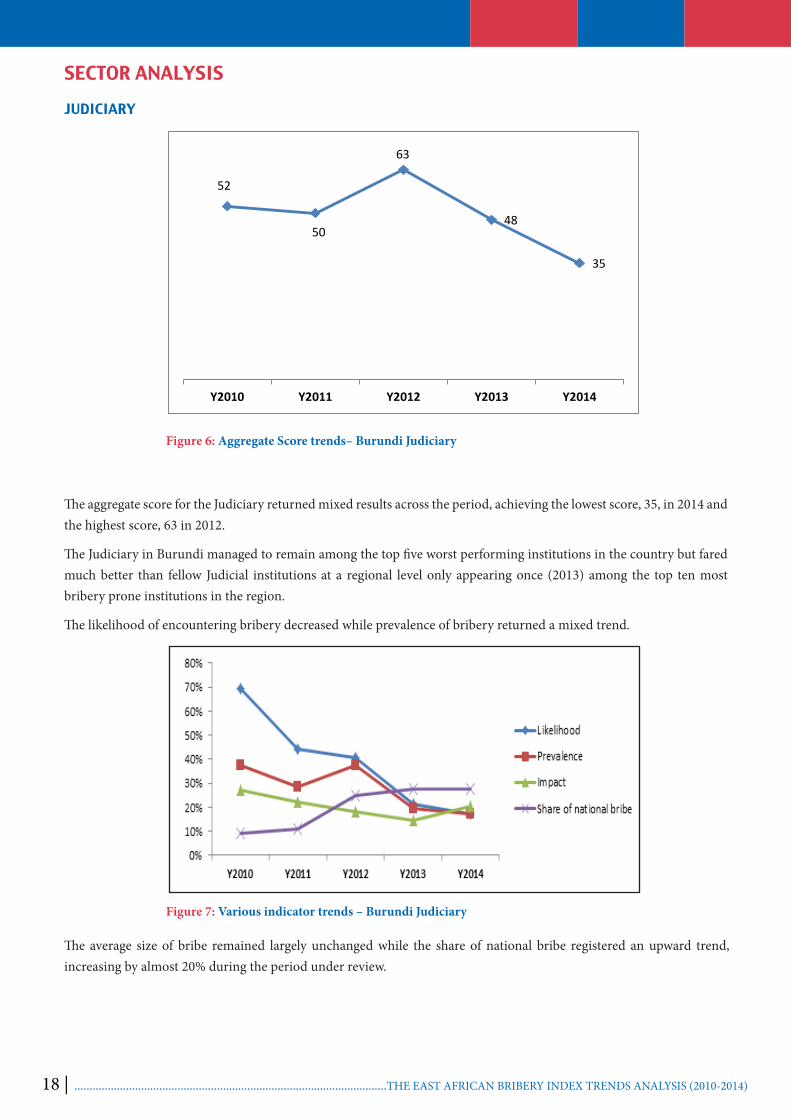
Figure 6: Aggregate Score trends– Burundi Judiciary
The aggregate score for the Judiciary returned mixed results across the period, achieving the lowest score, 35, in 2014 and the highest score, 63 in 2012.
The Judiciary in Burundi managed to remain among the top five worst performing institutions in the country but fared much better than fellow Judicial institutions at a regional level only appearing once (2013) among the top ten most bribery prone institutions in the region.
The likelihood of encountering bribery decreased while prevalence of bribery returned a mixed trend.
52
50
63
48
35
Y2010 Y2011 Y2012 Y2013 Y2014
Figure 7: Various indicator trends – Burundi Judiciary
The average size of bribe remained largely unchanged while the share of national bribe registered an upward trend, increasing by almost 20% during the period under review.
18 | .......................................................................................................THE EAST AFRICAN BRIBERY INDEX TRENDS ANALYSIS (2010-2014) THE EAST AFRICAN BRIBERY INDEX TRENDS ANALYSIS (2010-2014)........................................................................................ | 19
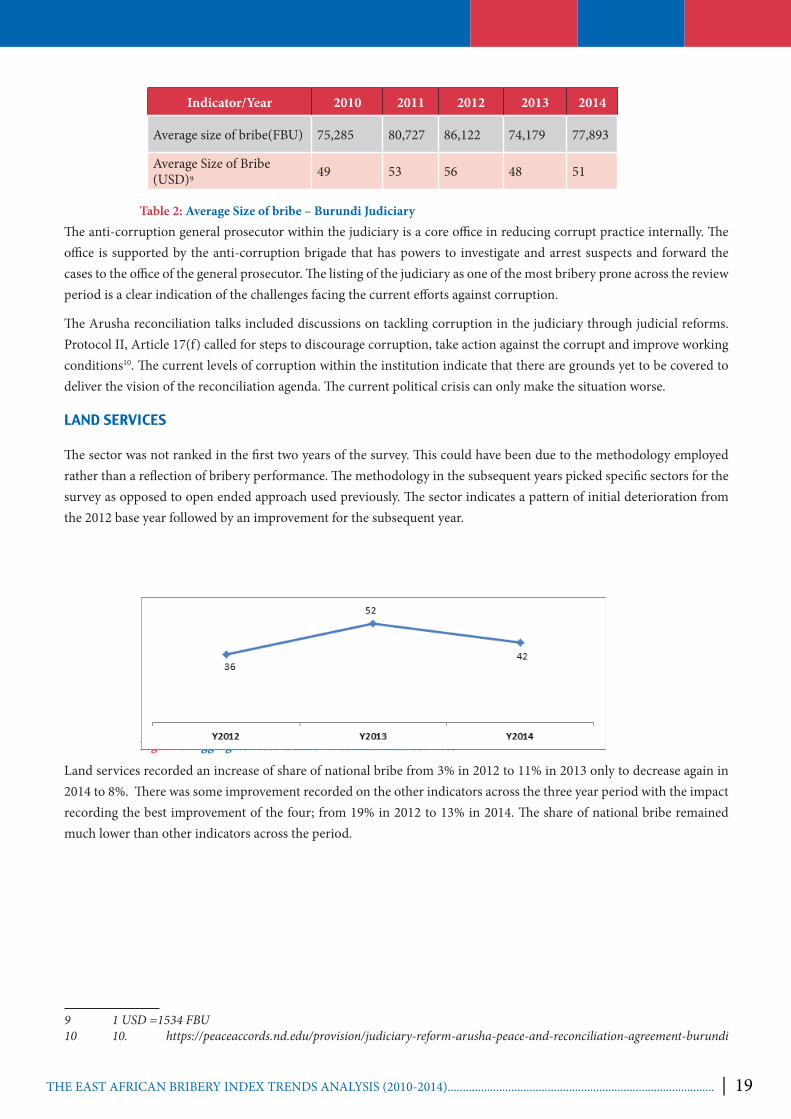
Indicator/Year 2010 2011 2012 2013 2014
Average size of bribe(FBU) 75,285 80,727 86,122 74,179 77,893
Average Size of Bribe (USD) 49 53 56 48 51
9
Table 2: Average Size of bribe – Burundi Judiciary The anti-corruption general prosecutor within the judiciary is a core office in reducing corrupt practice internally. The office is supported by the anti-corruption brigade that has powers to investigate and arrest suspects and forward the cases to the office of the general prosecutor. The listing of the judiciary as one of the most bribery prone across the review period is a clear indication of the challenges facing the current efforts against corruption.
The Arusha reconciliation talks included discussions on tackling corruption in the judiciary through judicial reforms. Protocol II, Article 17(f) called for steps to discourage corruption, take action against the corrupt and improve working conditions10. The current levels of corruption within the institution indicate that there are grounds yet to be covered to deliver the vision of the reconciliation agenda. The current political crisis can only make the situation worse.
LAND SERVICES
The sector was not ranked in the first two years of the survey. This could have been due to the methodology employed rather than a reflection of bribery performance. The methodology in the subsequent years picked specific sectors for the survey as opposed to open ended approach used previously. The sector indicates a pattern of initial deterioration from the 2012 base year followed by an improvement for the subsequent year.
Figure 8: Aggregate score trends – Burundi Land services
Land services recorded an increase of share of national bribe from 3% in 2012 to 11% in 2013 only to decrease again in 2014 to 8%. There was some improvement recorded on the other indicators across the three year period with the impact recording the best improvement of the four; from 19% in 2012 to 13% in 2014. The share of national bribe remained much lower than other indicators across the period.
9 1 USD =1534 FBU10 10. https://peaceaccords.nd.edu/provision/judiciary-reform-arusha-peace-and-reconciliation-agreement-burundi

16 | .......................................................................................................THE EAST AFRICAN BRIBERY INDEX TRENDS ANALYSIS (2010-2014)
Figure 9: Various indicators – Burundi land services
The average size of bribe in the lands services appreciated in 2013 by 20% only to decrease in the subsequent year to the lowest amount recorded across the three year period.
Indicator/Year 2012 2013 2014
Average size of bribe(FBU) 90,100 112,794 86,747
Average size of bribe(USD)2 59 74 57Table 3: Average Size of bribe – Burundi land services
Nearly 70% of disputes adjudicated at the lower courts in Burundi are land related. These cases are mostly about land boundaries authentication of transactions and request for allocations of public land. There have been challenges accessing some land services at the commune level as certificates of ownership are issued centrally at the Nation’s capital. The 2011 amendments to the Land Code in Burundi through Law No. 1/13 of 08/09/2011 saw to some positive changes such as issuance of land certificates at the commune level and allocation of public land for public utility only.11 While these amendments were a step in the right direction, it can be observed that citizens are still experiencing challenges accessing land services based on the results of the survey.
POLICE
Figure 10: Aggregate score trends – Burundi police
The police maintained highly adverse ranking across the period with an average of 72 points on the overall score.
In 2010 and 2011, Burundi police performed worse than their counterparts in the region and within the country was the worst performing institution for three of the five years and was second worst in the remaining two years under review.
However, on a general trend, the indicators reflect some improvements across the five years. It can be observed that the prevalence of bribe reduced from 54% in 2010 to 40% in 2013 while the perceived impact of bribes reduced from 47% in 2010 to 28% in 2014. The likelihood of bribery started off as the most adverse indicator but registered the sharpest decline.
11 https://www.issafrica.org/cdburundipeaceagreements/No%201%20arusha.pdf

16 | .......................................................................................................THE EAST AFRICAN BRIBERY INDEX TRENDS ANALYSIS (2010-2014) THE EAST AFRICAN BRIBERY INDEX TRENDS ANALYSIS (2010-2014)........................................................................................ | 17
Figure 11: Various indicator trends – Burundi police
The average size of bribe particularly fell by 69% between 2010 and 2014. Interestingly, even as the average bribery levels were falling, the share of all bribes that was collected by the police rose by almost 7%.
Indicator/Year 2010 2011 2012 2013 2014
Average size of bribe(FBU) 110,436 55,116 47,812 50,243 33,913
Average size of bribe(USD) 72 36 31 33 22 12 Table 4: Average size of bribe – Burundi police
According to US Government Country Reports on Human Right Practices (2012)13 problems facing the police in Burundi partly emanate from the political reconciliation process with the 2005 Constitution providing for a 50/50 composition of the police between the two main ethnic groups. A good proportion of the entrants were rebels and as many as 15% were noted to have received no training at all. The report further notes the force is poorly equipped and remunerated, laying rich ground for corruption.
REGISTRY AND LICENSING SERVICES
Figure 12: Aggregate score – Burundi registry and licensing services
This sector is equally susceptible to bribery practices. The patterns are more observable in business licensing arising from bribe demands to facilitate processing of business licenses and observance of other regulatory requirements. There was a drop in the aggregate score from 29 in 2010 to 15 in 2014. This is almost a 50% fall in bribery trend, a positive outcome for this institution.
It is worth noting that registry and licensing services was among the least bribery prone sectors covered by the survey during the period under review.
12 1 USD =1534 FBU13 http://www.state.gov/j/drl/rls/hrrpt/2012humanrightsreport/#wrapper
18 | .......................................................................................................THE EAST AFRICAN BRIBERY INDEX TRENDS ANALYSIS (2010-2014)
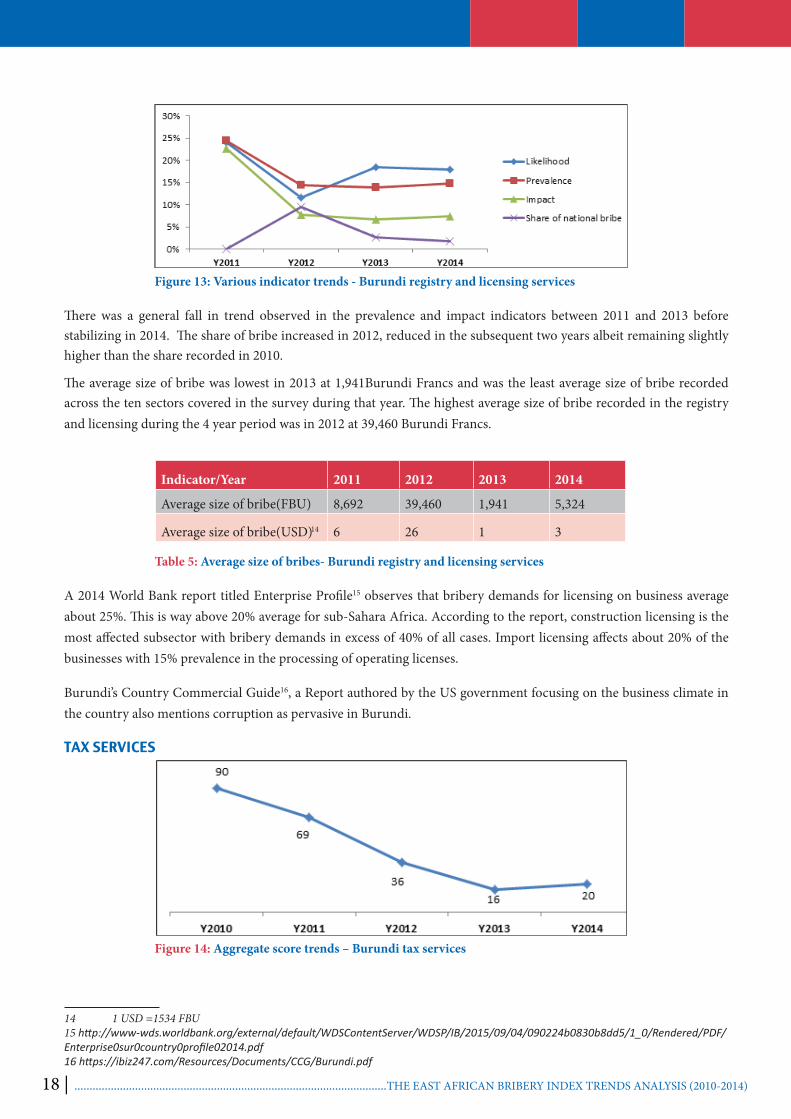
Indicator/Year 2011 2012 2013 2014
Average size of bribe(FBU) 8,692 39,460 1,941 5,324
Average size of bribe(USD) 6 26 1 3
Figure 13: Various indicator trends - Burundi registry and licensing services
There was a general fall in trend observed in the prevalence and impact indicators between 2011 and 2013 before stabilizing in 2014. The share of bribe increased in 2012, reduced in the subsequent two years albeit remaining slightly higher than the share recorded in 2010.
The average size of bribe was lowest in 2013 at 1,941Burundi Francs and was the least average size of bribe recorded across the ten sectors covered in the survey during that year. The highest average size of bribe recorded in the registry and licensing during the 4 year period was in 2012 at 39,460 Burundi Francs.
14
Table 5: Average size of bribes- Burundi registry and licensing services
A 2014 World Bank report titled Enterprise Profile15 observes that bribery demands for licensing on business average about 25%. This is way above 20% average for sub-Sahara Africa. According to the report, construction licensing is the most affected subsector with bribery demands in excess of 40% of all cases. Import licensing affects about 20% of the businesses with 15% prevalence in the processing of operating licenses.
Burundi’s Country Commercial Guide16, a Report authored by the US government focusing on the business climate in the country also mentions corruption as pervasive in Burundi.
TAX SERVICES
Figure 14: Aggregate score trends – Burundi tax services
14 1 USD =1534 FBU15 http://www-wds.worldbank.org/external/default/WDSContentServer/WDSP/IB/2015/09/04/090224b0830b8dd5/1_0/Rendered/PDF/Enterprise0sur0country0profile02014.pdf 16 https://ibiz247.com/Resources/Documents/CCG/Burundi.pdf

18 | .......................................................................................................THE EAST AFRICAN BRIBERY INDEX TRENDS ANALYSIS (2010-2014) THE EAST AFRICAN BRIBERY INDEX TRENDS ANALYSIS (2010-2014)........................................................................................ | 19
Indicator/Year 2010 2011 2012 2013 2014
Average size of bribe(FBU) 343,333 292,583 161,388 24,867 37,791
Average size of bribe(USD) 224 191 105 16 25
The tax services recorded improvement across the five years. All the indicators were lower in 2014 as compared to the base year of 2010. The fall in the overall score was quite dramatic from 90 points to just below 20 points. This may be partially explained by conscious efforts to reform the tax administration processes in Burundi. The reform process was steered by international consultancy firm `Adam Smith International17 and funded jointly by the Department for International Development (DFID) and Trademark East Africa (TMEA)
In 2010 and 2011, Burundi tax services was among the most bribery prone institutions on the region taking position one and three respectively. Further, it was one of two tax services to appear in the top ten adversely ranked institutions in the region, the other being Uganda Revenue Authority.
Figure 15: Various indicator trends –Burundi tax services
There is a general reduction in indicator trends across the review period with likelihood experiencing the most notable reduction. The share of bribery collected by the institution fell by more than 16%. At the same time, the average size of bribe fell by a notable 88%. This may be a reflection of deliberate and effective anti-bribery interventions in this particular institution.
Similarly, the average size of bribe dropped drastically from 343,333 Burundi Francs in 2010 to 37,791Burundi Francs.
18
Table 6: Average size of bribe – Burundi tax services 1 USD =1534 FBU
The government’s efforts to combat corruption in the tax collection system seems to have borne fruit. A global security report19 noted that the personnel changes, tightened procedures and outsourcing of key managerial roles led to a massive 76% rise in tax revenue between 2010 and 2012.
The growth in revenue reported above is a reflection of the steps take since inception of the reform process in 2009. Some of the problems informing the intervention were enumerated as out of date legislation, weak governance structures and corruption tendencies. As part of this reform process the United States Agency for International Development (USAID) granted the tax authority in Burundi about US$ 900,000 in institutional support through Trademark East Africa in 201320. Part of this grant was meant to support anti-corruption reform through reporting and access to information.
17 http://www.theguardian.com/global-development-professionals-network/adam-smith-international-partner-zone/effective-tax-reform-burundi 18 1 USD =1534 FBU19http://www.globalsecurity.org/military/world/burundi/corruption.htm 20 https://www.trademarkea.com/press-releases/usaid-gives-923000-to-back-tax-revolution-in-burundi/

20 | .......................................................................................................THE EAST AFRICAN BRIBERY INDEX TRENDS ANALYSIS (2010-2014)
Reasons for paying bribes The most common reasons for paying bribes as reported by respondents during the period under review differed each year. Across the region, the most common reason for paying bribes was to hasten up the service21 . It is worth noting that paying bribes because it was expected was identified as common reason in Burundi only.
Table 7: Reasons for paying bribes – Burundi
PERCEPTION OF CORRUPTION
Perceived levels of Corruption
Figure 16: Perceived levels of corruption – Burundi
The perceived levels of corruptions steadily rose across the five years to stand at 72% of Burundians who termed Burundi as highly corrupt. The picture is worse when the survey factors the proportion of respondents who adjudged the level as medium. The implication is that 92% view the country either as corrupt or highly corrupt. The proportion that termed Burundi as only slightly corrupt was lowest (6%) in 2014 perhaps indicating a marked state of pessimism.
Perceived change in corruption levels
Figure 17: Perceived change in corruption levels - Burundi
21. See Annex 4 for complete list of reasons for paying bribes across the region.
Year Reason for paying bribes Percentage 2012 It was the only way to access service 58%
2013 It was expected 31%
2014 To hasten up service 44%
20 | .......................................................................................................THE EAST AFRICAN BRIBERY INDEX TRENDS ANALYSIS (2010-2014) THE EAST AFRICAN BRIBERY INDEX TRENDS ANALYSIS (2010-2014)........................................................................................ | 21
The level of pessimism on the future trend of corruption levels rose across the period from a low of 17% to almost 50%. Given the sustained rise in the proportion of those who believed corruption levels could increase each coming year, there is a clear indication on the perceived dissatisfaction with any interventions. The situation may even create a gloomier picture when those who perceived the corruption levels likely to remain the same across the period are factored in.
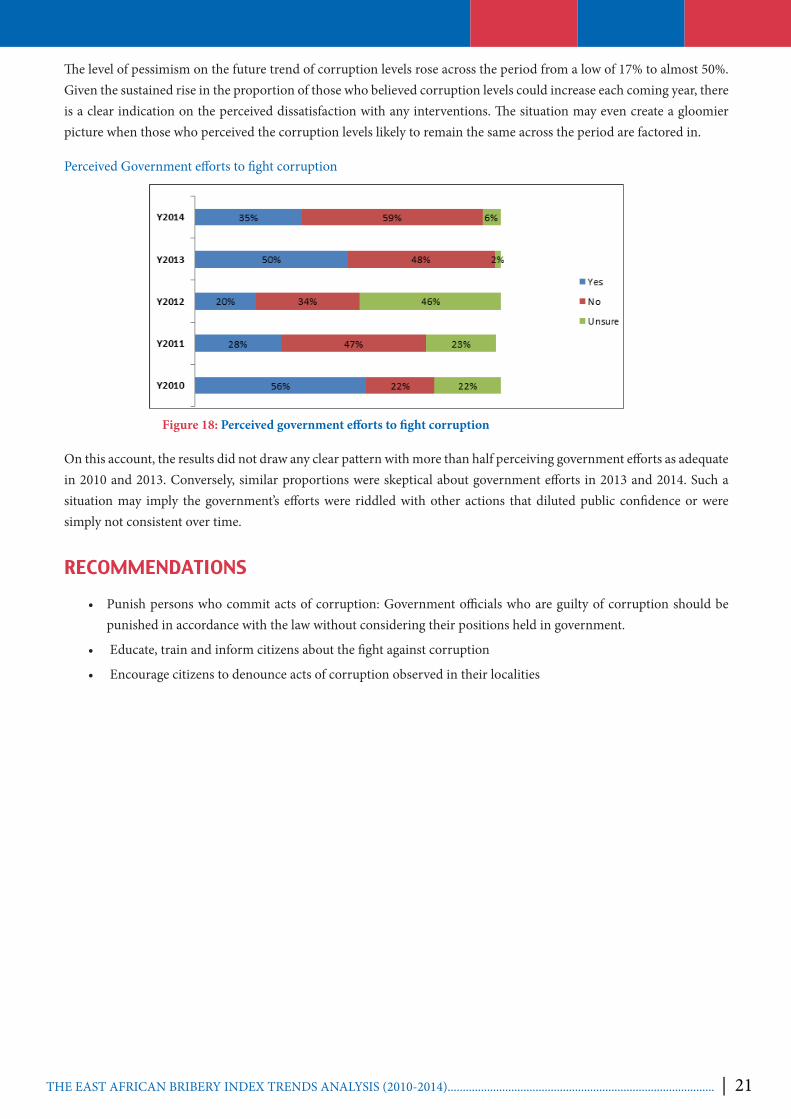
Perceived Government efforts to fight corruption
Figure 18: Perceived government efforts to fight corruption
On this account, the results did not draw any clear pattern with more than half perceiving government efforts as adequate in 2010 and 2013. Conversely, similar proportions were skeptical about government efforts in 2013 and 2014. Such a situation may imply the government’s efforts were riddled with other actions that diluted public confidence or were simply not consistent over time.
RECOMMENDATIONS
• Punish persons who commit acts of corruption: Government officials who are guilty of corruption should be punished in accordance with the law without considering their positions held in government.
• Educate, train and inform citizens about the fight against corruption
• Encourage citizens to denounce acts of corruption observed in their localities
22 | .......................................................................................................THE EAST AFRICAN BRIBERY INDEX TRENDS ANALYSIS (2010-2014)
KENYA
Background
The discourse on the fight against corruption in Kenya has been on-going for close to five decades since independence. It became more pronounced after the opening of the political and media space in the early 1990s. Various corruption scandals have been unearthed in those five decades.
Between 2010 and 2014, the corruption debate in Kenya has undergone a metamorphosis. First, the collapse of the National Rainbow Coalition’s (NARC) era zero tolerance to corruption22 meant greater public demand on anti-corruption efforts. This public pressure to act against corruption is reflected in the Constitution of Kenya 2010 which places a strong emphasis on transparency and accountability.
On the flipside, the coming into place of the coalition government after the disputed 2007 general elections greatly eroded public confidence in political players to drive the anti-corruption agenda. The first implication was that there was not effective political opposition within Parliament. Noteworthy, some political players who were hitherto anti-corruption crusaders were themselves caught up in allegations of involvement in corruption. As a result, corruption as a campaign issue was relegated to the back banner in the 2012/2013 election.
The passage of the Constitution of Kenya 2010 marks the greatest development in the anti-corruption agenda over the last five years. This governing document was prepared and passed in an environment where Kenyans were eager to break from institutionalised poor governance.
The Constitution provided for ground breaking components like Article 10 on national values, chapter six on leadership and integrity, chapter 10 on the new look judiciary, chapter 11 on devolution and chapter 12 on public finance. The legislative process to actualise the Constitution however had its own fair share of challenges. Parliament greatly watered down the original leadership and integrity law. There have been observations that the current law does not appropriately respond to the demands of the Constitution. Other pieces of legislation like the Elections Act, 2011 and the Elections Campaign Financing Act, 2013 have also been seen as deficient of the intended objectives.
Over the last five years, the Ethics and Anti-Corruption Commission (EACC) has suffered a series of political and legislative blows resulting to weakened capacity and efficiency in the pursuit of its mandate. Some observers read the passage of the Ethics and Anti-Corruption Commission (EACC) Act, 2011 with a requirement of the then top executive to vacate office, as one of such blows. It can be observed that at the time of the passage of this law, the commission was reportedly in pursuit of senior public officials.
22 https://www.issafrica.org/pubs/ASR/14No4/EOtieno.htm
22 | .......................................................................................................THE EAST AFRICAN BRIBERY INDEX TRENDS ANALYSIS (2010-2014) THE EAST AFRICAN BRIBERY INDEX TRENDS ANALYSIS (2010-2014)........................................................................................ | 23
In July 2015, Parliament passed a similar law in form of the EACC Amendment Bill (2015). The law initially contained contentious clauses like the sacking of the Chief Executive and the Deputy Chief Executive. The President however referred the bill back to Parliament with recommendations. The President recommended fresh vetting of all Commission staff within one year in the place of the proposed sacking. The Act also provides for increase in the number of commissioners from three to five. The Commissioners will work part time for a one non-renewable term of six years. The passage of this law followed resignation of all the three commissioners, who were to be submitted to scrutiny through a tribunal. The resignation of the commissioners was seen to have a lot of political intrigues with some quarters claiming that this was done through external political pressure. Notably, the resignations happened in quick succession in March, April and May and after Parliament received and approved a petition to remove them. More intrigues were to be reported after the failed attempt by the then Chairman to suspend the Deputy Chief Executive only for the Chief Executive to invalidate the action.
The Jubilee Coalition23 manifesto made specific commitments to improve governance through anti-corruption measures. Although the president was very vocal on this agenda in 2015, the government has continuously faced corruption allegations. This is in addition to a myriad of unresolved scandals inherited from the previous regimes. The electoral promise in the manifesto to grant EACC prosecutorial powers is yet to be delivered.
In April 2015, the Attorney General named a taskforce to review legal, policy and institutional framework for fighting corruption in Kenya. The taskforce drew its membership from the EACC, Director of Public prosecutions (DPP), Police, Judiciary, Public Procurement oversight Authority (PPOA) among other institutions key in the anti- corruption agenda. The taskforce has forwarded a report to the president in November 2015 with recommendations on policy, legal and institutional reforms to support the anti- corruption work in Kenya.
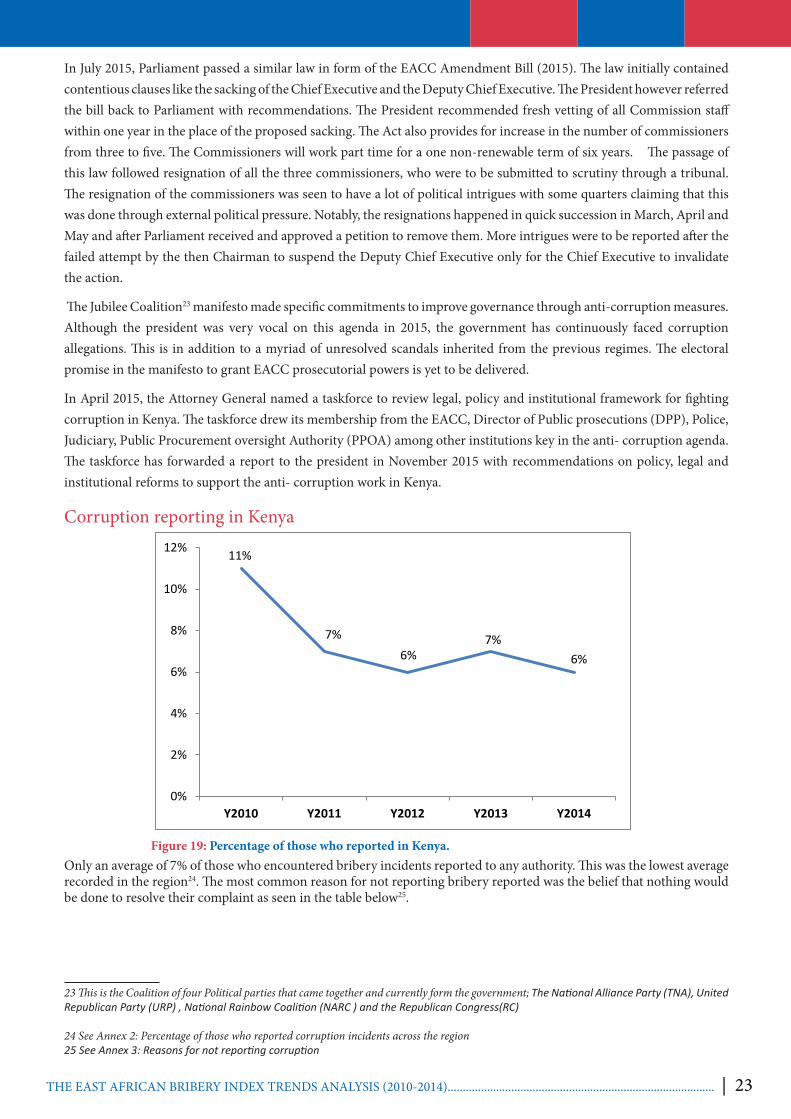
Corruption reporting in Kenya
11%
7%6%
7%6%
0%
2%
4%
6%
8%
10%
12%
Y2010 Y2011 Y2012 Y2013 Y2014
Figure 19: Percentage of those who reported in Kenya.Only an average of 7% of those who encountered bribery incidents reported to any authority. This was the lowest average recorded in the region24. The most common reason for not reporting bribery reported was the belief that nothing would be done to resolve their complaint as seen in the table below25.
23 This is the Coalition of four Political parties that came together and currently form the government; The National Alliance Party (TNA), United Republican Party (URP) , National Rainbow Coalition (NARC ) and the Republican Congress(RC)
24 See Annex 2: Percentage of those who reported corruption incidents across the region25 See Annex 3: Reasons for not reporting corruption
22 | .......................................................................................................THE EAST AFRICAN BRIBERY INDEX TRENDS ANALYSIS (2010-2014)
Table 8: Reasons for not reporting corruption - Kenya
One of the largest barriers to successful affront against corruption is low reporting levels among victims of bribery demands. This aspect is a function of a myriad of factors. The first one is how the law defines an act of bribery, who is legally liable in a bribery environment and what safeguards are in place for those who blow the whistle against corruption.
In Kenya, section 39 of Anti-Corruption and Economic Crimes Act defines the offence of bribery to include the dual aspects of receiving or soliciting or accepting a bribe; and offering or agreeing to offer a bribe. However, the second strand involving offering a bribe is less prominent. This may be explained by the likelihood that most offers would be accepted and therefore there would be little opportunity for a criminal complaint on this. It is likely that even where an offer is turned down, the reason may have more to do with the size of the bribe not meeting the expectation than the normative practice of a bribery free environment.
Whistleblower protection is poor in terms of assuring those who report on their safety. The Ethics and Anti-Corruption Commission has an online system of reporting bribery and other corrupt practices (the BKMS system). However, factors like access to internet and power may limit utility of this system especially to the most vulnerable populations in the rural areas and the urban poor. The higher bribery incidence among poor respondents as captured under the five year EABI review underscores this observation. The Witness Protection Act (CAP 79) has been variously viewed as a safeguard for whistleblowers. However, this act provides safeguards for legally recognized witnesses and less of that for whistleblowers. It is notable that whistleblowers can be witnesses but not all witnesses are whistleblowers. There is still a legal and practical lacuna for concerns that are not yet in court.
SECTOR ANALYSIS
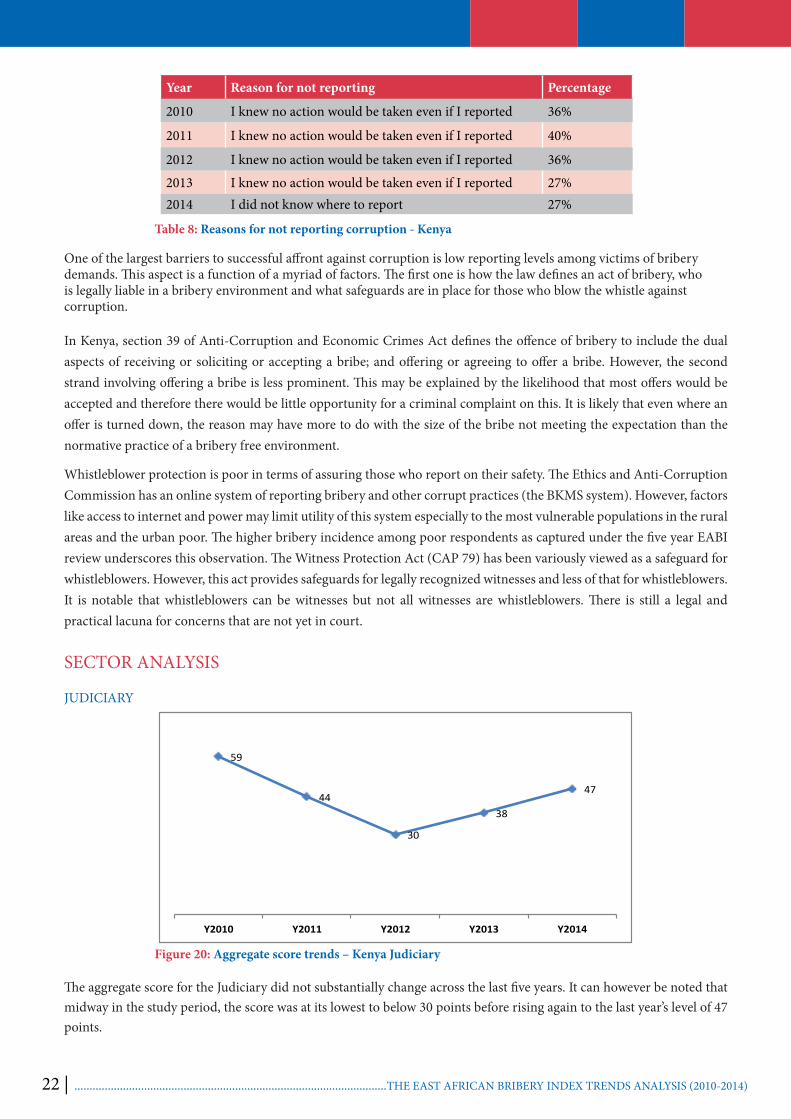
JUDICIARY
Figure 20: Aggregate score trends – Kenya Judiciary
The aggregate score for the Judiciary did not substantially change across the last five years. It can however be noted that midway in the study period, the score was at its lowest to below 30 points before rising again to the last year’s level of 47 points.
59
44
30
38
47
Y2010 Y2011 Y2012 Y2013 Y2014
Year Reason for not reporting Percentage
2010 I knew no action would be taken even if I reported 36%
2011 I knew no action would be taken even if I reported 40%
2012 I knew no action would be taken even if I reported 36%
2013 I knew no action would be taken even if I reported 27%2014 I did not know where to report 27%
22 | .......................................................................................................THE EAST AFRICAN BRIBERY INDEX TRENDS ANALYSIS (2010-2014) THE EAST AFRICAN BRIBERY INDEX TRENDS ANALYSIS (2010-2014)........................................................................................ | 23
Indicator/Year 2010 2011 2012 2013 2014
Average size of bribe(Ksh) 11,046 9,230 5,063 8,390 7,885
Average size of bribe(USD) 108 90 49 82 77
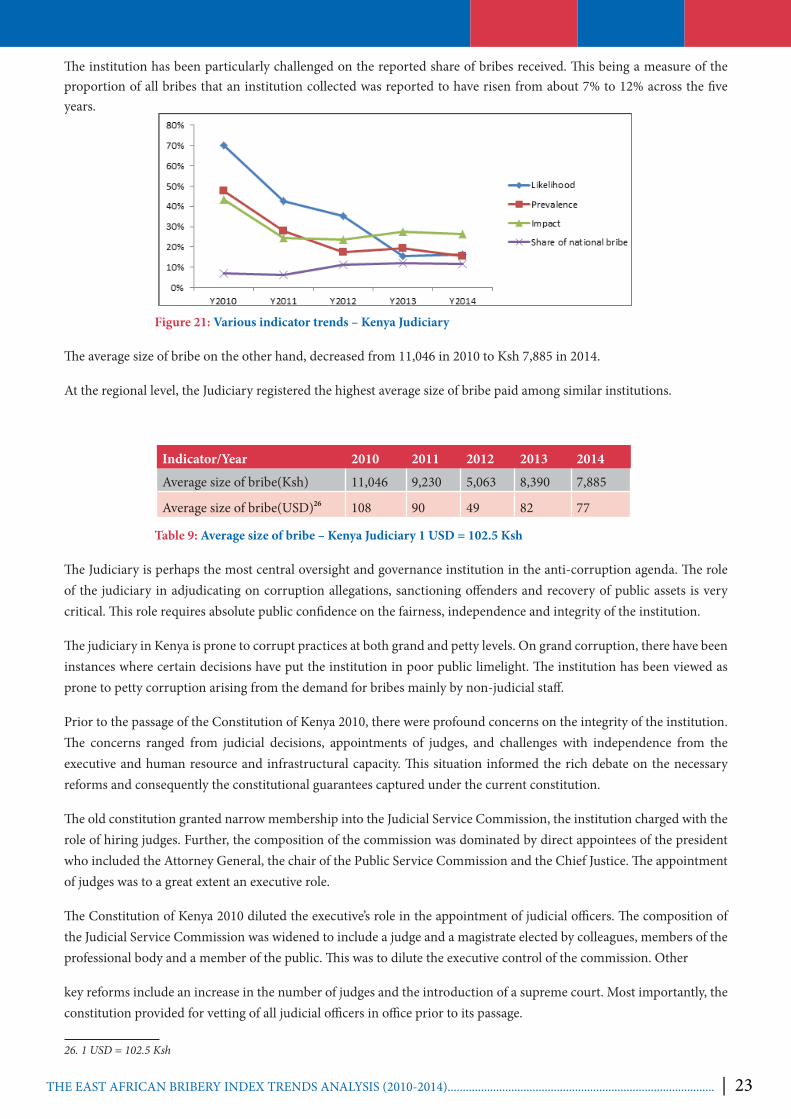
The institution has been particularly challenged on the reported share of bribes received. This being a measure of the proportion of all bribes that an institution collected was reported to have risen from about 7% to 12% across the five years.
Figure 21: Various indicator trends – Kenya Judiciary
The average size of bribe on the other hand, decreased from 11,046 in 2010 to Ksh 7,885 in 2014.
At the regional level, the Judiciary registered the highest average size of bribe paid among similar institutions.
26
Table 9: Average size of bribe – Kenya Judiciary 1 USD = 102.5 Ksh
The Judiciary is perhaps the most central oversight and governance institution in the anti-corruption agenda. The role of the judiciary in adjudicating on corruption allegations, sanctioning offenders and recovery of public assets is very critical. This role requires absolute public confidence on the fairness, independence and integrity of the institution.
The judiciary in Kenya is prone to corrupt practices at both grand and petty levels. On grand corruption, there have been instances where certain decisions have put the institution in poor public limelight. The institution has been viewed as prone to petty corruption arising from the demand for bribes mainly by non-judicial staff.
Prior to the passage of the Constitution of Kenya 2010, there were profound concerns on the integrity of the institution. The concerns ranged from judicial decisions, appointments of judges, and challenges with independence from the executive and human resource and infrastructural capacity. This situation informed the rich debate on the necessary reforms and consequently the constitutional guarantees captured under the current constitution.
The old constitution granted narrow membership into the Judicial Service Commission, the institution charged with the role of hiring judges. Further, the composition of the commission was dominated by direct appointees of the president who included the Attorney General, the chair of the Public Service Commission and the Chief Justice. The appointment of judges was to a great extent an executive role.
The Constitution of Kenya 2010 diluted the executive’s role in the appointment of judicial officers. The composition of the Judicial Service Commission was widened to include a judge and a magistrate elected by colleagues, members of the professional body and a member of the public. This was to dilute the executive control of the commission. Other
key reforms include an increase in the number of judges and the introduction of a supreme court. Most importantly, the constitution provided for vetting of all judicial officers in office prior to its passage.
26. 1 USD = 102.5 Ksh

24 | .......................................................................................................THE EAST AFRICAN BRIBERY INDEX TRENDS ANALYSIS (2010-2014)
At the operational level, the judiciary in conjunction with the traffic police department has established roadside court sittings for traffic offenders. This arrangement is meant to ensure prompt administration of justice and to reduce clogging of courts and minimize the incentive for corruption.
Even with the wide ranging constitutional reforms and an almost perfect take-off, the institution continues to suffer from allegations and perceptions of corrupt practice. Within the recent years, there have been reported cases of alleged impropriety. At least four senior officials, of the new look Judiciary; have been either sacked or suspended on allegations related to corruption. The vetting process that was initially meant to take one year is now in its fourth year.
The open and competitive hiring of the Chief justice, Deputy Chief Justice and High Court was the highlight of the reform process in the institution. The reform efforts within the judiciary may have started off well but fell behind in the recent years.
However some of the challenges that have faced this institution in the last few years have had some positive impact. The resignation of the Deputy Chief Justice in 2012 after questions about her conduct though negative in the short term, demonstrated the high personal integrity expectations of judicial staff. The Judicial Service Commission in October 2013 sanctioned the sacking of the Chief Registrar on allegations of corruption, incompetence and insubordination. These two high level sackings were in addition to the sacking of several judges and magistrates who failed the vetting process commenced in 2012. When looked at in their totality, these changes point to commitment of this institution to cut itself off from a history of an opaque and corrupt body prior to 2010.
LAND SERVICES
Figure 22: Aggregate score trends – Land services Kenya
According to the survey results, the sector has remained in the realm of poor performance across the last five years. Almost all the indicators remained largely unchanged. The aggregate score rose slightly while the share of national bribes almost doubled.
Figure 23: Various indicator trends – Land services –Kenya

24 | .......................................................................................................THE EAST AFRICAN BRIBERY INDEX TRENDS ANALYSIS (2010-2014) THE EAST AFRICAN BRIBERY INDEX TRENDS ANALYSIS (2010-2014)........................................................................................ | 25
Indicator/Year 2010 2011 2012 2013 2014
Average size of bribe(Ksh) 8,973 6,800 9,842 8,949 7,219
Average size of bribe(USD) 88 66 96 87 70
The average size of bribe only fell slightly from Kshs 8,973 to about Kshs 7,219. Even with this fall, it can be observed that the figures in the mid period were quite high reaching almost Kshs 10,000 in 2012.
27
Table 10: Average size of bribery – Land Services Kenya
The centrality of land in social political discourse in Kenya is as closely related to the governance practices at the national and local level. Cultural beliefs also place very strong attachment to land ownership. Land has been a key feature in political events in Kenya including the struggle for national independence, a series of post-election flare-ups and the constitutional review debate.
The different institutions under this sector include land registries at county level, land boards and the national level lands office as well as the National Land Commission. The key point of interaction between citizens and the ministry concerned occur in processes like land adjudication, sale and transfer, titling and registration and valuation. The bribery concerns go around artificial delays of processes to extract bribes from service seekers, double allocation of land, design and sale of irregular titles, irregular allocation of private and public land and involvement of informal players (brokers) to facilitate corrupt practice.
The Constitution of Kenya 2010 sought to respond to key challenges that faced the land sector. Among the prime areas of focus was diluting the executive control in the allocation of public land. The National Land Commission was formed with such key functions like managing public land on behalf of the government, advising on national land policy and advising on titling of land.
Some of the factors that expose the sector to bribery and other corrupt practices include large public demand for services, non-computerization of key processes and general public ignorance on processes and requirements. The sector is also highly centralized with most services being available either at the county or national level.
The envisaged reforms in the sector do not seem to have taken off. The computerization process was initiated to reduce service backlog and human interference. It has since not progressed much and cases of double allocation and missing files are still common providing rich ground for bribery and other corrupt practice. Recently, there has been a series of high profile land scandals touching on corruption in allocations. The constant squabbles between the Ministry of Lands and Housing and the National Land Commission pose challenges in ensuring concerted reform efforts. The stepping aside of the Cabinet Secretary in charge of Land services during the recent anti-corruption drive by President Uhuru Kenyatta on allegations of obstruction of justice regarding the Karen land saga is a further indication of challenges in the Ministry.
NATIONAL POLICE SERVICE
Figure 24: Aggregate score trends – Kenya police
27. 1 USD = 102.5 Ksh
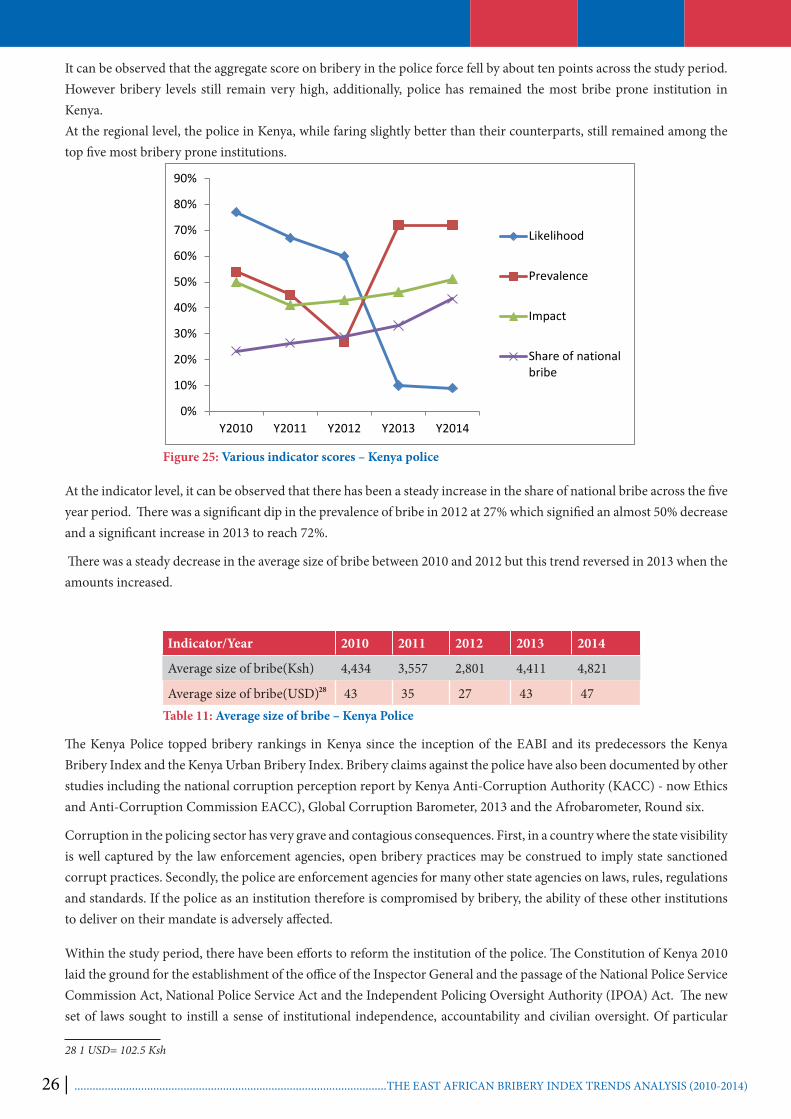
26 | .......................................................................................................THE EAST AFRICAN BRIBERY INDEX TRENDS ANALYSIS (2010-2014)
Indicator/Year 2010 2011 2012 2013 2014
Average size of bribe(Ksh) 4,434 3,557 2,801 4,411 4,821
Average size of bribe(USD) 43 35 27 43 47
It can be observed that the aggregate score on bribery in the police force fell by about ten points across the study period. However bribery levels still remain very high, additionally, police has remained the most bribe prone institution in Kenya.At the regional level, the police in Kenya, while faring slightly better than their counterparts, still remained among the top five most bribery prone institutions.
0%
10%
20%
30%
40%
50%
60%
70%
80%
90%
Y2010 Y2011 Y2012 Y2013 Y2014
Likelihood
Prevalence
Impact
Share of nationalbribe
Figure 25: Various indicator scores – Kenya police
At the indicator level, it can be observed that there has been a steady increase in the share of national bribe across the five year period. There was a significant dip in the prevalence of bribe in 2012 at 27% which signified an almost 50% decrease and a significant increase in 2013 to reach 72%.
There was a steady decrease in the average size of bribe between 2010 and 2012 but this trend reversed in 2013 when the amounts increased.
28
Table 11: Average size of bribe – Kenya Police
The Kenya Police topped bribery rankings in Kenya since the inception of the EABI and its predecessors the Kenya Bribery Index and the Kenya Urban Bribery Index. Bribery claims against the police have also been documented by other studies including the national corruption perception report by Kenya Anti-Corruption Authority (KACC) - now Ethics and Anti-Corruption Commission EACC), Global Corruption Barometer, 2013 and the Afrobarometer, Round six.
Corruption in the policing sector has very grave and contagious consequences. First, in a country where the state visibility is well captured by the law enforcement agencies, open bribery practices may be construed to imply state sanctioned corrupt practices. Secondly, the police are enforcement agencies for many other state agencies on laws, rules, regulations and standards. If the police as an institution therefore is compromised by bribery, the ability of these other institutions to deliver on their mandate is adversely affected.
Within the study period, there have been efforts to reform the institution of the police. The Constitution of Kenya 2010 laid the ground for the establishment of the office of the Inspector General and the passage of the National Police Service Commission Act, National Police Service Act and the Independent Policing Oversight Authority (IPOA) Act. The new set of laws sought to instill a sense of institutional independence, accountability and civilian oversight. Of particular
28 1 USD= 102.5 Ksh
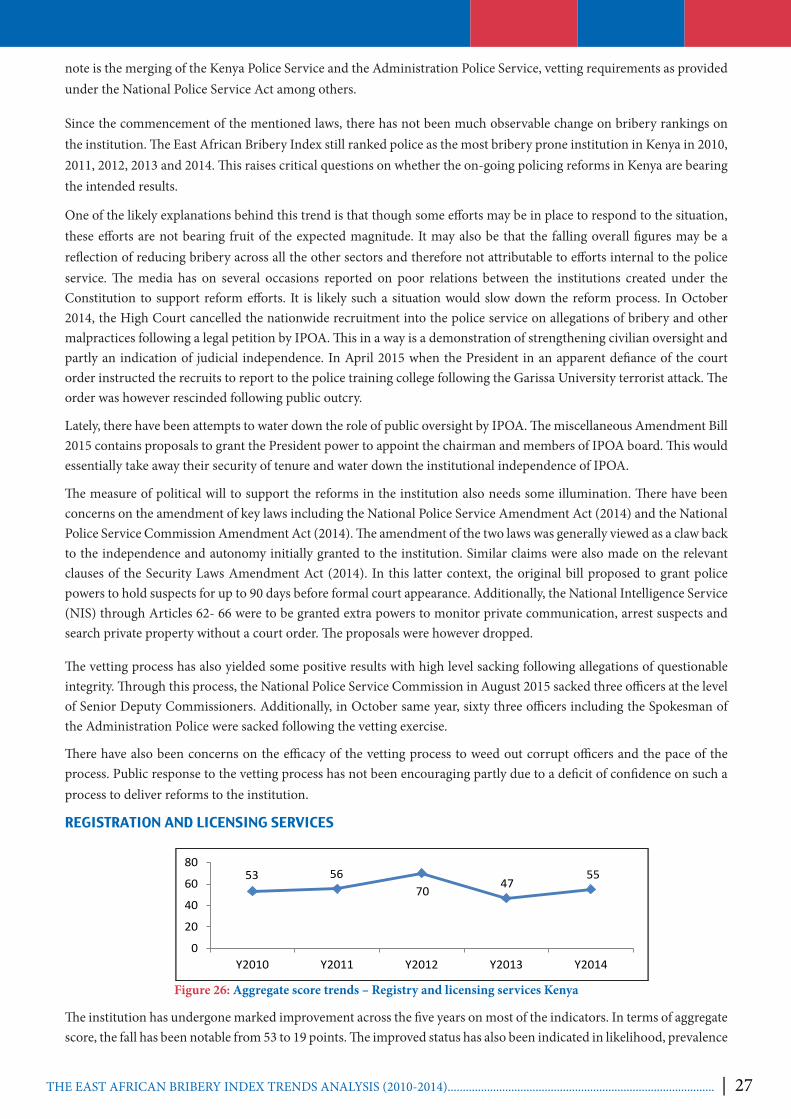
26 | .......................................................................................................THE EAST AFRICAN BRIBERY INDEX TRENDS ANALYSIS (2010-2014) THE EAST AFRICAN BRIBERY INDEX TRENDS ANALYSIS (2010-2014)........................................................................................ | 27
note is the merging of the Kenya Police Service and the Administration Police Service, vetting requirements as provided under the National Police Service Act among others.
Since the commencement of the mentioned laws, there has not been much observable change on bribery rankings on the institution. The East African Bribery Index still ranked police as the most bribery prone institution in Kenya in 2010, 2011, 2012, 2013 and 2014. This raises critical questions on whether the on-going policing reforms in Kenya are bearing the intended results.
One of the likely explanations behind this trend is that though some efforts may be in place to respond to the situation, these efforts are not bearing fruit of the expected magnitude. It may also be that the falling overall figures may be a reflection of reducing bribery across all the other sectors and therefore not attributable to efforts internal to the police service. The media has on several occasions reported on poor relations between the institutions created under the Constitution to support reform efforts. It is likely such a situation would slow down the reform process. In October 2014, the High Court cancelled the nationwide recruitment into the police service on allegations of bribery and other malpractices following a legal petition by IPOA. This in a way is a demonstration of strengthening civilian oversight and partly an indication of judicial independence. In April 2015 when the President in an apparent defiance of the court order instructed the recruits to report to the police training college following the Garissa University terrorist attack. The order was however rescinded following public outcry.
Lately, there have been attempts to water down the role of public oversight by IPOA. The miscellaneous Amendment Bill 2015 contains proposals to grant the President power to appoint the chairman and members of IPOA board. This would essentially take away their security of tenure and water down the institutional independence of IPOA.
The measure of political will to support the reforms in the institution also needs some illumination. There have been concerns on the amendment of key laws including the National Police Service Amendment Act (2014) and the National Police Service Commission Amendment Act (2014). The amendment of the two laws was generally viewed as a claw back to the independence and autonomy initially granted to the institution. Similar claims were also made on the relevant clauses of the Security Laws Amendment Act (2014). In this latter context, the original bill proposed to grant police powers to hold suspects for up to 90 days before formal court appearance. Additionally, the National Intelligence Service (NIS) through Articles 62- 66 were to be granted extra powers to monitor private communication, arrest suspects and search private property without a court order. The proposals were however dropped.
The vetting process has also yielded some positive results with high level sacking following allegations of questionable integrity. Through this process, the National Police Service Commission in August 2015 sacked three officers at the level of Senior Deputy Commissioners. Additionally, in October same year, sixty three officers including the Spokesman of the Administration Police were sacked following the vetting exercise.
There have also been concerns on the efficacy of the vetting process to weed out corrupt officers and the pace of the process. Public response to the vetting process has not been encouraging partly due to a deficit of confidence on such a process to deliver reforms to the institution.
REGISTRATION AND LICENSING SERVICES
53 5670 47
55
0
20
40
60
80
Y2010 Y2011 Y2012 Y2013 Y2014
Figure 26: Aggregate score trends – Registry and licensing services Kenya
The institution has undergone marked improvement across the five years on most of the indicators. In terms of aggregate score, the fall has been notable from 53 to 19 points. The improved status has also been indicated in likelihood, prevalence

28 | .......................................................................................................THE EAST AFRICAN BRIBERY INDEX TRENDS ANALYSIS (2010-2014)
and impact indicators. The fall in the likelihood index from 68 to 10 points is particularly notable. This being a measure of the probability that a service seeker will be asked or expected to pay a bribe every time they interact with an institution is positive news for clients.
Figure 27: Various indicator trends - Registry and licensing services Kenya
The average size of bribe also decreased by about 50% across the five years.
Table 12: Average size of bribe - Registry and licensing services Kenya
The index classifies registration to encompass business and civil registration. The former is normally a private sector oriented service. The service is carried out by the different regulatory bodies, and the county governments. Prior to 2013, this role was carried out by the local authorities. Bribery risks in this service arise due to the pressure to acquire the necessary clearance within a short time. Most of the licensing involves annual renewals creating constant interactions with authorities. Additionally due to high unemployment levels, the informal sector constitutes a large part of the economy. Licensing services are therefore in constant demand.
The role of civil registration is carried out under the Directorate of Immigration and Registration of persons and housed in the ministry of Interior and Coordination of National Government. The role is carried out in four key functional areas:
• National registration bureau - to carry out the role of national identity registration and related functions
• Civil registration department - to register births and deaths and related functions
• Department of immigration services - to control entry and exit of persons in the country
• Department of refugee affairs - to regulate entry and registration of refugees.
The directorate handles large volume of service seekers as the registration documents have in the recent years been made a requirement in accessing other government services like admission to primary school, registration for national examinations and access to public jobs. Risks for bribery are mainly on facilitating speedy processing of documents, irregular issue of work permits and citizenship. Corrupt practices in the entry and exit of persons have been blamed on rising insecurity and extremism in the recent past.
0%
10%
20%
30%
40%
50%
60%
70%
80%
Y2010 Y2011 Y2012 Y2013 Y2014
Likelihood
Prevalence
Impact
Share of na@onal bribe
Indicator/Year 2010 2011 2012 2013 2014
Average size of bribe(Ksh) 2,197 1,085 1,288 965 1,103
Average size of bribe(USD)7 21 11 13 9 11

28 | .......................................................................................................THE EAST AFRICAN BRIBERY INDEX TRENDS ANALYSIS (2010-2014) THE EAST AFRICAN BRIBERY INDEX TRENDS ANALYSIS (2010-2014)........................................................................................ | 29
The 2009 national census figures were cancelled in several districts in the Northern and North Eastern Kenya, the two areas hosting refugee camps in Kakuma in Turkana and Daadab in Garissa respectively29. The government noted that the massive population growth in these areas could not be explained by rates of births and deaths. Additionally, the age and sex profiles of the registered population deviated from the norm. This was far the clearest official indication of the challenges facing the directorate.
It is noteworthy that there have been efforts to streamline service delivery especially the issuance of passports. The efforts however are still under threat of continued corruption related challenges.
With some of the services now being provided through Huduma Centers30, it is hoped this situation will be sustained. With the centres taking up the pressure from the mainstream government offices for these services, bribery pressures are likely to diminish.
TAX SERVICES
4128
14 1523
Y2010 Y2011 Y2012 Y2013 Y2014
Figure 28: Aggregate score trends – Tax services Kenya
The aggregate score fell from a high of 40 points in 2010 to 23 in 2014. However it can be noted that the 2014 score was a marked rise from the score in 2012 and 2013 which was at 14 points. The share of total bribes reported to have been paid to the institution has remained largely constant at around 3%.
0%
10%
20%
30%
40%
50%
60%
Y2010 Y2011 Y2012 Y2013 Y2014
Likelihood
Prevalence
Impact
Share of nationalbribe
Figure 29: Various indicator scores -Tax services Kenya
29 http://www.nation.co.ke/News/How%20North%20Eastern%20figures%20went%20wrong%20/-/1056/1001530/-/qvvfu9z/-/index.html 30 The Huduma Centre is an initiative by the Ministry of Devolution and Planning initiative to bring government services under one roof. The services offered include birth and death registration, driving license renewals, passport renewals among others

30 | .......................................................................................................THE EAST AFRICAN BRIBERY INDEX TRENDS ANALYSIS (2010-2014)
Indicator/Year 2010 2011 2012 2013 2014
Average size of bribe(Ksh) 3,327 3,567 2,787 3,986 6,815
Average size of bribe(USD) 32 35 27 39 66
The size of bribe paid to the tax services between the year 2010 and 2013 averaged Ksh 3,400 and almost doubled to reach Ksh 6,815 in 2014.
31
Table 13: Average size of bribe - Tax services Kenya
The Kenya Revenue Authority(KRA) is constituted as a semi-autonomous institution under the Ministry of Finance. The authority is founded under Kenya Revenue Act CAP 469 of 1995. Among the stated roles include assessment, collection, administration and enforcement of laws relating to public revenue.
The authority is the key administrator in revenue collection in Kenya handling both domestic taxes and customs. The points of interaction between citizens and the authority include clearance of goods, payments of domestic tax and other variant services related to enforcement. Additionally, KRA has in the past been playing some roles under the Traffic Act and Transport Licensing Act. Some of these roles like driving license renewal and motor vehicle registration and inspection have since been taken up by the National Traffic Safety Authority (NTSA). This body was set up through an act of Parliament in 2012 to advice on road safety and has been vested with related powers in regulation, enforcement and education as it relates road transport. Through this mandate, NTSA has taken up some of the roles are mentioned above.
The institution is predisposed to bribery and corrupt practices arising from understandably stringent enforcement mechanisms, pressure from tax payers to evade tax liabilities, large volume of non- digitalized transactions especially on traffic related regulation.
The Kenya Revenue Authority has been on a trajectory of reform and modernization in the recent years. Revenue collection has grown from Kshs 122 billion in 1995 to Kshs 963 billion in 2014. This has happened at the back of rigorous reform and modernization including the adoption of the Simba system in 2005. At the same time there have been marked efforts to modernize operations. KRA has also been strengthening automation of services to reduce revenue leakage with the roll out of i-tax being a central component of this.
However, even with the best efforts, survey reports show continued petty bribery as captured by the East African bribery Index. It is expected that the removal of some of the traffic regulation and registry services to NTSA will reflect positively on the performance of KRA on this account.
Reasons for paying bribes The most common reason for paying bribes in Kenya was to hasten service delivery in the institutions that were visited as seen in the table below.
This was the most common reason in the rest of East Africa except in Uganda32.
Table 14: Reason for paying bribes – Kenya
31. 1 USD= 102.5 Ksh 32 See Annex 4: Reason for paying bribes
Year Reason for paying bribes Percentage
2012 To hasten up service 38%
2013 To hasten up service 36%2014 It was the only way to access service 38%

30 | .......................................................................................................THE EAST AFRICAN BRIBERY INDEX TRENDS ANALYSIS (2010-2014) THE EAST AFRICAN BRIBERY INDEX TRENDS ANALYSIS (2010-2014)........................................................................................ | 31
Perception of Corruption
Perceived levels of corruption
54%
53%
27%
62%
72%
31%
30%
47%
24%
20%
8%
11%
22%
12%
6%
Y2010
Y2011
Y2012
Y2013
Y2014
High
Medium
Low
Figure 30: Perceived levels of corruption –Kenya The perception of Kenyans on current levels of corruption has been deteriorating across the last two years. It can be noted that the negative perceptions initially fell between 2010 and 2012 only to sharply rise in the subsequent two years. This period covers the passage of the Constitution of Kenya 2010 and subsequent legislative and institutional reforms that followed. The Constitution provided for strict deadlines on the passage of some of key legislations.
The two year period following the inauguration was therefore a period of notable strides towards better governance. However, it also followed that the constitutional culture was not deeply entrenched. This led to weak legislation and poor implementation. Eventually the positive perceptions were diluted by these realities. On the overall, the adverse perceptions have risen by almost 40 percentage points between 2012 and 2014.
Perceived change in corruption levels
The above adverse pattern is observable on the projected levels of corruption across the period. When asked to predict how the corruption levels will change in the coming years, most respondents were quite positive in the mid period years of 2012 and 2013. However in 2014, the perceptions deteriorated sharply with the proportion of respondents who thought it will become worse doubling as compared to 2013. The proportion of respondents who believed corruption levels would decrease in the subsequent year fell sharply from 46% in 2013 to 27% in 2014. On the overall, there has not been a huge change on this account. This situation could also be explained by the explanation in the preceding section.
Figure 31: Perceived change of corruption levels – Kenya Perception of government efforts to fight corruption

32 | .......................................................................................................THE EAST AFRICAN BRIBERY INDEX TRENDS ANALYSIS (2010-2014)
The assessment of government apparent commitment to the anti-corruption agenda returned a mixed picture. The proportion of respondents who perceive government efforts as sufficient rose from 22% in 2010 to 38% in 2014. However, those who answered this question in the negative remained largely unchanged across the period. Just like in the other perception questions, 2013 reported the most positive perception.
22%
35%
30%
46%
38%
62%
46%
50%
49%
58%
16%
20%
20%
5%
4%
Y2010
Y2011
Y2012
Y2013
Y2014
Yes
No
Unsure
Figure 32: Perceived Government effort to fight corruption
It is imperative to note that the government has made some pronouncements and covered some ground in responding to corrupt practices. Notably, the Jubilee manifesto provided for this under the governance component. The document proposed to support EACC get prosecutorial powers as part of strengthening the institutions potency. The constant challenges that have faced the institution in the last one year and the fact that no efforts were made to grant EACC these powers however point to a different kind of reality.
The president took up the affront against corruption personally by launching a corruption reporting website. He has also been very vocal on the agenda. The latest response of tabling a list of public officials facing corruption allegations and having them ‘step aside’ could be the strongest indicator of this commitment. Observers would however interpret presidential intervention as an indication of failure of the institutions charged with the anti-corruption mandate to deliver. There are also claims that the intervention though well-meaning never went to the fullest extent.
Recommendations
1. The Constitution of Kenya in Article 10, on national values, chapter six on ethics and integrity and Chapter twelve on public finance carry very strong bearing on strengthening public accountability. However, the opportunities provided here have not been fully realized. There is need to strengthen the Leadership and Integrity Act to ensure the spirit of the constitution is fully captured. Additionally, oversight institutions like the Office of the Auditor General need to be strengthened to properly execute their mandate.
2. Given that some basic service provision has been devolved to the counties especially health and education, efforts to respond to petty bribery in public administration should be strengthened at the county level. The devolved units have had their fair share of governance challenges since inception in 2013. It is therefore important that focus is also place at the county level both on enforcement and capacity development. This would also call for enhanced efforts to have such institutions like the Ethics and Anti-Corruption Commission and the Commission on Administrative Justice open more centres at the county level.
32 | .......................................................................................................THE EAST AFRICAN BRIBERY INDEX TRENDS ANALYSIS (2010-2014) THE EAST AFRICAN BRIBERY INDEX TRENDS ANALYSIS (2010-2014)........................................................................................ | 33
3. The government should ensure that EACC has enough operational and institutional independence to deliver on the anti-corruption mandate. The issue of granting the body powers to prosecute need to be positively considered. Though there has been some movement in terms of follow up on recommendations made by EACC to the Director of Public Prosecutions, the affront against corruption stand to benefit greatly from an anti-corruption commission that enjoys greater independence.
4. Related to the reforms at the EACC, Kenya should consider giving a critical review on the procurement practice in Kenya. Given that a good proportion of the major scandals in the period under review relate to public procurement, it is important to appreciate there are gaps that need to be responded to. The role played by the Public Procurement Oversight Authority should be reviewed with a view to advice on the efficacy of this body in ensuring probity in public expenditure. There is need to build public confidence to report corruption to the relevant institutions. The low corruption reporting may be indicator to the general public perception on the official anti-corruption responses. The indication therefore is that the government needs to do a lot to convince the public to render their support. Successful prosecution of suspects and continuous administrative action will help change the negative public perception and boost reporting levels.
34 | .......................................................................................................THE EAST AFRICAN BRIBERY INDEX TRENDS ANALYSIS (2010-2014)
RWANDA
BACKGROUND
The sub-topic of corruption stands high on the political agenda within the larger field of governance. Rwanda continues to be perceived as the one of the least corrupt countries in Africa. The 2014 Corruption perception Index shows that Rwanda performs best in East Africa and is amongst top 5 in the continent. However, findings from the East Africa Bribery Index indicate that citizens still encounter challenges such as bribery to access services in key institutions. The Judiciary, local government and police are some of the sectors affected by the vice, recording the highest incidences of bribery in Rwanda. For instance, in the 2013 report, respondents reported to have paid an average of 45,196 RWF in bribes to the Judiciary and an average of 40,754 RWF to the police in order to access services.
The economic and political impact of corruption, especially on the poor and vulnerable, is not to be underestimated. According to the last available national household census, 44% of the Rwandan population lives below the poverty line set at the consumption equivalent of 118,000 RWF per year per adult in 2012 prices. This means that on average, it costs a poor person 38% of yearly consumption to obtain a favour from the court or 35% to pay a bribe to the police. Even though there is no evidence that this kind of corruption is institutionalised, such instances still make it difficult for a large section of Rwandan society to obtain services.
Despite gradual improvements in reporting corruption, whistle-blowers still need encouragement and more effective protection. According to the data from Transparency International Rwanda’s (TI-RW) Advocacy and Legal Advice Centres (ALACs), only 1% of citizens reporting a case do so as whistle-blowers. This is despite the fact that Rwanda has some of the best legal frameworks that should, in theory, protect concerned citizens reporting corruption and malpractices. This in turn leads to a relatively low number of cases investigated by the police for suspicion of corruption: for instance, in the year 2009-2010, 490 cases were received by the Rwanda National Police and the Office of the Ombudsman, 292 cases were prosecuted and 44 persons were convicted for corruption and related offences.33
State and non-state actors widely agree that corruption in Rwanda is still a cause for concern, with the President himself acknowledging that the momentum on anti-corruption must be sustained. For example, the last National Leadership Retreat 2015, an executive body setting out the governmental priorities, concluded that corruption stalls big infrastructure projects, erodes a number of social schemes and disrupts service delivery by public institutions.
Steady progress is being made against cases of ‘traditional’ forms of corruption. Under the motto ‘Zero Tolerance to Corruption” the Government tries to combat bribery and embezzlement, especially within the local governments where most public services are delivered.
33 Office of the ombudsman - Rwanda Anti-Corruption Policy- 2012
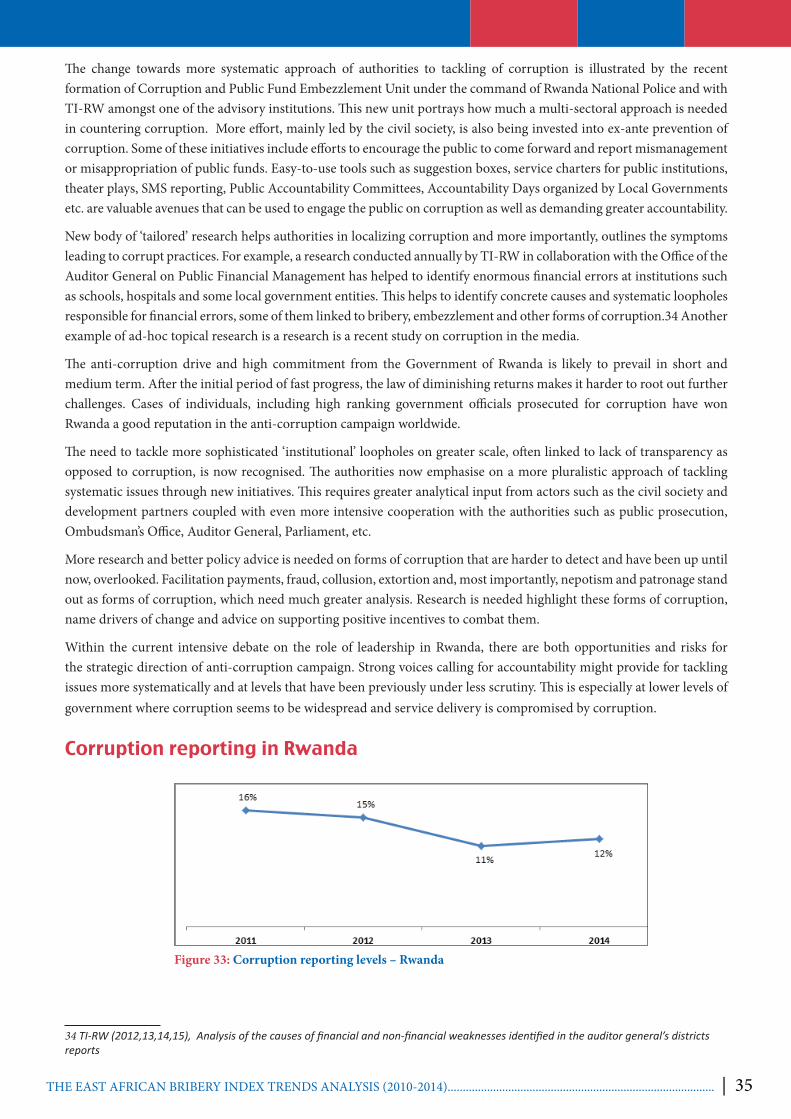
34 | .......................................................................................................THE EAST AFRICAN BRIBERY INDEX TRENDS ANALYSIS (2010-2014) THE EAST AFRICAN BRIBERY INDEX TRENDS ANALYSIS (2010-2014)........................................................................................ | 35
The change towards more systematic approach of authorities to tackling of corruption is illustrated by the recent formation of Corruption and Public Fund Embezzlement Unit under the command of Rwanda National Police and with TI-RW amongst one of the advisory institutions. This new unit portrays how much a multi-sectoral approach is needed in countering corruption. More effort, mainly led by the civil society, is also being invested into ex-ante prevention of corruption. Some of these initiatives include efforts to encourage the public to come forward and report mismanagement or misappropriation of public funds. Easy-to-use tools such as suggestion boxes, service charters for public institutions, theater plays, SMS reporting, Public Accountability Committees, Accountability Days organized by Local Governments etc. are valuable avenues that can be used to engage the public on corruption as well as demanding greater accountability.
New body of ‘tailored’ research helps authorities in localizing corruption and more importantly, outlines the symptoms leading to corrupt practices. For example, a research conducted annually by TI-RW in collaboration with the Office of the Auditor General on Public Financial Management has helped to identify enormous financial errors at institutions such as schools, hospitals and some local government entities. This helps to identify concrete causes and systematic loopholes responsible for financial errors, some of them linked to bribery, embezzlement and other forms of corruption.34 Another example of ad-hoc topical research is a research is a recent study on corruption in the media.
The anti-corruption drive and high commitment from the Government of Rwanda is likely to prevail in short and medium term. After the initial period of fast progress, the law of diminishing returns makes it harder to root out further challenges. Cases of individuals, including high ranking government officials prosecuted for corruption have won Rwanda a good reputation in the anti-corruption campaign worldwide.
The need to tackle more sophisticated ‘institutional’ loopholes on greater scale, often linked to lack of transparency as opposed to corruption, is now recognised. The authorities now emphasise on a more pluralistic approach of tackling systematic issues through new initiatives. This requires greater analytical input from actors such as the civil society and development partners coupled with even more intensive cooperation with the authorities such as public prosecution, Ombudsman’s Office, Auditor General, Parliament, etc.
More research and better policy advice is needed on forms of corruption that are harder to detect and have been up until now, overlooked. Facilitation payments, fraud, collusion, extortion and, most importantly, nepotism and patronage stand out as forms of corruption, which need much greater analysis. Research is needed highlight these forms of corruption, name drivers of change and advice on supporting positive incentives to combat them.
Within the current intensive debate on the role of leadership in Rwanda, there are both opportunities and risks for the strategic direction of anti-corruption campaign. Strong voices calling for accountability might provide for tackling issues more systematically and at levels that have been previously under less scrutiny. This is especially at lower levels of government where corruption seems to be widespread and service delivery is compromised by corruption.
Corruption reporting in Rwanda
Figure 33: Corruption reporting levels – Rwanda
34 TI-RW (2012,13,14,15), Analysis of the causes of financial and non-financial weaknesses identified in the auditor general’s districts reports

36 | .......................................................................................................THE EAST AFRICAN BRIBERY INDEX TRENDS ANALYSIS (2010-2014)
Rwanda had the highest level of corruption reporting in the region during the period under review; an average of 14% of respondents who encountered bribery incidents reported to the relevant authorities35. The most common reason for not reaporting bribery in Rwanda was fear of self incrimination as seen below36.
Table 15: Reasons for not reporting corruption – Rwanda
The relatively higher levels of reporting is a proxy to higher confidence levels in the institutions handling the reports. It may also be an indicator for public concern on issues related to corruption.
SECTOR ANALYSIS
JUDICIARY
The judiciary performance across the period indicates an alarming deterioration. The aggregate score rose from 5 to 37 points. Given that the rise is consistent across the period, it is clear there is a real concern on this institution. Within the three years under review, the Judiciary moved from one of the least bribery prone institution to among the top three most adversely affected. At a regional level however, the Judiciary in Rwanda fared much better than its peers, never once making it to the top ten most bribery prone institutions.
Figure 34: Aggregate score trend – Rwanda Judiciary
For the individual indicators, 2012 is a turning point into the adverse direction. After a marginal fall for the first two years, all indicators register a marked rise before stabilising in 2013. Notably, the share of national bribe going to the judiciary rose from a marginal of 1% to about 14%.
Figure 35: Various indicator trends – Rwanda Judiciary 35 See Annex 2 for percentage of those who reported corruption incidents across the region36 See Annex 3 for reasons for not reporting paying bribes
Year Reason for not reporting Percentage
2012 I knew no action would be taken even if I reported 29%
2013 Fear of self-incrimination 28%
2014 Fear of self-incrimination 29%
0%
2%
4%
6%
8%
10%
12%
14%
16%
Y2012 Y2013 Y2014
Likelihood
Prevalence
Impact
Share of nationalbribe

36 | .......................................................................................................THE EAST AFRICAN BRIBERY INDEX TRENDS ANALYSIS (2010-2014) THE EAST AFRICAN BRIBERY INDEX TRENDS ANALYSIS (2010-2014)........................................................................................ | 37
Indicator/Year 2012 2013 2014
Average size of bribe(Rwf) 2,000 45,196 88,285
Average size of bribe(USD) 3 61 119
The rise in the average bribe between 2012 and 2014 from 2000 Rwanda Francs to 88,285 Rwanda Francs is a further indictment on bribery concerns as registered by other indicators.
37
Table 16: Average size of bribery – Rwanda Judiciary
The Justice sector has been for a long time at the forefront of the public debate due to a high number of backlog of cases and high incidences of bribery as evidenced by the Rwanda Bribery Index (RBI) 2014. Despite some improvements in reducing the backlogs of court hearings, over 20% of respondents still report waiting for one year or longer to attend the first mention of their cases. Indeed, citizens point out high court fees, perceived partiality of judges, lack of independence and corruption as main reasons of dissatisfaction with the justice system.
Corruption and service delivery efficiency is being tackled through the encouragement of the public to report malpractices. Mechanisms such as suggestion boxes, toll free hotlines and campaigns have increased public reporting of corrupt practices in the sector.
LAND SERVICES
Figure 36: Aggregate score trends – Rwanda land services
The aggregate score increased in 2013 by two points to reach 15, but decreased by the same number of points in the subsequent year.
The indicators for the institution were reasonably low and tending to fall in 2014. The national share of bribe reported the largest fall between 2012 and 2013.
Figure 37: Various indicators – Rwanda land services
37 1USD=743.6 RWF
0%
2%
4%
6%
8%
10%
12%
14%
Y2012 Y2013 Y2014
Likelihood
Prevalence
Impact
Share of nationalbribe
1215 12
Y2012 Y2013 Y2014
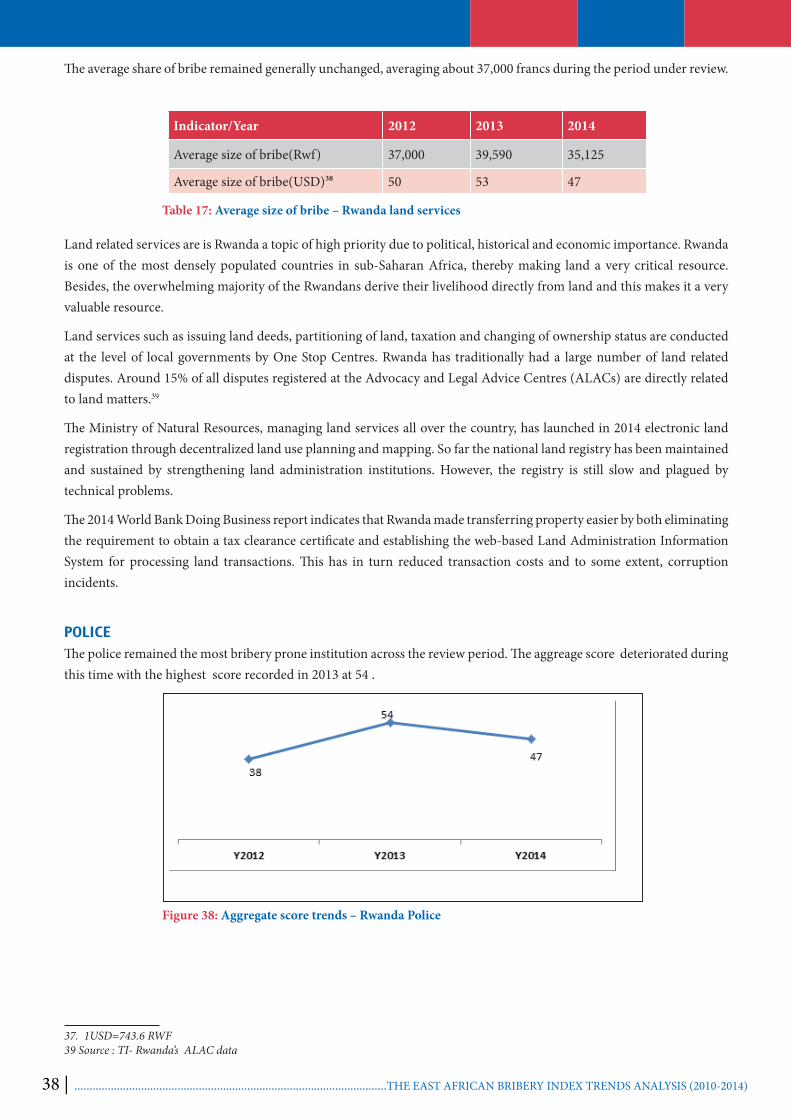
38 | .......................................................................................................THE EAST AFRICAN BRIBERY INDEX TRENDS ANALYSIS (2010-2014)
Indicator/Year 2012 2013 2014
Average size of bribe(Rwf) 37,000 39,590 35,125
Average size of bribe(USD) 50 53 47
The average share of bribe remained generally unchanged, averaging about 37,000 francs during the period under review.
38
Table 17: Average size of bribe – Rwanda land services
Land related services are is Rwanda a topic of high priority due to political, historical and economic importance. Rwanda is one of the most densely populated countries in sub-Saharan Africa, thereby making land a very critical resource. Besides, the overwhelming majority of the Rwandans derive their livelihood directly from land and this makes it a very valuable resource.
Land services such as issuing land deeds, partitioning of land, taxation and changing of ownership status are conducted at the level of local governments by One Stop Centres. Rwanda has traditionally had a large number of land related disputes. Around 15% of all disputes registered at the Advocacy and Legal Advice Centres (ALACs) are directly related to land matters.39
The Ministry of Natural Resources, managing land services all over the country, has launched in 2014 electronic land registration through decentralized land use planning and mapping. So far the national land registry has been maintained and sustained by strengthening land administration institutions. However, the registry is still slow and plagued by technical problems.
The 2014 World Bank Doing Business report indicates that Rwanda made transferring property easier by both eliminating the requirement to obtain a tax clearance certificate and establishing the web-based Land Administration Information System for processing land transactions. This has in turn reduced transaction costs and to some extent, corruption incidents.
POLICEThe police remained the most bribery prone institution across the review period. The aggreage score deteriorated during this time with the highest score recorded in 2013 at 54 .
Figure 38: Aggregate score trends – Rwanda Police
37. 1USD=743.6 RWF39 Source : TI- Rwanda’s ALAC data

38 | .......................................................................................................THE EAST AFRICAN BRIBERY INDEX TRENDS ANALYSIS (2010-2014) THE EAST AFRICAN BRIBERY INDEX TRENDS ANALYSIS (2010-2014)........................................................................................ | 39
Indicator/Year 2012 2013 2014
Average size of bribe(Rwf) 21,481 40,754 48,961
Average size of bribe(USD) 29 55 66
All the individual indicators with the exception of share of national bribe returned a similar trend of a rise for the first three years, attaining a peak in 2013 before falling. The spurt was sharpest for impact that rose from a low of 5% in 2010 to 35% in 2013. The likelihood of bribery remained the lowest ranking indicator across the period.
Figure 39: Various indicators – Rwanda Police
The average share of bribe claimed by the police rose by about 100% across the period with the sharpest rise between 2012 and 2013. It is worth noting that the average size of bribe paid to the police in Rwanda in 2013 and 2014 was the highest recorded by a police institution in the region.
40
Table 18: Average size of bribe – Rwanda police
The National Police of Rwanda (RNP) topped the list in 2014 in the likelihood of encountering bribery indicator. The differentiation between traffic and administration police shows however significant differences in the level of perceived impact of corruption between the two forces. Traffic police scores consecutively worst in the likelihood, impact and prevalence of bribe. In contrast, administration police comes with much cleaner record scoring 4.45% in likelihood of bribery, compared to 9.38% in traffic police in 2014.41
Despite the fact that police is reported to take the lead with the highest demand occurrences of bribery, the incidence of perceived impact of corruption in the force has improved remarkably between 2013 and 2014. After the 2013, the police was put in the spot light and number of reform initiatives and reforms were launched. The data from the survey support the notion that these initiatives are bearing at least partial results.
There might be a range of factors behind the improvement. The political commitment to maintain highest standards of discipline in the law enforcement and security agencies has materialized in successive, nation-wide campaigns proclaiming a zero stance to corruption in RNP. As a result, a number of preventive measures and policies have been put in place recently. This include a new code of conduct for police officers, stronger internal control mechanism within the police and through the Office of the Ombudsman and E-policing , which have contributed to cleaner police force in Rwanda.
Some of the initiatives put forward to prevent corruption over time include the establishment of a force disciplinary unit, online registration of driver’s licenses, internal audits and an ethics center. Some recent measures such as voiding the right of traffic police to retain a driving license, are attempting to further reduce the systematic loopholes for bribery in collection of fines, especially in the traffic police.
Punitive measures for traffic offences have seen a decline in fines for traffic-related offences in 2014. Drivers caught speeding or without license can be fined up to Frw450, 000 (US $652). The previous fine was Frw50, 000. Other offences
40. 1USD=743.6 RWF41 This data was derived from a more detailed Rwanda bribery index ,2014
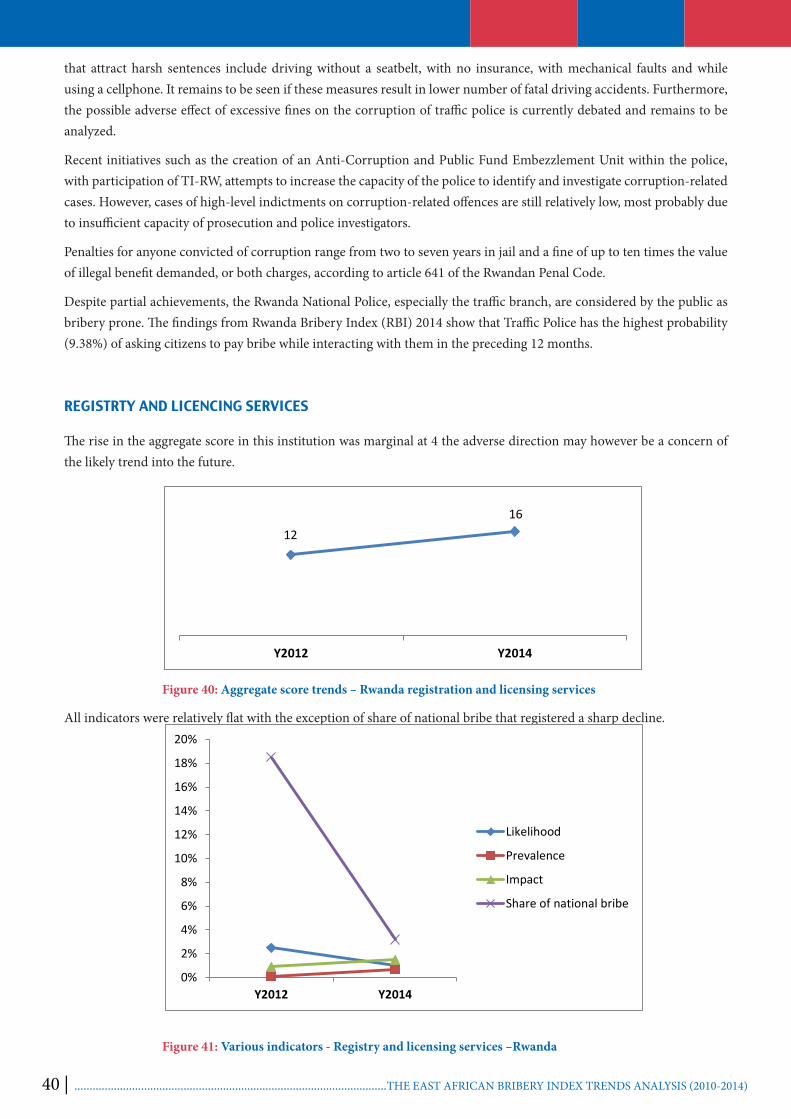
40 | .......................................................................................................THE EAST AFRICAN BRIBERY INDEX TRENDS ANALYSIS (2010-2014)
that attract harsh sentences include driving without a seatbelt, with no insurance, with mechanical faults and while using a cellphone. It remains to be seen if these measures result in lower number of fatal driving accidents. Furthermore, the possible adverse effect of excessive fines on the corruption of traffic police is currently debated and remains to be analyzed.
Recent initiatives such as the creation of an Anti-Corruption and Public Fund Embezzlement Unit within the police, with participation of TI-RW, attempts to increase the capacity of the police to identify and investigate corruption-related cases. However, cases of high-level indictments on corruption-related offences are still relatively low, most probably due to insufficient capacity of prosecution and police investigators.
Penalties for anyone convicted of corruption range from two to seven years in jail and a fine of up to ten times the value of illegal benefit demanded, or both charges, according to article 641 of the Rwandan Penal Code.
Despite partial achievements, the Rwanda National Police, especially the traffic branch, are considered by the public as bribery prone. The findings from Rwanda Bribery Index (RBI) 2014 show that Traffic Police has the highest probability (9.38%) of asking citizens to pay bribe while interacting with them in the preceding 12 months.
REGISTRTY AND LICENCING SERVICES
The rise in the aggregate score in this institution was marginal at 4 the adverse direction may however be a concern of the likely trend into the future.
1216
Y2012 Y2014
Figure 40: Aggregate score trends – Rwanda registration and licensing services
All indicators were relatively flat with the exception of share of national bribe that registered a sharp decline.
Figure 41: Various indicators - Registry and licensing services –Rwanda
0%
2%
4%
6%
8%
10%
12%
14%
16%
18%
20%
Y2012 Y2014
Likelihood
Prevalence
Impact
Share of national bribe

40 | .......................................................................................................THE EAST AFRICAN BRIBERY INDEX TRENDS ANALYSIS (2010-2014) THE EAST AFRICAN BRIBERY INDEX TRENDS ANALYSIS (2010-2014)........................................................................................ | 41
Indicator/Year 2012 2014
Average size of bribe(Rwf) 18,643 53,937
Average size of bribe(USD) 25 72
The average bribe rose by almost 200% between 2012 and 2014.
42
Table 19: Average size of bribe- Registry and licensing services –Rwanda
Registration and licensing services which includes issuance of identity cards (ID), driving licences, etc. is conducted by the local government decentralised entities. Service charters for districts, sectors and cells (Rwandan decentralised entities) specify among other things , eligibility for a service, staff in charge of provision of a service, requirements for a service, fees, time of service delivery and complaint procedures.
Most of services are delivered at cells and sectors, entities close to people’s residences. Despite steady improvement, the officials in these institutions are not well trained and usually lack time and competency to serve the public. Accountability tools such as service charters, suggestion boxes and provision of some services through SMS have slightly reduced lack of transparency and also corruption in Local Government when issuing official documents. However, unlawful conditionality for a service provision, long list of requirements needed for a service and lack of time of officials create demand for corrupt transactions.
Local leaders are under pressure to eliminate corruption due to governance assessments such as Rwanda Governance Score card, 2014 which highlight inefficient service delivery and corruption, especially at the lower layers of public administration.
It is widely known that corruption at the local government level has hindered delivery of some of the most important social protection services such as the cattle-stocking programme commonly known as Girinka, and Vision 2020 Umurenge Programme (VUP) whereby money is distributed to the most vulnerable against issuing of vulnerability certificates.
TAX SERVICES
Aggregate score- Tax services Rwanda
The aggregate score for Tax services in Rwanda had a mixed outlook as the score more than doubled between 2012 and 2013 and decreased by half in 2014 .
Figure 43: Various indicators – Tax services – Rwanda 42. 1USD=743.6 RWF
7
19
10
0
5
10
15
20
Y2012 Y2013 Y2014
0%
1%
2%
3%
4%
5%
6%
Y2012 Y2013 Y2014
Likelihood
Prevalence
Impact
Share of nationalbribe
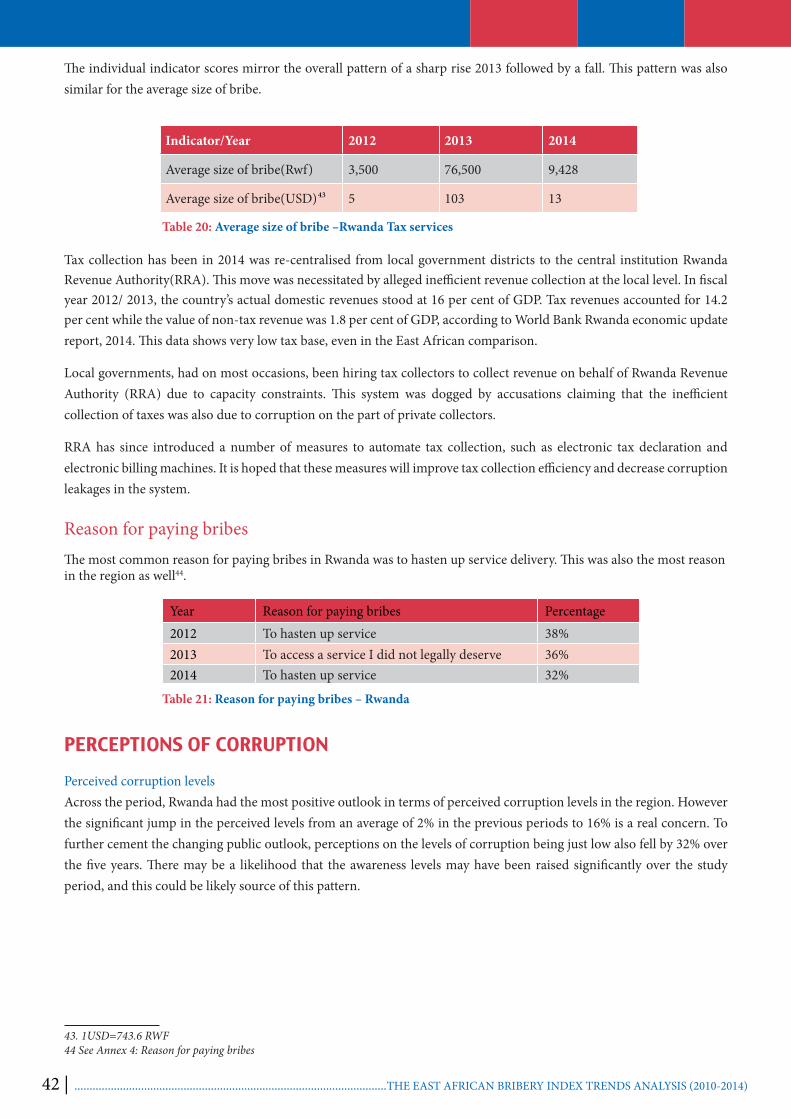
42 | .......................................................................................................THE EAST AFRICAN BRIBERY INDEX TRENDS ANALYSIS (2010-2014)
Indicator/Year 2012 2013 2014
Average size of bribe(Rwf) 3,500 76,500 9,428
Average size of bribe(USD) 5 103 13
The individual indicator scores mirror the overall pattern of a sharp rise 2013 followed by a fall. This pattern was also similar for the average size of bribe.
43
Table 20: Average size of bribe –Rwanda Tax services
Tax collection has been in 2014 was re-centralised from local government districts to the central institution Rwanda Revenue Authority(RRA). This move was necessitated by alleged inefficient revenue collection at the local level. In fiscal year 2012/ 2013, the country’s actual domestic revenues stood at 16 per cent of GDP. Tax revenues accounted for 14.2 per cent while the value of non-tax revenue was 1.8 per cent of GDP, according to World Bank Rwanda economic update report, 2014. This data shows very low tax base, even in the East African comparison.
Local governments, had on most occasions, been hiring tax collectors to collect revenue on behalf of Rwanda Revenue Authority (RRA) due to capacity constraints. This system was dogged by accusations claiming that the inefficient collection of taxes was also due to corruption on the part of private collectors.
RRA has since introduced a number of measures to automate tax collection, such as electronic tax declaration and electronic billing machines. It is hoped that these measures will improve tax collection efficiency and decrease corruption leakages in the system.
Reason for paying bribesThe most common reason for paying bribes in Rwanda was to hasten up service delivery. This was also the most reason in the region as well44.
Table 21: Reason for paying bribes – Rwanda
PERCEPTIONS OF CORRUPTION
Perceived corruption levels Across the period, Rwanda had the most positive outlook in terms of perceived corruption levels in the region. However the significant jump in the perceived levels from an average of 2% in the previous periods to 16% is a real concern. To further cement the changing public outlook, perceptions on the levels of corruption being just low also fell by 32% over the five years. There may be a likelihood that the awareness levels may have been raised significantly over the study period, and this could be likely source of this pattern.
43. 1USD=743.6 RWF44 See Annex 4: Reason for paying bribes
Year Reason for paying bribes Percentage 2012 To hasten up service 38%2013 To access a service I did not legally deserve 36%2014 To hasten up service 32%
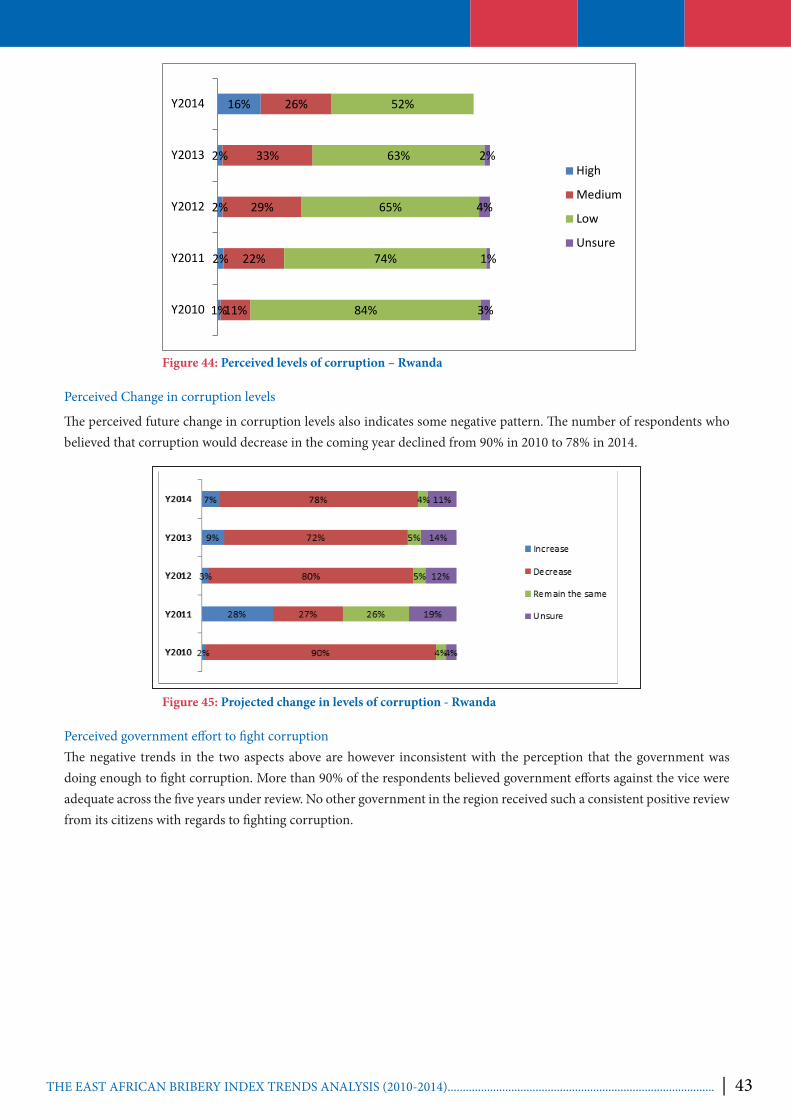
42 | .......................................................................................................THE EAST AFRICAN BRIBERY INDEX TRENDS ANALYSIS (2010-2014) THE EAST AFRICAN BRIBERY INDEX TRENDS ANALYSIS (2010-2014)........................................................................................ | 43
Figure 44: Perceived levels of corruption – Rwanda
Perceived Change in corruption levels
The perceived future change in corruption levels also indicates some negative pattern. The number of respondents who believed that corruption would decrease in the coming year declined from 90% in 2010 to 78% in 2014.
Figure 45: Projected change in levels of corruption - Rwanda
Perceived government effort to fight corruption The negative trends in the two aspects above are however inconsistent with the perception that the government was doing enough to fight corruption. More than 90% of the respondents believed government efforts against the vice were adequate across the five years under review. No other government in the region received such a consistent positive review from its citizens with regards to fighting corruption.
1%
2%
2%
2%
16%
11%
22%
29%
33%
26%
84%
74%
65%
63%
52%
3%
1%
4%
2%
Y2010
Y2011
Y2012
Y2013
Y2014
High
Medium
Low
Unsure

44 | .......................................................................................................THE EAST AFRICAN BRIBERY INDEX TRENDS ANALYSIS (2010-2014)
97%
93%
95%
88%
97%
1%
4%
1%
5%
1%
2%
2%
4%
7%
2%
Y2010
Y2011
Y2012
Y2013
Y2014
Yes
No
Unsure
Figure 46: Perceived government effort to fight corruption –Rwanda
44 | .......................................................................................................THE EAST AFRICAN BRIBERY INDEX TRENDS ANALYSIS (2010-2014) THE EAST AFRICAN BRIBERY INDEX TRENDS ANALYSIS (2010-2014)........................................................................................ | 45
TANZANIA
Background
Over the years, the government of Tanzania has put a lot of effort to respond to concerns over poor governance. This has been done through policy, legal, institutional reforms. At the policy level, this includes the National Anti-Corruption Strategy and Action Plan (NACSAP). At the institutional level, Tanzania has brought on board the Prevention and Combating of Corruption Bureau (PCCB) through Prevention and Combating of Corruption Act (2007). Other pieces of legislation include Public Finance Act, 2001; Public Procurement Act, 2004; Election Expenses Act, 2010, Anti - Money Laundering Act, 2006 and Economic and Organized Crime Control Act, 1984
With a reasonably well developed anti-corruption framework, it would be expected that Tanzania would perform better in terms of public financial management. However, there are apparent failures among different government institutions which have been assigned the responsibility to check corruption. The efforts by the Police, the PCCB, the Minister of State in charge of Good Governance and the Ethics Secretariat at times seem uncoordinated. This crowded space, like in other countries in the region, creates unnecessary competition for resources and overlapping mandates.
There have been other initiatives to improve the provision of public services. In August 2015, the government launched three integrity pledges for public and private sectors as an effort to combat corruption and cultivate an ethical culture amongst public officials. This comes at a time when Tanzania, has newly found fossils fuels wealth. According to some estimates, the natural gas reserves are about at 52 Trillion Cubic Feet (TCF) worth over USD 500 billion upon full recovery. This is a huge boost to the national economy; however, the government has to instill transparency mechanisms if the benefits are to flow to the citizens. Being a member of Extractive Industries Transparency Initiative (EITI), the challenge then lies with compliance.
The adverse listing of the judiciary and the police in the East African Bribery Index for the last five years is a pointer to the challenge of fully responding to corruption in the country. These two institutions are very central in any anti-corruption efforts. Further, the huge scandals in such sectors like energy and transport in the recent years make an already bad situation dire.
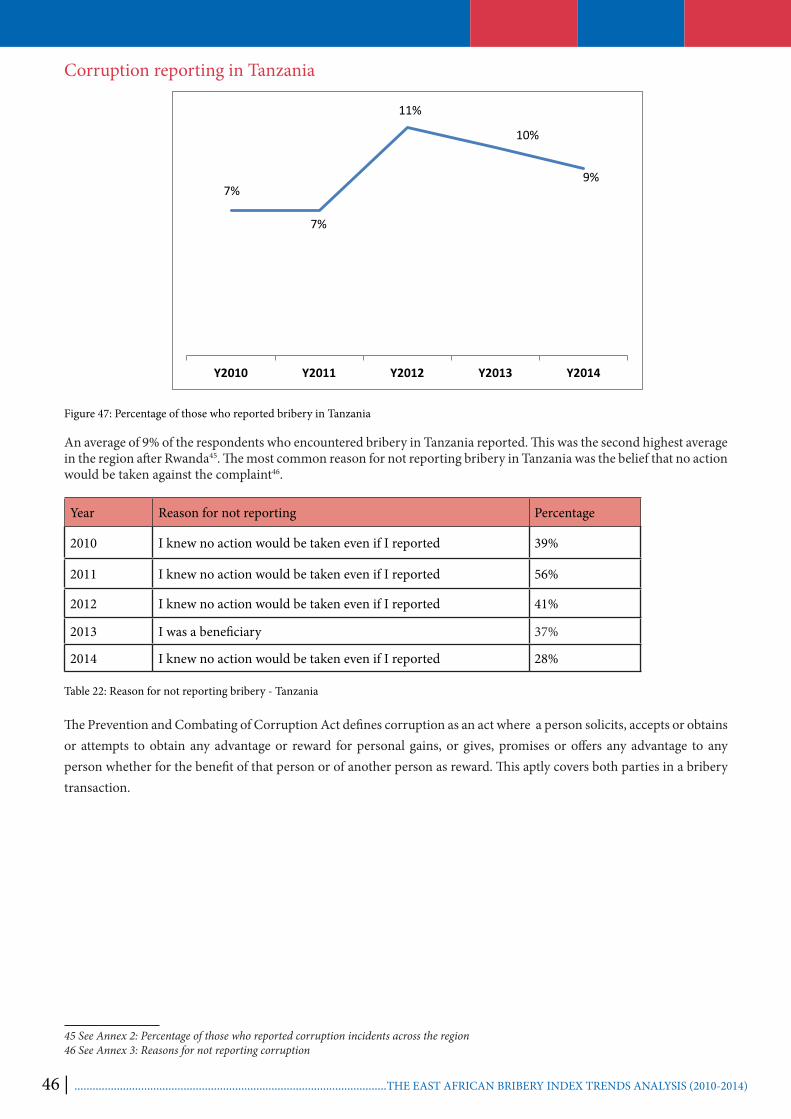
46 | .......................................................................................................THE EAST AFRICAN BRIBERY INDEX TRENDS ANALYSIS (2010-2014)
Corruption reporting in Tanzania
7%
7%
11%
10%
9%
Y2010 Y2011 Y2012 Y2013 Y2014
Figure 47: Percentage of those who reported bribery in Tanzania
An average of 9% of the respondents who encountered bribery in Tanzania reported. This was the second highest average in the region after Rwanda45. The most common reason for not reporting bribery in Tanzania was the belief that no action would be taken against the complaint46.
Year Reason for not reporting Percentage
2010 I knew no action would be taken even if I reported 39%
2011 I knew no action would be taken even if I reported 56%
2012 I knew no action would be taken even if I reported 41%
2013 I was a beneficiary 37%
2014 I knew no action would be taken even if I reported 28%
Table 22: Reason for not reporting bribery - Tanzania
The Prevention and Combating of Corruption Act defines corruption as an act where a person solicits, accepts or obtains or attempts to obtain any advantage or reward for personal gains, or gives, promises or offers any advantage to any person whether for the benefit of that person or of another person as reward. This aptly covers both parties in a bribery transaction.
45 See Annex 2: Percentage of those who reported corruption incidents across the region46 See Annex 3: Reasons for not reporting corruption

46 | .......................................................................................................THE EAST AFRICAN BRIBERY INDEX TRENDS ANALYSIS (2010-2014) THE EAST AFRICAN BRIBERY INDEX TRENDS ANALYSIS (2010-2014)........................................................................................ | 47
75 76
4538
42
Y2010 Y2011 Y2012 Y2013 Y2014
Figure 48: Aggregate score trends – Tanzania Judiciary
The Judiciary marked some improvement in the aggregate score falling from 75 to 42 points across the five years. It was however among the top five most bribery prone institutions in Tanzania. At the regional level, it was the second best performing Judiciary.
The other indicators similarly registered improvement during the period under review with the share of bribe and impact of bribe maintaining an almost steady score.
0%10%20%30%40%50%60%70%80%
Y2010 Y2011 Y2012 Y2013 Y2014
Likelihood
Prevalence
Impact
Share of nationalbribe
Figure 49: Various indicators – Tanzania Judiciary
Unlike the other four indicators, the average size of bribe, with the exception of 2011, recorded a steady increase from 61,567.06 Tanzania Shillings in 2010 to 103,550.12 Tanzania Shillings in 2014.
47
Table 23: Average size of bribe – Tanzania Judiciary
47. 1USD=2171.8 Tsh
Indicator/Year 2010 2011 2012 2013 2014
Average size of bribe(Tsh) 61,567.06 52,385.12 64,251.6 85,509.84 103,550.12
Average size of bribe(USD) 28 24 30 39 48

48 | .......................................................................................................THE EAST AFRICAN BRIBERY INDEX TRENDS ANALYSIS (2010-2014)
The Constitution of the United Republic of Tanzania, 1977 vests the authority and responsibility to administer justice in the Judiciary of Tanzania. The roles and functions of the Judiciary include; Interpreting diverse Laws and execution of administrative decisions; Hearing and deciding cases filed before the courts of law; Educating members of the public of their rights and obligations under the laws of Tanzania and facilitating the maintenance of peace and order through good governance and the rule of law.
According to the Bertelsmann Stiftung’s Transformation Index (BTI) 2014, the Tanzanian judicial system lacks sufficient resources, has a very heavy workload and is under lingering suspicion of corrupt practices when dispensing justice. The judiciary is alleged to be underfunded, corrupt and inefficient, especially in the lower courts. Court clerks and magistrates are known to accept bribes to open/misdirect cases or to altogether determine a case’s outcome, respectively48. Accordingly, the degree to which the system can provide an expeditious and fair trial is questionable.
Tanzania government initiatives to fight corruption within judiciary system have not been sufficient. Some of these included the revision of the client charter, introduction of complaints handling mechanisms and strengthening of the ethical committee in the Judiciary49. There however seems to be renewed energy injected in the reform process with the introduction of the Citizen-centric judicial modernization and justice service delivery project. It is aimed at among other objectives, enhancing the capacity of Judiciary to deliver efficient, transparent, and accessible citizen centered services. This project funded by the World Bank and will be implemented by the government of Tanzania.50
LAND SERVICES
44 45
2027
36
Y2010 Y2011 Y2012 Y2013 Y2014
Figure 50: Aggregate score trends – Tanzania Land services
The overall performance of the land sector returned a mixed outlook with the highest aggregate score recorded in 2011 and the lowest in 2012. It is also worth noting that land services in Tanzania did not feature among the top ten most bribery prone institutions in the region.
On the national share of bribe, the sector experienced an almost constant deterioration with the proportion going to the sector more than doubling in the last five years.
48 Country Reports on Human Rights Practices for 2013 from http://www.state.gov/j/drl/rls/hrrpt/2013humanrightsreport/index.htm?-year=2013&dlid=220169#wrapper accessed on 17th September, 201549 http://www.judiciary.go.tz/index.php?option=com_content&view=article&id=67&Itemid=9350 http://www.judiciary.go.tz/downloads/Reviewed_ESMF%20Report%20for%20Judicial%20Project%20Tanzania_WB.pdf

48 | .......................................................................................................THE EAST AFRICAN BRIBERY INDEX TRENDS ANALYSIS (2010-2014) THE EAST AFRICAN BRIBERY INDEX TRENDS ANALYSIS (2010-2014)........................................................................................ | 47
0%
10%
20%
30%
40%
50%
60%
Y2010 Y2011 Y2012 Y2013 Y2014
Likelihood
Prevalence
Impact
Share of national bribe
Figure 51: Various indicator trends - Tanzania Land services
The average size of the bribe also deteriorates with a rise of almost 50%. The 2014 figure was however a decrease from the previous year.
51
Table 24: Average size of bribes - Tanzania Land services
The Ministry of Lands, Housing and Human Settlements Development encompass core sector Departments such as Land Administration, Survey and Mapping, Physical Planning and Housing. These departments are responsible for Registration of Titles, Property Valuation, and District Land and Housing Tribunal. The ministry has an agency dealing with Housing and Building materials research, a commission dealing with Land use Planning and the National Housing Corporation (NHC). The mandate of the ministry also includes effective management of land and human settlements development services for the betterment of social and economic well – being of the Tanzanian society, land allocation, preparing documents related to Rights of Occupancy, land dispute settlements, overseeing all issues related to land administration and to advice the government on such issues.
TANZANIA POLICE FORCE (TPF)
85 83 83
73
83
Y2010 Y2011 Y2012 Y2013 Y2014
Figure 52: Aggregate score trends – Tanzania Police
51. 1USD=2171.8 Tsh
Indicator/Year 2010 2011 2012 2013 2014
Average size of bribe(Tsh) 75,894.23 29,476.74 65,573.77 117,553.77 111,057.42
Average size of bribe(USD) 35 14 30 54 51

48 | .......................................................................................................THE EAST AFRICAN BRIBERY INDEX TRENDS ANALYSIS (2010-2014)
The performance of the police on the overall has remained adverse across the study period. First, the aggregate score remained over 80 points across the period with exception of 2013. Secondly, it has remained the most bribery prone institution in Tanzania in the last five years. Also, the Police in Tanzania was ranked either first or second most bribery prone institution in the region.
Likelihood of encountering bribery registered a decrease while the share of national bribes registered a decrease. Prevalence and impact of bribe had a mixed outlook during the period under review.
Figure 53: Various indicator trends – Tanzania Police
The average size of bribe grew by about 35% across the study period. It is worth noting that the Tanzania police had the lowest five- year average size of bribe compared to their counterparts in the region, while the Rwanda Police recorded the highest.
52
Table 25: Average size of bribe – Tanzania Police
Tanzania Police Force (TPF) is one of the departments under the Ministry of Home Affairs charged with the responsibility to provide safety and security for people and property. Provision of policing services in Tanzania is guided by Police Force and Auxiliary Service Act, Criminal procedure Act 1985, Police Force Services Regulations and Police General Orders.
There have been some efforts to check corruption within the force over the years. The Police general Orders contain provisions to reward police officers who report fellow police officers involved in bribery. Further, the orders provide for dismissal of officers who are aware officers involved in corruption but do not report them53. Integrity committees have also been established at regional and district level seemed to have made it easier for citizens to highlight corruption and ethics issues by their police force.54
Despite such initiatives , Tanzania Police force continues to experience challenges as they have been consistently ranked among the most bribery prone institutions in the region.
52. 1USD=2171.8 Tsh53 Commonwealth Human Rights Initiative, 2014 A Force For Good? Improving the police in Kenya, Tanzania and Uganda54 UNDP, 2013 Tanzania Success Stories Fighting Corruption
Indicator/Year 2010 2011 2012 2013 2014
Average size of bribe(Tsh) 44,495.21 40,114.17 42,367.62 56,571 60,777.35
Average size of bribe(USD) 20 18 20 26 28
0%
10%
20%
30%
40%
50%
60%
70%
80%
90%
Y2010 Y2011 Y2012 Y2013 Y2014
Likelihood
Prevalence
Impact
Share of national bribe

48 | .......................................................................................................THE EAST AFRICAN BRIBERY INDEX TRENDS ANALYSIS (2010-2014) THE EAST AFRICAN BRIBERY INDEX TRENDS ANALYSIS (2010-2014)........................................................................................ | 49
REGISTRY AND LICENSING SERVICES
Figure 54: Aggregate score trends – Tanzania registry and licensing
The overall score for this service registered a mixed outlook as it can be observed that there were instances of deterioration and improvement in equal measure. Other indicators of likelihood, impact and prevalence recorded a similar pattern during the three year period. Share of national bribe registered an initial increase followed by a steady score.
Figure 55: Various indicator trends – Tanzania registry and licensing services
The average size of bribe was highest in 2013 at 46,419 Tanzania shillings and lowest in 2012 with 25,741 shillings.
55
Table 26: Average size of bribery – Tanzania registry and licensing services
In Tanzania, the vital registration system is governed and mandated by the Registration Insolvency and Trusteeship Agency (RITA) while civil registration is handled by the National Identification Authority(NIDA), which was established under Section 2(1) of the National Identification Authority Instrument. This agency is responsible for Identification and Registration of Persons, Issuance and Management of Identity Cards, Management and Maintenance of Persons as well as handling immigration services. Business registration is handled by Business Registrations and Licensing Agency (BRELA), while transport related matters are regulated by The Surface and Marine Transport Regulatory Authority (SUMATRA). In an effort to improve services, Registration Insolvency and Trusteeship Agency (RITA) has introduced mobile phone services.
However, citizens still encounter corruption with RITA officials especially during application and follow up of the birth certificate. Registration and application of national identification has been affected by a high degree of bureaucracy and the process is time consuming as whenever the exercise has been introduced in a particular region/district, it has to be accomplished within a short time. 55. 1USD=2171.8 Tsh
Indicator/Year 2010 2012 2013 2014
Average size of bribe (Tsh) 39,343 25,741 46,419 40,145
Average size of bribe (USD) 18 12 21 18
0%
10%
20%
30%
40%
50%
60%
70%
Y2010 Y2012 Y2013 Y2014
Likelihood
Prevalence
Impact
Share of nationalbribe
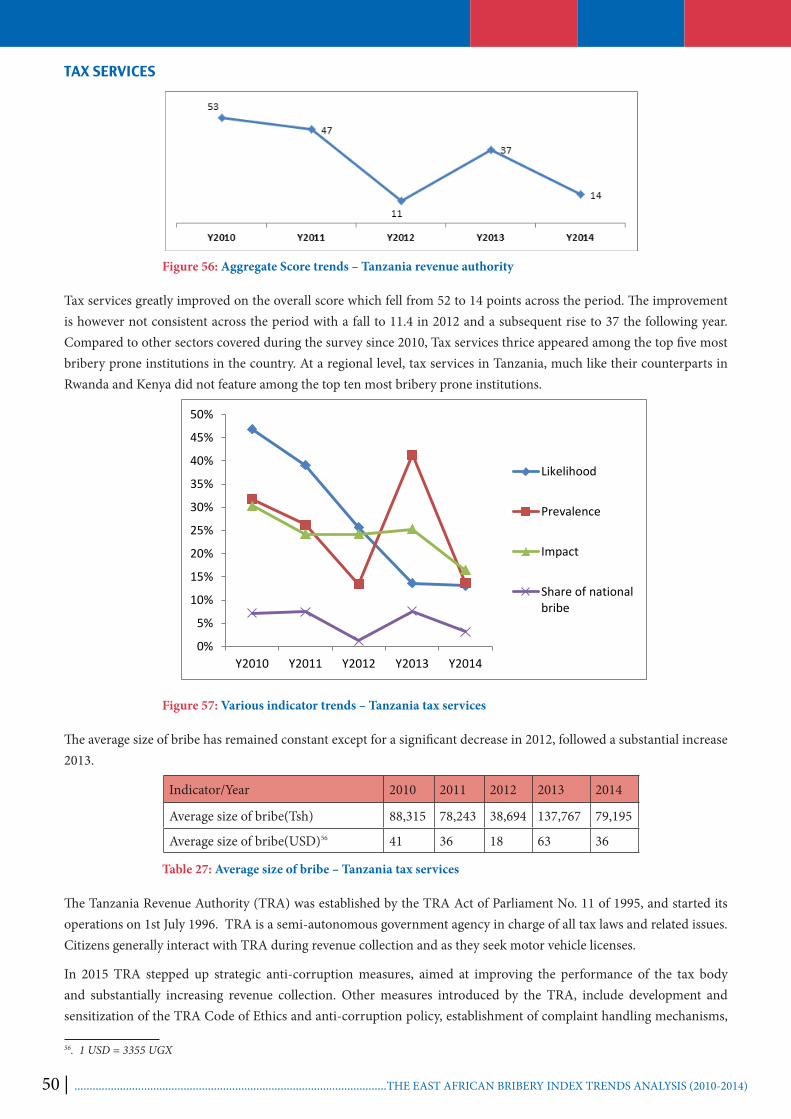
50 | .......................................................................................................THE EAST AFRICAN BRIBERY INDEX TRENDS ANALYSIS (2010-2014)
TAX SERVICES
Figure 56: Aggregate Score trends – Tanzania revenue authority
Tax services greatly improved on the overall score which fell from 52 to 14 points across the period. The improvement is however not consistent across the period with a fall to 11.4 in 2012 and a subsequent rise to 37 the following year. Compared to other sectors covered during the survey since 2010, Tax services thrice appeared among the top five most bribery prone institutions in the country. At a regional level, tax services in Tanzania, much like their counterparts in Rwanda and Kenya did not feature among the top ten most bribery prone institutions.
0%
5%
10%
15%
20%
25%
30%
35%
40%
45%
50%
Y2010 Y2011 Y2012 Y2013 Y2014
Likelihood
Prevalence
Impact
Share of nationalbribe
Figure 57: Various indicator trends – Tanzania tax services
The average size of bribe has remained constant except for a significant decrease in 2012, followed a substantial increase 2013.
56
Table 27: Average size of bribe – Tanzania tax services
The Tanzania Revenue Authority (TRA) was established by the TRA Act of Parliament No. 11 of 1995, and started its operations on 1st July 1996. TRA is a semi-autonomous government agency in charge of all tax laws and related issues. Citizens generally interact with TRA during revenue collection and as they seek motor vehicle licenses.
In 2015 TRA stepped up strategic anti-corruption measures, aimed at improving the performance of the tax body and substantially increasing revenue collection. Other measures introduced by the TRA, include development and sensitization of the TRA Code of Ethics and anti-corruption policy, establishment of complaint handling mechanisms,
56. 1 USD = 3355 UGX
Indicator/Year 2010 2011 2012 2013 2014
Average size of bribe(Tsh) 88,315 78,243 38,694 137,767 79,195
Average size of bribe(USD) 41 36 18 63 36

50 | .......................................................................................................THE EAST AFRICAN BRIBERY INDEX TRENDS ANALYSIS (2010-2014) THE EAST AFRICAN BRIBERY INDEX TRENDS ANALYSIS (2010-2014)........................................................................................ | 51
adoption of automation systems in various TRA operations eg TANCIS, Electronic Tracking, E-filling of tax returns, E-payment, motor-vehicle taxes and fees through mobile phones.
The introduction of the Electronic Fiscal Device (EFD) in 2012 alongside other initiatives within TRA may have informed improved ranking of the institution in the EABI.
Reason for paying bribes The most common reason for paying bribes in Tanzania was to hasten put the service that was being sought. This was the most common reason for paying bribes in the region.
Table 28: Reasons for paying bribes in Tanzania
PERCEPTION OF CORRUPTION
Perceived levels of corruption
Figure 58: Perceived levels of corruption – Tanzania
Despite government initiatives in Tanzania, studies show that, as time goes by, corruption in Tanzania continues to increase. In recent years, the country experienced mega corruption scandals implicating senior government officials and shaking the country’s economy. These could perhaps explain the increase in the number of respondents that perceived the levels of corruption to be high; from 45.6% in 2010 to 68% in 2014 with a dip in 2011 at 36.8%. Across the same period an average of 8% of the respondents perceived corruption levels in Tanzania to be low.
Year Reason for paying bribes Percentage
2012 It was the only way to access service 41%
2013 To hasten up service 35%
2014 To hasten up service 38%
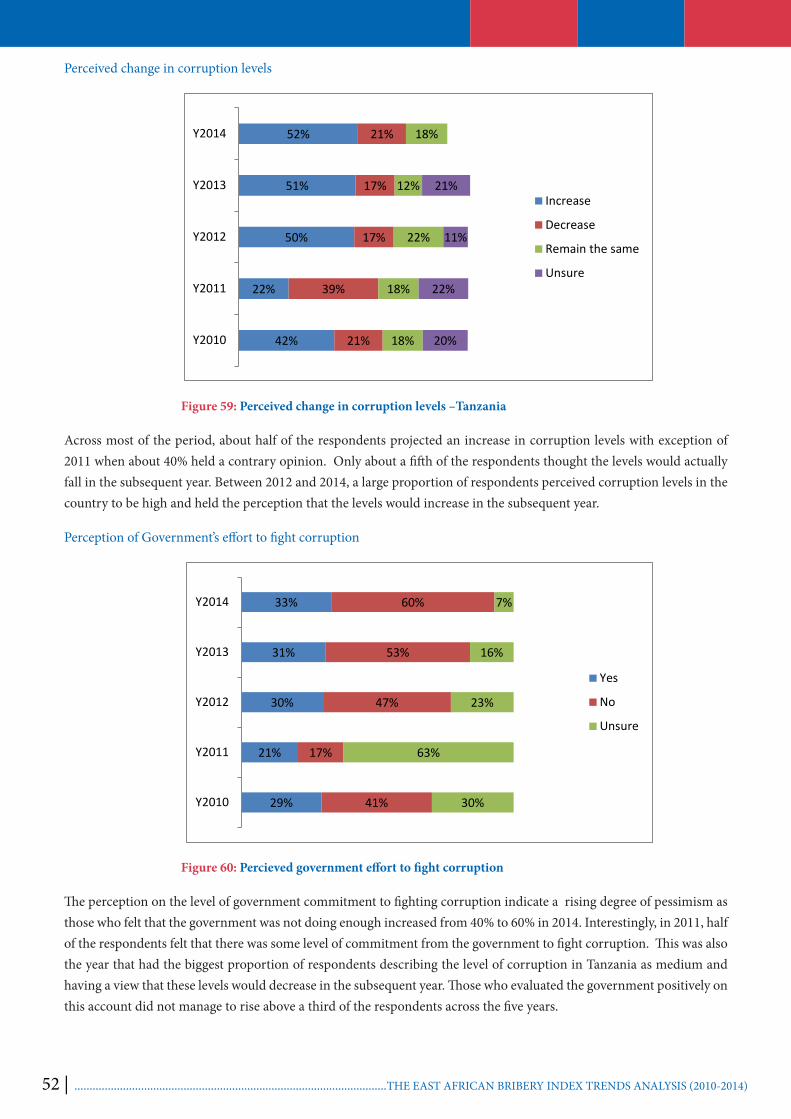
52 | .......................................................................................................THE EAST AFRICAN BRIBERY INDEX TRENDS ANALYSIS (2010-2014)
Perceived change in corruption levels
42%
22%
50%
51%
52%
21%
39%
17%
17%
21%
18%
18%
22%
12%
18%
20%
22%
11%
21%
Y2010
Y2011
Y2012
Y2013
Y2014
Increase
Decrease
Remain the same
Unsure
Figure 59: Perceived change in corruption levels –Tanzania
Across most of the period, about half of the respondents projected an increase in corruption levels with exception of 2011 when about 40% held a contrary opinion. Only about a fifth of the respondents thought the levels would actually fall in the subsequent year. Between 2012 and 2014, a large proportion of respondents perceived corruption levels in the country to be high and held the perception that the levels would increase in the subsequent year.
Perception of Government’s effort to fight corruption
29%
21%
30%
31%
33%
41%
17%
47%
53%
60%
30%
63%
23%
16%
7%
Y2010
Y2011
Y2012
Y2013
Y2014
Yes
No
Unsure
Figure 60: Percieved government effort to fight corruption
The perception on the level of government commitment to fighting corruption indicate a rising degree of pessimism as those who felt that the government was not doing enough increased from 40% to 60% in 2014. Interestingly, in 2011, half of the respondents felt that there was some level of commitment from the government to fight corruption. This was also the year that had the biggest proportion of respondents describing the level of corruption in Tanzania as medium and having a view that these levels would decrease in the subsequent year. Those who evaluated the government positively on this account did not manage to rise above a third of the respondents across the five years.

52 | .......................................................................................................THE EAST AFRICAN BRIBERY INDEX TRENDS ANALYSIS (2010-2014) THE EAST AFRICAN BRIBERY INDEX TRENDS ANALYSIS (2010-2014)........................................................................................ | 53
RECOMMENDATIONS
1. Amend the Prevention and Combating of Corruption Act (2007) so to make the Prevention and Corruption Bureau (PCCB) an independent institution.
2. Develop educational and corruption prevention programs, including incorporation of anti corruption programs in primary and secondary curriculum.
3. Government institutions should prepare and publicly display their service / client charters outlining the services available, their cost and length of time required to get the service.
4. Enhance public awareness on corruption, its causes and consequences and to encourage the public to report corruption.
5. Strengthen civil society and media to ensure sustained momentum in demanding for government commitment to fight corruption.

54 | .......................................................................................................THE EAST AFRICAN BRIBERY INDEX TRENDS ANALYSIS (2010-2014)
UGANDA
Background
The drive to promote ethical values in public and private institutions in Uganda has been on- going for quite some time. The passage of the Anti-Corruption Act in 2009 was a great stride towards this response. The efficacy of the said law in bringing meaningful change towards minimizing corruption in institutions such as the judiciary, tax services, land services, registration and the police remains unanswered. Answering this question would perhaps call for a wholesome review of governance practices across the public service.
Over the years, Uganda has been ranked as increasingly corrupt at both the regional and international level, in 2014, for example, Transparency International’s Corruption Perceptions Index (CPI) ranked Uganda 142th out of 174 countries. The country’s global rankings have continually slipped over the past five years, but more concerning is that, in a survey by Uganda Bureau of Statistics, 82% of Ugandans asserted their concern over increasing corruption. Corruption in the public sector has remained high in spite of the development and implementation of an anti-corruption framework in 2012. This is largely due to the normalization of bribery practices, the increased bureaucracy in public institutions and vested interests in the corruption agenda.
Parliament recently passed the anti-corruption amendment bill, 2013 which now awaits presidential assent. The bill amends the anti-corruption Act, 2009 and now provides for a mandatory confiscation of properties attached to persons implicated of corruption. It is hoped that once enacted, the Act would reduce corruption by targeting illicit wealth.

54 | .......................................................................................................THE EAST AFRICAN BRIBERY INDEX TRENDS ANALYSIS (2010-2014) THE EAST AFRICAN BRIBERY INDEX TRENDS ANALYSIS (2010-2014)........................................................................................ | 55
Corruption reporting in Uganda
7%
10%
8%
7% 6%
Y2010 Y2011 Y2012 Y2013 Y2014
Figure 61: Percentage of those who reported bribery in Uganda
During the period under review, an average of 8% of the respondents that encountered bribery reported their experiences to the relevant authorities. The most common reason for not reporting bribery in Uganda was the belief that no action would be taken to resolve their complaint. This was also the most common reason across the region.
Table 29: Reason for not reporting corruption - Uganda
The Anti-Corruption Act, 2009 as part of its broad definition of Corruption, provides for a definition of Bribery as to include solicitation, accepting, any material benefits in their line of duty in exchange of an act or omission. The law equally provides sanctions for the two parties involved in a bribery situation. In reality however, there is very little risk that a person offering or receiving a bribe will be arrested.
Uganda passed a whistleblower protection law in 2010 meant to protect those who report incidences of corruption. The law is not necessarily explicit on protection of those reporting corruption but covers all persons reporting criminal or unlawful activities.
Most people who experience bribery do not usually report as it is viewed as a normal practice in society. Currently in Uganda, Bribe payers look at bribery as a way to “speed things up”. Low civic awareness also makes a large section of the Uganda society assume there is no need to resist bribery demands from public institutions as they assume it is a normal part of the process. Further, findings from the EABI indicate that citizens in Uganda do not report corruption because they know no action would be taken to resolve the complaint.
Year Reason for not reporting Percentage
2010 I knew no action would be taken even if I reported 42%
2011 I knew no action would be taken even if I reported 36%
2012 I knew no action would be taken even if I reported 34%
2013 I knew no action would be taken even if I reported 28%
2014 I knew no action would be taken even if I reported 26%
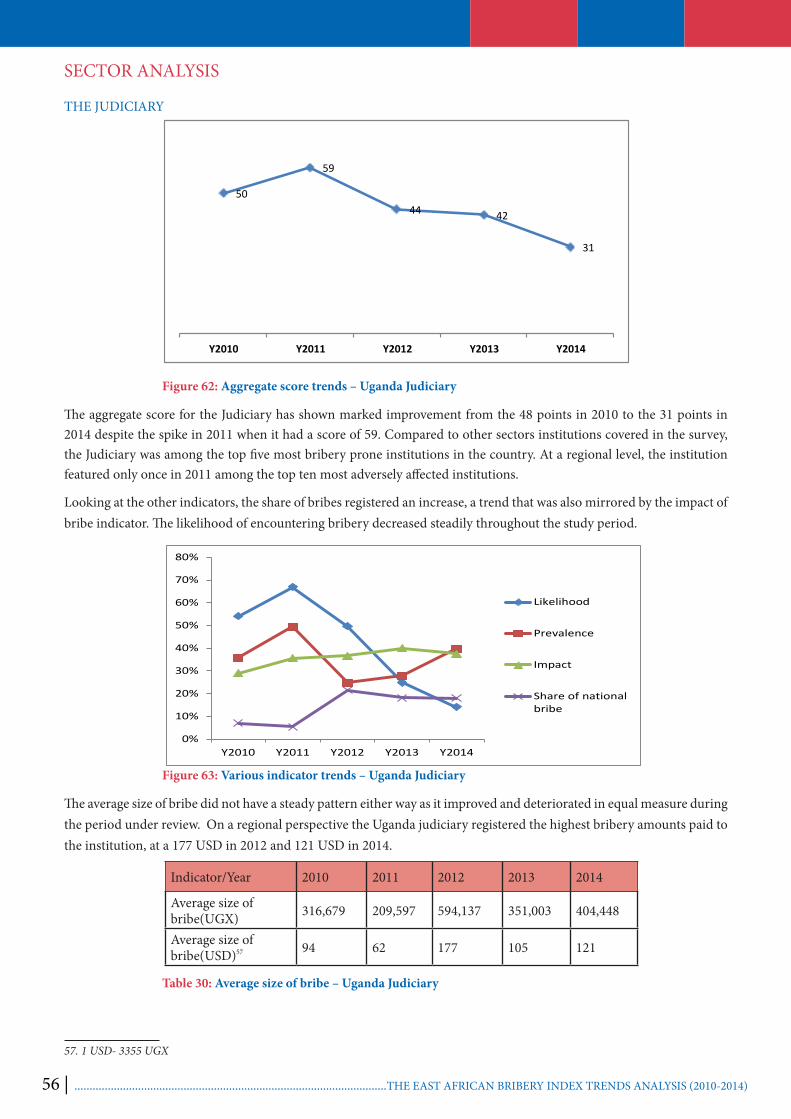
56 | .......................................................................................................THE EAST AFRICAN BRIBERY INDEX TRENDS ANALYSIS (2010-2014)
SECTOR ANALYSIS
THE JUDICIARY
Figure 62: Aggregate score trends – Uganda Judiciary
The aggregate score for the Judiciary has shown marked improvement from the 48 points in 2010 to the 31 points in 2014 despite the spike in 2011 when it had a score of 59. Compared to other sectors institutions covered in the survey, the Judiciary was among the top five most bribery prone institutions in the country. At a regional level, the institution featured only once in 2011 among the top ten most adversely affected institutions.
Looking at the other indicators, the share of bribes registered an increase, a trend that was also mirrored by the impact of bribe indicator. The likelihood of encountering bribery decreased steadily throughout the study period.
Figure 63: Various indicator trends – Uganda Judiciary
The average size of bribe did not have a steady pattern either way as it improved and deteriorated in equal measure during the period under review. On a regional perspective the Uganda judiciary registered the highest bribery amounts paid to the institution, at a 177 USD in 2012 and 121 USD in 2014.
57
Table 30: Average size of bribe – Uganda Judiciary
57. 1 USD- 3355 UGX
50
59
44 42
31
Y2010 Y2011 Y2012 Y2013 Y2014
Indicator/Year 2010 2011 2012 2013 2014
Average size of bribe(UGX) 316,679 209,597 594,137 351,003 404,448
Average size of bribe(USD) 94 62 177 105 121
0%
10%
20%
30%
40%
50%
60%
70%
80%
Y2010 Y2011 Y2012 Y2013 Y2014
Likelihood
Prevalence
Impact
Share of nationalbribe
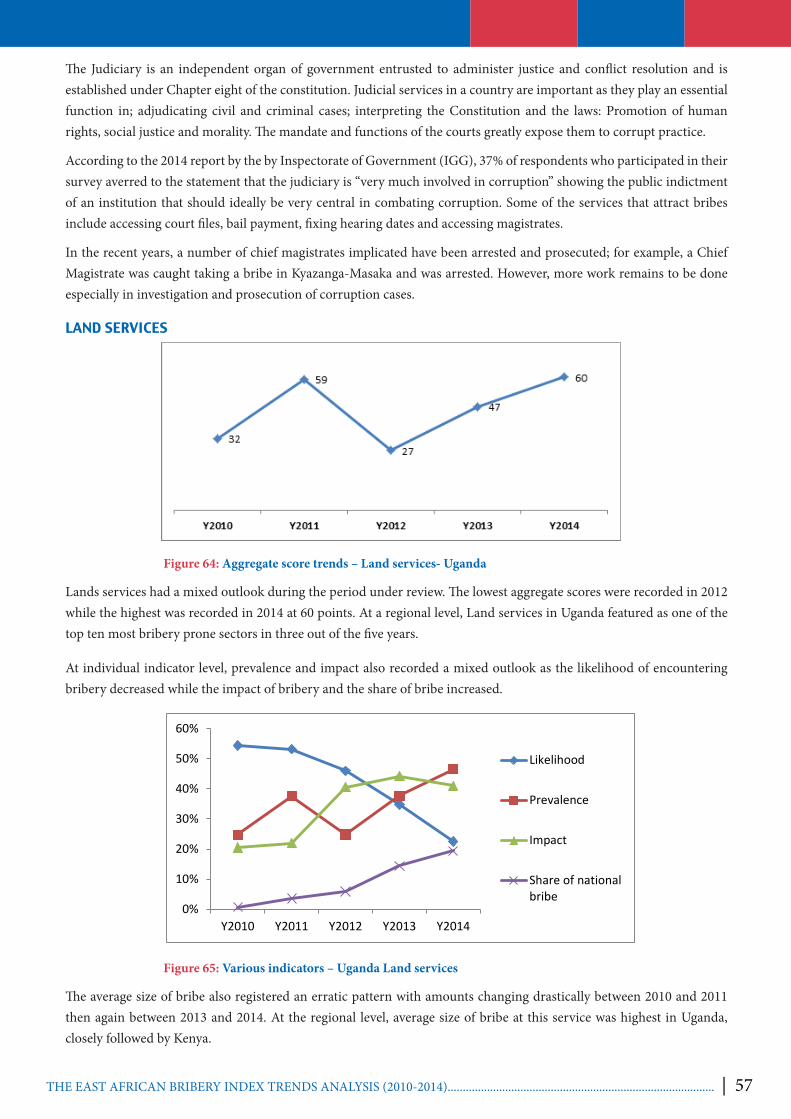
56 | .......................................................................................................THE EAST AFRICAN BRIBERY INDEX TRENDS ANALYSIS (2010-2014) THE EAST AFRICAN BRIBERY INDEX TRENDS ANALYSIS (2010-2014)........................................................................................ | 57
The Judiciary is an independent organ of government entrusted to administer justice and conflict resolution and is established under Chapter eight of the constitution. Judicial services in a country are important as they play an essential function in; adjudicating civil and criminal cases; interpreting the Constitution and the laws: Promotion of human rights, social justice and morality. The mandate and functions of the courts greatly expose them to corrupt practice.
According to the 2014 report by the by Inspectorate of Government (IGG), 37% of respondents who participated in their survey averred to the statement that the judiciary is “very much involved in corruption” showing the public indictment of an institution that should ideally be very central in combating corruption. Some of the services that attract bribes include accessing court files, bail payment, fixing hearing dates and accessing magistrates.
In the recent years, a number of chief magistrates implicated have been arrested and prosecuted; for example, a Chief Magistrate was caught taking a bribe in Kyazanga-Masaka and was arrested. However, more work remains to be done especially in investigation and prosecution of corruption cases.
LAND SERVICES
Figure 64: Aggregate score trends – Land services- Uganda
Lands services had a mixed outlook during the period under review. The lowest aggregate scores were recorded in 2012 while the highest was recorded in 2014 at 60 points. At a regional level, Land services in Uganda featured as one of the top ten most bribery prone sectors in three out of the five years.
At individual indicator level, prevalence and impact also recorded a mixed outlook as the likelihood of encountering bribery decreased while the impact of bribery and the share of bribe increased.
0%
10%
20%
30%
40%
50%
60%
Y2010 Y2011 Y2012 Y2013 Y2014
Likelihood
Prevalence
Impact
Share of nationalbribe
Figure 65: Various indicators – Uganda Land services
The average size of bribe also registered an erratic pattern with amounts changing drastically between 2010 and 2011 then again between 2013 and 2014. At the regional level, average size of bribe at this service was highest in Uganda, closely followed by Kenya.

58 | .......................................................................................................THE EAST AFRICAN BRIBERY INDEX TRENDS ANALYSIS (2010-2014)
Table 31: Average size of bribe – Lands service –Uganda
Corruption in the lands sub-sector has intensified recently because of pre-existing gaps within the sector that have not been addressed in a long time.
Challenges of inadequate qualified and skilled staff, inadequate equipment and tools and an overall lack in the technical skills to manage the land registry, district land boards, and land valuation. Records have, until 2013, been manually handled and are rundown with limited use of statistics in management and decision-making.
Further still, are the existence of conflicting mandates and a lack of coordination within the sector.58 There are many delay tactics that frustrate the efforts of people seeking assistance of government offices. Findings from the EABI 2014 indicates that Land has become a highly sought after commodity within the past year.
In order to address outstanding issues within the land sub-sector, a National Land Policy (NLP) was drafted to guide the legal reforms in the land sector. It was developed through an internal consultative process between government and the Civil Society. The NLP supports the registration of land rights under customary tenure and contains a number of important reform proposals to promote gender equality with regard to land rights and inheritance of land. The Policy includes also measures geared at rationalizing and streamlining the land dispute resolution structures. It also recognizes the role of customary institutions in making rules that govern land, resolving disputes and protecting land rights59. Reinforcement of customary institutions has not been without challenges as it is argued that this has created ambiguities that are setting the ground for land-grabbing practices.
In a bid to address some of the issues in the lands sub sector, the government through funding from World Bank embarked on a process of digitizing land tittles in the ministry of lands housing and urban planning. Further, the Ministry of Lands has developed and disseminated simplified versions of its client’s charter. The charter includes the process of getting a land title as well as avenues through which citizens can raise complaints on service delivery in the Ministry.
The Government of Uganda has also recently proposed amendments to Article 26 of the Constitution that would alter the way in which land is appropriated by the government. The amendment is touted as an attempt to promote foreign investment into the country by legalizing compulsory acquisition of land in given strategic areas. The government has claimed that safeguards will be put in place to ensure fair and adequate reparation prior to the acquisition of land. However, due to rampant corruption already noted in the sector, the efficacy of such safeguards is doubtful. This amendment has the capacity to hugely impact processes of good governance in Uganda by disenfranchising local populations to the fundamental rights to the ownership of their land.
58 MLHUD strategic plan 2013/14 -2017/1859 Zevenbergen and al., 2012
Indicator/Year 2010 2011 2012 2013 2014
Average size of bribe(UGX) 133,055 1,375,833 235,250 218,721 550,112
Average size of bribe(USD) 40 410 70 65 164

58 | .......................................................................................................THE EAST AFRICAN BRIBERY INDEX TRENDS ANALYSIS (2010-2014) THE EAST AFRICAN BRIBERY INDEX TRENDS ANALYSIS (2010-2014)........................................................................................ | 59
THE POLICE
71
81
85
60
84
Y2010 Y2011 Y2012 Y2013 Y2014
Figure 66: Aggregate score trends – Uganda Police
During the period under review, the aggregate score increased from 71 points in 2010 to 84 points in 2014. However it can be noted that the latest score was a significant rise from the score in 2013.At the regional level, Uganda police was ranked as the most bribery prone institution in three of the five years under the review. Further, they had the highest aggregate score recorded during the survey (85 points).
The share of total bribes reported to have been paid to the institution doubled from 12% to 24% while there was a decline recorded in the likelihood of encountering bribery.
0%
20%
40%
60%
80%
Y2010 Y2011 Y2012 Y2013 Y2014
Likelihood
Prevalence
Impact
Share of nationalbribe
Figure 67: Various indicator trends – Uganda police
The average size of bribe recorded a steady increase during the period under review. The amount recorded in 2014 was almost double the amount recorded in 2010.
60
Table 32: Average size of bribe – Uganda Police
60. 1 USD = 3355 UGX
Indicator/Year 2010 2011 2012 2013 2014
Average size of bribe(UGX) 56,246 94,825 105,512 89,905 108,746
Average size of bribe(USD) 17 28 31 27 32
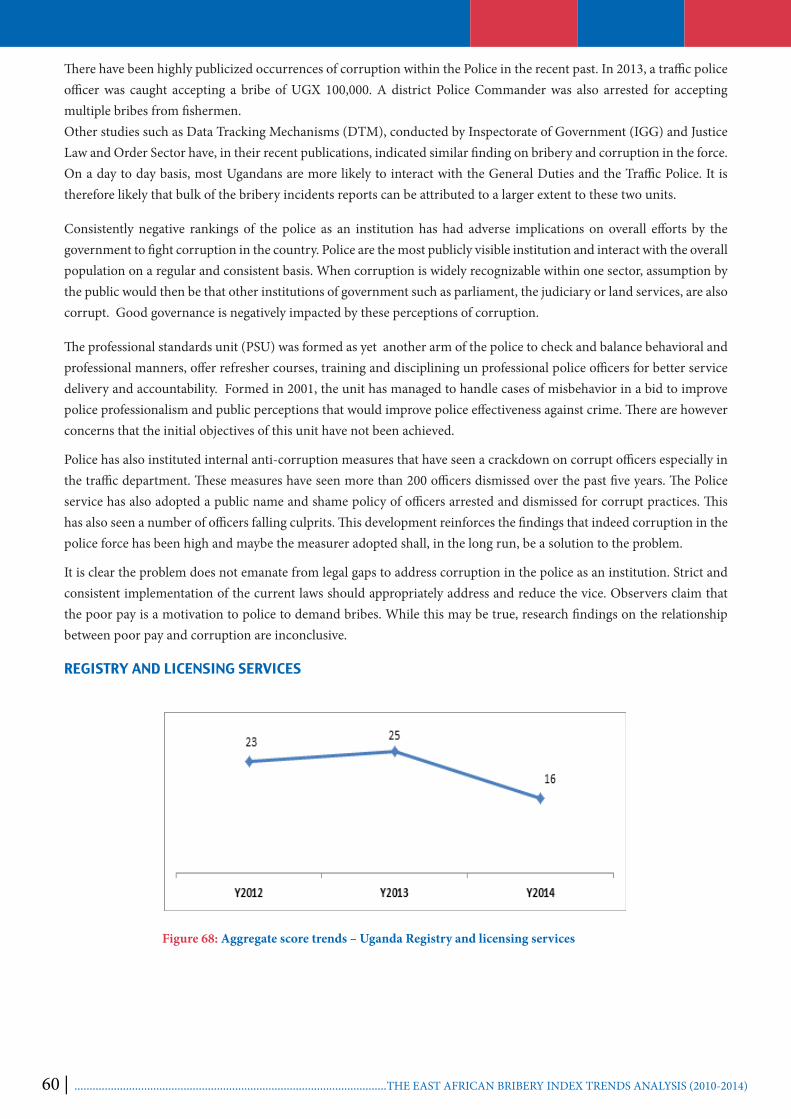
60 | .......................................................................................................THE EAST AFRICAN BRIBERY INDEX TRENDS ANALYSIS (2010-2014)
There have been highly publicized occurrences of corruption within the Police in the recent past. In 2013, a traffic police officer was caught accepting a bribe of UGX 100,000. A district Police Commander was also arrested for accepting multiple bribes from fishermen. Other studies such as Data Tracking Mechanisms (DTM), conducted by Inspectorate of Government (IGG) and Justice Law and Order Sector have, in their recent publications, indicated similar finding on bribery and corruption in the force. On a day to day basis, most Ugandans are more likely to interact with the General Duties and the Traffic Police. It is therefore likely that bulk of the bribery incidents reports can be attributed to a larger extent to these two units.
Consistently negative rankings of the police as an institution has had adverse implications on overall efforts by the government to fight corruption in the country. Police are the most publicly visible institution and interact with the overall population on a regular and consistent basis. When corruption is widely recognizable within one sector, assumption by the public would then be that other institutions of government such as parliament, the judiciary or land services, are also corrupt. Good governance is negatively impacted by these perceptions of corruption.
The professional standards unit (PSU) was formed as yet another arm of the police to check and balance behavioral and professional manners, offer refresher courses, training and disciplining un professional police officers for better service delivery and accountability. Formed in 2001, the unit has managed to handle cases of misbehavior in a bid to improve police professionalism and public perceptions that would improve police effectiveness against crime. There are however concerns that the initial objectives of this unit have not been achieved.
Police has also instituted internal anti-corruption measures that have seen a crackdown on corrupt officers especially in the traffic department. These measures have seen more than 200 officers dismissed over the past five years. The Police service has also adopted a public name and shame policy of officers arrested and dismissed for corrupt practices. This has also seen a number of officers falling culprits. This development reinforces the findings that indeed corruption in the police force has been high and maybe the measurer adopted shall, in the long run, be a solution to the problem.
It is clear the problem does not emanate from legal gaps to address corruption in the police as an institution. Strict and consistent implementation of the current laws should appropriately address and reduce the vice. Observers claim that the poor pay is a motivation to police to demand bribes. While this may be true, research findings on the relationship between poor pay and corruption are inconclusive.
REGISTRY AND LICENSING SERVICES
Figure 68: Aggregate score trends – Uganda Registry and licensing services
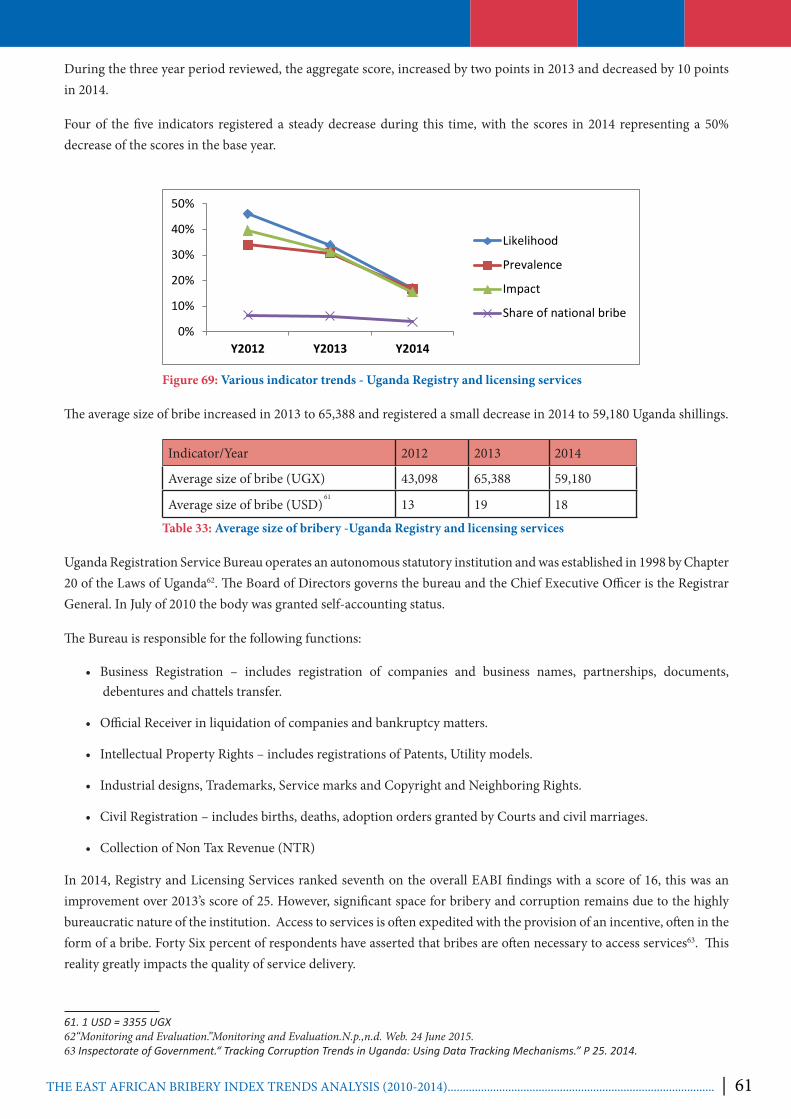
60 | .......................................................................................................THE EAST AFRICAN BRIBERY INDEX TRENDS ANALYSIS (2010-2014) THE EAST AFRICAN BRIBERY INDEX TRENDS ANALYSIS (2010-2014)........................................................................................ | 61
During the three year period reviewed, the aggregate score, increased by two points in 2013 and decreased by 10 points in 2014.
Four of the five indicators registered a steady decrease during this time, with the scores in 2014 representing a 50% decrease of the scores in the base year.
Figure 69: Various indicator trends - Uganda Registry and licensing services
The average size of bribe increased in 2013 to 65,388 and registered a small decrease in 2014 to 59,180 Uganda shillings.
61
Table 33: Average size of bribery -Uganda Registry and licensing services
Uganda Registration Service Bureau operates an autonomous statutory institution and was established in 1998 by Chapter 20 of the Laws of Uganda62. The Board of Directors governs the bureau and the Chief Executive Officer is the Registrar General. In July of 2010 the body was granted self-accounting status.
The Bureau is responsible for the following functions:
• Business Registration – includes registration of companies and business names, partnerships, documents, debentures and chattels transfer.
• Official Receiver in liquidation of companies and bankruptcy matters.
• Intellectual Property Rights – includes registrations of Patents, Utility models.
• Industrial designs, Trademarks, Service marks and Copyright and Neighboring Rights.
• Civil Registration – includes births, deaths, adoption orders granted by Courts and civil marriages.
• Collection of Non Tax Revenue (NTR)
In 2014, Registry and Licensing Services ranked seventh on the overall EABI findings with a score of 16, this was an improvement over 2013’s score of 25. However, significant space for bribery and corruption remains due to the highly bureaucratic nature of the institution. Access to services is often expedited with the provision of an incentive, often in the form of a bribe. Forty Six percent of respondents have asserted that bribes are often necessary to access services63. This reality greatly impacts the quality of service delivery.
61. 1 USD = 3355 UGX62“Monitoring and Evaluation.”Monitoring and Evaluation.N.p.,n.d. Web. 24 June 2015.63 Inspectorate of Government.“ Tracking Corruption Trends in Uganda: Using Data Tracking Mechanisms.” P 25. 2014.
Indicator/Year 2012 2013 2014
Average size of bribe (UGX) 43,098 65,388 59,180
Average size of bribe (USD) 13 19 18
0%
10%
20%
30%
40%
50%
Y2012 Y2013 Y2014
Likelihood
Prevalence
Impact
Share of national bribe
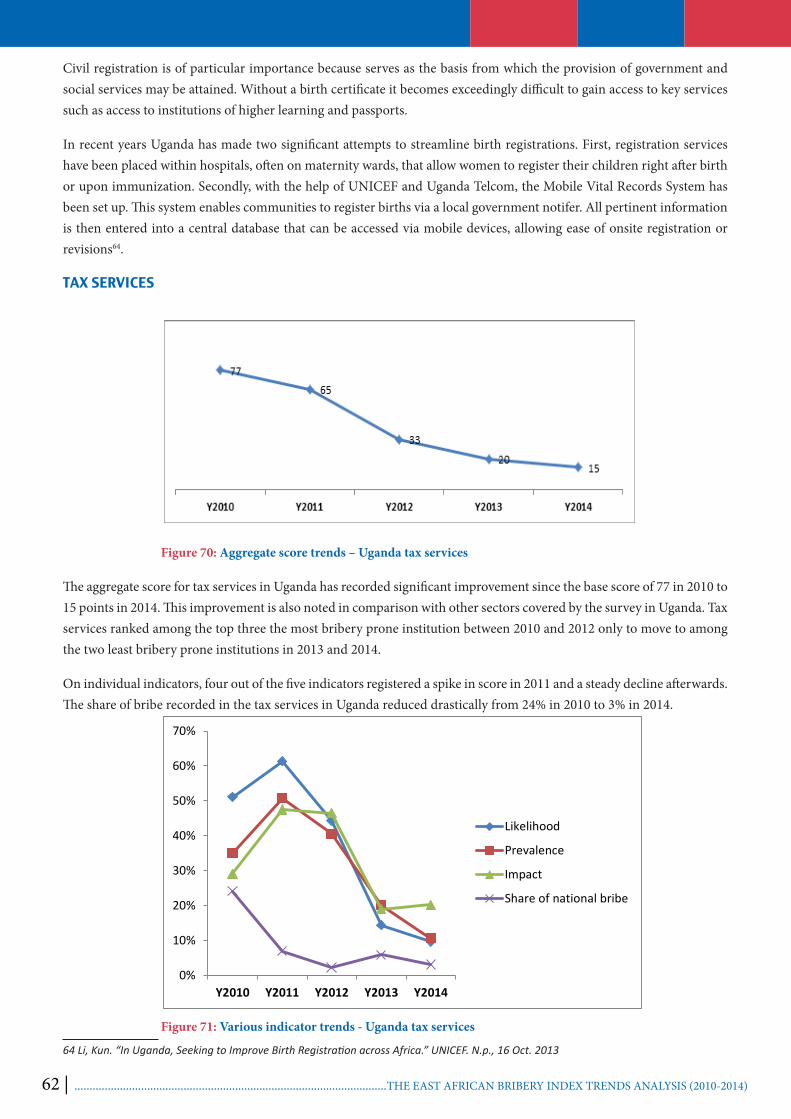
62 | .......................................................................................................THE EAST AFRICAN BRIBERY INDEX TRENDS ANALYSIS (2010-2014)
Civil registration is of particular importance because serves as the basis from which the provision of government and social services may be attained. Without a birth certificate it becomes exceedingly difficult to gain access to key services such as access to institutions of higher learning and passports.
In recent years Uganda has made two significant attempts to streamline birth registrations. First, registration services have been placed within hospitals, often on maternity wards, that allow women to register their children right after birth or upon immunization. Secondly, with the help of UNICEF and Uganda Telcom, the Mobile Vital Records System has been set up. This system enables communities to register births via a local government notifer. All pertinent information is then entered into a central database that can be accessed via mobile devices, allowing ease of onsite registration or revisions64.
TAX SERVICES
Figure 70: Aggregate score trends – Uganda tax services
The aggregate score for tax services in Uganda has recorded significant improvement since the base score of 77 in 2010 to 15 points in 2014. This improvement is also noted in comparison with other sectors covered by the survey in Uganda. Tax services ranked among the top three the most bribery prone institution between 2010 and 2012 only to move to among the two least bribery prone institutions in 2013 and 2014.
On individual indicators, four out of the five indicators registered a spike in score in 2011 and a steady decline afterwards. The share of bribe recorded in the tax services in Uganda reduced drastically from 24% in 2010 to 3% in 2014.
Figure 71: Various indicator trends - Uganda tax services
64 Li, Kun. “In Uganda, Seeking to Improve Birth Registration across Africa.” UNICEF. N.p., 16 Oct. 2013
0%
10%
20%
30%
40%
50%
60%
70%
Y2010 Y2011 Y2012 Y2013 Y2014
Likelihood
Prevalence
Impact
Share of national bribe

62 | .......................................................................................................THE EAST AFRICAN BRIBERY INDEX TRENDS ANALYSIS (2010-2014) THE EAST AFRICAN BRIBERY INDEX TRENDS ANALYSIS (2010-2014)........................................................................................ | 63
The average size of bribe decreased from 1,102,987 Uganda Shillings to 242,344 Uganda shillings, with the lowest figure recorded during the period under review was in 2012 at 115,500 Uganda Shillings.
65
Table 34: Average size if bribe - Uganda tax services
The Uganda Revenue Authority Statute established the Uganda Revenue Authority (URA) in 1991, effectively establishing the URA as the central body for the assessment and collection of specified revenue. The URA is also charged with the administration and enforcement of all laws pertaining to revenue and its related matters66. Through the amalgamation of all three tax administration departments the URA attempted to streamline the process of tax collection for the government. This has had mixed results.
Governance within the Tax Sector has improved following the 2013 scandal in which the Auditor General unearthed evidence of tax evasion, fraud and unexplained payments that led to the misappropriation of billions of shillings. The report by the AG found that officials had paid out an estimated 12.9 million Uganda shillings to ghost suppliers of different goods and services. In addition, the same report exposed that 69.8 million shillings were lost due to fraud of different URA accounts67.This exposure motivated some efforts to strengthen governance practices. These include the establishment of an internal integrity department headed by a Commissioner and a manager who reports to the commissioner. The department is charged with receiving complains, investigating and refer of cases for prosecution. This initiative has helped to minimize corruption in URA.
The Anti-Money Laundering Act of 2013 was conceptualized to “provide for the prohibition and prevention of money laundering, the establishment of a Financial Intelligence Authority and a Financial Intelligence Authority Board in order to combat money laundering activities”68. The process aims at constructing a framework within which certain criteria may be imposed on financial institutions and the crime of laundering may be properly adjudicated. In addition, the Public Finance Management Act 2015, will provide for fiscal and macroeconomic management, the Charter of Fiscal Responsibility and the Budget Framework Paper. The new legislation also revitalizes and appeals the Public Finance and Accountability act of 2003. It is hoped the different pieces of legislation will support further entrenchment of improved governance.
Reasons for paying bribesA large proportion of respondents In Uganda felt that the only way to access the service they were seeking was to pay a bribe. The only other country in the region with respondents who had a similar reason was Kenya in 2014. The most common reason for paying bribes across the region was it was to hasten the service69.
Table 35: Reason for paying bribes - Uganda
65 1 USD = 3355 UGX 66 “Monitoring and Evaluation.”Monitoring and Evaluation.N.p.,n.d. Web. 24 June 2015.67 Mugerwa, Yasiin. “AG Unearths Graft at URA.” - National. Daily Monitor, 10 Apr. 2014.68 “Money Laundering Act.” 2014. 69 See Annex 4 Reason for paying bribes
Indicator/Year 2010 2011 2012 2013 2014
Average size of bribe(UGX) 1,102,987 213,615 115,500 272,288 242,344
Average size of bribe(USD) 329 64 34 81 72
Year Reason for paying bribes Percentage2012 It was the only way to access service 39%
2013 It was the only way to access service 38%
2014 It was the only way to access service 46%

64 | .......................................................................................................THE EAST AFRICAN BRIBERY INDEX TRENDS ANALYSIS (2010-2014)
PERCEPTION OF CORRUPTION
Perceived levels of corruption
Negative perceptions on the level of corruption rose across the period by almost 40 percentage points. At the same time, the proportion that perceived Uganda to have low corruption levels fell from 11% in 2010 to 4% in 2014. The consistent fall in the proportion that perceived corruption levels to be medium and the corresponding rise in those who termed it as high is indications of growing believe that the situation is getting worse.
Figure 70: Perceived levels of corruption – Uganda
The persistent increase perception on the level of corruption shows an indication of loss of people’s trust to the government commitment to fight corruption. This period registered numerous scandals that involved embezzlement of public resources by government officials. There have been allegations of embezzlement of funds amounting to billions of Uganda shillings earmarked for various government projects such as issuance of Identity cards, a pension scheme and bicycles for Local councils among others. All these with limited action from government to investigate, persecute and recover the monies have largely contributed to increasing people’s negative perception towards government commitment to fight corruption hence justifying the increasing trends from 2010-2014.
Perceived change in corruption levels
There has been an almost steady level of perception on the projected change on corruption levels across the years. Around a half of the respondents have predicted an rise in corruption levels across the five years while about a 20% have consistently perceived the situation as likely to improve. When the proportion that predicted the levels of corruption to remain the same is factored, the proportion that predicted that the level of corruption was to remain the same or rise in the subsequent year was more than 70% across all the years.

64 | .......................................................................................................THE EAST AFRICAN BRIBERY INDEX TRENDS ANALYSIS (2010-2014) THE EAST AFRICAN BRIBERY INDEX TRENDS ANALYSIS (2010-2014)........................................................................................ | 65
53%
66%
53%
57%
61%
19%
11%
14%
19%
17%
20%
13%
19%
15%
12%
8%
11%
14%
10%
10%
Y2010
Y2011
Y2012
Y2013
Y2014
Increase
Decrease
Remain the same
Unsure
Figure 71: perceived change in corruption levels – Uganda
The predication by the half of the respondents that corruption will increase is as a result of government failure to implement the robust legislation and the fact that some officials implicated in major scandals have escaped with no action taken.
The other critical aspect that would justify increase is societal acceptance of corruption apparent tolerance of the vice by the population. This is perpetuated by their failure to understand the negative impact of corruption to the economy which directly affects service delivery.
Perception of government efforts to fight corruption
On average about a third of the respondents perceive Uganda government’s effort to fight corruption as enough. Within the same period about 60% of the respondents gave a negative evaluation on the perceived commitment.
There have been notable attempts by government in the last 5 years to fight corruption and can be seen from numerous amendment of the laws like amendment of anti-corruption act, strengthening of anti-corruption institutions, establishment of anti-corruption court, prosecution of implicated government officials, the establishment of Inter Agency Forum charged with the main functions of coordination of national efforts against corruption and mainstreaming ethics and integrity in public service.
The above measures have however not managed to convince the public of the Government’s commitment to fight corruption.
It is worth mentioning that though Uganda has a comprehensive anti-corruption framework that includes comprehensive legislation and institutions, there are challenges in implementation. Such challenges arise from high staff turnover, understaffing, overlapping mandates, inadequate funding and political interference. The result is compromised action against corruption that informs the poor perceptions.
Recommendations
1. There is need for the government to invest more on Civic education on anti-corruption laws and the role of citizens in observing them.
2. Establishment and strengthening of the internal integrity departments across key government institution should be pursued.

66 | .......................................................................................................THE EAST AFRICAN BRIBERY INDEX TRENDS ANALYSIS (2010-2014)
3. Government should work towards improving the welfare of the civil service to minimize the temptations of soliciting and receiving bribes.
4. There is limited provision in the anti-corruption Act 2009 to prosecute both the bribe giver and receiver but this has not been implemented. Need for government to strengthen this clause to make the two parties punishable of the offense.
5. The Government should embrace a multi- sectoral approach to the fight against corruption and this can be implemented through complementing the various stakeholder’s efforts.
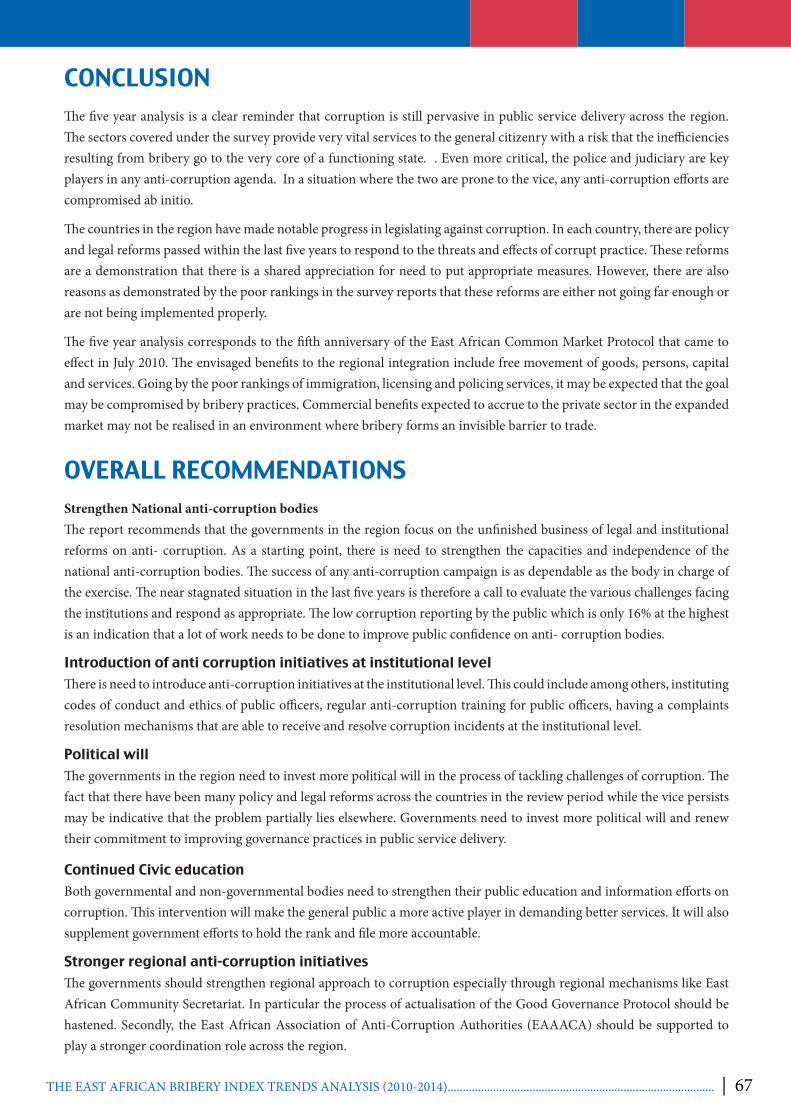
66 | .......................................................................................................THE EAST AFRICAN BRIBERY INDEX TRENDS ANALYSIS (2010-2014) THE EAST AFRICAN BRIBERY INDEX TRENDS ANALYSIS (2010-2014)........................................................................................ | 67
CONCLUSION The five year analysis is a clear reminder that corruption is still pervasive in public service delivery across the region. The sectors covered under the survey provide very vital services to the general citizenry with a risk that the inefficiencies resulting from bribery go to the very core of a functioning state. . Even more critical, the police and judiciary are key players in any anti-corruption agenda. In a situation where the two are prone to the vice, any anti-corruption efforts are compromised ab initio.
The countries in the region have made notable progress in legislating against corruption. In each country, there are policy and legal reforms passed within the last five years to respond to the threats and effects of corrupt practice. These reforms are a demonstration that there is a shared appreciation for need to put appropriate measures. However, there are also reasons as demonstrated by the poor rankings in the survey reports that these reforms are either not going far enough or are not being implemented properly.
The five year analysis corresponds to the fifth anniversary of the East African Common Market Protocol that came to effect in July 2010. The envisaged benefits to the regional integration include free movement of goods, persons, capital and services. Going by the poor rankings of immigration, licensing and policing services, it may be expected that the goal may be compromised by bribery practices. Commercial benefits expected to accrue to the private sector in the expanded market may not be realised in an environment where bribery forms an invisible barrier to trade.
OVERALL RECOMMENDATIONS Strengthen National anti-corruption bodies The report recommends that the governments in the region focus on the unfinished business of legal and institutional reforms on anti- corruption. As a starting point, there is need to strengthen the capacities and independence of the national anti-corruption bodies. The success of any anti-corruption campaign is as dependable as the body in charge of the exercise. The near stagnated situation in the last five years is therefore a call to evaluate the various challenges facing the institutions and respond as appropriate. The low corruption reporting by the public which is only 16% at the highest is an indication that a lot of work needs to be done to improve public confidence on anti- corruption bodies.
Introduction of anti corruption initiatives at institutional level There is need to introduce anti-corruption initiatives at the institutional level. This could include among others, instituting codes of conduct and ethics of public officers, regular anti-corruption training for public officers, having a complaints resolution mechanisms that are able to receive and resolve corruption incidents at the institutional level.
Political willThe governments in the region need to invest more political will in the process of tackling challenges of corruption. The fact that there have been many policy and legal reforms across the countries in the review period while the vice persists may be indicative that the problem partially lies elsewhere. Governments need to invest more political will and renew their commitment to improving governance practices in public service delivery.
Continued Civic education Both governmental and non-governmental bodies need to strengthen their public education and information efforts on corruption. This intervention will make the general public a more active player in demanding better services. It will also supplement government efforts to hold the rank and file more accountable.
Stronger regional anti-corruption initiatives The governments should strengthen regional approach to corruption especially through regional mechanisms like East African Community Secretariat. In particular the process of actualisation of the Good Governance Protocol should be hastened. Secondly, the East African Association of Anti-Corruption Authorities (EAAACA) should be supported to play a stronger coordination role across the region.
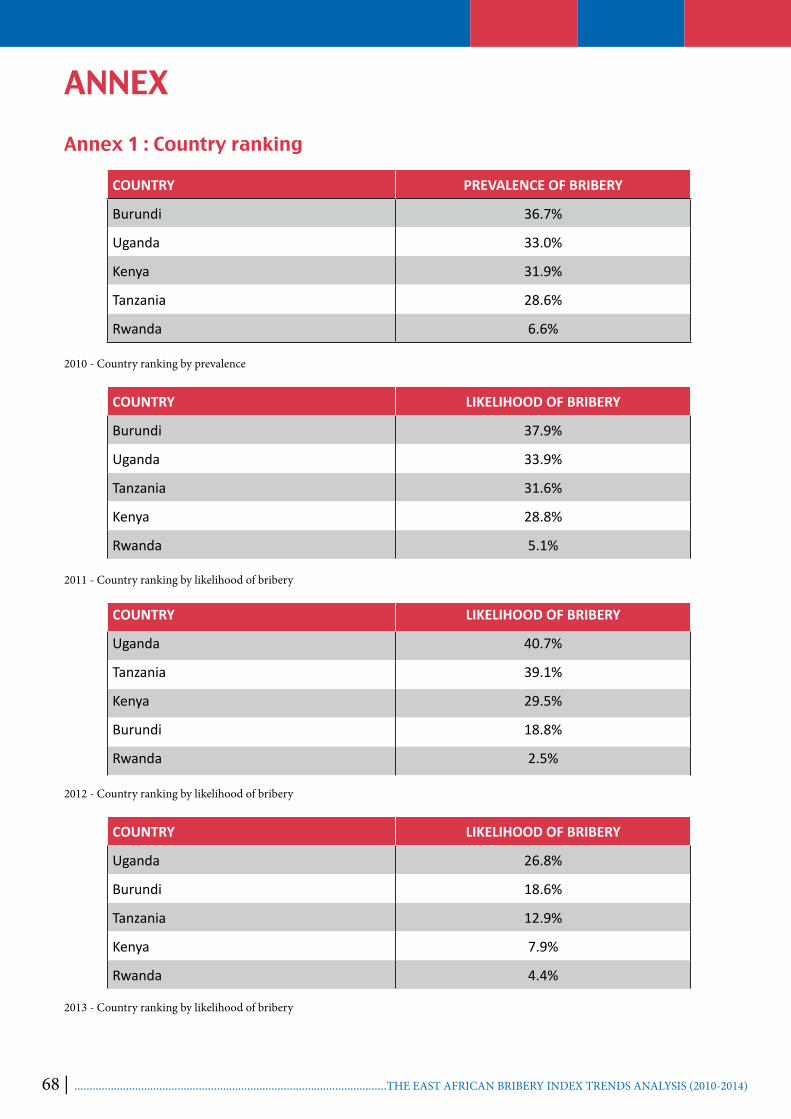
68 | .......................................................................................................THE EAST AFRICAN BRIBERY INDEX TRENDS ANALYSIS (2010-2014)
Annex 1 : Country ranking
COUNTRY PREVALENCE OF BRIBERY
Burundi 36.7%
Uganda 33.0%
Kenya 31.9%
Tanzania 28.6%
Rwanda 6.6%
2010 - Country ranking by prevalence
COUNTRY LIKELIHOOD OF BRIBERY
Burundi 37.9%
Uganda 33.9%
Tanzania 31.6%
Kenya 28.8%
Rwanda 5.1%
2011 - Country ranking by likelihood of bribery
COUNTRY LIKELIHOOD OF BRIBERY
Uganda 40.7%
Tanzania 39.1%
Kenya 29.5%
Burundi 18.8%
Rwanda 2.5%
2012 - Country ranking by likelihood of bribery
COUNTRY LIKELIHOOD OF BRIBERY
Uganda 26.8%
Burundi 18.6%
Tanzania 12.9%
Kenya 7.9%
Rwanda 4.4%
2013 - Country ranking by likelihood of bribery
ANNEX

68 | .......................................................................................................THE EAST AFRICAN BRIBERY INDEX TRENDS ANALYSIS (2010-2014) THE EAST AFRICAN BRIBERY INDEX TRENDS ANALYSIS (2010-2014)........................................................................................ | 69
COUNTRY LIKELIHOOD OF BRIBERY
Burundi 19.4%
Tanzania 19.0%
Uganda 17.9%
Kenya 12.3%
Rwanda 2.9%
2014 - Country ranking by likelihood of bribery
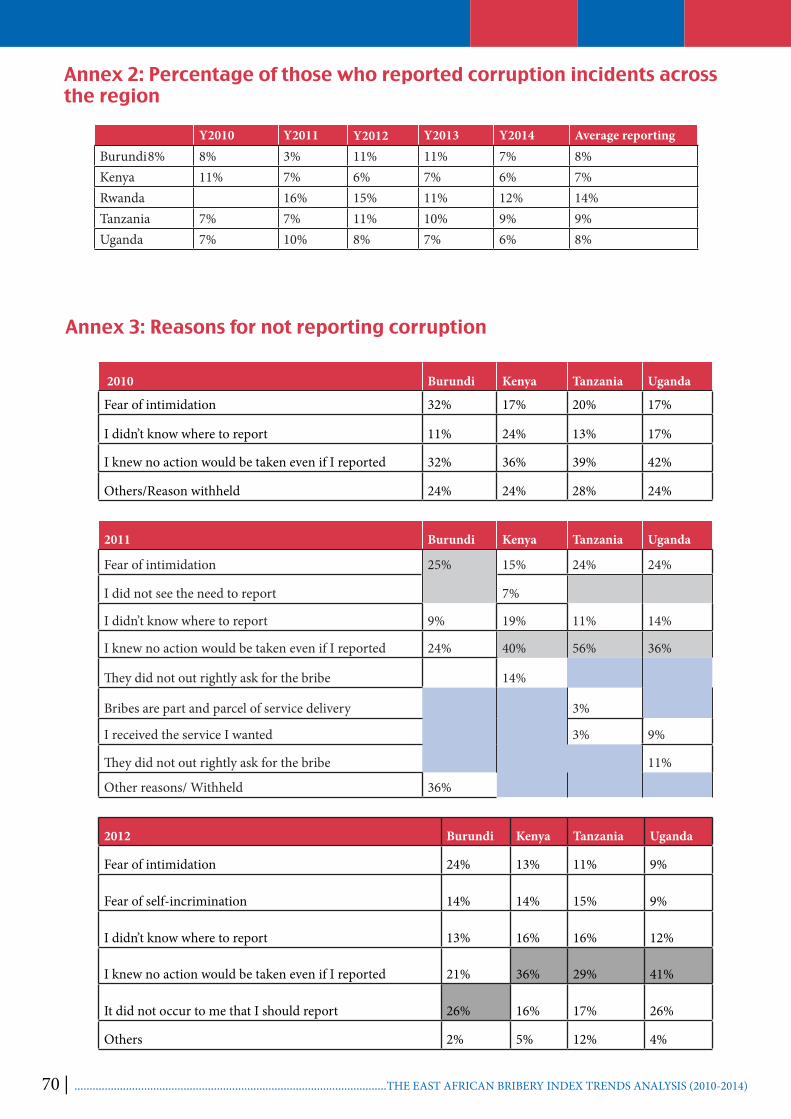
70 | .......................................................................................................THE EAST AFRICAN BRIBERY INDEX TRENDS ANALYSIS (2010-2014)
Annex 2: Percentage of those who reported corruption incidents across the region
Y2010 Y2011 Y2012 Y2013 Y2014 Average reportingBurundi 8% 8% 3% 11% 11% 7% 8%Kenya 11% 7% 6% 7% 6% 7%Rwanda 16% 15% 11% 12% 14%Tanzania 7% 7% 11% 10% 9% 9%Uganda 7% 10% 8% 7% 6% 8%
Annex 3: Reasons for not reporting corruption
2010 Burundi Kenya Tanzania Uganda
Fear of intimidation 32% 17% 20% 17%
I didn’t know where to report 11% 24% 13% 17%
I knew no action would be taken even if I reported 32% 36% 39% 42%
Others/Reason withheld 24% 24% 28% 24%
2011 Burundi Kenya Tanzania Uganda
Fear of intimidation 25% 15% 24% 24%
I did not see the need to report 7%
I didn’t know where to report 9% 19% 11% 14%
I knew no action would be taken even if I reported 24% 40% 56% 36%
They did not out rightly ask for the bribe 14%
Bribes are part and parcel of service delivery 3%
I received the service I wanted 3% 9%
They did not out rightly ask for the bribe 11%
Other reasons/ Withheld 36%
2012 Burundi Kenya Tanzania Uganda
Fear of intimidation 24% 13% 11% 9%
Fear of self-incrimination 14% 14% 15% 9%
I didn’t know where to report 13% 16% 16% 12%
I knew no action would be taken even if I reported 21% 36% 29% 41%
It did not occur to me that I should report 26% 16% 17% 26%
Others 2% 5% 12% 4%
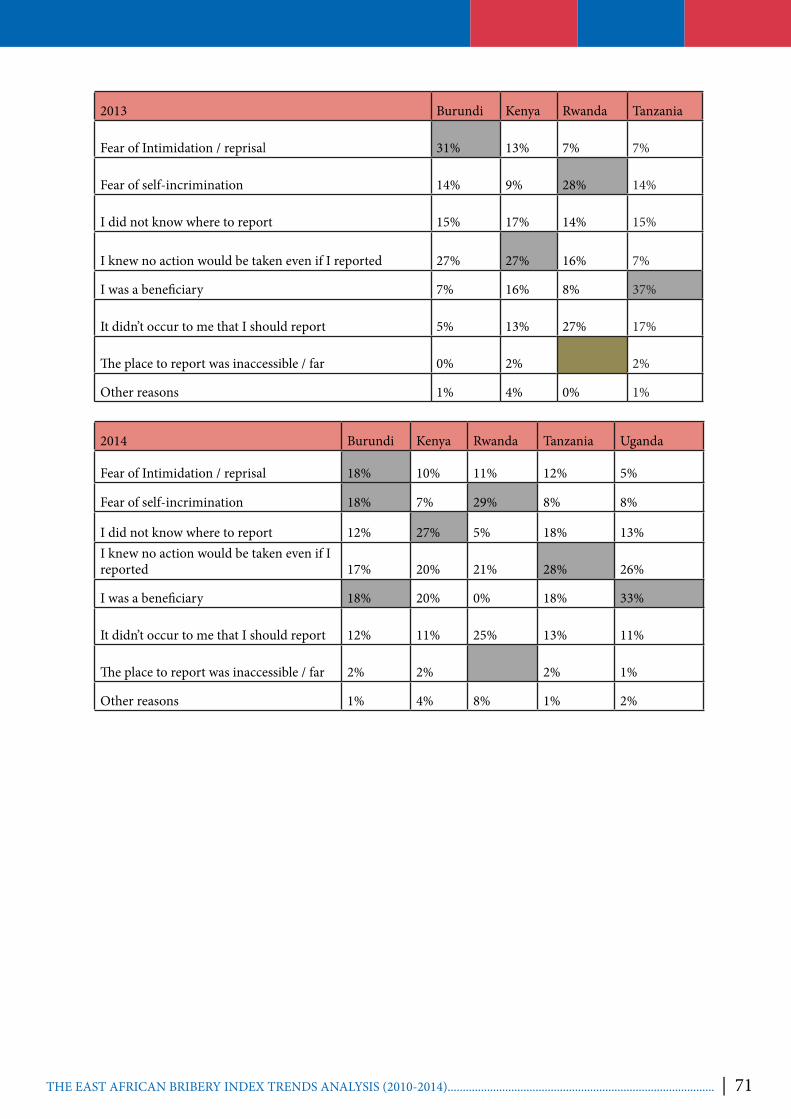
70 | .......................................................................................................THE EAST AFRICAN BRIBERY INDEX TRENDS ANALYSIS (2010-2014) THE EAST AFRICAN BRIBERY INDEX TRENDS ANALYSIS (2010-2014)........................................................................................ | 71
2013 Burundi Kenya Rwanda Tanzania
Fear of Intimidation / reprisal 31% 13% 7% 7%
Fear of self-incrimination 14% 9% 28% 14%
I did not know where to report 15% 17% 14% 15%
I knew no action would be taken even if I reported 27% 27% 16% 7%
I was a beneficiary 7% 16% 8% 37%
It didn’t occur to me that I should report 5% 13% 27% 17%
The place to report was inaccessible / far 0% 2% 2%
Other reasons 1% 4% 0% 1%
2014 Burundi Kenya Rwanda Tanzania Uganda
Fear of Intimidation / reprisal 18% 10% 11% 12% 5%
Fear of self-incrimination 18% 7% 29% 8% 8%
I did not know where to report 12% 27% 5% 18% 13%I knew no action would be taken even if I reported 17% 20% 21% 28% 26%
I was a beneficiary 18% 20% 0% 18% 33%
It didn’t occur to me that I should report 12% 11% 25% 13% 11%
The place to report was inaccessible / far 2% 2% 2% 1%
Other reasons 1% 4% 8% 1% 2%

72 | .......................................................................................................THE EAST AFRICAN BRIBERY INDEX TRENDS ANALYSIS (2010-2014)
Annex 4: Reason for paying bribes
2012 BR KE RW TZ UG
It was the only way to access service 58% 32% 23% 41% 39%
To access a service I did not legally deserve 7% 2% 5% 4% 4%
To avoid paying full cost of service 5% 7% 8% 7% 14%
To avoid problems with authorities 10% 20% 20% 10% 15%
To get the service at any cost 16%
To hasten up service 38% 38% 38% 26%
2013 BR KE RW TZ UG
It was expected 31% 11% 24% 7% 11%
To hasten up service 27% 36% 8% 35% 30%
It was the only way to access service 25% 26% 6% 33% 38%
To access a service I did not legally deserve 7% 3% 36% 5% 5%
To avoid paying full cost of service 5% 5% 13% 6% 6%
To avoid problems with authorities 4% 18% 1% 13% 8%
2014 BR KE RW TZ UG
It was expected 15% 4% 0 4% 7%
It was the only way to access service 25% 38% 27% 36% 46%
To access a service I did not legally deserve 7% 5% 15% 5% 5%
To avoid paying full cost of service 3% 5% 11% 6% 5%
To avoid problems with authorities 4% 17% 13% 11% 6%
To hasten up service 44% 31% 32% 38% 27%

72 | .......................................................................................................THE EAST AFRICAN BRIBERY INDEX TRENDS ANALYSIS (2010-2014) THE EAST AFRICAN BRIBERY INDEX TRENDS ANALYSIS (2010-2014)........................................................................................ | 73
Annex 5 : Reason for paying bribes
2012 BR KE RW TZ UG
It was the only way to access service 58% 32% 23% 41% 39%
To access a service I did not legally deserve 7% 2% 5% 4% 4%
To avoid paying full cost of service 5% 7% 8% 7% 14%
To avoid problems with authorities 10% 20% 20% 10% 15%
To get the service at any cost 16%
To hasten up service 38% 38% 38% 26%
2013 BR KE RW TZ UG
It was expected 31% 11% 24% 7% 11%
It was the only way to access service 25% 26% 6% 33% 38%
To access a service I did not legally deserve 7% 3% 36% 5% 5%
To avoid paying full cost of service 5% 5% 13% 6% 6%
To avoid problems with authorities 4% 18% 1% 13% 8%
To hasten up service 27% 36% 8% 35% 30%
2014 BR KE RW TZ UG
It was expected 15% 4% 4% 7%
It was the only way to access service 25% 38% 27% 36% 46%
To access a service I did not legally deserve 7% 5% 15% 5% 5%
To avoid paying full cost of service 3% 5% 11% 6% 5%
To avoid problems with authorities 4% 17% 13% 11% 6%
To hasten up service 44% 31% 32% 38% 27%
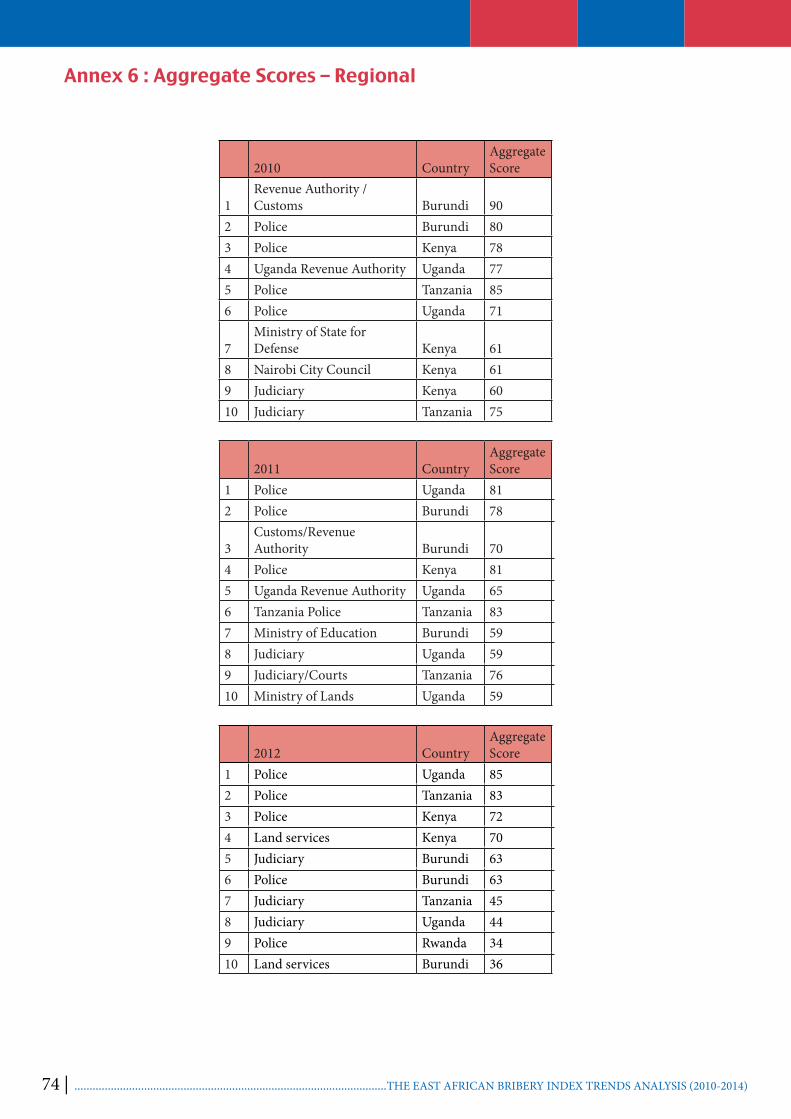
74 | .......................................................................................................THE EAST AFRICAN BRIBERY INDEX TRENDS ANALYSIS (2010-2014)
Annex 6 : Aggregate Scores – Regional
2010 CountryAggregate Score
1Revenue Authority /Customs Burundi 90
2 Police Burundi 803 Police Kenya 784 Uganda Revenue Authority Uganda 775 Police Tanzania 856 Police Uganda 71
7Ministry of State for Defense Kenya 61
8 Nairobi City Council Kenya 619 Judiciary Kenya 6010 Judiciary Tanzania 75
2011 CountryAggregate Score
1 Police Uganda 812 Police Burundi 78
3Customs/Revenue Authority Burundi 70
4 Police Kenya 815 Uganda Revenue Authority Uganda 656 Tanzania Police Tanzania 837 Ministry of Education Burundi 598 Judiciary Uganda 599 Judiciary/Courts Tanzania 7610 Ministry of Lands Uganda 59
2012 CountryAggregate Score
1 Police Uganda 852 Police Tanzania 833 Police Kenya 724 Land services Kenya 705 Judiciary Burundi 636 Police Burundi 637 Judiciary Tanzania 458 Judiciary Uganda 449 Police Rwanda 3410 Land services Burundi 36
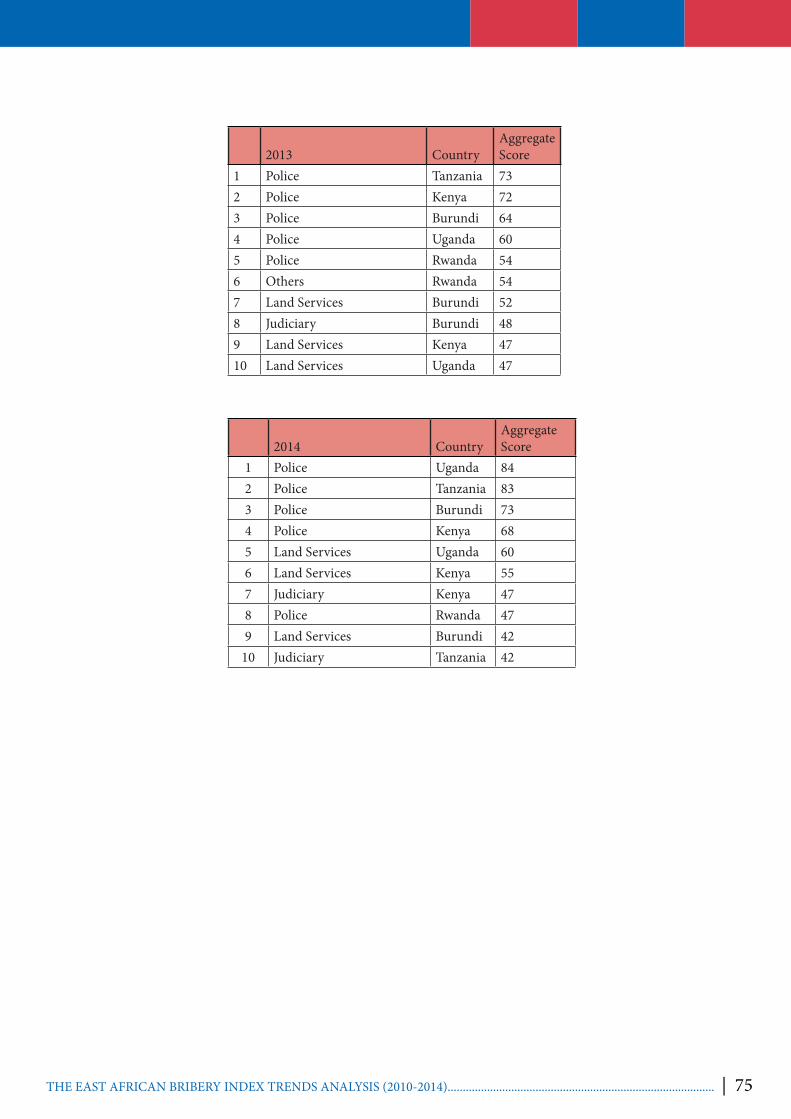
74 | .......................................................................................................THE EAST AFRICAN BRIBERY INDEX TRENDS ANALYSIS (2010-2014) THE EAST AFRICAN BRIBERY INDEX TRENDS ANALYSIS (2010-2014)........................................................................................ | 75
2013 CountryAggregate Score
1 Police Tanzania 732 Police Kenya 723 Police Burundi 644 Police Uganda 605 Police Rwanda 546 Others Rwanda 547 Land Services Burundi 528 Judiciary Burundi 489 Land Services Kenya 4710 Land Services Uganda 47
2014 CountryAggregate Score
1 Police Uganda 842 Police Tanzania 833 Police Burundi 734 Police Kenya 685 Land Services Uganda 606 Land Services Kenya 557 Judiciary Kenya 478 Police Rwanda 479 Land Services Burundi 42
10 Judiciary Tanzania 42

76 | .......................................................................................................THE EAST AFRICAN BRIBERY INDEX TRENDS ANALYSIS (2010-2014)
REFERENCES1. Anti-Corruption Act 2009 Uganda available at- www.ulii.org/.../legislation/act/.../the_anti_corruption_act_
no_6_of_2009
2. Anti-Corruption and Economics Crimes Act Kenya - available at-http://www.kenyalaw.org:8181/exist/kenyalex/actview.xql?actid=CAP. 65
3. East African Bribery Index reports (2010-2014) available at- http://www.tikenya.org/index.php/the-east-african-bribery-index#
4. East African Common Market Protocol- available at- www.eabc.info/uploads/SCMP_Final_High_Resolution_Version_16.pdf
5. East African Community Treaty- available at- https://www.google.com/?gws_rd=ssl#q=east+african+community+treaty
6. Election Expenses Act Tanzania- available at- www.parliament.go.tz/PAMS/docs/6-2010.pdf
7. Public Procurement and Disposal Act Kenya available at-
http://www.kenyalaw.org:8181/exist/kenyalex/actview.xql?actid=CAP. 412A
8. Public Procurement Act Tanzania- Available at- www.ppra.go.tz/.../public-procurement-act/procurement-act-2001?
9. Prevention of and combating of corruption Act Tanzania -available at- www.pccb.go.tz/index.php/about-pccb
10. The Constitution of Kenya 2010
11. Witness Protection Act Kenya - available at- http://www.kenyalaw.org:8181/exist/kenyalex/actview.xql?actid=CAP. 79
12. Whistleblower Protection Act Uganda available- www.ulii.org/content/whistle-blowers-protection-act-2010
13. Country Reports on Human Rights Practices for 2013
14. Edwin Babeiya, Electoral Corruption and the Politics of Election s Financing in Tanzania; Journal of Politics and Law; No. 2; September 2011
15. Legal and Human Rights Center, (2015); Human Rights and Business Report 2014, pg. 2
16. LHRC & ZLSC (2015), Tanzania Human Rights Report 2014. Dar es Salaam
17. Pastoralist Indigenous Non Governmental Organization (Pingo’s Forum), (2014), A fact finding mission report on the land conflict between pastoralist and farmers in Kilindi district, Tanga region
18. REPOA (2014); after more than a decade of fighting corruption, how much progress? : Findings from the Afro Barometer Round 6 Surveys in Tanzania, Dar es Salaam
19. TWAWEZA (2014), Have more laws, agencies and commitments against corruption made a difference?: People’s perceptions of corruption in Tanzania, Brief No. 14, p.5
20. URT (2005), United Republic of Tanzania Constitution, 197; Dar es Salaam, Government Printer
21. World Economic Forum; (2013) Global Competitiveness Report 2013-2014.

76 | .......................................................................................................THE EAST AFRICAN BRIBERY INDEX TRENDS ANALYSIS (2010-2014) THE EAST AFRICAN BRIBERY INDEX TRENDS ANALYSIS (2010-2014)........................................................................................ | 77
INTERNET SOURCES1. Aiko R, Effect of police integrity, government performance in fighting crime, and accessibility of police
stations on reporting of crime in Tanzania, Afro barometer Policy Paper No. 20 | May 2015, available at http://www.repoa.or.tz/highlights/more/effect_of_police_integrity_on_reporting_of_crime_in_tanzania , accessed on 8th September, 2015.
2. Civil registration and vital statistics systems, available at http://www.aho.afro.who.int/profiles_information/index.php/Tanzania:Civil_registration_and_vital_statistics_systems accessed on 9th September, 2015
3. Country Reports on Human Rights Practices for 2013 from http://www.state.gov/j/drl/rls/hrrpt/2013humanrightsreport/index.htm?year=2013&dlid=220169#wrapper accessed on 17th September, 2015
4. http://www.ardhi.go.tz/index.php?option=com_content&view=article&id=190&Itemid=286 accessed on 20 September, 2015.
5. http://www.business-anti-corruption.com/country-profiles/sub-saharan-africa/tanzania/show-all.aspx accessed on 18 September, 2015
6. http://www.hss.de/tanzania/en/partners/tpf.html, accessed on 8th September, 2015
7. http://www.immigration.go.tz/module1.php?id=9 accessed 9th September, 2015
8. http://www.pccb.go.tz/index.php/about-pccb/all-about-the-pccb/historical-background accessed 6th September, 2015
9. http://www.pccb.go.tz/index.php/laws visited on 1st September, 2015.
10. http://www.rita.go.tz/page.php?lang=en&pg=633 accessed on 9th September, 2015
11. httphttp://www.sumatra.or.tz/index.php/about-us/roles-and-functions accessed on 9th September, 2015
12. http://www.weforum.org/reports/global-competitivenessreport- 2013-2014
13. Manyiri Ronald, Graft Scandal in the Ministry of Energy and Minerals, available at http://www.viewpointafrica.com/politics/tanzania/100096/graft-scandal-in-the-ministry-of-energy-and-minerals, accessed 5th September, 2015
14. Paper on “implementation of the open government partnership Concept in tanzania” presented by hon. Celina kombani, minister of State president’s office, public service management Rabat, morocco 10 -11 june, 2013 available at http://www.opengov.go.tz/files/publications/attachments/6KOMBANI_Tanzania_en_sw.pdf accessed 7th September, 2015.
15. Polepole H.; Making the new constitution for Tanzania: challenges and opportunities; available at http://hpolepole.blogspot.com/2015/03/making-new-constitution-for-tanzania.html accessed 2nd September, 2015.
16. Tanzania2013 Investment Climate Statement – Tanzania 2013 Investment Climate Statement Bureau of Economic and Business Affairs March 2013 Report from http://www.state.gov/e/eb/rls/othr/ics/2013/204744.htm accessed on 29th December, 2015
17. The Citizen Newspaper, December 23, 2014, Escrow questions remain as Tibaijuka dropped as minister; from http://www.thecitizen.co.tz/News/national/Escrow-questions-remain-as-Tibaijuka-dropped-as-minister-/-/1840392/2566296/-/k60imf/-/index.html accessed on September 22, 2015.
18. The Citizen Newspaper, Katiba review: Place of integrity in Judiciary, 12th April, 2015, available at http://www.thecitizen.co.tz/News/KATIBA-REVIEW--Place-of-integrity-in-Judiciary/-/1840340/2683168/-/i2mj9p/-/index.html , accesses 7th September, 2015
78 | .......................................................................................................THE EAST AFRICAN BRIBERY INDEX TRENDS ANALYSIS (2010-2014)
19. The Citizen, Kafulila: Table wagons purchase report before July 9, June 27 2015, available at http://www.ippmedia.com/frontend/?l=81711, accessed 29 August, 2015The Citizen, PCCB now features on corruption list, 7th February, 2015, available at http://mobile.thecitizen.co.tz/news/Anti-graft-watchdog-on-list-of-shame--says-study/-/2304482/2615764/-/format/xhtml/-/p7t330z/-/index.html , accessed 7th September, 2015.
20. The Guardian Newspaper, Kikwete signs three integrity pledges, 15th August 2015, available at http://www.ippmedia.com/?l=83329 accessed 3rd September, 2015.
21. TRA steps up anti-graft measures at http://pesatimes.co.tz/news/governance/tra-steps-up-anti-graft-measures/tanzania , accessed 8th September, 2015
78 | .......................................................................................................THE EAST AFRICAN BRIBERY INDEX TRENDS ANALYSIS (2010-2014)
Transparency International KenyaA.C.K Garden House, Wing D1st Ngong Avenue, off Bishop’s RoadP.O.Box 198, 00200 City SquareNairobi, KenyaTel: +254-20-2727763/5, 2730324/5Mobile: 0722-296589, 0733-834659Fax: +254-20-2729530Website: www.tikenya.org
Transparency International - UgandaPlot 3 Martyrs LaneMinisters Village , NtindaP.O. Box 24335, KampalaTel. 256-041- 255 836Fax. 256-041-341546E-mail: [email protected]: www.tiuganda.org
Transparency International RwandaP.O. Box. 6252 Kigali, RwandaTel: +250 (0)2 55111235 / 0788309583E-mail: [email protected]: www.tirwanda.org
Association Burundaise des Consommateurs-Transparency International BurundiBoulevard du 28 novembre, n04611/cCommune GIHOSHA, Quartier Mutanga NordTéléphone : +257 22 23 76 86 ou +257 22 27 34 03 (Numéro gratuit)Email : [email protected]
Concern for Development Initiatives in Africa (ForDIA)P.O. Box 32505,Dar es Salaam -TANZANIATel: +255 784 410 939E-mail: [email protected]/[email protected]: www.fordia.org
The contents of this report are the sole responsibility of Transparency International Kenya and do not necessarily reflect the views of any of the donors who funded the production of the report or their governments