The EarthScope USArray Transportable Array: Results from Large-scale Network Operations Bob...
13
The EarthScope USArray Transportable Array: Results from Large-scale Network Operations Bob Woodward, Bob Busby, Katrin Hafner, and David Simpson Incorporated Research Institutions for Seismology (IRIS) CTBT S&T 2011 Conference June 8-10, 2011 Vienna, Austria
-
Upload
penelope-jones -
Category
Documents
-
view
217 -
download
1
Transcript of The EarthScope USArray Transportable Array: Results from Large-scale Network Operations Bob...

The EarthScope USArray Transportable Array: Results from Large-scale Network Operations
Bob Woodward, Bob Busby, Katrin Hafner, and David SimpsonIncorporated Research Institutions for Seismology(IRIS)
CTBT S&T 2011 ConferenceJune 8-10, 2011Vienna, Austria

Outline
• Describe the Transportable Array (TA)
• Performance of the Transportable Array
• Operational Strategies

The Transportable Array
• Large scale - 450 broadband stations• Transient stations – network configuration changes daily• Large investment – high expectations
1,680 sites
19 sta / month
4.5 Gb / day
$10M / year
Red = current array location
Grey = stations already removed
2011 - 2013

• 400 broadband seismic stations• ~70 km spacing• ~2000 x 1000 km “footprint”• ~2 year deployments at each site• 10 years and 1623 sites to roll
across the country
• Goals• High-quality broadband data• Maximize data return (>85%)• Data in near real time
• 40 and 1 sps continuous
Array & Station Design

TA Performance
Network availability typically exceeds 98%
Station noise highly uniform and quite low for temporary installations

Uniformity of Stations
• Standard vault design• Modular communications• Vault interface enclosure
• Encloses everything but the DAS and seismometer
• Low-power autonomous operation
535A Dale TX
A typical operating TA Station
Station deployment treated as a high-precision manufacturing operation

Multipart Approach to QC
• Array Network Facility (network hub)• Builds tools and automated processes to gather status, inventory,
and operational diagnostics for real-time monitoring• Performs picking and associations that occasionally detect
waveform issues
• Data Management Center (archive and distribution)• Analysts review all long-period data and catalog subtle changes in
character• Run automated tools to parameterize certain data qualities
• All reports go to TA management for integration and action

8
• Real-time monitoring of SoH• Detect problems• Initiate corrective actions
• Station QC & SoH on the web• SoH channel displays
• Both near-real-time and summary• Metrics for arbitrary time intervals
State-of-Health Review
PDF noise analysis by station-channel
Temperature and voltage - life of station
Mass position - life of station
From ANF station status web pages
From DMC QUACK tool

Web-based Monitoring
• Identify changes and how they accumulate over time• E.g., - in last 24 hours: number of reboots, number of IP changes, number of link cycles
• E-mail Alerts: Some status changes result in an email alert to distribute more information immediately about the change: Pump active signal, Q330 reboot
http://anf.ucsd.edu/tools/webdlmon
• Monitoring system renders data into actionable format• Information then feeds weekly management prioritization for all service activities

10
• Direct measurement of orientation of all stations
• Using fiber-optic gyroscope• Measures orientation to < 0.2o
• When station is installed• When station is removed
• Direct measurements validate empirical estimates
• Empirical orientation estimates from surface and mantle wave polarization techniques
• As of 2011 - 95.6% of the TA stations have polarization anomalies within +-3 degrees
• In 2008, this number was 79.9%
Orientation
TA station orientation, relative to north, from empirical analysisResults from Ekström and Busby, SRL, 2008

11
• Automated process for command, capture, and analysis of cal signals
• Analysis of calibration signals to verify amplitude and phase response
• Applied to all TA stations at beginning and end of deployment
• System wide calibration in 2009
Calibration
Station Evolution
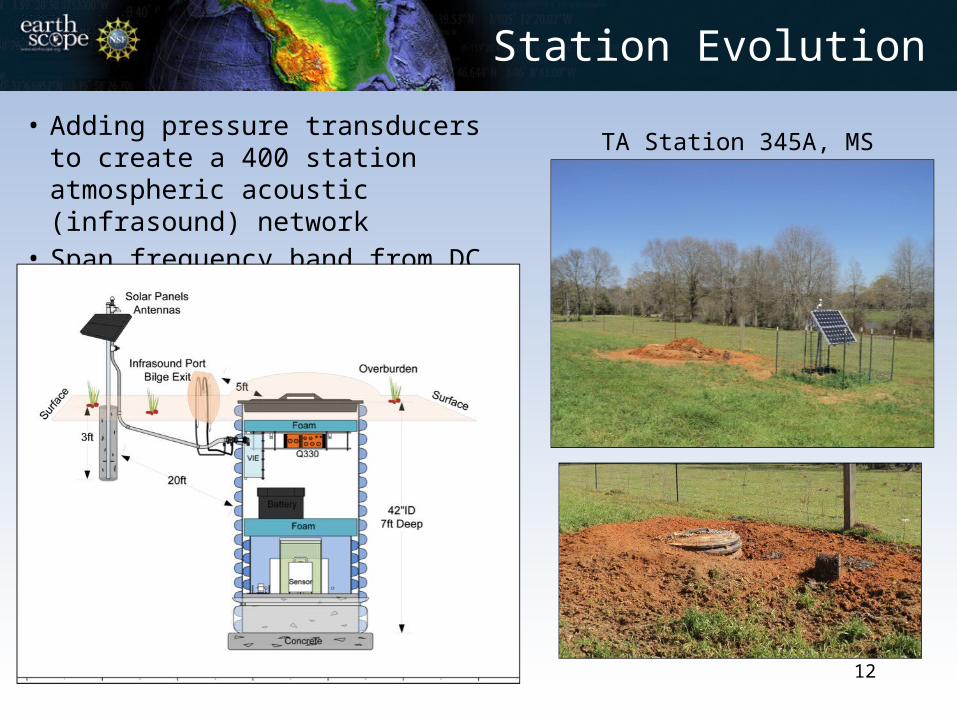
• Adding pressure transducers to create a 400 station atmospheric acoustic (infrasound) network
• Span frequency band from DC to 20 Hz
12
TA Station 345A, MS

• 400 station network operating at >98% availability
• Uniform, autonomous, low-power stations• Multipart approach to QC
• Real time SoH channels• Interactive reviews• Automatic reviews, short-term and
long-term behavior• QC feeds actionable information to
TA Management• Attention to calibration, orientation, and trends in data• Careful evolution of stations
Summary
EarthScope is funded by the National Science Foundation.
EarthScope is being constructed, operated, and maintained as a collaborative effort with UNAVCO, and IRIS, with contributions from the US Geological Survey,
NASA and several other national and international organizations.
Info on the Web• EarthScope
www.earthscope.org• USArray
www.usarray.org• National Science Foundation
www.nsf.gov