THE EARLY BLAST WAVE OF THE 2010 EXPLOSION OF U SCORPIIhea-jdrake/papers/apjl_720_2_195.pdf ·...
6
The Astrophysical Journal Letters, 720:L195–L200, 2010 September 10 doi:10.1088/2041-8205/720/2/L195 C 2010. The American Astronomical Society. All rights reserved. Printed in the U.S.A. THE EARLY BLAST WAVE OF THE 2010 EXPLOSION OF U SCORPII J. J. Drake 1 and S. Orlando 2 1 Harvard-Smithsonian Center for Astrophysics, 60 Garden Street, Cambridge, MA 02138, USA 2 INAF–Osservatorio Astronomico di Palermo “G.S. Vaiana,” Piazza del Parlamento 1, 90134 Palermo, Italy Received 2010 February 25; accepted 2010 July 28; published 2010 August 20 ABSTRACT Three-dimensional hydrodynamic simulations exploring the first 18 hr of the 2010 January 28 outburst of the recurrent nova U Scorpii have been performed. Special emphasis was placed on capturing the enormous range in spatial scales in the blast. The pre-explosion system conditions included the secondary star and a flared accretion disk. These conditions can have a profound influence on the evolving blast wave. The blast itself is shadowed by the secondary star, which itself gives rise to a low-temperature bow shock. The accretion disk is completely destroyed in the explosion. A model with a disk gas density of 10 15 cm −3 produced a blast wave that is collimated and with clear bipolar structures, including a bipolar X-ray emitting shell. The degree of collimation depends on the initial mass of ejecta, energy of explosion, and circumstellar gas density distribution. It is most pronounced for a model with the lowest explosion energy (10 43 erg) and mass of ejecta (10 −8 M ). The X-ray luminosities of three of six models computed are close to, but consistent with, an upper limit to the early blast X-ray emission obtained by the Swift satellite, the X-ray luminosity being larger for higher circumstellar gas density and higher ejecta mass. The latter consideration, together with estimates of the blast energy from previous outbursts, suggests that the mass of ejecta in the 2010 outburst was not larger than 10 −7 M . Key words: methods: numerical – novae, cataclysmic variables – shock waves – stars: individual (U Sco) – X-rays: binaries Online-only material: color figures 1. INTRODUCTION U Scorpii was discovered to have entered its latest outburst on 2010 January 28 by amateur astronomer B. G. Harris (Schaefer et al. 2010). It is one of the best observed of the 10 recurrent novae known to date (e.g., Schaefer 2010), with a fairly constant recurrent cycle of 8–12 yr and a previous outburst in 1999. It comprises a white dwarf of mass 1.55 ± 0.24 M and late- type star of mass 0.88 ± 0.17 M in an orbit with a period of 1.23 days (Johnston & Kulkarni 1992; Thoroughgood et al. 2001; Schaefer 1990; Schaefer & Ringwald 1995). Schaefer (2010) adopts a median spectral type of the secondary from estimates culled from the literature of G5 IV. The outburst mechanism for recurrent novae is thermonuclear runaway on the white dwarf triggered by the accreted mass exceeding a critical limit (Starrfield et al. 1985, 1988). The relatively short 10 year cycle of U Sco and the fast evolution of its outbursts imply that the white dwarf is close to the Chandrasekhar limit (e.g., Starrfield et al. 1988; Hachisu et al. 2000). Ejecta from previous outbursts were also found to be He-rich (Williams et al. 1981; Barlow et al. 1981; Anupama & Dewangan 2000; though this was contested by Iijima 2002), further fueling discussion of U Sco as a possible progenitor of a Type Ia supernova (e.g., Starrfield et al. 1988; Hachisu et al. 1999; Schaefer 2010; see, however, the evolutionary considerations of Sarna et al. 2006): Thoroughgood et al. (2001) characterized it as “the best Type Ia supernova progenitor currently known.” The 2006 explosion of the recurrent nova RS Oph provided a cogent demonstration of the diagnostic power of prompt X-ray observations. RS Oph was a particularly bright X-ray source: the explosion occurs within the dense wind of the secondary red giant star, resulting in a ∼10 7 –10 8 K blast wave whose evolution was followed by RXTE, Swift, and Chandra (Sokoloski et al. 2006; Bode et al. 2006; Nelson et al. 2008; Drake et al. 2009). Detailed three-dimensional hydrodynamic modeling of the blast by Orlando et al. (2009) provided estimates of the explosion energy, ejecta mass, and confirmed the presence of enhanced gas density in the equatorial plane of the system. Spectroscopy of the 2010 outburst of U Sco found H α and H β H Balmer line profiles broadened by 7600 km s −1 full-width at half-maximum (Anupama 2010) and by 11,000 km s −1 full- width at zero intensity (Arai et al. 2010), consistent with those observed in earlier outbursts (e.g., Barlow et al. 1981; Munari et al. 1999; Anupama & Dewangan 2000; Iijima 2002). If partially converted to thermal energy, analogous to the explosion of RS Oph into the dense wind of the secondary star, such kinetic energy would result in heating to X-ray emitting temperatures. While the secondary of U Sco lacks the cool, dense wind of the RS Oph secondary that provided the medium for copious X-ray production, the possibility of the blast generating significant X-rays from shocked ejecta or shocked gas in its accretion disk or ambient circumbinary material remained. The early outburst was observed by the Swift, RXTE, and In- ternational Gamma-Ray Astrophysics Laboratory (INTEGRAL) satellites within a day of discovery (Schlegel et al. 2010; Manousakis et al. 2010) but all failed to detect any X-ray emis- sion. Schlegel et al. (2010) placed the most stringent upper limit of L X < 1.1 × 10 −13 erg s −1 cm −2 (90% confidence) in the 0.3–10 keV band based on data obtained on 2010 January 29–30. Here we describe detailed hydrodynamic simulations of the U Sco explosion similar to those undertaken for RS Oph by Orlando et al. (2009). We investigate the effects of the accretion disk and close secondary companion on the explosion, and examine possible constraints the lack of observed X-rays might provide. L195
Transcript of THE EARLY BLAST WAVE OF THE 2010 EXPLOSION OF U SCORPIIhea-jdrake/papers/apjl_720_2_195.pdf ·...

The Astrophysical Journal Letters, 720:L195–L200, 2010 September 10 doi:10.1088/2041-8205/720/2/L195C© 2010. The American Astronomical Society. All rights reserved. Printed in the U.S.A.
THE EARLY BLAST WAVE OF THE 2010 EXPLOSION OF U SCORPII
J. J. Drake1
and S. Orlando2
1 Harvard-Smithsonian Center for Astrophysics, 60 Garden Street, Cambridge, MA 02138, USA2 INAF–Osservatorio Astronomico di Palermo “G.S. Vaiana,” Piazza del Parlamento 1, 90134 Palermo, Italy
Received 2010 February 25; accepted 2010 July 28; published 2010 August 20
ABSTRACT
Three-dimensional hydrodynamic simulations exploring the first 18 hr of the 2010 January 28 outburst of therecurrent nova U Scorpii have been performed. Special emphasis was placed on capturing the enormous range inspatial scales in the blast. The pre-explosion system conditions included the secondary star and a flared accretiondisk. These conditions can have a profound influence on the evolving blast wave. The blast itself is shadowed by thesecondary star, which itself gives rise to a low-temperature bow shock. The accretion disk is completely destroyedin the explosion. A model with a disk gas density of 1015 cm−3 produced a blast wave that is collimated and withclear bipolar structures, including a bipolar X-ray emitting shell. The degree of collimation depends on the initialmass of ejecta, energy of explosion, and circumstellar gas density distribution. It is most pronounced for a modelwith the lowest explosion energy (1043 erg) and mass of ejecta (10−8 M�). The X-ray luminosities of three of sixmodels computed are close to, but consistent with, an upper limit to the early blast X-ray emission obtained by theSwift satellite, the X-ray luminosity being larger for higher circumstellar gas density and higher ejecta mass. Thelatter consideration, together with estimates of the blast energy from previous outbursts, suggests that the mass ofejecta in the 2010 outburst was not larger than 10−7 M�.
Key words: methods: numerical – novae, cataclysmic variables – shock waves – stars: individual (U Sco) – X-rays:binaries
Online-only material: color figures
1. INTRODUCTION
U Scorpii was discovered to have entered its latest outburst on2010 January 28 by amateur astronomer B. G. Harris (Schaeferet al. 2010). It is one of the best observed of the 10 recurrentnovae known to date (e.g., Schaefer 2010), with a fairly constantrecurrent cycle of 8–12 yr and a previous outburst in 1999. Itcomprises a white dwarf of mass 1.55 ± 0.24 M� and late-type star of mass 0.88 ± 0.17 M� in an orbit with a periodof 1.23 days (Johnston & Kulkarni 1992; Thoroughgood et al.2001; Schaefer 1990; Schaefer & Ringwald 1995). Schaefer(2010) adopts a median spectral type of the secondary fromestimates culled from the literature of G5 IV.
The outburst mechanism for recurrent novae is thermonuclearrunaway on the white dwarf triggered by the accreted massexceeding a critical limit (Starrfield et al. 1985, 1988). Therelatively short 10 year cycle of U Sco and the fast evolutionof its outbursts imply that the white dwarf is close to theChandrasekhar limit (e.g., Starrfield et al. 1988; Hachisu et al.2000). Ejecta from previous outbursts were also found to beHe-rich (Williams et al. 1981; Barlow et al. 1981; Anupama& Dewangan 2000; though this was contested by Iijima 2002),further fueling discussion of U Sco as a possible progenitorof a Type Ia supernova (e.g., Starrfield et al. 1988; Hachisuet al. 1999; Schaefer 2010; see, however, the evolutionaryconsiderations of Sarna et al. 2006): Thoroughgood et al. (2001)characterized it as “the best Type Ia supernova progenitorcurrently known.”
The 2006 explosion of the recurrent nova RS Oph provideda cogent demonstration of the diagnostic power of promptX-ray observations. RS Oph was a particularly bright X-raysource: the explosion occurs within the dense wind of thesecondary red giant star, resulting in a ∼107–108 K blast wavewhose evolution was followed by RXTE, Swift, and Chandra
(Sokoloski et al. 2006; Bode et al. 2006; Nelson et al. 2008;Drake et al. 2009). Detailed three-dimensional hydrodynamicmodeling of the blast by Orlando et al. (2009) providedestimates of the explosion energy, ejecta mass, and confirmed thepresence of enhanced gas density in the equatorial plane of thesystem.
Spectroscopy of the 2010 outburst of U Sco found Hα andHβ H Balmer line profiles broadened by 7600 km s−1 full-widthat half-maximum (Anupama 2010) and by 11,000 km s−1 full-width at zero intensity (Arai et al. 2010), consistent with thoseobserved in earlier outbursts (e.g., Barlow et al. 1981; Munariet al. 1999; Anupama & Dewangan 2000; Iijima 2002). Ifpartially converted to thermal energy, analogous to the explosionof RS Oph into the dense wind of the secondary star, such kineticenergy would result in heating to X-ray emitting temperatures.While the secondary of U Sco lacks the cool, dense wind of theRS Oph secondary that provided the medium for copious X-rayproduction, the possibility of the blast generating significantX-rays from shocked ejecta or shocked gas in its accretion diskor ambient circumbinary material remained.
The early outburst was observed by the Swift, RXTE, and In-ternational Gamma-Ray Astrophysics Laboratory (INTEGRAL)satellites within a day of discovery (Schlegel et al. 2010;Manousakis et al. 2010) but all failed to detect any X-ray emis-sion. Schlegel et al. (2010) placed the most stringent upperlimit of LX < 1.1 × 10⁻¹³ erg s−1cm−2 (90% confidence) inthe 0.3–10 keV band based on data obtained on 2010 January29–30.
Here we describe detailed hydrodynamic simulations of theU Sco explosion similar to those undertaken for RS Oph byOrlando et al. (2009). We investigate the effects of the accretiondisk and close secondary companion on the explosion, andexamine possible constraints the lack of observed X-rays mightprovide.
L195

L196 DRAKE & ORLANDO Vol. 720
Table 1Adopted Parameters and Initial Conditions for the Hydrodynamic Models of the 2010 U Sco Explosion
Parameter Value
Secondary star radius Rb = 2.1 R�Binary separation a = 6.5 R�Inclination i = 83◦Model abbreviation E44M-7 E44M-7 E43M-8 E44M-7 E44M-7 E45M-6
D13 D15 D15 D15HW D15LW D15LW
Explosion energy, E0 (erg) 1044 1044 1043 1044 1044 1045
Ejecta mass, Mej (M�) 10−7 10−7 10−8 10−7 10−7 10−6
Accn. disk density, nd (cm−3) 1013 1015 1015 1015 1015 1015
Sec. wind density, nw (cm−3) 106 106 106 107 105 105
Eq. enhancement, neq (cm−3) 108 108 108 109 107 107
X-ray luminosity, LX (erg s−1) 1 × 1033 5 × 1032 3 × 1031 4 × 1033 5 × 1031 7 × 1033
Swift XRT, LX (erg s−1) < 2 × 1033 (90% confidence)
Spatial domain −6.6 � x � 6.6 AU −13.2 � x � 13.2AU
0 � y � 6.6 AU 0 � y � 13.2 AU0 � z � 6.6 AU 0 � z � 13.2 AU
AMR max. resolution 4 × 108 cm (2.7 × 10⁻⁵ AU)Time covered 0–18 hr
2. HYDRODYNAMIC MODELING
The three-dimensional hydrodynamic model adopted here issimilar to that of Orlando et al. (2009). The calculations wereperformed using FLASH, an adaptive mesh refinement multi-physics code for astrophysical plasmas (Fryxell et al. 2000).The hydrodynamic equations for compressible gas dynamicsare solved using the FLASH implementation of the piecewise-parabolic method (PPM; Colella & Woodward 1984). Unlikethe models of Orlando et al. (2009) computed for the case ofRS Oph, for the very early phase of the blast studied here we donot take into account radiative losses and thermal conduction,assuming that the remnant is in its adiabatic expansion phasefor the whole evolution considered. This assumption is validif the time covered by our simulations tend is smaller than thetransition time from adiabatic to radiative phase for an expand-ing spherical blast, defined as (e.g., Blondin et al. 1998; Petruk2005)
ttr = 0.522 E4/17 n−9/17med s, (1)
where E = E0 is the energy of the explosion and nmed is theparticle number density of the ambient medium. As discussedbelow, it turns out that tend � ttr in our set of simulations andour assumption is valid.
For the system parameters, we adopt the values ofThoroughgood et al. (2001); these are listed in Table 1, togetherwith the parameters adopted for the blast models investigatedhere. We included a diffuse, puffed-up disk-like distributionaround the system which is analogous to the gas density en-hancement found in the numerical model of the RS Oph systemimmediately prior to outburst by Walder et al. (2008, see alsoMastrodemos & Morris 1999) and to the equatorial gas dis-tribution adopted by Orlando et al. (2009). We also includeda flared, uniform density gas accretion disk around the whitedwarf, adopting the shape from Hachisu et al. (2000). We in-cluded the secondary star as an impenetrable body. A close-upof this initial pre-blast configuration is illustrated in Figure 1.
As an initial condition, we assumed a spherical Sedov-typeblast wave (Sedov 1959) originating from the thermonuclearexplosion centered on the white dwarf, with radius r0 =4 × 10⁵ km and total energy E0. This energy was partitioned
Figure 1. Rendition of the U Sco binary system model initial conditions. Thewhite sphere represents the pre-outburst, initial radius of the Sedov-type blaston the white dwarf.
(A color version of this figure is available in the online journal.)
such that 1/4 was contained in thermal energy and 3/4 in kineticenergy. Solar abundances of Grevesse & Sauval (1998, GS) wereassumed for the disk, wind, and equatorial ambient gas, whilethe ejecta metallicity was assumed to be enhanced by a factorof 10. This latter choice was guided by observations of He-richejecta in previous outbursts, as noted in Section 1, as well as theDrake et al. (2009) high-resolution X-ray spectroscopic studyof the 2006 RS Oph blast that found evidence for metal-richejecta. Since radiative losses were not important for the earlyblast evolution, the choice of abundances is only relevant forcomputation of the emitted X-ray intensity of the blast.
Six models were computed to explore the effects of a dif-ferent accretion disk and circumstellar gas density, explosionenergy, and total ejecta mass on the outcome of the blast. Directestimates of the ejecta mass from observations of the 1979 and1999 outbursts (Williams et al. 1981; Anupama & Dewangan2000; Evans et al. 2001) find Mej ∼ 10−7 M�. Expansion ve-locities of ∼5000 km s−1 from optical spectroscopy correspondto a kinetic energy of 2.5 × 1043 erg, which can be taken asa lower limit to the explosion energy. This is consistent with

No. 2, 2010 THE EARLY BLAST WAVE OF THE 2010 EXPLOSION OF U SCORPII L197
-6 -4 -2 0 2 4 6
-6
-4
-2
0
2
4
6
z [A
U]
18:00
-6 -4 -2 0 2 4 6
-6
-4
-2
0
2
4
6 18:00
-6 -4 -2 0 2 4 6
-6
-4
-2
0
2
4
6 18:00
-6 -4 -2 0 2 4 6
-6
-4
-2
0
2
4
6 18:00
-18
-16
-14
-12
-10
log
Den
sity
[cm
-3]
-6 -4 -2 0 2 4 6x [AU]
-6
-4
-2
0
2
4
6
z [A
U]
18:00
-6 -4 -2 0 2 4 6x [AU]
-6
-4
-2
0
2
4
6 18:00
-6 -4 -2 0 2 4 6x [AU]
-6
-4
-2
0
2
4
6 18:00
-6 -4 -2 0 2 4 6x [AU]
-6
-4
-2
0
2
4
6 18:00
4
5
6
7
8
9
log
Tem
pera
ture
[K]
Figure 2. Color-coded cross-section images of the gas density distribution (top) and temperature (bottom) 18 hr after the U Sco blast, corresponding to the end of thehydrodynamic simulations. The secondary star is at the origin, and the white dwarf is to the right. The different panels illustrate models with accretion disk densitynd = 1013 cm−3 and an explosion energy of E0 = 1044 erg (E44M-7D13; left); nd = 1015 cm−3 and E0 = 1044 erg (E44M-7D15; left-center); nd = 1015 cm−3 andE0 = 1043 erg (E43M-8D15; right-center). Far right panels show a similar model to the left-center panels, except with CSM gas densities increased by a factor of10 (E44M-7D15HW). Inset panels show the blast structure closer to the system origin. The secondary star is shown and is responsible for the strong “shadowing” ofthe blast wave. The accretion disk is completely destroyed by the blast in all simulations. The white dotted contour encloses the ejecta. The red solid contour denotesthe regions with plasma temperature T > 1 × 10⁶ K.
(A color version of this figure is available in the online journal.)
estimates of the integrated optical output from earlier outburstsof 1044 erg (e.g., Webbink et al. 1987). We therefore adoptedfiducial values of E0 = 1044 erg and Mej = 10−7 M� and ex-plored the effects of lower and higher values of each by an orderof magnitude. For the accretion disk, we assumed a uniform den-sity of nd = 1015 cm−3 and investigated a further model withnd = 1013 cm−3. The wind and equatorial density enhancementare included for completeness. While this circumstellar gas isnot expected to have a profound influence on the dynamicsand evolution of the blast, it does influence the shock structureand the predicted X-ray luminosity. We probed the effects of in-creasing and decreasing the circumstellar gas density by a factorof 10.
The hydrodynamic equations were solved in one quadrant ofthe three-dimensional spatial domain and the coordinate systemwas oriented in such a way that both the white dwarf and thedonor star lie on the x-axis. The donor star was at the originof the coordinate system, (x0, y0, z0) = (0, 0, 0), and the whitedwarf was located at x = 0.03 AU, i.e., the system orbitalseparation. The extents of spatial domains employed for thedifferent models are listed in Table 1 together with other relevantparameters and depended on the circumstellar gas density; twomodels that investigated lower densities for which expansionrates were greater required larger domains.
The explosion was followed for 18 hr in order to explorethe early phase X-ray emission and capture the details of theeffects of the explosion environment on the blast evolution.A major challenge in modeling the explosion of U Sco is thevery small scale of the system compared with the size of therapidly expanding blast wave. The separation of the two stars isonly 0.03 AU—a distance traversed by a blast wave moving at
5000 km s−1 in less than 20 minutes—and the secondary starsubtends a sufficiently large solid angle that it has a significanteffect on the blast wave evolution. To capture this range ofscales, the models explored here employed 16 nested levels ofadaptive mesh refinement, with resolution increasing twice ateach refinement level. This grid configuration yields an effectiveresolution of ≈4 × 10³ km at the finest level, corresponding to≈100 grid points per initial radius of the blast.
Given the parameters in Table 1, for five of our six modelsttr > 3 days from Equation (1), and for the sixth (E44M-7D15HW) ttr = 2.3 days. These times are much larger thanthe time covered by our simulations. Our modeled remnantstherefore never enter the radiative phase.
3. RESULTS AND DISCUSSION
3.1. Temperature and Density Structure
The U Sco models all evolved quite differently to thosepresented for RS Oph by Orlando et al. (2009). As noted inSection 1, this difference is expected because U Sco lacks thedense wind of RS Oph for propagation of an X-ray emittingblast wave.
The 18 hr post-blast gas density and temperature distributionsin the x – z plane bisecting the system (the plane of the orbitalaxis; the accretion disk is edge on) are illustrated in Figure 2.All the models exhibit conspicuous departure from sphericalsymmetry. The main feature of the gas density distribution isa large cavity to the left of the figures (negative x-direction),which is a blast wave “shadow” cast by the secondary star. Thisresult reinforces the need to perform simulations with sufficient

L198 DRAKE & ORLANDO Vol. 720
Figure 3. Three-dimensional rendering of the ejecta distribution, 18 hr after theblast for the model E44M-7D15. The plane of the orbit of the central binarysystem lies on the (x, y) plane.
(A color version of this figure is available in the online journal.)
spatial resolution to capture the details of the pre-blast systemconfiguration.
In all models, the accretion disk is completely destroyed bythe blast. This is not surprising considering the gravitationalbinding energy of the disk in our models is 3–4 orders ofmagnitude lower than the explosion energy: disk destruction isassured unless the disk gas density is substantially higher than1015 cm−3. Worters et al. (2010; see also Munari et al. 2010)report a renewed optical flickering with amplitude “0.2 mag overthe course of an hour” on 2010 February 5. They interpret thisre-establishment of accretion, implying a limit of 7 days on thebuild-up of an angular momentum shedding accretion disk. Inour simulations, the disk volume is Vdisk ≈ 2 × 1034 cm3 and itsmass ranges between 2.2×10⁻¹⁰ M� (model E44M-7D13) and2.2 × 10−8 M� (all other models). The build-up of the disk in7 days would imply a rate of mass loss from the companion starranging between 10−8 and 10−6 M� yr−1, consistent with theestimate of Hachisu et al. (2000). We note, however, that anyrenewed disk build-up would need to overcome the dynamicpressure of the radiatively driven outflow from the evolvingcentral object.
Model E44M-7D13, with lower accretion disk gas density,shows only a very small effect of the disk in a slight inhibition ofthe blast wave progress in the positive x-direction. In contrast,the higher disk gas density in all the other models has quitea profound effect on the blast evolution. Both the blast andejecta are strongly collimated in polar directions, the collimationbeing more prominent for lower explosion energy (E43M-8D15)as might be expected. Figure 3 shows, as an example, thecollimation of ejecta 18 hr after the outburst for the modelE44M-7D15. Kato & Hachisu (2003) interpreted “horned”optical line profiles observed in previous U Sco outburst (e.g.,Munari et al. 1999) as evidence for “jet-shaped” outflows.Similar blast collimation was both predicted by hydrodynamicsimulations of the early RS Oph blast by Walder et al. (2008) andOrlando et al. (2009), and deduced through X-ray spectroscopyobtained 13.6 days after the outburst (Drake et al. 2009).
The simulations indicated the collimation was caused by anequatorial disk-like gas distribution around the white dwarf.High spatial resolution observations of the blast at varioustimes also found optical, infrared, radio, and X-ray collimationsignatures (O’Brien et al. 2006; Bode et al. 2007; Chesneauet al. 2007; Luna et al. 2009).
Evidence for a more strongly collimated synchrotron radiojet was also found by Rupen et al. (2008) and Sokoloski et al.(2008). The latter authors concluded that such structure is toohighly collimated to be explained by the influence of circumbi-nary material on the explosion. The calculations presented hereand by Orlando et al. (2009) bring such conclusions into ques-tion: the nature of the explosion environment is crucial for themorphology of the evolving blast and ejecta. While the modelspresented here do not produce obvious narrow jets of material,we note that radio synchrotron emission also depends stronglyon the magnetic field strength, gradient, and orientation (e.g.,Orlando et al. 2007) and need not be co-spatial with obviousdensity enhancements in the ejecta.
The outer regions of the blast are characterized by a layerof shocked circumstellar medium (CSM) with temperature≈109 K and a thin expanding surface of shocked ejecta withtemperature in the range (107–108) K (see Figure 2). The CSMgives rise to a reflected shock that heats the ejecta and isstrongest for model E44M-7D15HW in which the CSM densityis highest. The secondary star also gives rise to a prominent“bow shock,” though in this structure the gas is shocked toa temperature of only a few 105 K and does not give rise toany conspicuous observable X-ray emission. It is worth notingthat Figure 2 reports the proton temperature set by collisionlessheating at the shock front. Given the short timescale consideredhere, protons and electrons are likely not thermalized at theforward shock, so that the ratio of the electron to protontemperature at the blast wave is expected to be (Te/Tp) < 1.Ghavamian et al. (2007) derived a physical model for theheating of electrons and protons in strong shocks that predictsa relationship (Te/Tp) ∝ v−2
S , where vS is the shock velocity.Considering the velocity of the forward shock in our simulationsis of the order of 10,000 km s−1, from Figure 2 of Ghavamianet al. (2007) we derive (Te/Tp) < 0.1. Thus, we expect that theelectron temperature of the shocked CSM is ≈108 K. X-rays areinstead naturally dominated by the higher density parts of theshocked ejecta which are expected to equilibrate quickly. In thefollowing, we therefore assumed electron–proton temperatureequilibration in shocked ejecta.
3.2. X-ray Luminosity and Morphology
X-ray emission from the blast was synthesized from themodel results using the methodology described by Orlandoet al. (2009). The synthesis includes thermal broadening ofemission lines, the Doppler shift of lines due to the componentof plasma velocity along the line of sight, and photoelectricabsorption by the interstellar medium (ISM), CSM, and ejecta.The absorption by the ISM is calculated assuming a columndensity NH = 1.4 × 1021 cm−2 (e.g., Kahabka et al. 1999, andis consistent with a distance to U Sco of 12 kpc, e.g., Schaefer2010); the local absorption is calculated as due to shocked CSM(assuming GS abundances) and ejecta (GS abundances ×10).The X-ray emission from the blast at 18 hr is illustratedfor four representative models in Figure 4. The absorptionby the ejecta contributes to a small difference between thepredicted X-ray luminosities of the different models. Most ofthe emission arises from the high-temperature shocked ejecta
No. 2, 2010 THE EARLY BLAST WAVE OF THE 2010 EXPLOSION OF U SCORPII L199
-6 -4 -2 0 2 4 6
-6
-4
-2
0
2
4
6
z [A
U]
-6 -4 -2 0 2 4 6
-6
-4
-2
0
2
4
6
-6 -4 -2 0 2 4 6
-6
-4
-2
0
2
4
6
-6 -4 -2 0 2 4 6
-6
-4
-2
0
2
4
6
-3.0
-2.5
-2.0
-1.5
-1.0
-0.5
0.0
log
emis
sion
[a.u
.]
-6 -4 -2 0 2 4 6x [AU]
-6
-4
-2
0
2
4
6
z [A
U]
-6 -4 -2 0 2 4 6x [AU]
-6
-4
-2
0
2
4
6
-6 -4 -2 0 2 4 6x [AU]
-6
-4
-2
0
2
4
6
-6 -4 -2 0 2 4 6x [AU]
-6
-4
-2
0
2
4
6
0.0
0.2
0.4
0.6
0.8
1.0
emis
sion
[a.u
.]
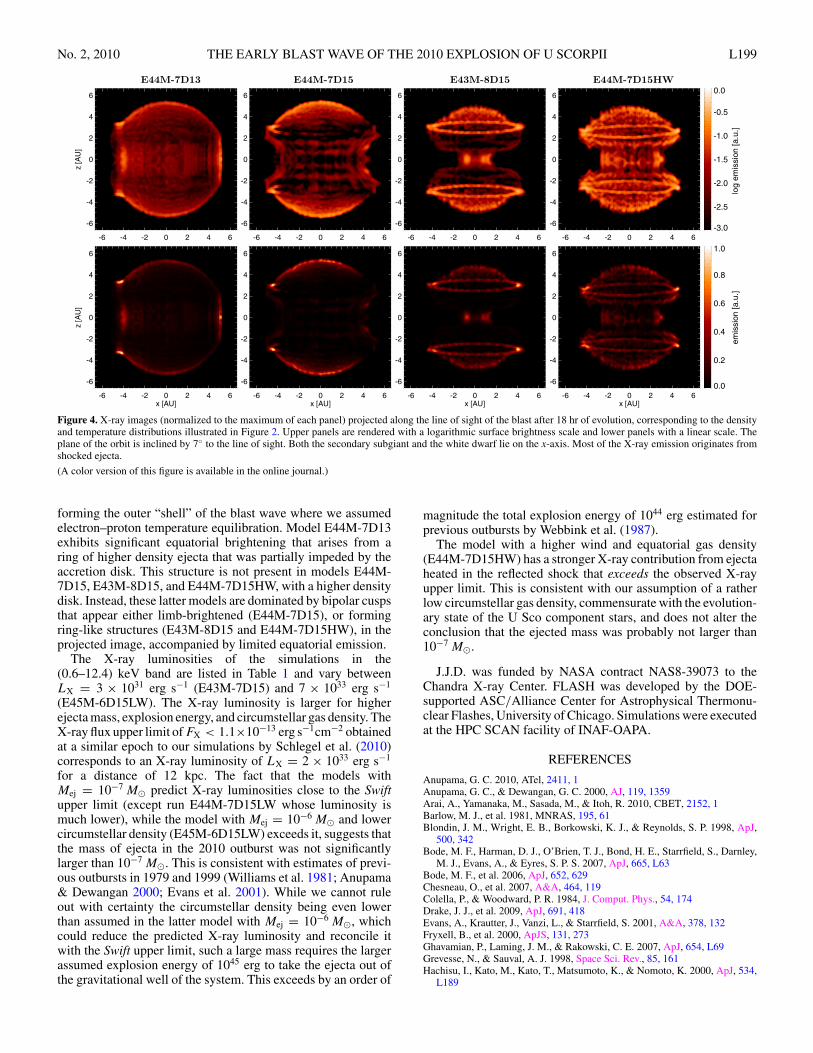
Figure 4. X-ray images (normalized to the maximum of each panel) projected along the line of sight of the blast after 18 hr of evolution, corresponding to the densityand temperature distributions illustrated in Figure 2. Upper panels are rendered with a logarithmic surface brightness scale and lower panels with a linear scale. Theplane of the orbit is inclined by 7◦ to the line of sight. Both the secondary subgiant and the white dwarf lie on the x-axis. Most of the X-ray emission originates fromshocked ejecta.
(A color version of this figure is available in the online journal.)
forming the outer “shell” of the blast wave where we assumedelectron–proton temperature equilibration. Model E44M-7D13exhibits significant equatorial brightening that arises from aring of higher density ejecta that was partially impeded by theaccretion disk. This structure is not present in models E44M-7D15, E43M-8D15, and E44M-7D15HW, with a higher densitydisk. Instead, these latter models are dominated by bipolar cuspsthat appear either limb-brightened (E44M-7D15), or formingring-like structures (E43M-8D15 and E44M-7D15HW), in theprojected image, accompanied by limited equatorial emission.
The X-ray luminosities of the simulations in the(0.6–12.4) keV band are listed in Table 1 and vary betweenLX = 3 × 1031 erg s−1 (E43M-7D15) and 7 × 1033 erg s−1
(E45M-6D15LW). The X-ray luminosity is larger for higherejecta mass, explosion energy, and circumstellar gas density. TheX-ray flux upper limit of FX < 1.1×10⁻¹³ erg s−1cm−2 obtainedat a similar epoch to our simulations by Schlegel et al. (2010)corresponds to an X-ray luminosity of LX = 2 × 1033 erg s−1
for a distance of 12 kpc. The fact that the models withMej = 10−7 M� predict X-ray luminosities close to the Swiftupper limit (except run E44M-7D15LW whose luminosity ismuch lower), while the model with Mej = 10−6 M� and lowercircumstellar density (E45M-6D15LW) exceeds it, suggests thatthe mass of ejecta in the 2010 outburst was not significantlylarger than 10−7 M�. This is consistent with estimates of previ-ous outbursts in 1979 and 1999 (Williams et al. 1981; Anupama& Dewangan 2000; Evans et al. 2001). While we cannot ruleout with certainty the circumstellar density being even lowerthan assumed in the latter model with Mej = 10−6 M�, whichcould reduce the predicted X-ray luminosity and reconcile itwith the Swift upper limit, such a large mass requires the largerassumed explosion energy of 1045 erg to take the ejecta out ofthe gravitational well of the system. This exceeds by an order of
magnitude the total explosion energy of 1044 erg estimated forprevious outbursts by Webbink et al. (1987).
The model with a higher wind and equatorial gas density(E44M-7D15HW) has a stronger X-ray contribution from ejectaheated in the reflected shock that exceeds the observed X-rayupper limit. This is consistent with our assumption of a ratherlow circumstellar gas density, commensurate with the evolution-ary state of the U Sco component stars, and does not alter theconclusion that the ejected mass was probably not larger than10−7 M�.
J.J.D. was funded by NASA contract NAS8-39073 to theChandra X-ray Center. FLASH was developed by the DOE-supported ASC/Alliance Center for Astrophysical Thermonu-clear Flashes, University of Chicago. Simulations were executedat the HPC SCAN facility of INAF-OAPA.
REFERENCES
Anupama, G. C. 2010, ATel, 2411, 1Anupama, G. C., & Dewangan, G. C. 2000, AJ, 119, 1359Arai, A., Yamanaka, M., Sasada, M., & Itoh, R. 2010, CBET, 2152, 1Barlow, M. J., et al. 1981, MNRAS, 195, 61Blondin, J. M., Wright, E. B., Borkowski, K. J., & Reynolds, S. P. 1998, ApJ,
500, 342Bode, M. F., Harman, D. J., O’Brien, T. J., Bond, H. E., Starrfield, S., Darnley,
M. J., Evans, A., & Eyres, S. P. S. 2007, ApJ, 665, L63Bode, M. F., et al. 2006, ApJ, 652, 629Chesneau, O., et al. 2007, A&A, 464, 119Colella, P., & Woodward, P. R. 1984, J. Comput. Phys., 54, 174Drake, J. J., et al. 2009, ApJ, 691, 418Evans, A., Krautter, J., Vanzi, L., & Starrfield, S. 2001, A&A, 378, 132Fryxell, B., et al. 2000, ApJS, 131, 273Ghavamian, P., Laming, J. M., & Rakowski, C. E. 2007, ApJ, 654, L69Grevesse, N., & Sauval, A. J. 1998, Space Sci. Rev., 85, 161Hachisu, I., Kato, M., Kato, T., Matsumoto, K., & Nomoto, K. 2000, ApJ, 534,
L189

L200 DRAKE & ORLANDO Vol. 720
Hachisu, I., Kato, M., Nomoto, K., & Umeda, H. 1999, ApJ, 519, 314Iijima, T. 2002, A&A, 387, 1013Johnston, H. M., & Kulkarni, S. R. 1992, ApJ, 396, 267Kahabka, P., Hartmann, H. W., Parmar, A. N., & Negueruela, I. 1999, A&A,
347, L43Kato, M., & Hachisu, I. 2003, ApJ, 587, L39Luna, G. J. M., Montez, R., Sokoloski, J. L., Mukai, K., & Kastner, J. H.
2009, ApJ, 707, 1168Manousakis, A., Revnivtsev, M., Krivonos, R., & Bozzo, E. 2010, ATel, 2412,
1Mastrodemos, N., & Morris, M. 1999, ApJ, 523, 357Munari, U., Dallaporta, S., & Castellani, F. 2010, IBVS, 5930, 1Munari, U., et al. 1999, A&A, 347, L39Nelson, T., Orio, M., Cassinelli, J. P., Still, M., Leibowitz, E., & Mucciarelli, P.
2008, ApJ, 673, 1067O’Brien, T. J., et al. 2006, Nature, 442, 279Orlando, S., Bocchino, F., Reale, F., Peres, G., & Petruk, O. 2007, A&A, 470,
927Orlando, S., Drake, J. J., & Laming, J. M. 2009, A&A, 493, 1049Petruk, O. 2005, J. Phys. Stud., 9, 364 (http://www.ktf.franko.lviv.ua/JPS/2005/
4/abs/a364_373.html)Rupen, M. P., Mioduszewski, A. J., & Sokoloski, J. L. 2008, ApJ, 688, 559
Sarna, M. J., Ergma, E., & Gerskevits, J. 2006, Acta Astron., 56, 65Schaefer, B. E. 1990, ApJ, 355, L39Schaefer, B. E. 2010, ApJS, 187, 275Schaefer, B. E., Harris, B. G., Dvorak, S., Templeton, M., & Linnolt, M. 2010,
IAU Circ., 9111, 1Schaefer, B. E., & Ringwald, F. A. 1995, ApJ, 447, L45Schlegel, E. M., et al. 2010, ATel, 2419, 1Sedov, L. I. 1959, Similarity and Dimensional Methods in Mechanics (New
York: Academic Press)Sokoloski, J. L., Luna, G. J. M., Mukai, K., & Kenyon, S. J. 2006, Nature, 442,
276Sokoloski, J. L., Rupen, M. P., & Mioduszewski, A. J. 2008, ApJ, 685, L137Starrfield, S., Sparks, W. M., & Shaviv, G. 1988, ApJ, 325, L35Starrfield, S., Sparks, W. M., & Truran, J. W. 1985, ApJ, 291, 136Thoroughgood, T. D., Dhillon, V. S., Littlefair, S. P., Marsh, T. R., & Smith,
D. A. 2001, MNRAS, 327, 1323Walder, R., Folini, D., & Shore, S. N. 2008, A&A, 484, L9Webbink, R. F., Livio, M., Truran, J. W., & Orio, M. 1987, ApJ, 314, 653Williams, R. E., Sparks, W. M., Gallagher, J. S., Ney, E. P., Starrfield, S. G., &
Truran, J. W. 1981, ApJ, 251, 221Worters, H. L., Eyres, S. P. S., Rushton, M. T., & Schaefer, B. 2010, IAU Circ.,
9114, 1