
The e ect of post weld heat treatment on the creepbehaviour … · · 2017-03-16After the welding...
13
•
Transcript of The e ect of post weld heat treatment on the creepbehaviour … · · 2017-03-16After the welding...
Loughborough UniversityInstitutional Repository
The e�ect of post weld heattreatment on the creep
behaviour andmicrostructural evolution ingrade 92 steel welds forsteam pipe applications
This item was submitted to Loughborough University's Institutional Repositoryby the/an author.
Citation: XU, X. ... et al, 2014. The e�ect of post weld heat treatment on thecreep behaviour and microstructural evolution in grade 92 steel welds for steampipe applications. IN: Gandy, D. and Shingledecker, J. (eds). Advances in Ma-terials Technology for Fossil Power Plants: Proceedings from the Seventh Inter-national Conference (EPRI 2013), 22nd-25th October 2013, Waikoloa, Hawaii,USA. ASM International, pp. 615 - 626.
Additional Information:
• Copyright 2014 ASM International, www.asminternational.org. This ar-ticle was published in Advances in Materials Technology for Fossil PowerPlants: Proceedings from the Seventh International Conference and ismade available as an electronic reprint with the permission of ASM Inter-national. One print or electronic copy may be made for personal use only.Systematic or multiple reproduction, distribution to multiple locations viaelectronic or other means, duplications of any material in this article fora fee or for commercial purposes, or modi�cation of the content of thisarticle is prohibited.
Metadata Record: https://dspace.lboro.ac.uk/2134/14297
Version: Accepted for publication
Publisher: c© ASM International
Please cite the published version.

THE EFFECT OF POST WELD HEAT TREATMENT ON THE CREEP BEHAVIOUR AND MICROSTRUCTURAL EVOLUTION IN GRADE 92
STEEL WELDS FOR STEAM PIPE APPLICATIONS
X. Xu, G.D. West, and R.C. Thomson Department of Materials, Loughborough University, Loughborough, LE11 3TU, UK
J. Parker
EPRI, 1300 Harris Boulevard, Charlotte, North Carolina, 28262, USA ABSTRACT Grade 92 steel has been widely applied in the power generation industry for use as steam pipes, headers, tubes, etc. owing to a good combination of creep and corrosion resistance. For the welding of thick section pipes, a multi-pass submerged arc welding process is typically used to achieve sufficient toughness in the weld. To relieve the internal stress in the welds and to stabilise their microstructures, a post weld heat treatment (PWHT) is commonly applied. The heat treatment conditions used for the PWHT have a significant effect on both the resulting microstructure and the creep behaviour of the welds. In this study, interrupted creep tests were carried out on two identical Grade 92 welds that had been given PWHTs at two different temperatures: 732°C and 760°C. It was found that the weld with the lower PWHT temperature had a significantly reduced stain rate during the creep test. In addition, microstructural examination of the welds revealed that the primary location of creep damage was in the heat affected zone in the sample with the lower PWHT temperature, whereas it was in the weld metal in the sample with the higher PWHT temperature. To understand the effect of the different PWHT temperatures on the microstructure, initially the microstructures in the head portions of the two creep test bars were compared. This comparison was performed quantitatively using a range of electron/ion microscopy based techniques. It was apparent that in the sample subjected to the higher PWHT temperature, larger Laves phase particles occurred and increased matrix recovery was observed compared with the sample subjected to the lower PWHT temperature. INTRODUCTION In recent years Grade 92 steel has achieved wide application in the power generation industry due to a combination of good mechanical properties and sufficient corrosion resistance. The heat treatment processing of these steels normally includes a normalising stage performed at about 1100°C followed by tempering below the A1 temperature at about 770°C [1]. The resulting microstructure of the steels after heat treatment normally shows a fully martensitic matrix combined with a fine dispersion of grain boundary M23C6 (M: Cr, Fe, W) carbides and intragranular MX carbonitrides (M: Nb, V; X: C, N) [1,2]. Welding of thick section steam pipes made from Grade 92 steel is commonly undertaken using a multi-pass submerged arc welding (SAW) process. A typical thermal cycle for Grade 92 steel welds includes a preheat treatment at approximately 200°C, followed by welding at a maximum interpass temperature of 300°C. After the welding stage, a post weld heat treatment (PWHT) is applied to the welds at ~ 760°C for internal stress relief and microstructural stabilisation [3]. The resulting microstructure is heterogeneous and contains a heat affected zone (HAZ) and

recrystallised regions between weld beads [4]. The final microstructure of the weld is sensitive to both the welding and PWHT conditions [5,6]. Premature creep failure is a known problem in Grade 92 steel welds, although the reasons for this are not well understood. Failure is often found to occur in the heat affected zone (HAZ) [7, 8] in these materials, which is commonly termed Type IV behaviour. In this study, two identical Grade 92 cross-weld creep samples, which were post weld heat treated at different temperatures, are compared in terms of creep strain rate, creep damage location and microstructural degradation. EXPERIMENTAL PROCEDURES Materials and Creep Test Conditions Two cross-weld samples including the HAZ and the weld metal were obtained from a weld manufactured in a thick section pipe made from Grade 92 steel. Table 1 shows the compositions of the Grade 92 steel pipe and weld filler, which is a typical matching filler for the steel. After fabrication of a Gas Tungsten Arc root, the fill involved a multi-pass SAW process.
Table 1. Composition of the Grade 92 pipe and weld filler (wt. %), balance Fe.
C Si Mn Cr Mo Ni V W Nb Pipe 0.10 0.31 0.46 8.60 0.39 0.38 0.18 1.76 - Filler 0.11 0.40 0.45 8.80 0.45 0.65 0.20 1.65 0.06 Quadrants from the weld were heat treated using conditions which were close to the limits defined in applicable codes. Thus, the two quadrants were heat treated at either 732oC or 760oC. Cross-weld samples were then machined from each quadrant. A picture of a typical specimen is shown in Fig. 1. The gauge portion of the cross-weld specimens is 60 mm in both length and width and 9 mm in thickness. The two cross-weld samples were identified for the different PWHT temperatures used as ‘WA’ at 732°C and ‘WB’ at 760°C and were held for identical time periods. The two samples were subsequently creep tested at 625°C for approximately 11,000 hours at 80 MPa before the test was interrupted prior to sample failure.
Figure 1. A photograph showing the Grade 92 cross-weld test bars before creep testing (a) and a schematic diagram showing the test bar with the weld position illustrated (b). The dotted lines in (b) show the cuts made using EDM.
(b)
(a)

3
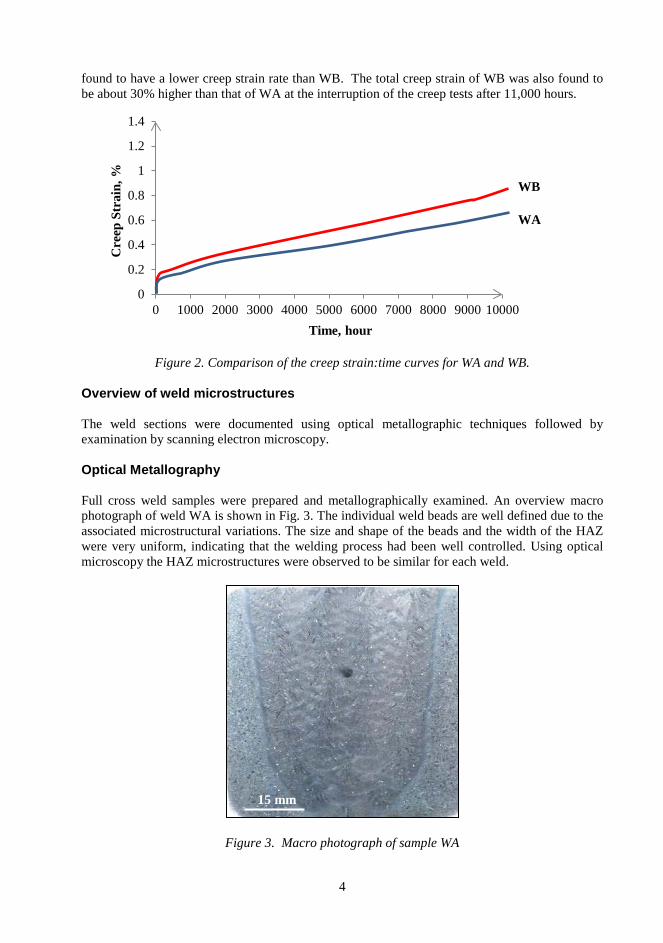
Microstructural characterisation After the creep test the cross-weld samples were sectioned using Electrical Discharge Machining (EDM) to cut off the head portions and bisect the gauge portion along the centre of the weld as illustrated in Fig. 1(b). The samples were further cut into 4 quadrants using a Struers Accutom saw to make the samples a more suitable size for detailed microstructural analysis. The samples were prepared for analysis using conventional metallographic preparation procedures. A final extended chemomechanical polishing step using 0.02 µm colloidal silica suspension was used to eliminate surface deformations, which are introduced by the abrasive polishing stages. All evaluations were performed on the longitudinal/width plane at the mid thickness of the cross weld samples. An inverted Reichert-Jung MeF3 optical microscope was used to perform the initial microstructural characterisation before the detailed investigations undertaken using electron and ion microscopies. The samples for optical microscopy were etched using Villela’s reagent (1 g picric acid, 5 ml hydrochloric acid and 100 ml methanol) for 10 s, with bright field optical micrographs collected using a Fujitsu HC-300Z digital camera. A Carl Zeiss 1530VP Field Emission Gun Scanning Electron Microscope (FEG-SEM) was used to assess the Laves phase population characteristics in the samples. Images were collected using a solid state backscatter detector using an accelerating voltage of 10 kV and an aperture size of 60 μm. Forty micrographs covering a total area of 27,000 μm2 were collected in random locations in the head portion of the samples to obtain data with high statistical significance. An FEI Nova 600 Nanolab dual beam Focused Ion Beam (FIB)/FEG-SEM was used to provide a detailed microstructural overview, electron backscatter diffraction of the matrix, and ion beam imaging of M23C6 particles. An overview of the microstructure was obtained by collecting low magnification images with the solid state backscatter detector at 10 kV with a nominal current of 2.1 nA. The high precision piezo-electric stage on the system allowed sequential rows of images to be collected in a convenient manner. These micrographs were then manually stitched using standard image processing software to obtain an overview image of the entire gauge portion of the samples. Ion beam induced secondary electron (SE) micrographs were collected from head portions of the samples to characterise the number density and the average size of the M23C6 carbides. The ion beam was operated at an accelerating voltage of 30 kV and a current of 50 pA, with XeF2 gas flowing to enhance the contrast differential between the carbides and other microstructural features such as the matrix and Laves phase. Eight micrographs were collected from random areas covering a total area of 1130 μm2 per sample. The particle sizes of M23C6 and Laves phase were quantified from the appropriate images using UTHSCSA image tool software. Electron backscatter diffraction (EBSD) maps were collected at 20 kV and a nominal current of 24 nA using an EDAX Hikari camera. Each EBSD map was collected over an area of 50 × 50 μm2 using a step size of 0.1 μm and all patterns were indexed against a bcc iron structure file. RESULTS AND DISCUSSION Creep Testing Fig. 2 shows the creep strain rate curves of the two cross-weld samples. Different creep strain rates at the accelerated creep stage have been observed between the two cross-weld samples with different PWHT temperatures. WA, which was post weld heat treated at a lower temperature, was
4
found to have a lower creep strain rate than WB. The total creep strain of WB was also found to be about 30% higher than that of WA at the interruption of the creep tests after 11,000 hours.
Figure 2. Comparison of the creep strain:time curves for WA and WB.
Overview of weld microstructures The weld sections were documented using optical metallographic techniques followed by examination by scanning electron microscopy. Optical Metallography Full cross weld samples were prepared and metallographically examined. An overview macro photograph of weld WA is shown in Fig. 3. The individual weld beads are well defined due to the associated microstructural variations. The size and shape of the beads and the width of the HAZ were very uniform, indicating that the welding process had been well controlled. Using optical microscopy the HAZ microstructures were observed to be similar for each weld.
Figure 3. Macro photograph of sample WA
0
0.2
0.4
0.6
0.8
1
1.2
1.4
0 1000 2000 3000 4000 5000 6000 7000 8000 9000 10000
Cre
ep S
trai
n, %
Time, hour
WB
WA
15 mm

5
The effect of the specific thermal cycles on microstructure depends on the metallurgical system being considered and the detailed condition of the base metal. Because the welds were made using the same process and base metal the microstructural regions present in the HAZ of each weld was similar. The general features of the weld metal and HAZ are shown in Fig. 3 with summary description as follows:
i. Coarse grain region (CGHAZ): Material near the fusion boundary reaches a temperature well above Ac3 during welding. Precipitates which constitute the main obstacle to growth of the austenite grains are dissolved, so that once austenite is formed the growth of austenite grains is relatively rapid resulting in a “coarse” grain structure. In the 9–12 Cr steels, the region containing relatively coarse grained austenite transforms into martensite on cooling under typical conditions, Fig. 4a.
ii. Fine grain region (FGHAZ): As the distance from the fusion line increases the peak temperature during welding decreases. In the FGHAZ, the peak temperature is above Ac3, resulting in complete transformation to austenite. However, this temperature is not sufficient to dissolve all of the precipitates present. Thus, austenite grain growth is limited by the incomplete dissolution of carbides, nitrides or carbo-nitrides. The fine grained austenite produced will mostly transform to martensite in the 9–12 Cr steels under typical cooling. In locations where the prior austenite grain size is very small, the ability of these very fine grains to undergo a fully shear type transformation may be limited. The typical microstructure is shown in Fig. 4b.
iii. Intercritical region (ICHAZ): In this region the peak temperature exceeds Ac1 but not Ac3. Thus there will be some new austenite formed during the heating cycle. Some of the precipitates may dissolve but the combination of time and temperature is insufficient for complete dissolution of all precipitates. There will thus be only a partial reversion to austenite on heating. This new austenite will predominantly transform to martensite on cooling, but it should be emphasized that the description ‘intercritical’ can be used to describe a wide range of conditions. There is some variation of specific microstructural features within an ‘intercritical’ region.
iv. Highly tempered region: Adjacent to the parent, the time and temperature combination will modify the local substructure. In creep strength enhanced ferritic (CSEF) steels this modification may relate to changes in precipitates and/or the locally high dislocation density. In either case, these changes are not easily resolved using optical metallography and can only be discerned using advanced electron optics.
Figure 4. Micro photographs of the HAZ in sample WA showing the coarse grained structure (a) and the fine grained structure (b)
350 μm 350 μm
(a) (b)

6
Low magnification backscatter electron micrographs were collected across the entire prepared surface of both welds to provide a microstructural overview of the cross-weld samples. These images were stitched together and are displayed as a montage in Figures 5 and 6. These microstructural maps enable the different regions of the sample such as parent metal, weld metal and the root beads to be clearly defined in both WA and WB. The location of primary creep damage can be seen to occur in different areas of the two weld samples. In WA, two cracks with lengths of ~20 mm were observed in the HAZ parallel to the fusion line, approximately 2 mm from the weld/metal interface (Fig. 5a and Fig. 5b). However, in WB a crack about 25 mm long was observed at the centre of the weld metal (Fig. 6c). The microstructure in both the HAZ and in the weld metal of both welds was heterogeneous. In the weld metal, regions with a fine grain structure were found between the regions with a columnar coarse grain structure: typical examples of these areas are shown in Fig. 7 for WA. These fine grain regions were found to be aligned along the axis of the weld within the weld metal and are possibly caused by the re-tempering of weld beads during the multi-pass welding process. In the regions away from the major cracks, creep cavities were also observed in the HAZ and in particular the fine grain regions in both WA and WB. Fig. 8 shows typical examples of the cavities observed in the HAZ and the fine grain regions in WA. Most of the observed cavities are non-spherical and are typically 2-3 µm in diameter.
Figure 5. A montage of systematically collected backscatter electron micrographs showing the entire gauge portion of WA.
Weld metal
Parent metal
6 μm

7
Figure 6. A montage of systematically collected backscatter electron micrographs showing the entire gauge portion of WB.
Weld metal Parent metal
Weld metal Parent metal Weld metal Parent
metal
Weld metal Parent metal
6 μm

8
Figure 7. Backscatter electron micrographs showing the coarse grained (a) and fine grained regions (b) in the weld metal in WA.
Figure 8. Backscatter electron micrographs showing the cavities (indicated by arrows) in the HAZ (a) and the fine grain region in the weld metal (b) in WA. Comparisons of base metal in specimen head and gauge The weld samples possessed heterogeneous microstructures, which depend on the local thermal effects during fabrication. This heterogeneity complicates the direct comparison between the two samples with different PWHT temperatures. To overcome this problem and assess quantitatively the effect of the PWHT temperature on microstructure, head portions of the creep samples (i.e. containing the parent steel) were analysed. Since head portions are not loaded to the same stress as the gauge length and both samples were tested for a similar duration it is reasonable that any microstructural differences observed in the samples can be linked to the different PWHT temperatures applied. Fig. 9 shows optical micrographs of the parent metal in the head portion of WA. The matrix microstructure of the parent metal was found to be predominantly composed of martensitic laths (Fig. 9a). The lath and prior austenite grain boundaries are outlined by secondary precipitates which appear dark in the optical micrographs (Fig. 9b). A quantitative comparison between the parent metal from WA and WB was then carried out to evaluate the influence of PWHT. Fig. 10 shows EBSD maps that were collected from both
100 μm 100 μm
(a) (b)
20 μm 20 μm
(a) (b)

9
samples to compare the matrix microstructure and the grain boundary properties quantitatively. In Table 2 the low (2°-10°) and high (>10°) angle grain boundary lengths per unit area for both samples are compared.
Figure 9. Optical micrographs of the parent metal in the head portion of WA.
Figure 10. EBSD derived inverse pole figure (IPF) ((a), (c)) and grain boundary maps ((b), (d)) obtained from WA ((a) and (b)) and WB ((c) and (d)). In the grain boundary maps low angle grain boundaries (2°-10°) are shown in red and high angle grain boundaries (>10°) are shown in blue.
(a) (b)
(c) (d)
100 μm 25 μm
(a) (b)
10
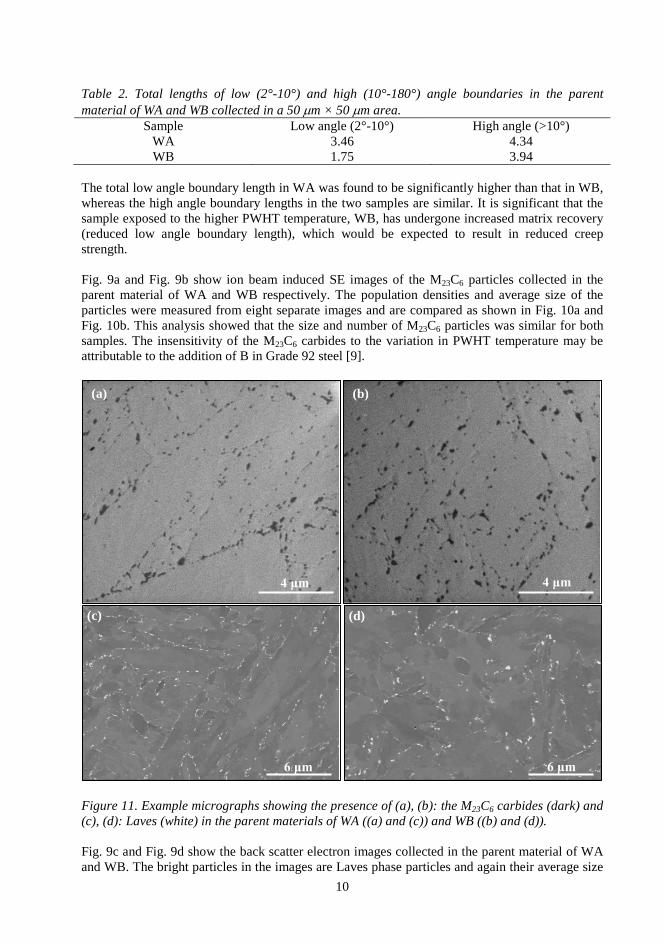
Table 2. Total lengths of low (2°-10°) and high (10°-180°) angle boundaries in the parent material of WA and WB collected in a 50 µm × 50 µm area.
Sample Low angle (2°-10°) High angle (>10°) WA 3.46 4.34 WB 1.75 3.94
The total low angle boundary length in WA was found to be significantly higher than that in WB, whereas the high angle boundary lengths in the two samples are similar. It is significant that the sample exposed to the higher PWHT temperature, WB, has undergone increased matrix recovery (reduced low angle boundary length), which would be expected to result in reduced creep strength. Fig. 9a and Fig. 9b show ion beam induced SE images of the M23C6 particles collected in the parent material of WA and WB respectively. The population densities and average size of the particles were measured from eight separate images and are compared as shown in Fig. 10a and Fig. 10b. This analysis showed that the size and number of M23C6 particles was similar for both samples. The insensitivity of the M23C6 carbides to the variation in PWHT temperature may be attributable to the addition of B in Grade 92 steel [9].
Figure 11. Example micrographs showing the presence of (a), (b): the M23C6 carbides (dark) and (c), (d): Laves (white) in the parent materials of WA ((a) and (c)) and WB ((b) and (d)). Fig. 9c and Fig. 9d show the back scatter electron images collected in the parent material of WA and WB. The bright particles in the images are Laves phase particles and again their average size
(a) (b)
(c) (d)
4 μm
6 μm
4 μm
6 μm

11
and number density were quantified and are compared as shown in Fig. 10c and Fig. 10d. This analysis showed that more Laves phase particles, but with a smaller average size are formed in WA compared with WB. This difference could be significant because an increased size of the Laves phase particles is expected to be a factor that contributes to the observed increased creep strain rate in the sample exposed to the PWHT at the higher temperature. In addition, the effect of the PWHT temperature on the fine intragranular MX/M2X carbonitrides is likely to be important and studies to quantify these differences are currently being undertaken. In addition the examination of weld samples at a lower fraction of life (which are free from large scale creep damage) are planned to provide an opportunity for the trends observed here to be verified.
Figure 12. Graphs comparing the number of M23C6 particles (in 141 µm2 area) (a), the average size of M23C6 (b), Laves phase number density (in 668 µm2 area) (c) and Laves phase average size (d) in the head portions of WA and WB. For M23C6 particles the average number of particle per image (141 µm2) and average size were determined from 8 images and the error bars display the standard deviation between the images. For the Laves particles the average number of particle per image (668 µm2) and average size was determined from 40 images and the error bars display the standard deviation between the images. The actual values of average size and particle number are also displayed in the columns of the graph. CONCLUSIONS Creep tests showed that the weld with the PWHT at 732°C had a significantly lower creep strain rate compared with the weld with the PWHT at 760°C. It was also found that the difference in
325 293
0
100
200
300
400
500
Part
icle
num
ber
per
imag
e
0.098 0.10
0
0.05
0.1
0.15
Ave
rage
size
(μm
)
420 364
0
100
200
300
400
500
Part
icle
num
ber
per
imag
e
0.14 0.17
0
0.05
0.1
0.15
0.2
Ave
rgae
size
(μm
)
WA WB
WA WB
WB WA
WA WB
(a) (b)
(c) (d)

12
creep strain rates was accompanied by a change in the location of primary creep damage; in the lower temperature PWHT it was in the HAZ whereas in the higher PWHT it was in the weld metal. To understand the influence of PWHT temperature on microstructure, the head portions of the two cross-weld samples were compared quantitatively. This showed increased degradation of the microstructure in the samples with the higher PWHT temperature. ACKNOWLEDGEMENTS The authors would like to thank EPRI for the support of this project. REFERENCES [1] Ennis, P. and Czyrska-Filemonowicz, A., “Recent Advances in Creep-resistant Steels for
Power Plant Applications,” Sādhanā, Vol. 28, (2003), pp. 709-730. [2] Abe, F., “Bainitic and Martensitic Creep-resistant Steels,” Current Opinion in Solid State and
Materials Science, Vol. 8, (2004), pp. 305-311. [3] Richardot, D., et al, The T92/P92 Book, Vallourec-Mannesmann tubes (Boulogne, 2000), pp.
44-46. [4] Messler, R. W., Principle of Welding: Process, Physics, Chemistry and Metallurgy, John
Wiley (New York, Chichester, 1999), pp. 127-130 [5] Albert, S., Matsui, M., Watanabe, T., Hongo, H., Kubo, K., Tabuchi, M., “Variation in the
Type IV Cracking Behaviour of a High Cr Steel Weld with Post Weld Heat Treatment,” International Journal of Pressure Vessels and Piping. Vol. 80, (2003), pp. 405-413.
[6] Cai, G., Andrén, H., Svensson, L., “Effect of Cooling After Welding on Microstructure and Mechanical Properties of 12 Pct Cr Steel Weld Metals,” Metallurgical and Materials Transactions: A, Vol. 28, (2007), pp. 1417-1428.
[7] Francis, J., Mazur, W., Bhadeshia, H., “Review Type IV Cracking in Ferritic Power Plant Steels,” Materials Science and Technology, Vol. 22, (2006), pp. 1387-1395.
[8] Kondo, M., Tabuchi, M., Tsukamoto, S., Yin, S., Abe, F., “Suppressing Type IV Failure via Modification of Heat Affected Zone Microstructures using High Boron Content in 9Cr Heat Resistant Steel Welded Joints,” Science and Technology of Welding & Joining, Vol. 11, (2006), pp. 216-223.
[9] Abe, F., Horiuchi, T., Taneike, M., Sawada, K., “Stabilization of Martensitic Microstructure in Advanced 9Cr Steel During Creep at High Temperature,” Materials Science and Engineering: A, Vol. 378, (2004), pp. 299-303.


![Visual Weld Inspection Guidelines Attachment A - …2].pdf · Visual Weld Inspection Guidelines Attachment A ... approved weld inspector shall document weld inspection results using](https://static.fdocuments.us/doc/165x107/5a78aa797f8b9a21538b97b6/visual-weld-inspection-guidelines-attachment-a-2pdfvisual-weld-inspection.jpg)


