The E ect of Banning A rmative Action on College ...
54
The Effect of Banning Affirmative Action on College Admissions Rules and Student Quality * Kate Antonovics Ben Backes UCSD AIR/CALDER April 10, 2013 Abstract This paper assesses the extent to which schools in the University of Califor- nia (UC) system were able to restore racial diversity among admitted students by changing their admissions rules to implicitly favor minorities after California’s ban on race-based affirmative action. Using administrative data from the UC from be- fore and after the ban on race-contingent admissions policies, we present evidence that UC campuses changed the weight given to SAT scores, grades and family back- ground characteristics after the end of affirmative action, and that these changes were able to substantially (though far from completely) offset the fall in minority admissions rate after the ban on affirmative action. In addition, we explore the pos- sible inefficiencies generated by these changes in the admissions process, and find that while the new admissions rules affected the composition of admitted students, it is not clear that overall student quality declined. These results have important implications in light of the declining number of public universities in the United States that practice race-based affirmative action. * Previously titled “Color-blind Affirmative Action and Student Quality.” We thank Rick Sander for his help obtaining our data. We are grateful to Julie Cullen, Peter Hinrichs, Cory Koedel, Mark Long, Valerie Ramey, and Tim Sass for helpful comments and discussion. 1
Transcript of The E ect of Banning A rmative Action on College ...

The Effect of Banning Affirmative Action on College
Admissions Rules and Student Quality∗
Kate Antonovics Ben Backes
UCSD AIR/CALDER
April 10, 2013
Abstract
This paper assesses the extent to which schools in the University of Califor-
nia (UC) system were able to restore racial diversity among admitted students by
changing their admissions rules to implicitly favor minorities after California’s ban
on race-based affirmative action. Using administrative data from the UC from be-
fore and after the ban on race-contingent admissions policies, we present evidence
that UC campuses changed the weight given to SAT scores, grades and family back-
ground characteristics after the end of affirmative action, and that these changes
were able to substantially (though far from completely) offset the fall in minority
admissions rate after the ban on affirmative action. In addition, we explore the pos-
sible inefficiencies generated by these changes in the admissions process, and find
that while the new admissions rules affected the composition of admitted students,
it is not clear that overall student quality declined. These results have important
implications in light of the declining number of public universities in the United
States that practice race-based affirmative action.
∗Previously titled “Color-blind Affirmative Action and Student Quality.” We thank Rick Sander for
his help obtaining our data. We are grateful to Julie Cullen, Peter Hinrichs, Cory Koedel, Mark Long,
Valerie Ramey, and Tim Sass for helpful comments and discussion.
1

1 Introduction
In the last two decades, public universities in a growing number of states have stopped
practicing race-based affirmative action in admissions as the result of various court rulings,
voter initiatives and administrative decisions. In addition, many now believe that the
United States Supreme Court will place further limits on affirmative action in higher
education when it issues its ruling on Fisher v. Texas later this year. Given that university
administrators remain committed to promoting racial diversity, a natural question is to
what extent racial diversity can be maintained using race-neutral policies that do not
run afoul of the legal and judicial constraints placed on traditional race-based affirmative
action. Another important question is whether these race-neutral policies are likely to
affect overall student quality. For example, if universities respond to bans on affirmative
action by giving an admissions advantage to students from economically disadvantaged
backgrounds, to what extent would this enable universities to promote racial diversity
and what impact would such policies have on the quality of admitted students?
Knowing the answers to these questions is important not only for understanding
the implications of eliminating race-based affirmative action but also because the U.S.
Supreme Court’s decision in Grutter v. Bollinger suggests that the use of race is only
permissible if there has been “serious, good faith consideration of workable race-neutral
alternatives that will achieve the diversity the university seeks.” Thus, the legality of
race-based affirmative action appears to hinge at least partly on the extent to which
universities are able to successfully achieve racial diversity using race-neutral policies,
and any evaluation of whether these policies are “workable” presumably must take into
consideration their costs and benefits in terms of their impact on student quality.
In an effort to answer these questions, this paper examines the end of race-based
affirmative action at the University of California (UC). The first threat to affirmative
action at the University of California came in July 1995, when the Board of Regents
of the University of California passed a resolution (SP-1), which stipulated that UCs
would discontinue considering race in admissions by the beginning of 1997. However,
2

in November 1996, California voters passed Proposition 209 (Prop 209), which banned
the use of racial preferences in university admissions. Prop 209 underwent various legal
challenges until the Supreme Court denied further appeals in November 1997. Thus, the
UC’s incoming class of 1998 was the first to be admitted under the statewide ban on
affirmative action.
Using administrative data from the University of California on every fall freshman
applicant from 1995-2006, we document how UC schools changed their admissions rules
after Prop 209 took effect, and we assess the extent to which these changes were able
to restore the admissions rate of under-represented minorities (URMs). In addition,
we investigate how the new admissions rules affected the average quality of the pool of
admitted students in terms of SAT scores, high school GPA and predicted performance
in college.
Consistent with previous research, we find that the removal of explicit racial pref-
erences dramatically lowered the admissions rates of URMs relative to non-URMs at
selective UC campuses. In addition, our results suggest that UC schools responded to
the ban on race-based affirmative action by lowering the weight given to SAT scores and
increasing the weight given to high school GPA and family background in determining
admissions. While these changes were unable to restore URM admission rates to their
pre-Prop 209 levels, our results suggest that the relative decline in URM admission rates
would have been substantially larger had UC schools not made these changes to their
admissions rules. At Berkeley, for example, our findings indicate that the the relative
drop in URMs’ admission rate after the Prop 209 would have been 5-8 percentage points
larger had Berkeley made no other changes to its admission process. In addition, we find
evidence that these changes in the admissions rules led to a meaningful shift in the com-
position of likely admits. Nonetheless, overall student quality (as measured by expected
first-year college GPA) appears to have remained quite stable.
This paper proceeds as follows. Section 2 discusses the related literature. Section 3
decribes our data and outlines how we estimate the changes in the admissions rule after
Prop 209. Section 4 presents our estimates of how the admissions rule changed at each of
3

the eight UC campuses, documents the extent to which these changes were able to restore
URMs’ admission rates to their pre-Prop 209 levels, and explores the short-term effects
of the changes in the estimated admissions rule on the quality of the pool of admitted
students. Finally, Section 5 concludes.
2 Related Literature
Here we consider the related literature on affirmative action in higher education, with a
particular focus on papers that address the effect of affirmative action on student quality.1
The theoretical literature on affirmative action draws a distinction between “color-
sighted affirmative action”, wherein there are explicit racial preferences in admissions,
and “color-blind affirmative action”, wherein colleges adopt race-neutral policies that
implicitly favor minorities by giving an admissions preference to students who possess
characteristics that are positively correlated with being a minority (see, for example,
Fryer et al. (2008) and Ray and Sethi (2010)). Both forms of affirmative action stand in
contrast to laissez-fair admission regimes in which race is not considered either explicitly
or implicitly.
Since bans on affirmative action only prohibit the use of explicit racial preferences, we
would expect universities to move from color-sighted to color-blind affirmative action in
the wake of such bans. Building a model of college admissions, Chan and Eyster (2003)
show that a move from color-sighted to color-blind affirmative action could decrease the
average quality of admitted students (regardless of race) since color-blind affirmative
action may lead admissions officers to partially ignore applicants’ qualifications. Ray and
Sethi (2010) additionally point out that color-blind affirmative action creates an incentive
for admissions officers to adopt admissions policies that are non-monotone in the sense
that, within each racial group, some students with lower scores are admitted while those
with higher scores are rejected. In this case, average student quality will necessarily be
1See Holzer and Neumark (2000) for a comprehensive review of the theoretical and empirical literature
on affirmative action more generally.
4

lower under color-blind relative to color-sighted affirmative action. Additionally, building
a model of college admissions with endogenous human capital investment, both Fryer et
al. (2008) and Hickman (2009) show that, relative to color-sighted affirmative action,
color-blind affirmative action may alter students’ incentives to invest in human capital.
Thus, the theoretical literature suggests that if colleges adopt color-blind affirmative
action policies after a ban on color-sighted affirmative action (like Prop 209), then this
may affect student quality both in the short run (by altering the pool of admitted stu-
dents) and in the long run (by changing incentives to invest in human capital). In this
paper, we focus on the short-run impact of Prop 209 on the quality of admitted students.
In a companion paper (Antonovics and Backes (2013a)), we examine the long-run impact
of Prop 209 on human capital investment.
Similar to our paper, Long and Tienda (2008) examine how the admissions process
changed at public universities in Texas after the affirmative action ban imposed by the
1996 Hopwood ruling, and like us find that these schools were unable to restore black
and Hispanic applicants’ share of admitted students using race-neutral alternatives. Our
paper differs from theirs, however, in a number of important ways. First, Long and
Tienda do not comprehensively assess the effect of the changes in the admissions process
on student quality. Table 4 of their paper indicates that the new admissions rules led to
a small reduction in the SAT/ACT scores of admitted students, but the paper does not
otherwise examine the quality of admitted students. Second, the policy change in Texas
was fundamentally different from that in California. In particular, a year after the Uni-
versity of Texas stopped using race-based affirmative action in admission, it introduced a
top 10% plan in which students in the top 10% of their high school class were guaranteed
admission to any Texas public university. California adopted a similar policy in 2001
(known as “Eligibility in a Local Context”), but this plan was significantly weaker than
Texas’s plan both in that the guarantee was only offered students in the top 4 percent
of their high school class, and California’s plan only guaranteed a student admission to
at least one UC school (and not necessarily the school of his or her choice–as was the
case in Texas). Thus, in California, the primary tool available to admissions offices to
5

increase minority admission rates after the ban on race-based affirmative action was to
change the weights given to various student characteristics in the admissions process.
Yagan (2012) also examines the effect of Prop 209 on the admission rates of minorities
relative to non-minorities, but focusses law school admissions at Berkeley and UCLA. He
finds that while black admission rates to these two schools fell dramatically after Prop
209, but his data do not allow him to fully examine the extent to which admissions officers
may have changed the weight given to various student characteristics in the admissions
process or the possible effect of these changes on overall student quality.
Finally, we note that one strand of the literature on affirmative action examines
whether affirmative action creates a mismatch between the quality of the average student
and the quality of the average minority (see, for example, Sander (2004), Rothstein and
Yoon (2008), and Arcidiacono et al. (2012)). The hypothesis is that aggressive affirmative
action programs destine minority admits to be at the bottom of their incoming class in
terms of academic credentials. As a result, the claim is that these students are likely to
do poorly (relative to their white peers) in college, which in turn may adversely affect
their later life outcomes. In this paper, we focus on student quality rather than on the
extent of mismatch between a student’s academic credentials and that of his or her peers.
3 Data and Empirical Strategy
We begin by investigating how each of the eight UC campuses changed its admissions rule
in response to Prop 209. To do so, we use administrative data on every fall freshman ap-
plicant to the UC from 1995-2006. The data contain individual-level information on each
student’s race, high school GPA, SAT scores, parental income, and parental education.2
2The measure of high school GPA available in the data is UC adjusted high school GPA, which gives
increased weight to AP courses, and only counts certain kinds of courses. SAT scores are reported at their
post-1995 re-centered values. Parental income and parental education are reported by the student, and
parental education is the highest education level of either parent. Unfortunately, gender is not included
in the data. Additional information about this publicly available dataset can be found in Antonovics
and Sander (2013).
6

In addition, the data report the campuses to which each student applied, the campuses
that accepted the applicant, and the campus at which the student enrolled, if any.3 Since
these data were provided by the University of California Office of the President, we refer
to them as the UCOP data.
In an effort to protect student privacy, the UC Office of the President collapsed many
important variables into descriptive categories before releasing the data. Thus, for exam-
ple, SAT scores are reported in seven bins and high school GPA is reported in four bins.
To facilitate comparison across these different measures of academic ability, we assign
the midpoint of each bin to be the student’s test score (or grade) and then standardize
so each is mean zero with a standard deviation of one. Parental income and parental
education are also reported in bins (11 for parental income and 8 for parental education),
and we again assign to each student the midpoint of his or her bin. Year of applica-
tion is grouped into three-year cohorts (1995-1997, 1998-2000, 2001-2003 and 2004-2006).
By design, the second three-year application cohort begins in 1998, the year the ban
on racial preferences was implemented. Finally, race is collapsed into four categories:
white, Asian, URM and other/unknown. The URM category includes Native Americans,
blacks, Chicanos and Latinos, which are the primary groups that received preferential
treatment based on race before Prop 209. The other/unknown category includes both
students who indicate that their race falls outside the categories used by the university,
as well as students who choose not to reveal their race (a group that grew substantially
after Prop 209 went into effect). In our empirical analysis, we compare admissions rates
of URMs with the combined set of whites, Asians and other/unknown. Our primary rea-
son for grouping students in the other/unknown category with whites and Asians is that
the average characteristics of students in the other/unknown group are very close to the
average characteristics of whites and Asians. Nonetheless, our results are not sensitive to
dropping the other/unknown group.
A potential problem with using a sample composed of UC applicants is that the
3The 8 UC campuses are Berkeley, Los Angeles, San Diego, Santa Barbara, Davis, Irvine, Santa Cruz
and Riverside.
7

application decision could itself be affected by the affirmative action ban, leading to
sample selection bias. While we are not aware of any direct evidence of changes in
application rates following affirmative action bans, a handful of studies have used data
from SAT test-takers to proxy for college application. For example, Dickson (2006),
finds that removal of affirmative action in Texas led to a decline in the share of minority
students taking either the ACT or SAT. On the other hand, Furstenberg (2010) shows
that the demographic characteristics of SAT takers are generally uncorrelated with the
introduction of the bans on affirmative action in California and Texas. In addition,
Antonovics and Backes (2013b) show that although URMs were less likely to send SAT
scores to selective UCs after Prop 209, the magnitude of the change is small, and there
is no evidence of a decline in URM score-sending to UC campuses generally.
Turning to our data on UC applicants, Table 1 presents basic summary statistics of the
UCOP data used in our analysis.4 As might be expected, relative to non-URMs, URMs
who applied to the UC have lower average SAT scores, lower average high school GPAs
and come from families with lower parental income and education. The bottom panel of
Table 1 also presents the admission rates for URMs and non-URMs at each of the eight
UC campuses for each admission cohort. As the table shows, there was a substantial drop
in URMs’ relative chances of admission starting with the 1998-2000 application cohort,
especially at the more selective UC schools.
Letting Ai = 1 if an applicant to a given school is admitted and Ai = 0 if the applicant
is not admitted, we estimate a probit model of the likelihood that a student who applies
to a given school is admitted. That is, we estimate
Pr(Ai = 1) = Φ(δ1URMi + X′iδ2 + δ3(URMi × Posti) + (X′
iPosti)δ4), (1)
where URMi is an indicator that takes on a value of one if the student is black, Hispanic
or Native American (with whites and Asians being the excluded group), Xi is a vector
of student-level characteristics used in determining admissions (SAT scores, high school
GPA, parental income and parental education) plus a constant term, Posti is an indicator
4Here we present the unstandardized versions of SAT scores and high school GPA.
8

that takes on a value of one if the student applied after Prop 209 went into effect (though
in practice, we include indicators for each of the three post-Prop 209 time periods: 1998-
2000, 2001-2003 or 2004-2006), and Φ(·) is the standard normal cumulative distribution
function. Our estimates of Equation (1) form the backbone of most of our empirical
analysis, with δ3 and δ4 capturing the change in the predictive power of race and other
student-level characteristics after the implementation of Prop 209.5
Of course, campuses have a much richer set of information about students than we
do. For example, we have no information on the quality of student essays or the ex-
tracurricular activities in which students are involved. Thus, we cannot estimate the true
admissions rule used at each campus. Nonetheless, to the extent that we know many of
the most salient pieces of information used in the admission process, we are broadly able
to characterize the admissions process for each application cohort and its changes over
time. In addition, we can use our estimates of Equation (1) to explore how changes in
the importance of SAT scores, high school GPA and family background characteristics in
predicting admissions affected a) the relative admission rates of URMs and b) the overall
quality of students admitted to each of the UC campuses.
[work this into previous paragraph] Rothstein (2004) shows that in the absence of a
rich set of controls, SAT scores serve in part as a proxy for student background charac-
teristics.
4 Results
Figure 1 presents our estimates of Equation (1), with the height of each bar representing
the average change in students’ probability of admission given a one-unit change in the
various predictors of admission both before and after the implementation of Prop 209.
We present our results graphically in order to facilitate comparisons across the different
UC campuses and across the different predictors of admissions.6
5Our results are qualitatively similar if Xi also includes intended major.6Appendix Table A.1 shows the marginal effects for a model in which we include separate indicators
for each post-Prop 209 application cohort.
9

As panel (a) suggests, substantial racial preferences were in place prior to Prop 209,
especially at the more selective UC schools. For example, at Berkeley, URMs were over
40 percentage points more likely to be admitted than similarly qualified non-URMs.
After Prop 209 the association between race and students’ likelihood of admission fell
dramatically. Interestingly, however, even after Prop 209 URMs were still more likely
than similarly qualified non-URMs to be admitted to the UC schools to which they
applied. At Berkeley, for example, in the 1998-2000 application cohort, URMs were
about 13 percentage points more likely to be admitted than similarly qualified non-URMs.
We note that this could arise even if admissions officers were not practicing race-based
affirmative action after Prop 209, but still used admissions rules that favored students
who possessed characteristics correlated with being a URM that we do not observe in our
data.
Panels (b)-(f) focus on the importance of various student academic and family back-
ground characteristics in predicting admissions and on how the importance of those fac-
tors changed after Prop 209. As Panel (b) shows, SAT math scores became a much less
important predictor of admissions after Prop 209, particularly at the more selective UC
schools. At Berkeley, for example, prior to Prop 209, a one standard deviation increase
in SAT math scores was associated with almost an 11 percentage point increase in a
student’s chances of admission. After Prop 209, however, this association fell to less
than 6 percentage points. At Berkeley and UCLA, the two schools that appear to have
practiced the most extensive affirmative action prior to Prop 209, we also see that SAT
verbal scores became a less important predictor of admission, though this pattern is not
consistent across all eight campuses. We also see in Panels (d)-(f) that UC adjusted high
school GPA generally became a more important predictor of admission. Prior to Prop
209, for example, a one standard deviation increase in UC adjusted high school GPA was
associated with a 14 percentage point increase in the probability of admission to Berkeley,
and by 2004-2006 this increased to 22 percentage points. In addition, we see evidence
that, all else equal, students from disadvantaged backgrounds were more likely to receive
offers of admission after Prop 209. That is, the negative association between admission
10

and both parental income and parental education grew substantially after Prop 209. At
Berkeley and UCLA, for example, the negative association between parental income and
admission doubled, and at UCSD it nearly tripled.
As mentioned above, using these coefficient estimates to make inferences about the
precise changes in the admissions rules at each school is complicated by the fact that we do
not observe all of the criteria used by admissions officers in determining admissions. For
example, the fact that high school GPA became a more important predictor of admission
could reflect the possibility that after Prop 209 an increased preference was given to
students from disadvantaged high schools, where applicants to the UC were likely to have
a relatively high GPA. Nonetheless, it is clear from Figure 1 that student characteristics
associated with SAT test scores (including SAT scores themselves) generally became
less important in determining admissions while those associated with high school GPA
and being from a disadvantaged background became more important in determining
admissions.
A natural question is whether the apparent changes in admissions process shown in
Figure 1 occurred because of Prop 209 or because admissions officers were responding to
changes in the relationship between student characteristics and college performance. For
example, if SAT scores became less predictive of college success and if high school GPA
became more predictive of college success, then we might expect admissions officers to
place less weight on SAT scores and more weight on high school GPA. We investigate
this possibility in Table 2 in which we present the coefficient estimates from a linear
regression of first-year college GPA on SAT scores, high school GPA, family background
characteristics and intended college major for students who enroll at each UC school
(except UCSC, where data on first-year college GPA are missing from 1995-2000).7 As the
table reveals, SAT scores actually became a more important predictor of first-year college
GPA, while high school GPA became a less important predictor of college performance,
particularly at the more selective UC schools.8 Thus, it is clear that neither the apparent
7Adding intended college major is important because students with high SAT math scores tend to
major in the sciences where first-year college GPA is relatively low.8Appendix tables A.4 and A.5 show results separately for URMs and non-URMs. Generally, the
11

decrease in the weight given to SAT scores nor the apparent increase in the weight placed
on high school GPA in determining admissions was driven by changes in how well SAT
scores and high school GPA predicted college performance. In fact, it seems likely that
the changes importance of SAT scores and high school GPA in predicting first-year college
GPA were driven by the changes in the admissions process after Prop 209 (rather than
visa versa).
Finally, it is worth pointing out that our results are largely consistent with the theo-
retical prediction in Fryer et al. (2008) that schools that are prohibited from using race
as an explicit criterion in admission will place less emphasis on traits that predict aca-
demic performance and more emphasis on social traits that proxy for race. In order see
which student characteristics proxy for race, Table 3 shows the coefficient estimates from
a linear regression of an indicator for whether a student is a URM on SAT scores, high
school GPA, parental income and parental education for all applicants to the UC system
from 1995-2006.9 As the table reveals, SAT math scores, parental education and parental
income all negatively predict whether a student is a URM, and consistent with Fryer et
al. (2008), Figure 1 indicates that students with high SAT math scores, high parental
education and high parental income were less likely to be admitted after Prop 209. Al-
though Table 3 also suggests that SAT verbal scores positively predict whether a student
is a URM, this finding hinges on the fact that Asians are included in the omitted racial
category. If Asians are dropped from the analysis, then the coefficient on SAT verbal
scores becomes negative and statistically significant. Thus, for example, decreasing the
weight placed on SAT verbal scores in the admissions process would tend to benefit both
URMs and Asians. In light of the fact that Asians are overrepresented at the UC relative
to California’s population, this may have created a tension at many UC campuses and
may explain why the importance of SAT verbal scores declined at some campuses and
increased at others.
results in Table 2 hold for both URMs and non-URMs, though the time trends are less obvious for
URMs.9The predictors of race are very consistent over time and across campuses.
12

The only finding that is at odds with the predictions of Fryer et al. (2008) is that we
find that high school GPA became a more important predictor of admission after Prop
209 even though Table 3 indicates that high school GPA is negatively associated with
being a URM. The magnitude of the relationship between high school GPA and being a
URM, however, is extremely small, suggesting that the increased emphasis UC schools
placed on high school GPA would have had a negligible negative impact on the admission
rate of URMs. In the next section, we address the combined impact of the change in the
weights given to SAT scores, high school GPA, parental education and parental income
and find that together they worked to signficantly increase the admission rate of URMs.
4.1 Changes in URMs’ Relative Admission Rates
How did the decreased importance of SAT scores and the increased importance of high
school GPA and family background affect the admission rates of students from different
racial groups? To examine this, we use the estimates from a modified version of Equation
(1) that includes indicators for each application cohort (rather than just an indicator for
post Prop 209) to simulate the changes over time in each student’s predicted probability
of admission due to the estimated changes in the admissions rules treating all students as
if they are white (that is, setting URM =0). Thus, any changes over time in a student’s
predicted probability of admission are driven by the changes in the weights given to
SAT scores, high school GPA and family background characteristics. We then compute
the change in the average predicted probability of admission for students in each racial
group in each time period, and determine how the predicted admission rate of URMs and
Asians changed relative to that of whites. In order to insure that the changes over time
are not driven by changes in the characteristics of the applicant pool, we conduct these
simulations only for students who apply in the 1995-1997 application cohort, though our
results are not sensitive to which application cohort we use.
Figure 2 shows the results of this simulation.10 The figure focusses on the top four
UCs (as measured by the average math SAT scores of admitted students), since these
10Table A.2 shows the numbers used to generate Figure 2.
13

schools practiced the most extensive affirmative action prior to Prop 209, and so were
the most constrained by the passage of Prop 209. As the figure indicates, the change
in the importance of SAT scores, high school GPA and family background in predicting
admission appears to have had a large, positive and statistically significant impact on
URMs’ relative chances of admission at each of the four schools. At Berkeley, for example,
we estimate that by 2004-2006, the decrease in the importance of SAT scores and the
increase in the importance of high school GPA and family background in predicting
admissions led URMs’ relative chances of admission to increase by 7 percentage points
compared to 1995-1997. In addition, this increase generally appears to have grown over
time. At UCLA for example, the increase in URMs’ relative chances of admission grew
from about 6 percentage points by 1998-2000 to about 11 percentage points by 2004-2006
(compared to 1995-1997). Thus, to the extent that campuses changed their admissions
rules to implicitly favor URMs after Prop 209, Figure 2 suggests that they got better at
doing so over time.
On one hand, the magnitude of these changes is quite small. For example, prior to
Prop 209, Figure 1 shows that URMs were approximately 42 percentage points more
likely to be admitted to Berkeley than similarly qualified non-URMs, and after Prop 209
this gap fell to about 11 percentage points. If we interpret this 31 percentage point drop
in URMs’ relative chances of admission as the direct result of the end of racial preferences
(with the admissions rule otherwise held constant), then it’s clear that the small increases
in URMs’ relative chances of admission shown in Figure 2 are nowhere near big enough
to restore URMs’ admissions rates to their pre Prop 209 levels. Indeed, we know there
was a large observed drop URMs’ relative chances of admission after Prop 209.
On the other hand, the fall in URMs’ relative admissions rates would have been sub-
stantially larger had UC schools not adopted race-neutral changes to their admissions
rules. For example, as Figure 2 suggests, the change in the weights given to SAT scores,
high school GPA and family background at Berkeley increased URMs’ chances of admis-
sion 5-8 percentage points relative to whites, so that Berkeley was able to restore roughly
16-26 percent of the 31 percentage point direct fall in URMs’ relative chances of admis-
14

sion. The magnitudes are also quite large in terms of raw numbers. For example, given
that there were approximately 20,000 in-state fall freshman URM applicants to Berkeley
in the 2004-2006 cohort, the 7 percentage point increase in URMs’ relative chances of
admission by 2004-2006 translates into about 1,400 additional URM admits over this
three-year time period (and about 40 percent of those who are admitted enroll).
Interestingly, the estimated changes in the admissions rule also appear to have pos-
itively affected Asians’ relative chances of admissions, though the magnitude is consid-
erably smaller than for URMs. For example, by 2004-2006, the estimated changes in
the admissions rule at Berkeley indicate an approximate 2 percentage point increase in
Asians’ relative chances of admission compared to 1995-1997. This increase is driven by
the fact that Asian applicants to the UC have lower parental income and parental educa-
tion than otherwise similar whites. Thus, the end of affirmative action benefitted Asians
applying to the UC both because the ban on affirmative action opened up more slots
for Asian applicants and because the admissions rules changed in ways that implicitly
favored Asians relative to whites.
Finally, as Table A.2 indicates, the changes in URMs’ and Asians’ predicted prob-
ability of admissions (relative to whites) at the remaining four campuses was generally
negative, though the magnitude of the decline was typically quite small.
4.2 The Effect on the Pool of Admitted Students
Any change in a college’s admission rule necessarily affects the pool of admitted students.
Given the apparent changes in UC schools’ admissions rules after Prop 209, an obvious
concern is whether the decreased emphasis on SAT scores (and/or their correlates) and the
increased emphasis on high school GPA and family background (and/or their correlates)
negatively affected the average quality of admitted students. Examining the changes in
the characteristics actual admits over time, however, is complicated by the fact that a)
the characteristics of applicant pool may have shifted over time and b) the UC schools
became more selective during this time period. For example, Table 1 shows that between
1995-1997 and 2004-2006, the probability of admission for non-URMs fell at every campus
15

except UC Riverside. Since average student quality is likely to increase as schools become
more selective, it is necessary to hold selectivity constant when trying assess the effect of
changes in a school’s admission rule on student quality.
With this in mind, we use the estimated admission rule for the 1995-1997 cohort to
identify the pool of likely URM and non-URM admits given the 1995-1997 admission
rate for each racial group. Then, using this same group of students (those who applied in
1995-1997), we identify the pool of likely admits using the 2004-2006 estimated admission
rule, but hold the admissions rate for URMs and non-URMs at their 1995-1997 level.11
Doing so allows us to assess the effect of the changes in the weights given to SAT scores,
high school GPA and family background on the pool of likely admits, holding constant
the characteristics of the applicant pool and overall selectivity.12
Table 4 presents our results for URMs.13 Beginning with the top row of Table 4, our
results suggest that the changes in the admissions rules between 1995-1997 and 2004-2006
led to a 20.4 percentage point drop in the average SAT math scores of likely admits. In
order to gauge the magnitude of this change, the third and fourth rows show the average
SAT math scores and the standard deviation of math SAT scores of likely admits using
the 1995-1997 estimated admission rule. As the table reveals, math SAT scores fall by
3.4 percent (relative to the 1995-1997 mean of 607.7), or about 29 percent of a standard
11In this section of the paper, the estimated admissions rule for each applicant cohort is obtained using
a modified version of Equation 1 that includes indicators for each applicant cohort and the interaction of
those indicators with student-level characteristics. This model generally fits the data very well. Appendix
Table A.3 shows the probability we correctly predict admits and non-admits for each school over the
entire 1995-2006 time period.12Our estimates are not sensitive to the application cohort we use to conduct these simulations. See the
appendix tables A.6-A.11 for results using the 1998-2000, 2001-2003 and 2004-2006 application cohorts.13We were unable to conduct this analysis for UCSC and UCR because we had missing values for a
larger fraction of applicants than were actually admitted (due to the very high admissions rate at both
schools), making it difficult to determine the pool of likely admits. Given the high admissions rate at
these schools, however, it is unlikely that the estimated changes in the admissions rule would have had
a large effect on the pool of admitted students (since most applicants were admitted, regardless of the
rule).
16

deviation (relative to the 1995-1997 standard deviation of 71.4). In addition, the drop in
SAT verbal scores is of a similar magnitude. At UCLA, UCSD and UCSB, the drop in
SAT math scores and SAT verbal scores is about half as large as the drop for Berkeley,
both in terms of the actual number of points and relative to the 1995-1997 mean and
standard deviation. At UCD and UCI, we also see a fall in SAT math and SAT verbal
scores among predicted admits, though the magnitude is quite small.
In addition, we find that the high school GPA of likely admits increases over time. As
Table 4 indicates, the average high school GPA of likely admits at Berkeley increased by
about 0.11 between 1995-1997 and 2004-2006, representing a 3 percent increase relative
to the mean high school GPA among predicted admits in 1995-1997, or about 27 percent
of a standard deviation. The increase in the high school GPA among likely admits at
UCLA is about half as large. We also see an increase at UCSD, though the magnitude
is quite small, and changes to the admissions rules at UCD, UCI and UCSB yielded no
discernible change in high school GPA.
In terms of family background characteristics, among likely URM admits at Berkeley,
the fraction of students who have at least one parent with a college degree declines by 6
percentage points (a 12 percent drop relative to the mean of 50 percent) and the average
family income declines by $3,500 (a 7 percent drop relative to the mean of $52,500).14 In-
terestingly, the change in family background characteristics brought about by the changes
in the admissions rule at UCLA, UCSD, UCD and UCSB is similar in magnitude to the
change at Berkeley.
Thus, several broad patterns emerge from Table 4. First, the most salient changes
in the pool of predicted admits occurs at the most selective UC schools. Second, bal-
ancing the moderate fall in the SAT scores was an increase in the high school GPA of
predicted URM admits. Finally, across all UC campuses, predicted URM admits increas-
ingly came from relatively disadvantaged backgrounds. Together, these results suggest
that the changes in UC’s admissions rules over time have lead to a meaningful shift in
the composition of the student body.
14To obtain these numbers from Table 4, note that $3,500=0.7 × 50k, and $52,500=1.05×50k.
17

As a way to partially examine the overall impact of these compositional changes on the
college performance of likely admits, we predict the first-year college GPA of likely admits
based on their academic and family background characteristics. In particular, using the
pool of students who enroll at each campus in the 1995-1997 cohort, we regress first-
year college GPA on SAT scores, high school GPA, parental income, parental education
and intended major.15 We then use the results of this regression to predict, for each
likely admit at each campus, expected first-year GPA. Table 4 presents the change in
predicted first-year college GPA of likely admits due to the changes in the weights given
to SAT scores, high school GPA and family background between 1995-1997 and 2004-
2006. Note that since the weights used to calculate predicted first-year college GPA are
the same for all students, this exercise is best seen as a way to summarize the changes
in SAT scores, high school GPA and family background characteristics brought about by
the changes in the admissions process over time. As the table suggests, there is almost
no change in expected first-year college GPA. The stability of first-year college GPA is
driven by the fact the deleterious effect of the fall in the SAT scores of predicted admits
is counterbalanced by the increase in high school GPA.
As a robustness check, we also examine whether the stability of predicted first-year
GPA is sensitive to whether we allow the predictors of first-year GPA to vary by appli-
cation cohort and race, and find no qualitative changes in our findings.16 In addition,
we also examine predicted cumulative college GPA, the predicted probability finishing a
bachelor’s degree, predicted time to degree (in quarters) and intended major at the time
of application, and again find no meaningful changes in any of these measures of college
performance.17
Table 5 shows a similar set of results for non-URMs. As the table reveals, the changes
15In appendix tables A.6-A.11, in which we reproduce tables 4 and 5 for the other application cohorts,
we predict first-year college GPA based on students who enroll in the corresponding application cohort
in order to verify that our results do not change even though the predictors of first-year GPA shift over
time.16See tables A.12-A.19.17See tables A.12-A.19.
18

in the characteristics of likely non-URM admits are very similar to the changes in the
characteristics of likely URM admits. Thus, the patterns revealed in Table 4 are not
specific to one racial group, but rather reflect broader changes in the characteristics of
predicted admits.
On possible problem with the analysis above is that our model may not adequately
capture all of the changes in the admissions rule after Prop 209. Thus, we also examine
how the academic ability of actual admits changes over time. Of course, changes in the
quality of actual admits may also reflect changes in the characteristics of the applicant
pool and changes in overall selectivity. Nonetheless, we feel it is a useful check on our
results. The best measure of academic ability in our data is a student’s index score. A
student’s index score is a weighted average of a student’s SAT math scores, SAT verbal
scores and high school GPA, where the weights were determined by regressing students’
first-year college GPA on these three variables. The index score was created by the UC
and is the only continuous measure of student quality in our data. Given the increase
in the overall selectivity of UC schools over this time period, one would expect average
index scores to increase over time. Indeed, Figure 3, which plots kernel density estimates
of the distribution of index stores among actual admits in each time period, reveals that
student quality increases over time. In addition, to the extent that schools relied more
heavily on family background characteristics in determining admissions after Prop 209,
you might also expect the variance of students’ index scores to also increase over time.
There is, however, little evidence of this in Figure 3. Indeed, in Table A.20, we see that
the log of the ratio of the 90th and 10th percentiles of the index distribution is stable over
this time period. Thus, consistent with our findings in Table 4, we do not find strong
evidence that students’ overall academic ability (as measured by the combination of SAT
scores and high school GPA) was negatively affected by the introduction of color-blind
affirmative action.
Several caveats are worth mentioning. First, although we do not find evidence of
a change in predicted college performance, we emphasize that this stability masks a
substantial compositional change in the student body, and it’s possible that this com-
19

positional change is important in ways we are unable to measure. In addition, although
the predicted college performance of the average likely admit remains stable after Prop
209, it possible that there were more substantial changes in the quality of the marginal
admit. Unfortunately, when we use our model to assess the changes in the quality of the
marginal admit (for example, by looking at student quality among the bottom 20 percent
of admits), our results are not stable across campuses and application cohorts, so we are
unable to draw any definitive conclusions.18
5 Summary
Preventing universities from using race as an explicit criterion in admissions does not
prevent universities from valuing diversity, and a natural response to bans on affirmative
action is the adoption of race-neutral policies that increase diversity by increasing the
admissions advantage given to students who possess characteristics that are correlated
with being from an underrepresented group. A natural question is the extent to which
these policies can restore racial diversity and how the changes to the admissions process
will affect the quality of admitted students. Indeed, a number of scholars have pointed out
that since bans on affirmative action give schools an incentive to place a greater weight
on non-academic factors in determining admissions (such as being from a disadvantaged
background), they could lower the quality of students who are admitted, regardless of
race.
In this paper, we provide evidence that UC schools responded to California’s ban
on affirmative action by decreasing the weight placed on SAT scores and increasing the
weight given to high school GPA and family background characteristics in determin-
ing admissions. In addition, we find that the changes in the weights given to student
characteristics substantially increased the fraction of minority students predicted to be
admitted. For example, although the admission rate of URMs remained well below its
18The instability of our estimates is likely driven by the small number of URM admits, especially after
Prop 209.
20
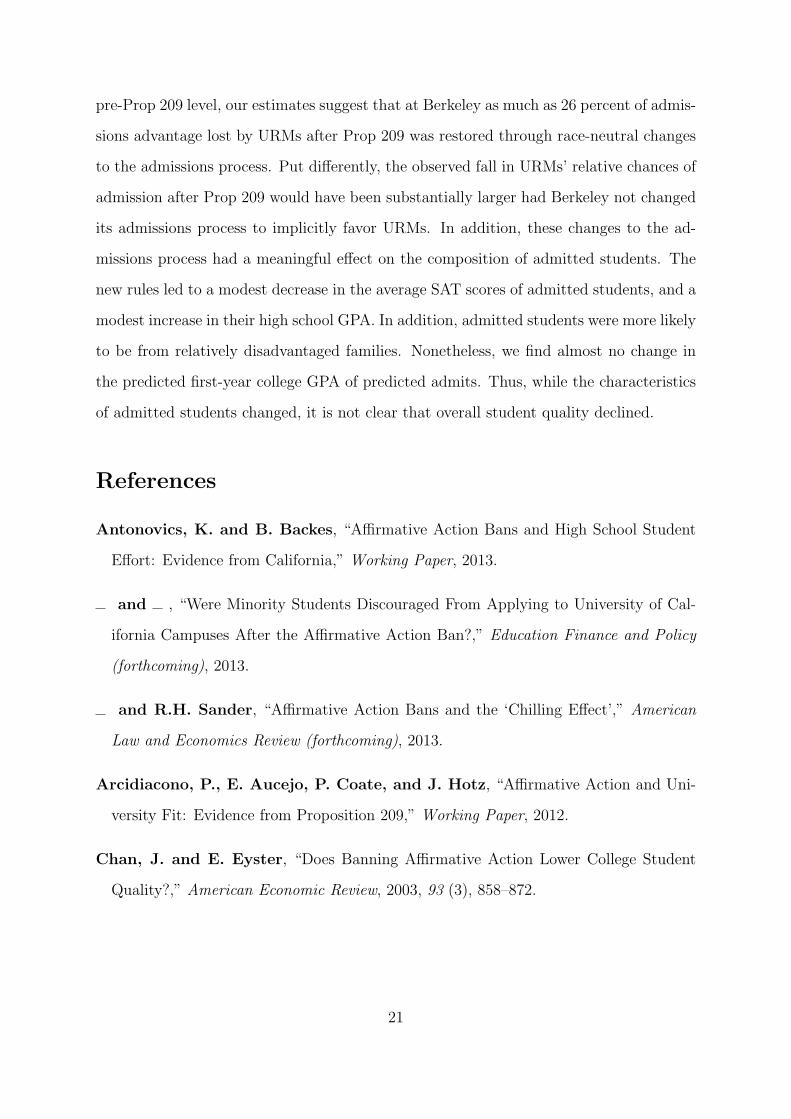
pre-Prop 209 level, our estimates suggest that at Berkeley as much as 26 percent of admis-
sions advantage lost by URMs after Prop 209 was restored through race-neutral changes
to the admissions process. Put differently, the observed fall in URMs’ relative chances of
admission after Prop 209 would have been substantially larger had Berkeley not changed
its admissions process to implicitly favor URMs. In addition, these changes to the ad-
missions process had a meaningful effect on the composition of admitted students. The
new rules led to a modest decrease in the average SAT scores of admitted students, and a
modest increase in their high school GPA. In addition, admitted students were more likely
to be from relatively disadvantaged families. Nonetheless, we find almost no change in
the predicted first-year college GPA of predicted admits. Thus, while the characteristics
of admitted students changed, it is not clear that overall student quality declined.
References
Antonovics, K. and B. Backes, “Affirmative Action Bans and High School Student
Effort: Evidence from California,” Working Paper, 2013.
and , “Were Minority Students Discouraged From Applying to University of Cal-
ifornia Campuses After the Affirmative Action Ban?,” Education Finance and Policy
(forthcoming), 2013.
and R.H. Sander, “Affirmative Action Bans and the ‘Chilling Effect’,” American
Law and Economics Review (forthcoming), 2013.
Arcidiacono, P., E. Aucejo, P. Coate, and J. Hotz, “Affirmative Action and Uni-
versity Fit: Evidence from Proposition 209,” Working Paper, 2012.
Chan, J. and E. Eyster, “Does Banning Affirmative Action Lower College Student
Quality?,” American Economic Review, 2003, 93 (3), 858–872.
21

Dickson, L.M., “Does Ending Affirmative Action in College Admissions Lower the
Percent of Minority Students Applying to College?,” Economics of Education Review,
2006, 25 (1), 109–119.
Fryer, R.G., G.C. Loury, and T. Yuret, “An Economic Analysis of Color-Blind
Affirmative Action,” Journal of Law, Economics, and Organization, 2008, 24 (2), 319.
Hickman, B.R., “Effort, Race Gaps, and Affirmative Action: A Game-Theoretic Anal-
ysis of College Admissions,” Working Paper, 2009.
Holzer, H. and D. Neumark, “Assessing Affirmative Action,” Journal of Economic
Literature, 2000, 38 (3), 483–568.
Long, Mark and Marta Tienda, “Winners and Losers: Changes in Texas University
Admissions Post-Hopwood ,” Educational Evaluation and Policy Analysis, 2008, 30 (3),
255–280.
Ray, D. and R. Sethi, “A Remark on Color-Blind Affirmative Action,” Journal of
Public Economic Theory, 2010, 12 (3), 399–406.
Rothstein, Jesse and Albert Yoon, “Mismatch in Law School,” NBER Working
Paper Series, 14275, August 2008.
Rothstein, Jesse M, “College performance predictions and the SAT,” Journal of Econo-
metrics, 2004, 121 (1), 297–317.
Sander, Richard, “A Systemic Analysis of Affirmative Action in American Law
Schools,” Stanford Law Review, 2004, 57 (2), 367–483.
Yagan, Danny, “Lawschool Admissions Under the Affirmative Action Ban,” Unpub-
lished Manuscript, 2012.
22

-‐0.05
0.00
0.05
0.10
0.15
0.20
0.25
0.30
0.35
0.40
0.45
Berkeley UCLA UCSD UCD UCI UCSB UCSC UCR
URM
1995-‐1997
1998-‐2000
2001-‐2003
2004-‐2006
(a)
-‐0.15
-‐0.10
-‐0.05
0.00
0.05
0.10
0.15
0.20
0.25
Berkeley UCLA UCSD UCD UCI UCSB UCSC UCR
SAT Math
1995-‐1997
1998-‐2000
2001-‐2003
2004-‐2006
(b)
-‐0.15
-‐0.10
-‐0.05
0.00
0.05
0.10
0.15
0.20
0.25
Berkeley UCLA UCSD UCD UCI UCSB UCSC UCR
SAT Verbal
1995-‐1997
1998-‐2000
2001-‐2003
2004-‐2006
(c)
-‐0.15
-‐0.10
-‐0.05
0.00
0.05
0.10
0.15
0.20
0.25
Berkeley UCLA UCSD UCD UCI UCSB UCSC UCR
HS GPA
1995-‐1997
1998-‐2000
2001-‐2003
2004-‐2006
(d)
-‐0.15
-‐0.10
-‐0.05
0.00
0.05
0.10
0.15
0.20
0.25
Berkeley UCLA UCSD UCD UCI UCSB UCSC UCR
Parents' Highest Degree At Least College
1995-‐1997
1998-‐2000
2001-‐2003
2004-‐2006
(e)
-‐0.15
-‐0.10
-‐0.05
0.00
0.05
0.10
0.15
0.20
0.25
Berkeley UCLA UCSD UCD UCI UCSB UCSC UCR
Parental Income/50k
1995-‐1997
1998-‐2000
2001-‐2003
2004-‐2006
(f)
Figure 1: The height of each bar shows the average change in students’ predicted probabil-
ity of admission given a one-unit change in the relevant student characteristic. Estimates
derived from a probit model of a student’s likelihood of admission. See text for details.
Standard errors are indicated by standard error bars.
23

0.00
0.02
0.04
0.06
0.08
0.10
0.12
1998-‐2000 2001-‐2003 2004-‐2006
Rela%ve Changes in Admission Rate Due to Non-‐Race Related Changes in Es%mated Admission Rule
(Base Time Period=1995-‐1997)
∆URM-‐∆White ∆Asian-‐∆White
(a) Berkeley
0.00
0.02
0.04
0.06
0.08
0.10
0.12
1998-‐2000 2001-‐2003 2004-‐2006
Rela%ve Changes in Admission Rate Due to Non-‐Race Related Changes in Es%mated Admission Rule
(Base Time Period=1995-‐1997)
∆URM-‐∆White ∆Asian-‐∆White
(b) UCLA
0.00
0.02
0.04
0.06
0.08
0.10
0.12
1998-‐2000 2001-‐2003 2004-‐2006
Rela%ve Changes in Admission Rate Due to Non-‐Race Related Changes in Es%mated Admission Rule
(Base Time Period=1995-‐1997)
∆URM-‐∆White ∆Asian-‐∆White
(c) UCSD
0.00
0.02
0.04
0.06
0.08
0.10
0.12
1998-‐2000 2001-‐2003 2004-‐2006
Rela%ve Changes in Admission Rate Due to Non-‐Race Related Changes in Es%mated Admission Rule
(Base Time Period=1995-‐1997)
∆URM-‐∆White ∆Asian-‐∆White
(d) UCD
Figure 2: The height of each bar shows the change in the predicted probability of admis-
sion for URMs relative to whites and for Asians relative to whites in each time period (rel-
ative to 1995-1997), treating all students as if they were white (that is, setting URM =0).
Simulation conducted for students in the 1995-1997 applicant cohort. Estimates derived
from a probit model of a student’s likelihood of admission. See text for details. Standard
errors indicated by standard error bars.
24

0.0
02.0
04.0
06.0
08
500 600 700 800 900 1000Index
1997-1997 1998-2000 2001-2003 2004-2006
(a) Berkeley
0.0
02.0
04.0
06.0
08
500 600 700 800 900 1000Index
1997-1997 1998-2000 2001-2003 2004-2006
(b) UCLA
0.0
02.0
04.0
06
500 600 700 800 900 1000Index
1997-1997 1998-2000 2001-2003 2004-2006
(c) UCSD
0.0
02.0
04.0
06
500 600 700 800 900 1000Index
1997-1997 1998-2000 2001-2003 2004-2006
(d) UCD
Figure 3: Shows the true distribution of index scores at different campuses for non-URMs
admitted during different time periods.
25
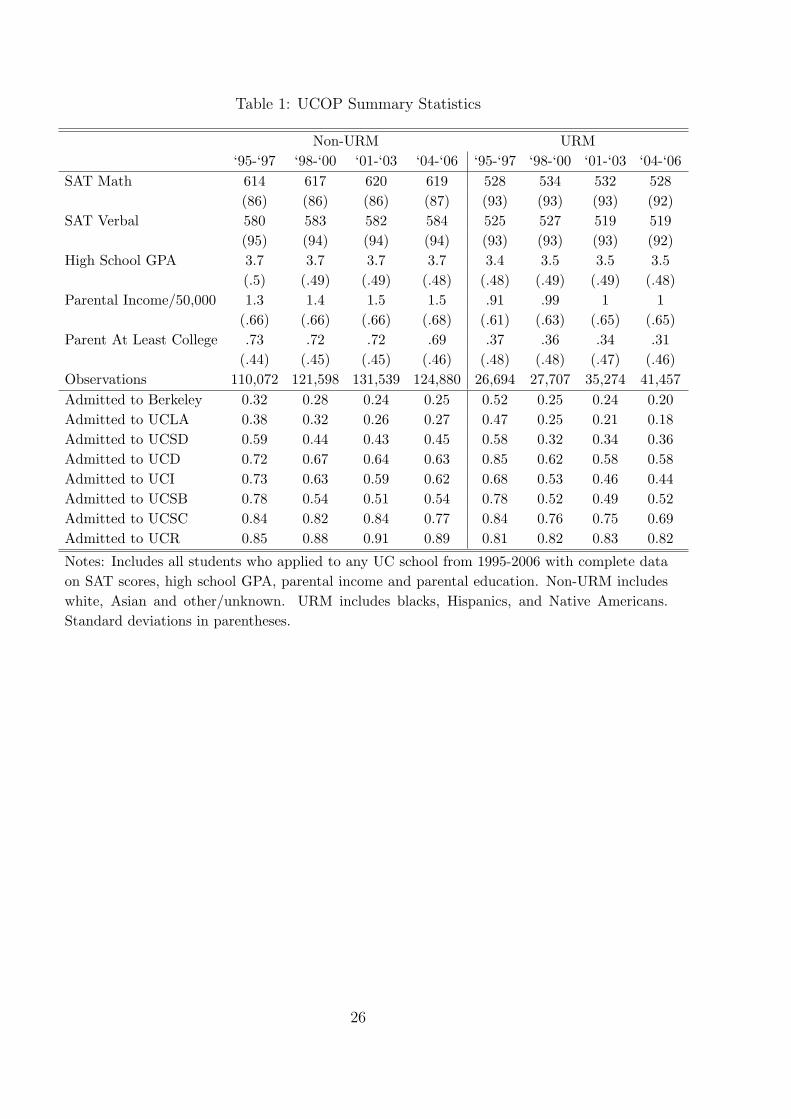
Table 1: UCOP Summary Statistics
Non-URM URM‘95-‘97 ‘98-‘00 ‘01-‘03 ‘04-‘06 ‘95-‘97 ‘98-‘00 ‘01-‘03 ‘04-‘06
SAT Math 614 617 620 619 528 534 532 528(86) (86) (86) (87) (93) (93) (93) (92)
SAT Verbal 580 583 582 584 525 527 519 519(95) (94) (94) (94) (93) (93) (93) (92)
High School GPA 3.7 3.7 3.7 3.7 3.4 3.5 3.5 3.5(.5) (.49) (.49) (.48) (.48) (.49) (.49) (.48)
Parental Income/50,000 1.3 1.4 1.5 1.5 .91 .99 1 1(.66) (.66) (.66) (.68) (.61) (.63) (.65) (.65)
Parent At Least College .73 .72 .72 .69 .37 .36 .34 .31(.44) (.45) (.45) (.46) (.48) (.48) (.47) (.46)
Observations 110,072 121,598 131,539 124,880 26,694 27,707 35,274 41,457Admitted to Berkeley 0.32 0.28 0.24 0.25 0.52 0.25 0.24 0.20Admitted to UCLA 0.38 0.32 0.26 0.27 0.47 0.25 0.21 0.18Admitted to UCSD 0.59 0.44 0.43 0.45 0.58 0.32 0.34 0.36Admitted to UCD 0.72 0.67 0.64 0.63 0.85 0.62 0.58 0.58Admitted to UCI 0.73 0.63 0.59 0.62 0.68 0.53 0.46 0.44Admitted to UCSB 0.78 0.54 0.51 0.54 0.78 0.52 0.49 0.52Admitted to UCSC 0.84 0.82 0.84 0.77 0.84 0.76 0.75 0.69Admitted to UCR 0.85 0.88 0.91 0.89 0.81 0.82 0.83 0.82
Notes: Includes all students who applied to any UC school from 1995-2006 with complete dataon SAT scores, high school GPA, parental income and parental education. Non-URM includeswhite, Asian and other/unknown. URM includes blacks, Hispanics, and Native Americans.Standard deviations in parentheses.
26

Table 2: Predictors of First-Year College GPA
Berkeley UCLA UCSD UCD UCI UCSB UCRSAT Math 0.05*** 0.10*** 0.10*** 0.10*** 0.10*** 0.07*** 0.04***
(0.01) (0.01) (0.01) (0.01) (0.01) (0.01) (0.01)SAT Math*(1998-2000) 0.01 -0.02** -0.00 0.00 -0.01 -0.02** -0.01
(0.01) (0.01) (0.01) (0.01) (0.01) (0.01) (0.02)SAT Math*(2001-2003) 0.06*** -0.03*** 0.03** 0.00 -0.01 -0.01 0.01
(0.01) (0.01) (0.01) (0.01) (0.01) (0.01) (0.01)SAT Math*(2004-2006) 0.04*** -0.05*** 0.01 0.01 -0.03*** 0.01 0.02
(0.01) (0.01) (0.01) (0.01) (0.01) (0.01) (0.01)SAT Verbal 0.09*** 0.11*** 0.09*** 0.11*** 0.15*** 0.12*** 0.10***
(0.01) (0.01) (0.01) (0.01) (0.01) (0.01) (0.01)SAT Verbal*(1998-2000) 0.01 0.01 0.01 0.02** -0.03*** 0.00 0.02
(0.01) (0.01) (0.01) (0.01) (0.01) (0.01) (0.02)SAT Verbal*(2001-2003) 0.03*** 0.03** 0.01 -0.01 -0.00 0.01 0.00
(0.01) (0.01) (0.01) (0.01) (0.01) (0.01) (0.02)SAT Verbal*(2006-2006) 0.04*** 0.02* 0.00 0.01 0.01 -0.00 0.03*
(0.01) (0.01) (0.01) (0.01) (0.01) (0.01) (0.02)HS GPA 0.23*** 0.23*** 0.23*** 0.23*** 0.23*** 0.22*** 0.24***
(0.01) (0.01) (0.01) (0.01) (0.01) (0.01) (0.01)HS GPA*(1998-2000) -0.03*** -0.02** 0.03** -0.01 -0.04*** 0.00 -0.02
(0.01) (0.01) (0.01) (0.01) (0.01) (0.01) (0.01)HS GPA*(2001-2003) -0.06*** -0.02 0.00 0.01 -0.01 0.00 0.01
(0.01) (0.01) (0.01) (0.01) (0.01) (0.01) (0.01)HS GPA*(2004-2006) -0.05*** -0.01 -0.02** 0.02** -0.02** 0.01 0.02
(0.01) (0.01) (0.01) (0.01) (0.01) (0.01) (0.01)Parent College 0.06*** 0.06*** 0.07*** 0.05*** 0.01 0.08*** 0.08***
(0.01) (0.01) (0.01) (0.01) (0.01) (0.01) (0.02)Parent College*(1998-2000) -0.01 -0.01 -0.01 -0.02 0.03 -0.00 -0.03
(0.02) (0.02) (0.02) (0.02) (0.02) (0.02) (0.03)Parent College*(2001-2003) -0.01 0.01 0.00 0.01 0.06*** -0.01 -0.03
(0.02) (0.02) (0.02) (0.02) (0.02) (0.02) (0.03)Parent College*(2004-2006) -0.00 0.01 -0.01 0.02 0.03 0.04** -0.01
(0.02) (0.02) (0.02) (0.02) (0.02) (0.02) (0.03)Income/50,000 0.02** 0.03*** 0.03*** 0.03*** 0.01 0.02*** 0.01
(0.01) (0.01) (0.01) (0.01) (0.01) (0.01) (0.02)Income/50,000*(1998-2000) 0.03** 0.01 0.03** -0.01 0.02 0.02 0.02
(0.01) (0.01) (0.01) (0.01) (0.01) (0.01) (0.02)Income/50,000*(2001-2003) 0.01 0.01 0.02 0.00 0.01 0.01 0.02
(0.01) (0.01) (0.01) (0.01) (0.01) (0.01) (0.02)Income/50,000*(2004-2006) 0.01 0.01 0.03** 0.00 0.01 0.01 0.04*
(0.01) (0.01) (0.01) (0.01) (0.01) (0.01) (0.02)
(continues)
27

Table 2: (continued)
Berkeley UCLA UCSD UCD UCI UCSB UCRScience Major -0.24*** -0.20*** -0.12*** -0.13*** -0.25*** -0.16*** -0.17***
(0.01) (0.01) (0.01) (0.01) (0.01) (0.01) (0.02)Science Major*(1998-2000) 0.03* -0.05*** -0.01 -0.02 -0.04** -0.06*** -0.01
(0.02) (0.02) (0.02) (0.02) (0.02) (0.02) (0.03)Science Major*(2001-2003) 0.03 -0.01 -0.01 -0.06*** -0.01 0.04** -0.00
(0.02) (0.02) (0.02) (0.02) (0.02) (0.02) (0.03)Science Major*(2004-2006) 0.04** 0.01 0.00 -0.01 0.03 0.02 0.01
(0.02) (0.02) (0.02) (0.02) (0.02) (0.02) (0.03)Soc Science Major 0.06*** -0.04*** 0.04** 0.09*** -0.07*** -0.01 0.06**
(0.02) (0.01) (0.02) (0.02) (0.02) (0.02) (0.03)Soc Science Major*(1998-2000) 0.02 -0.01 0.01 0.02 0.03 -0.02 0.02
(0.03) (0.02) (0.03) (0.03) (0.03) (0.02) (0.04)Soc Science Major*(2001-2003) 0.00 0.03 -0.00 -0.05** 0.08*** -0.03 -0.04
(0.03) (0.02) (0.02) (0.02) (0.02) (0.02) (0.04)Soc Science Major*(2004-2006) -0.00 0.06*** -0.00 -0.05** 0.06** -0.05** -0.06
(0.03) (0.02) (0.02) (0.02) (0.02) (0.02) (0.04)1998-2000 -0.04** 0.02 -0.07*** 0.01 -0.10*** -0.01 -0.10***
(0.02) (0.02) (0.02) (0.02) (0.02) (0.02) (0.03)2001-2003 0.01 0.05*** -0.06*** 0.06** -0.11*** -0.01 -0.08**
(0.02) (0.02) (0.02) (0.02) (0.02) (0.02) (0.03)2004-2006 0.02 0.06*** -0.01 0.03 -0.11*** -0.01 -0.08**
(0.02) (0.02) (0.02) (0.02) (0.02) (0.02) (0.03)Constant 2.88*** 2.82*** 2.75*** 2.74*** 3.00*** 2.89*** 2.92***
(0.01) (0.01) (0.02) (0.02) (0.02) (0.02) (0.02)Observations 34,065 39,533 34,767 40,171 35,972 34,881 27,099R-squared 0.20 0.25 0.18 0.23 0.20 0.26 0.18Mean GPA (1995-2006) 3.14 3.09 2.96 2.77 2.81 2.90 2.62
Notes: OLS estimates of first-year GPA. First-year GPA was not reported at UCSC for 1995-2000, so UCSC is omitted from this table.*** p<0.01, ** p<0.05, * p<0.10.
28

Table 3: Predictors of URM
URMSAT Math -0.124***
(0.001)SAT Verbal 0.010***
(0.001)HS GPA -0.004***
(0.001)Parent College -0.159***
(0.001)Income/50,000 -0.044***
(0.001)
Notes: Standard errors in parentheses.Shows the coefficients from a linear re-gression of an indicator for whether anapplicant to the UC was a URM onacademic achievement and family back-ground characteristics. The data spanthe years 1995-2006. *** significant atthe 99 percent level.
29

Table 4: Changes in the Characteristics of Predicted URM Admits
Berkeley UCLA UCSD UCD UCI UCSBSAT Math
Change -20.4*** -9.2*** -9.2*** -3.1** -1.6 -8.0***(1.4) (1.3) (1.5) (1.5) (1.6) (1.3)
Average 607.7 586.5 586.6 549.0 544.8 533.5(71.4) (75.1) (77.7) (85.7) (82.3) (81.3)
SAT VerbalChange -26.0*** -11.1*** -8.3*** -3.2** 0.8 -6.8***
(1.4) (1.3) (1.6) (1.5) (1.5) (1.3)Average 605.4 582.7 578.7 541.2 537.8 531.7
(73.2) (76.3) (82.7) (87.2) (80.3) (82.1)HS GPA
Change 0.11*** 0.05*** 0.02** 0.00 0.00 0.00(0.01) (0.01) (0.01) (0.01) (0.01) (0.01)
Average 3.83 3.80 3.76 3.52 3.56 3.41(0.41) (0.40) (0.41) (0.48) (0.46) (0.46)
Parent CollegeChange -0.06*** -0.06*** -0.06*** -0.04*** 0.00 -0.07***
(0.01) (0.01) (0.01) (0.01) (0.01) (0.01)Average 0.50 0.43 0.49 0.43 0.36 0.40
(0.50) (0.50) (0.50) (0.49) (0.48) (0.49)Income/50k
Change -0.07*** -0.06*** -0.09*** -0.06*** 0.02 -0.10***(0.01) (0.01) (0.01) (0.01) (0.01) (0.01)
Average 1.05 0.99 1.06 0.98 0.91 0.98(0.64) (0.63) (0.64) (0.63) (0.62) (0.63)
First-Year GPA†
Change 0.01*** -0.01* -0.01*** -0.01* -0.00 -0.02***(0.00) (0.00) (0.00) (0.01) (0.01) (0.00)
Average 2.98 2.87 2.81 2.60 2.73 2.68(0.24) (0.24) (0.25) (0.33) (0.29) (0.28)
Notes: “Change” shows the change in the characteristics of URMs predicted to be admittedin 2004-2006 relative to 1995-1997 due to the change in the weights given to SAT scores, highschool GPA, parental education and parental income in predicting admissions (standard error inparentheses). “Average” shows the average characteristics of URMs predicted to be admitted in1995-1997 (standard deviation in parentheses). Conducted for students in the 1995-1997 cohort,with the admission rate fixed at the 1995-1997 non-URM admission rate.† Predicted, see text for details.*** p<0.01, ** p<0.05, * p<0.10.
30
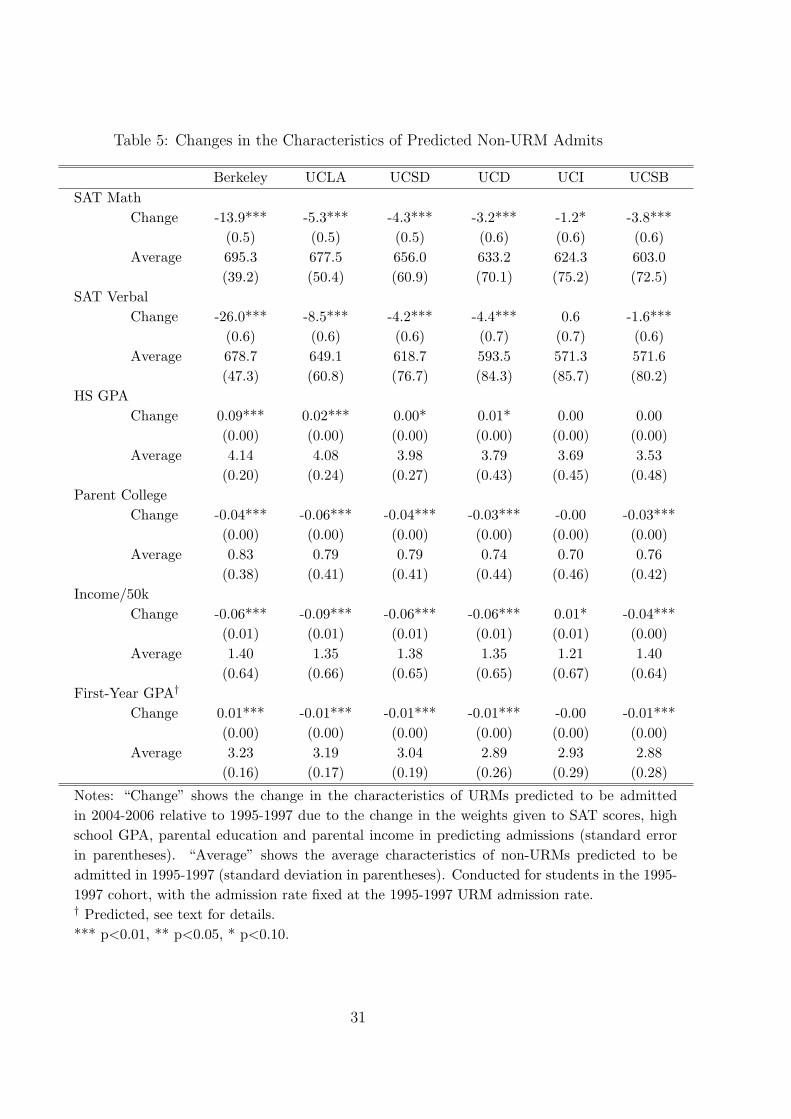
Table 5: Changes in the Characteristics of Predicted Non-URM Admits
Berkeley UCLA UCSD UCD UCI UCSBSAT Math
Change -13.9*** -5.3*** -4.3*** -3.2*** -1.2* -3.8***(0.5) (0.5) (0.5) (0.6) (0.6) (0.6)
Average 695.3 677.5 656.0 633.2 624.3 603.0(39.2) (50.4) (60.9) (70.1) (75.2) (72.5)
SAT VerbalChange -26.0*** -8.5*** -4.2*** -4.4*** 0.6 -1.6***
(0.6) (0.6) (0.6) (0.7) (0.7) (0.6)Average 678.7 649.1 618.7 593.5 571.3 571.6
(47.3) (60.8) (76.7) (84.3) (85.7) (80.2)HS GPA
Change 0.09*** 0.02*** 0.00* 0.01* 0.00 0.00(0.00) (0.00) (0.00) (0.00) (0.00) (0.00)
Average 4.14 4.08 3.98 3.79 3.69 3.53(0.20) (0.24) (0.27) (0.43) (0.45) (0.48)
Parent CollegeChange -0.04*** -0.06*** -0.04*** -0.03*** -0.00 -0.03***
(0.00) (0.00) (0.00) (0.00) (0.00) (0.00)Average 0.83 0.79 0.79 0.74 0.70 0.76
(0.38) (0.41) (0.41) (0.44) (0.46) (0.42)Income/50k
Change -0.06*** -0.09*** -0.06*** -0.06*** 0.01* -0.04***(0.01) (0.01) (0.01) (0.01) (0.01) (0.00)
Average 1.40 1.35 1.38 1.35 1.21 1.40(0.64) (0.66) (0.65) (0.65) (0.67) (0.64)
First-Year GPA†
Change 0.01*** -0.01*** -0.01*** -0.01*** -0.00 -0.01***(0.00) (0.00) (0.00) (0.00) (0.00) (0.00)
Average 3.23 3.19 3.04 2.89 2.93 2.88(0.16) (0.17) (0.19) (0.26) (0.29) (0.28)
Notes: “Change” shows the change in the characteristics of URMs predicted to be admittedin 2004-2006 relative to 1995-1997 due to the change in the weights given to SAT scores, highschool GPA, parental education and parental income in predicting admissions (standard errorin parentheses). “Average” shows the average characteristics of non-URMs predicted to beadmitted in 1995-1997 (standard deviation in parentheses). Conducted for students in the 1995-1997 cohort, with the admission rate fixed at the 1995-1997 URM admission rate.† Predicted, see text for details.*** p<0.01, ** p<0.05, * p<0.10.
31

A Appendix0
.002
.004
.006
500 600 700 800 900 1000Index
1997-1997 1998-2000 2001-2003 2004-2006
(a) UCI0
.002
.004
.006
500 600 700 800 900 1000Index
1997-1997 1998-2000 2001-2003 2004-2006
(b) UCSB
0.0
01.0
02.0
03.0
04.0
05
500 600 700 800 900 1000Index
1997-1997 1998-2000 2001-2003 2004-2006
(c) UCSC
0.0
01.0
02.0
03.0
04.0
05
500 600 700 800 900 1000Index
1997-1997 1998-2000 2001-2003 2004-2006
(d) UCR
Figure A.1: Shows the true distribution of index scores at different campuses for non-
URMs admitted during different time periods.
32

Table A.1: Predictors of Admission to Each UC Campuses
Berkeley UCLA UCSD UCD UCI UCSB UCSC UCR
(1) (2) (3) (4) (5) (6) (7) (8)
URM
1995-1997 0.42*** 0.34*** 0.21*** 0.23*** 0.09*** 0.10*** 0.06*** 0.03***
(0.00) (0.00) (0.00) (0.00) (0.00) (0.00) (0.00) (0.00)
1998-2000 0.13*** 0.11*** 0.05*** 0.06*** 0.06*** 0.10*** 0.02*** 0.00
(0.00) (0.00) (0.00) (0.00) (0.00) (0.00) (0.00) (0.00)
2001-2003 0.13*** 0.09*** 0.06*** 0.08*** 0.06*** 0.09*** 0.01** 0.00
(0.00) (0.00) (0.00) (0.00) (0.00) (0.00) (0.00) (0.00)
2004-2006 0.09*** 0.05*** 0.06*** 0.06*** 0.03*** 0.08*** 0.02*** 0.01**
(0.00) (0.00) (0.00) (0.00) (0.00) (0.00) (0.00) (0.00)
SAT Math
1995-1997 0.11*** 0.10*** 0.10*** 0.08*** 0.05*** 0.07*** 0.02*** 0.02***
(0.00) (0.00) (0.00) (0.00) (0.00) (0.00) (0.00) (0.00)
1998-2000 0.06*** 0.08*** 0.10*** 0.06*** 0.05*** 0.10*** 0.02*** 0.02***
(0.00) (0.00) (0.00) (0.00) (0.00) (0.00) (0.00) (0.00)
2001-2003 0.04*** 0.06*** 0.09*** 0.09*** 0.05*** 0.08*** 0.03*** 0.04***
(0.00) (0.00) (0.00) (0.00) (0.00) (0.00) (0.00) (0.00)
2004-2006 0.04*** 0.06*** 0.08*** 0.08*** 0.05*** 0.06*** 0.06*** 0.04***
(0.00) (0.00) (0.00) (0.00) (0.00) (0.00) (0.00) (0.00)
SAT Verbal
1995-1997 0.15*** 0.15*** 0.10*** 0.09*** 0.08*** 0.08*** 0.05*** 0.07***
(0.00) (0.00) (0.00) (0.00) (0.00) (0.00) (0.00) (0.00)
1998-2000 0.10*** 0.13*** 0.11*** 0.09*** 0.12*** 0.10*** 0.06*** 0.06***
(0.00) (0.00) (0.00) (0.00) (0.00) (0.00) (0.00) (0.00)
2001-2003 0.07*** 0.10*** 0.10*** 0.09*** 0.13*** 0.10*** 0.04*** 0.06***
(0.00) (0.00) (0.00) (0.00) (0.00) (0.00) (0.00) (0.00)
2004-2006 0.08*** 0.11*** 0.10*** 0.08*** 0.13*** 0.11*** 0.07*** 0.05***
(0.00) (0.00) (0.00) (0.00) (0.00) (0.00) (0.00) (0.00)
HS GPA
1995-1997 0.14*** 0.18*** 0.20*** 0.16*** 0.18*** 0.15*** 0.15*** 0.15***
(0.00) (0.00) (0.00) (0.00) (0.00) (0.00) (0.00) (0.00)
1998-2000 0.17*** 0.18*** 0.23*** 0.18*** 0.20*** 0.20*** 0.17*** 0.16***
(0.00) (0.00) (0.00) (0.00) (0.00) (0.00) (0.00) (0.00)
2001-2003 0.22*** 0.17*** 0.24*** 0.19*** 0.20*** 0.22*** 0.16*** 0.10***
(0.00) (0.00) (0.00) (0.00) (0.00) (0.00) (0.00) (0.00)
2004-2006 0.22*** 0.17*** 0.24*** 0.20*** 0.20*** 0.23*** 0.19*** 0.11***
(0.00) (0.00) (0.00) (0.00) (0.00) (0.00) (0.00) (0.00)
Income/50,000
1995-1997 -0.02*** -0.03*** -0.03*** -0.02*** -0.01** -0.03*** -0.01** -0.02***
(0.00) (0.00) (0.00) (0.00) (0.00) (0.00) (0.00) (0.00)
1998-2000 -0.04*** -0.05*** -0.08*** -0.06*** 0.00 -0.07*** -0.00 -0.00
(0.00) (0.00) (0.00) (0.00) (0.00) (0.00) (0.00) (0.00)
2001-2003 -0.04*** -0.07*** -0.11*** -0.09*** -0.00 -0.09*** 0.02*** 0.02***
(0.00) (0.00) (0.00) (0.00) (0.00) (0.00) (0.00) (0.00)
2004-2006 -0.04*** -0.06*** -0.11*** -0.11*** 0.02*** -0.08*** -0.01*** 0.02***
(0.00) (0.00) (0.00) (0.00) (0.00) (0.00) (0.00) (0.00)
Parent College
1995-1997 -0.03*** -0.03*** -0.03*** -0.02*** -0.00 -0.03*** -0.02*** -0.02***
(0.00) (0.00) (0.00) (0.00) (0.00) (0.00) (0.00) (0.00)
1998-2000 -0.04*** -0.05*** -0.06*** -0.05*** -0.01 -0.05*** -0.03*** -0.02***
(0.00) (0.00) (0.00) (0.00) (0.00) (0.00) (0.00) (0.00)
2001-2003 -0.05*** -0.07*** -0.10*** -0.06*** -0.02*** -0.08*** -0.03*** -0.02***
(0.00) (0.00) (0.00) (0.00) (0.00) (0.00) (0.00) (0.00)
2004-2006 -0.04*** -0.08*** -0.11*** -0.07*** -0.01*** -0.14*** -0.11*** -0.02***
(0.00) (0.00) (0.00) (0.00) (0.00) (0.00) (0.00) (0.00)
Notes: Each cell shows the average change in students’ likelihood of admission given a one-unit change in the relevant student characteristic. Estimates generated from a probit modelof a student’s likelihood of admission. See text for details. Standard errors in parentheses.*** p<0.01, ** p<0.05, * p<0.10.
33

Table A.2: Change in the Predicted Probability of Admission for Each Racial Group
Relative to 1995-1997, Treating All Students As White (URM =0)
Berkeley UCLA UCSD UCD UCI UCSB UCSC UCR(1) (2) (3) (4) (5) (6) (7) (8)
1998-2000URM -0.01*** -0.03*** -0.10*** 0.01 -0.13*** -0.27*** -0.04*** 0.01**
(0.00) (0.00) (0.00) (0.00) (0.00) (0.00) (0.01) (0.01)Asian -0.05*** -0.08*** -0.13*** -0.04*** -0.12*** -0.29*** -0.04*** 0.02***
(0.00) (0.00) (0.00) (0.00) (0.00) (0.00) (0.00) (0.00)White -0.06*** -0.09*** -0.15*** -0.06*** -0.10*** -0.29*** -0.04*** 0.02***
(0.00) (0.00) (0.00) (0.00) (0.00) (0.00) (0.00) (0.00)2001-2003URM -0.01*** -0.05*** -0.08*** -0.02*** -0.18*** -0.30*** -0.04*** 0.02***
(0.00) (0.00) (0.00) (0.00) (0.00) (0.00) (0.01) (0.01)Asian -0.07*** -0.12*** -0.14*** -0.05*** -0.18*** -0.34*** -0.02*** 0.04***
(0.00) (0.00) (0.00) (0.00) (0.00) (0.00) (0.00) (0.00)White -0.10*** -0.15*** -0.18*** -0.09*** -0.17*** -0.35*** -0.02*** 0.05***
(0.00) (0.00) (0.00) (0.00) (0.00) (0.00) (0.00) (0.00)2004-2006URM -0.02*** -0.05*** -0.08*** -0.03*** -0.21*** -0.29*** -0.13*** 0.00
(0.00) (0.00) (0.00) (0.00) (0.00) (0.00) (0.01) (0.01)Asian -0.07*** -0.14*** -0.14*** -0.07*** -0.21*** -0.36*** -0.12*** 0.02***
(0.00) (0.00) (0.00) (0.00) (0.00) (0.00) (0.00) (0.00)White -0.10*** -0.16*** -0.18*** -0.12*** -0.18*** -0.36*** -0.12*** 0.03***
(0.00) (0.00) (0.00) (0.00) (0.00) (0.00) (0.00) (0.00)Relative ChangesURM-White (1998-2000) 0.05*** 0.06*** 0.05*** 0.07*** -0.02*** 0.02*** -0.00 -0.01
(0.00) (0.00) (0.00) (0.00) (0.00) (0.00) (0.00) (0.00)URM-White (2001-2003) 0.08*** 0.11*** 0.09*** 0.07*** -0.02*** 0.05*** -0.02*** -0.03***
(0.00) (0.00) (0.00) (0.00) (0.00) (0.00) (0.00) (0.00)URM-White (2004-2006) 0.07*** 0.11*** 0.10*** 0.09*** -0.03*** 0.07*** -0.01** -0.03***
(0.00) (0.00) (0.00) (0.00) (0.00) (0.00) (0.00) (0.00)Asian-White (1998-2000) 0.01*** 0.02*** 0.02*** 0.02*** -0.02*** -0.00 -0.00* -0.00*
(0.00) (0.00) (0.00) (0.00) (0.00) (0.00) (0.00) (0.00)Asian-White (2001-2003) 0.03*** 0.03*** 0.04*** 0.04*** -0.02*** 0.00** -0.00 -0.01***
(0.00) (0.00) (0.00) (0.00) (0.00) (0.00) (0.00) (0.00)Asian-White (2004-2006) 0.02*** 0.03*** 0.04*** 0.05*** -0.03*** -0.00* -0.00 -0.00**
(0.00) (0.00) (0.00) (0.00) (0.00) (0.00) (0.00) (0.00)
Notes: Shows the change in predicted probability of admission for students in the 1995-1997 cohort due to thechanges in the estimated admissions rule between the relevant time period and 1995-1997, treating all studentsas if they were white (that is, setting URM =0). The final set of rows shows the relative changes for the differentracial groups in each time period. Estimates derived from a probit model of a student’s likelihood of admission.See text for details. Standard errors in parentheses. *** p<0.01, ** p<0.05, * p<0.10.
34

Table A.3: Probability That Our Model Correctly Predicts Admits and Non-Admits
Berkeley UCLA UCSD UCD UCI UCSB UCSC UCRAdmits 0.571 0.657 0.821 0.879 0.869 0.850 0.952 0.997Non-Admits 0.897 0.900 0.837 0.652 0.761 0.736 0.320 0.028
Notes: Shows the probability that our model correctly predicts admits and non-admits over the entiretime period we examine, 1995-2006.
35

Table A.4: Predictors of First-Year College GPA, Non-URMs
Berkeley UCLA UCSD UCD UCI UCSB UCRSAT Math 0.05*** 0.09*** 0.09*** 0.11*** 0.10*** 0.07*** 0.04***
(0.01) (0.01) (0.01) (0.01) (0.01) (0.01) (0.01)SAT Math*(1998-2000) 0.03* -0.02 0.01 -0.00 -0.00 -0.02* -0.01
(0.02) (0.01) (0.01) (0.01) (0.01) (0.01) (0.02)SAT Math*(2001-2003) 0.06*** -0.02 0.02 0.00 -0.02** -0.00 -0.01
(0.02) (0.01) (0.01) (0.01) (0.01) (0.01) (0.02)SAT Math*(2004-2006) 0.03* -0.05*** 0.01 0.01 -0.04*** 0.00 -0.00
(0.02) (0.01) (0.01) (0.01) (0.01) (0.01) (0.02)SAT Verbal 0.08*** 0.10*** 0.08*** 0.11*** 0.15*** 0.12*** 0.10***
(0.01) (0.01) (0.01) (0.01) (0.01) (0.01) (0.01)SAT Verbal*(1998-2000) 0.02* 0.01 0.01 0.03** -0.03*** 0.00 0.02
(0.01) (0.01) (0.01) (0.01) (0.01) (0.01) (0.02)SAT Verbal*(2001-2003) 0.04*** 0.03*** 0.02* -0.01 -0.00 0.00 -0.01
(0.01) (0.01) (0.01) (0.01) (0.01) (0.01) (0.02)SAT Verbal*(2006-2006) 0.06*** 0.03** 0.01 0.02 0.01 -0.02 0.02
(0.01) (0.01) (0.01) (0.01) (0.01) (0.01) (0.02)HS GPA 0.27*** 0.24*** 0.23*** 0.23*** 0.23*** 0.22*** 0.24***
(0.01) (0.01) (0.01) (0.01) (0.01) (0.01) (0.01)HS GPA*(1998-2000) -0.06*** -0.03*** 0.03** -0.01 -0.03*** 0.01 -0.01
(0.01) (0.01) (0.01) (0.01) (0.01) (0.01) (0.02)HS GPA*(2001-2003) -0.08*** -0.04*** -0.00 0.02** -0.01 0.02* 0.03*
(0.02) (0.01) (0.01) (0.01) (0.01) (0.01) (0.02)HS GPA*(2004-2006) -0.07*** -0.03** -0.02 0.03*** -0.01 0.03** 0.03*
(0.02) (0.01) (0.01) (0.01) (0.01) (0.01) (0.02)Parent College 0.03* 0.03* 0.06*** 0.06*** -0.01 0.08*** 0.08***
(0.02) (0.01) (0.02) (0.02) (0.01) (0.02) (0.03)Parent College*(1998-2000) 0.01 0.02 -0.00 -0.03 0.03 -0.01 -0.04
(0.02) (0.02) (0.02) (0.02) (0.02) (0.02) (0.03)Parent College*(2001-2003) 0.01 0.02 -0.00 -0.01 0.05** -0.02 -0.06*
(0.02) (0.02) (0.02) (0.02) (0.02) (0.02) (0.03)Parent College*(2004-2006) 0.02 0.01 -0.01 0.00 0.02 0.00 -0.06*
(0.02) (0.02) (0.02) (0.02) (0.02) (0.02) (0.03)Income/50,000 0.03*** 0.03*** 0.03*** 0.03** 0.01 0.03** 0.01
(0.01) (0.01) (0.01) (0.01) (0.01) (0.01) (0.02)Income/50,000*(1998-2000) 0.02 0.01 0.03* -0.00 0.02 0.01 0.03
(0.01) (0.01) (0.01) (0.02) (0.02) (0.01) (0.02)Income/50,000*(2001-2003) -0.01 0.00 0.01 0.01 0.00 0.01 0.01
(0.02) (0.01) (0.01) (0.02) (0.02) (0.02) (0.02)Income/50,000*(2004-2006) 0.00 0.01 0.02 -0.01 0.01 -0.00 0.03
(0.01) (0.01) (0.01) (0.02) (0.02) (0.02) (0.02)
(continues)
36

Table A.4: (continued)
Berkeley UCLA UCSD UCD UCI UCSB UCRScience Major -0.24*** -0.21*** -0.11*** -0.14*** -0.23*** -0.16*** -0.16***
(0.01) (0.01) (0.01) (0.01) (0.01) (0.01) (0.03)Science Major*(1998-2000) 0.03* -0.03* -0.02 -0.02 -0.05** -0.05** -0.01
(0.02) (0.02) (0.02) (0.02) (0.02) (0.02) (0.03)Science Major*(2001-2003) 0.03 -0.00 -0.01 -0.06*** -0.02 0.06*** -0.01
(0.02) (0.02) (0.02) (0.02) (0.02) (0.02) (0.03)Science Major*(2004-2006) 0.05** 0.04** 0.00 0.00 0.02 0.05** 0.01
(0.02) (0.02) (0.02) (0.02) (0.02) (0.02) (0.03)Soc Science Major 0.08*** -0.04** 0.05*** 0.10*** -0.06*** -0.02 0.10***
(0.02) (0.02) (0.02) (0.02) (0.02) (0.02) (0.04)Soc Science Major*(1998-2000) -0.02 -0.00 0.00 0.01 0.02 -0.01 -0.03
(0.03) (0.02) (0.03) (0.03) (0.03) (0.03) (0.05)Soc Science Major*(2001-2003) 0.00 0.04 -0.01 -0.07*** 0.06** -0.02 -0.05
(0.03) (0.02) (0.03) (0.03) (0.03) (0.03) (0.05)Soc Science Major*(2004-2006) -0.02 0.07*** -0.01 -0.06** 0.05* -0.04 -0.10**
(0.03) (0.02) (0.03) (0.03) (0.03) (0.03) (0.05)1998-2000 -0.04 -0.00 -0.06*** 0.02 -0.10*** 0.01 -0.09**
(0.03) (0.02) (0.02) (0.02) (0.02) (0.03) (0.04)2001-2003 0.02 0.05** -0.03 0.07*** -0.08*** 0.03 -0.02
(0.03) (0.02) (0.02) (0.02) (0.02) (0.03) (0.04)2004-2006 0.02 0.05** 0.00 0.05** -0.10*** 0.05* -0.02
(0.03) (0.02) (0.02) (0.02) (0.02) (0.03) (0.04)Constant 2.87*** 2.88*** 2.76*** 2.74*** 3.00*** 2.89*** 2.92***
(0.02) (0.02) (0.02) (0.02) (0.02) (0.02) (0.03)Observations 28,064 31,268 30,263 34,042 30,677 27,211 18,709R-squared 0.17 0.19 0.15 0.23 0.19 0.23 0.17Mean GPA (1995-2006) 3.20 3.16 3.00 2.81 2.84 2.97 2.67
Notes: OLS estimates of first-year GPA. First-year GPA was not reported at UCSC for 1995-2000, so UCSC is omitted from this table.*** p<0.01, ** p<0.05, * p<0.10.
37

Table A.5: Predictors of First-Year College GPA, URMs
Berkeley UCLA UCSD UCD UCI UCSB UCRSAT Math -0.01 0.08*** 0.06** 0.06** 0.08*** 0.08*** 0.03
(0.02) (0.01) (0.02) (0.02) (0.02) (0.02) (0.03)SAT Math*(1998-2000) -0.02 -0.01 -0.00 0.02 -0.05 -0.04 0.01
(0.03) (0.02) (0.04) (0.03) (0.03) (0.03) (0.03)SAT Math*(2001-2003) 0.07** -0.05** 0.06* -0.03 -0.01 -0.04 0.01
(0.03) (0.02) (0.03) (0.03) (0.03) (0.03) (0.03)SAT Math*(2004-2006) 0.07** -0.05** 0.03 0.00 -0.02 -0.01 0.03
(0.03) (0.02) (0.03) (0.03) (0.03) (0.02) (0.03)SAT Verbal 0.11*** 0.11*** 0.13*** 0.14*** 0.17*** 0.10*** 0.11***
(0.02) (0.01) (0.02) (0.02) (0.02) (0.02) (0.03)SAT Verbal*(1998-2000) -0.02 -0.01 0.01 -0.02 0.00 -0.01 0.00
(0.03) (0.02) (0.03) (0.03) (0.03) (0.03) (0.04)SAT Verbal*(2001-2003) -0.01 0.01 -0.06* -0.02 -0.01 0.03 0.03
(0.03) (0.02) (0.03) (0.03) (0.03) (0.03) (0.03)SAT Verbal*(2006-2006) -0.01 0.00 -0.03 -0.02 -0.01 0.03 0.05
(0.03) (0.02) (0.03) (0.03) (0.03) (0.02) (0.03)HS GPA 0.16*** 0.19*** 0.19*** 0.24*** 0.22*** 0.23*** 0.21***
(0.01) (0.01) (0.02) (0.02) (0.02) (0.02) (0.02)HS GPA*(1998-2000) 0.00 -0.00 0.07** -0.03 -0.07** -0.06*** -0.04
(0.02) (0.02) (0.03) (0.03) (0.03) (0.02) (0.03)HS GPA*(2001-2003) -0.02 0.04** 0.05 -0.05* -0.03 -0.04* -0.00
(0.02) (0.02) (0.03) (0.02) (0.03) (0.02) (0.03)HS GPA*(2004-2006) -0.02 0.03 -0.05* -0.01 -0.06** -0.03 0.01
(0.03) (0.02) (0.03) (0.02) (0.03) (0.02) (0.03)Parent College 0.11*** 0.09*** 0.07 0.02 0.06 0.05 0.05
(0.03) (0.02) (0.04) (0.04) (0.04) (0.03) (0.05)Parent College*(1998-2000) -0.01 -0.07 0.02 0.07 -0.01 0.02 0.02
(0.05) (0.04) (0.06) (0.05) (0.06) (0.05) (0.06)Parent College*(2001-2003) -0.01 0.01 0.05 0.10* 0.05 0.02 -0.00
(0.05) (0.04) (0.06) (0.05) (0.06) (0.05) (0.06)Parent College*(2004-2006) -0.05 0.03 0.04 0.08 0.00 0.09** 0.05
(0.05) (0.04) (0.06) (0.05) (0.06) (0.04) (0.06)Income/50,000 -0.01 0.05*** -0.01 0.04 0.03 0.01 0.01
(0.02) (0.02) (0.03) (0.03) (0.04) (0.02) (0.04)Income/50,000*(1998-2000) 0.09** 0.02 0.09** -0.02 -0.00 0.06* 0.01
(0.04) (0.03) (0.05) (0.04) (0.05) (0.04) (0.05)Income/50,000*(2001-2003) 0.05 0.01 0.08* 0.01 0.03 0.03 0.07
(0.04) (0.03) (0.04) (0.04) (0.05) (0.04) (0.05)Income/50,000*(2004-2006) 0.05 0.01 0.11*** 0.04 0.00 0.04 0.04
(0.04) (0.03) (0.04) (0.04) (0.04) (0.03) (0.05)
(continues)
38

Table A.5: (continued)
Berkeley UCLA UCSD UCD UCI UCSB UCRScience Major -0.23*** -0.16*** -0.19*** -0.08** -0.39*** -0.12*** -0.21***
(0.03) (0.02) (0.04) (0.04) (0.04) (0.03) (0.05)Science Major*(1998-2000) 0.01 -0.12*** 0.05 -0.04 -0.00 -0.14*** -0.01
(0.05) (0.04) (0.06) (0.05) (0.05) (0.05) (0.06)Science Major*(2001-2003) 0.05 -0.03 -0.02 -0.05 0.05 -0.03 0.01
(0.05) (0.04) (0.05) (0.05) (0.05) (0.04) (0.06)Science Major*(2004-2006) 0.00 -0.09** 0.01 -0.07 0.08 -0.08* 0.02
(0.05) (0.04) (0.05) (0.05) (0.05) (0.04) (0.05)Soc Science Major 0.02 -0.03 -0.03 0.06 -0.14*** 0.04 -0.01
(0.03) (0.03) (0.05) (0.05) (0.05) (0.03) (0.05)Soc Science Major*(1998-2000) 0.09 -0.01 0.03 0.09 0.10 -0.04 0.10
(0.06) (0.04) (0.07) (0.07) (0.07) (0.05) (0.07)Soc Science Major*(2001-2003) -0.01 0.04 0.04 0.01 0.17*** -0.05 0.01
(0.05) (0.04) (0.07) (0.06) (0.06) (0.05) (0.06)Soc Science Major*(2004-2006) 0.00 0.03 0.07 0.01 0.13** -0.08* 0.02
(0.05) (0.04) (0.06) (0.06) (0.06) (0.04) (0.06)1998-2000 -0.10** 0.06 -0.14** -0.02 -0.12* -0.07 -0.12*
(0.05) (0.04) (0.07) (0.06) (0.07) (0.05) (0.07)2001-2003 -0.00 0.01 -0.19*** -0.05 -0.23*** -0.06 -0.16**
(0.05) (0.04) (0.06) (0.06) (0.07) (0.05) (0.07)2004-2006 0.07 0.06 -0.09 -0.09 -0.16** -0.06 -0.13*
(0.05) (0.04) (0.06) (0.06) (0.06) (0.05) (0.07)Constant 2.84*** 2.73*** 2.77*** 2.71*** 3.02*** 2.87*** 2.91***
(0.03) (0.02) (0.05) (0.04) (0.05) (0.04) (0.05)Observations 6,001 8,265 4,504 6,129 5,295 7,670 8,390R-squared 0.14 0.21 0.20 0.21 0.21 0.21 0.15Mean GPA (1995-2006) 2.88 2.82 2.72 2.56 2.65 2.67 2.50
Notes: OLS estimates of first-year GPA. First-year GPA was not reported at UCSC for 1995-2000, so UCSC is omitted from this table.*** p<0.01, ** p<0.05, * p<0.10.
39

Table A.6: Changes in the Characteristics of Predicted URM Admits, Simulated for
1998-2000 Admissions Cohort
Berkeley UCLA UCSD UCD UCI UCSBSAT Math
Change -25.8*** -11.3*** -13.1*** -5.0*** 6.7*** -8.7***(1.6) (1.4) (1.5) (1.6) (1.6) (1.4)
Average 648.8 628.6 617.3 571.4 553.1 565.9(57.5) (63.0) (66.2) (82.6) (87.7) (82.6)
SAT VerbalChange -30.1*** -13.3*** -12.0*** -5.2*** 9.0*** -5.9***
(1.7) (1.5) (1.7) (1.6) (1.6) (1.5)Average 644.8 623.6 604.5 560.2 539.7 557.7
(59.1) (63.2) (72.8) (85.2) (88.3) (86.0)HS GPA
Change 0.12*** 0.04*** 0.01** 0.01 -0.04*** 0.01*(0.01) (0.01) (0.01) (0.01) (0.01) (0.01)
Average 4.06 4.05 4.02 3.72 3.78 3.73(0.27) (0.26) (0.26) (0.43) (0.37) (0.40)
Parent CollegeChange -0.10*** -0.11*** -0.12*** -0.04*** 0.02*** -0.06***
(0.01) (0.01) (0.01) (0.01) (0.01) (0.01)Average 0.55 0.48 0.49 0.43 0.33 0.41
(0.50) (0.50) (0.50) (0.50) (0.47) (0.49)Income/50k
Change -0.13*** -0.13*** -0.17*** -0.07*** 0.06*** -0.06***(0.02) (0.01) (0.01) (0.01) (0.01) (0.01)
Average 1.19 1.14 1.17 1.09 0.96 1.07(0.65) (0.65) (0.66) (0.65) (0.63) (0.67)
First-Year GPA†
Change -0.01*** -0.02*** -0.04*** -0.01** 0.01 -0.01***(0.00) (0.00) (0.00) (0.01) (0.00) (0.00)
Average 3.12 3.07 2.97 2.73 2.76 2.89(0.17) (0.18) (0.20) (0.27) (0.25) (0.24)
Notes: “Change” shows the change in the characteristics of URMs predicted to be admittedin 2004-2006 relative to 1995-1997 due to the change in the weights given to SAT scores, highschool GPA, parental education and parental income in predicting admissions (standard errorin parentheses). “Average” shows the average characteristics of non-URMs predicted to beadmitted in 1995-1997 (standard deviation in parentheses). Conducted for students in the 1998-2000 cohort, with the admission rate fixed at the 1998-2000 URM admission rate.† Predicted, see text for details.*** p<0.01, ** p<0.05, * p<0.10.
40

Table A.7: Changes in the Characteristics of Predicted Non-URM Admits, Simulated for
1998-2000 Admissions Cohort
Berkeley UCLA UCSD UCD UCI UCSBSAT Math
Change -15.2*** -5.6*** -5.0*** -2.6*** 0.5 -5.6***(0.4) (0.4) (0.4) (0.5) (0.6) (0.5)
Average 700.6 684.5 665.2 632.3 630.9 626.0(35.5) (47.1) (57.5) (71.3) (78.0) (70.7)
SAT VerbalChange -24.3*** -8.9*** -4.8*** -4.3*** 2.1*** -4.3***
(0.5) (0.5) (0.6) (0.6) (0.7) (0.6)Average 682.6 658.1 628.3 591.0 577.5 595.9
(45.1) (57.4) (72.1) (84.0) (87.3) (79.4)HS GPA
Change 0.10*** 0.02*** 0.00 0.01* -0.01** 0.01**(0.00) (0.00) (0.00) (0.00) (0.00) (0.00)
Average 4.14 4.11 4.03 3.77 3.75 3.77(0.20) (0.22) (0.25) (0.43) (0.42) (0.40)
Parent CollegeChange -0.04*** -0.07*** -0.05*** -0.03*** 0.01 -0.04***
(0.00) (0.00) (0.00) (0.00) (0.00) (0.00)Average 0.82 0.79 0.77 0.72 0.69 0.76
(0.38) (0.41) (0.42) (0.45) (0.46) (0.43)Income/50k
Change -0.08*** -0.10*** -0.08*** -0.05*** 0.02*** -0.05***(0.01) (0.01) (0.00) (0.00) (0.01) (0.00)
Average 1.49 1.45 1.44 1.42 1.27 1.47(0.64) (0.66) (0.65) (0.66) (0.68) (0.64)
First-Year GPA†
Change -0.00* -0.02*** -0.02*** -0.01*** 0.00 -0.01***(0.00) (0.00) (0.00) (0.00) (0.00) (0.00)
Average 3.25 3.21 3.08 2.87 2.89 3.03(0.15) (0.17) (0.19) (0.27) (0.26) (0.24)
Notes: “Change” shows the change in the characteristics of non-URMs predicted to be admittedin 2004-2006 relative to 1995-1997 due to the change in the weights given to SAT scores, highschool GPA, parental education and parental income in predicting admissions (standard errorin parentheses). “Average” shows the average characteristics of non-URMs predicted to beadmitted in 1995-1997 (standard deviation in parentheses). Conducted for students in the 1998-2000 cohort, with the admission rate fixed at the 1998-2000 non-URM admission rate.† Predicted, see text for details.*** p<0.01, ** p<0.05, * p<0.10.
41

Table A.8: Changes in the Characteristics of Predicted URM Admits, Simulated for
2001-2003 Admissions Cohort
Berkeley UCLA UCSD UCD UCI UCSBSAT Math
Change -24.8*** -12.4*** -13.5*** -4.6*** 4.8*** -12.6***(1.4) (1.3) (1.3) (1.3) (1.3) (1.2)
Average 646.6 635.9 614.3 571.2 563.6 572.7(57.8) (60.9) (66.9) (82.7) (82.7) (80.4)
SAT VerbalChange -32.2*** -14.4*** -11.7*** -5.7*** 8.2*** -10.1***
(1.6) (1.3) (1.4) (1.4) (1.3) (1.3)Average 637.9 625.5 594.4 553.7 543.4 556.3
(59.7) (62.6) (74.1) (86.0) (86.6) (85.8)HS GPA
Change 0.12*** 0.05*** 0.01** 0.01 -0.03*** 0.03***(0.00) (0.00) (0.00) (0.01) (0.01) (0.01)
Average 4.06 4.07 4.00 3.72 3.83 3.78(0.27) (0.25) (0.26) (0.43) (0.34) (0.38)
Parent CollegeChange -0.11*** -0.12*** -0.11*** -0.05*** 0.02*** -0.06***
(0.01) (0.01) (0.01) (0.01) (0.01) (0.01)Average 0.54 0.48 0.46 0.41 0.32 0.38
(0.50) (0.50) (0.50) (0.49) (0.47) (0.49)Income/50k
Change -0.14*** -0.15*** -0.17*** -0.08*** 0.05*** -0.08***(0.01) (0.01) (0.01) (0.01) (0.01) (0.01)
Average 1.27 1.23 1.20 1.14 1.04 1.12(0.67) (0.67) (0.67) (0.67) (0.65) (0.67)
First-Year GPA†
Change -0.03*** -0.02*** -0.04*** -0.01*** 0.01 -0.02***(0.00) (0.00) (0.00) (0.00) (0.00) (0.00)
Average 3.16 3.16 2.94 2.76 2.82 2.93(0.17) (0.18) (0.20) (0.28) (0.26) (0.24)
Notes: “Change” shows the change in the characteristics of URMs predicted to be admittedin 2004-2006 relative to 1995-1997 due to the change in the weights given to SAT scores, highschool GPA, parental education and parental income in predicting admissions (standard errorin parentheses). “Average” shows the average characteristics of non-URMs predicted to beadmitted in 1995-1997 (standard deviation in parentheses). Conducted for students in the 2001-2003 cohort, with the admission rate fixed at the 2001-2003 URM admission rate.† Predicted, see text for details.*** p<0.01, ** p<0.05, * p<0.10.
42

Table A.9: Changes in the Characteristics of Predicted Non-URM Admits, Simulated for
2001-2003 Admissions Cohort
Berkeley UCLA UCSD UCD UCI UCSBSAT Math
Change -10.6*** -6.3*** -5.8*** -2.7*** 1.5*** -5.9***(0.4) (0.4) (0.4) (0.5) (0.5) (0.5)
Average 702.8 692.0 669.8 635.8 635.8 636.1(33.3) (42.2) (55.9) (71.4) (76.8) (69.2)
SAT VerbalChange -20.9*** -10.2*** -5.6*** -4.0*** 3.0*** -4.5***
(0.5) (0.5) (0.5) (0.6) (0.6) (0.5)Average 686.1 668.1 630.0 591.6 585.7 601.4
(42.5) (52.7) (71.5) (83.7) (87.0) (78.1)HS GPA
Change 0.08*** 0.03*** 0.00 0.01** -0.01*** 0.01***(0.00) (0.00) (0.00) (0.00) (0.00) (0.00)
Average 4.16 4.14 4.03 3.77 3.79 3.83(0.19) (0.20) (0.25) (0.43) (0.41) (0.36)
Parent CollegeChange -0.05*** -0.08*** -0.05*** -0.03*** 0.01*** -0.04***
(0.00) (0.00) (0.00) (0.00) (0.00) (0.00)Average 0.84 0.80 0.76 0.73 0.70 0.76
(0.37) (0.40) (0.43) (0.45) (0.46) (0.42)Income/50k
Change -0.06*** -0.11*** -0.09*** -0.05*** 0.02*** -0.04***(0.01) (0.01) (0.00) (0.00) (0.00) (0.00)
Average 1.57 1.55 1.52 1.52 1.40 1.56(0.62) (0.64) (0.65) (0.65) (0.68) (0.63)
First-Year GPA†
Change -0.02*** -0.02*** -0.02*** -0.01*** 0.00* -0.01***(0.00) (0.00) (0.00) (0.00) (0.00) (0.00)
Average 3.32 3.31 3.09 2.92 2.96 3.10(0.14) (0.15) (0.19) (0.28) (0.28) (0.22)
Notes: “Change” shows the change in the characteristics of non-URMs predicted to be admittedin 2004-2006 relative to 1995-1997 due to the change in the weights given to SAT scores, highschool GPA, parental education and parental income in predicting admissions (standard errorin parentheses). “Average” shows the average characteristics of non-URMs predicted to beadmitted in 1995-1997 (standard deviation in parentheses). Conducted for students in the 2001-2003 cohort, with the admission rate fixed at the 2001-2003 non-URM admission rate.† Predicted, see text for details.*** p<0.01, ** p<0.05, * p<0.10.
43

Table A.10: Changes in the Characteristics of Predicted URM Admits, Simulated for
2004-2006 Admissions Cohort
Berkeley UCLA UCSD UCD UCI UCSBSAT Math
Change -30.3*** -14.9*** -11.8*** -8.3*** 1.5 -10.9***(1.4) (1.3) (1.2) (1.3) (1.1) (1.1)
Average 652.3 641.5 609.3 572.2 570.0 566.9(55.0) (59.7) (69.5) (80.5) (78.7) (81.7)
SAT VerbalChange -33.5*** -15.3*** -9.4*** -8.6*** 8.0*** -8.7***
(1.4) (1.3) (1.2) (1.3) (1.1) (1.1)Average 645.4 636.5 593.8 557.0 554.8 556.4
(56.5) (57.4) (73.5) (83.5) (81.4) (84.8)HS GPA
Change 0.13*** 0.05*** 0.01** 0.03*** -0.02*** 0.03***(0.00) (0.00) (0.00) (0.01) (0.00) (0.00)
Average 4.09 4.11 4.01 3.75 3.91 3.80(0.24) (0.22) (0.26) (0.40) (0.28) (0.36)
Parent CollegeChange -0.11*** -0.14*** -0.10*** -0.05*** 0.02*** -0.05***
(0.01) (0.01) (0.01) (0.01) (0.01) (0.01)Average 0.53 0.49 0.44 0.39 0.33 0.37
(0.50) (0.50) (0.50) (0.49) (0.47) (0.48)Income/50k
Change -0.15*** -0.17*** -0.15*** -0.09*** 0.04*** -0.07***(0.01) (0.01) (0.01) (0.01) (0.01) (0.01)
Average 1.31 1.28 1.22 1.15 1.08 1.12(0.68) (0.69) (0.68) (0.68) (0.66) (0.68)
First-Year GPA†
Change -0.04*** -0.03*** -0.03*** -0.01*** 0.01** -0.02***(0.00) (0.00) (0.00) (0.00) (0.00) (0.00)
Average 3.21 3.20 2.96 2.76 2.88 2.92(0.17) (0.17) (0.19) (0.29) (0.24) (0.26)
Notes: “Change” shows the change in the characteristics of URMs predicted to be admittedin 2004-2006 relative to 1995-1997 due to the change in the weights given to SAT scores, highschool GPA, parental education and parental income in predicting admissions (standard errorin parentheses). “Average” shows the average characteristics of non-URMs predicted to beadmitted in 1995-1997 (standard deviation in parentheses). Conducted for students in the 2004-2006 cohort, with the admission rate fixed at the 2004-2006 URM admission rate.† Predicted, see text for details.*** p<0.01, ** p<0.05, * p<0.10.
44

Table A.11: Changes in the Characteristics of Predicted Non-URM Admits, Simulated
for 2004-2006 Admissions Cohort
Berkeley UCLA UCSD UCD UCI UCSBSAT Math
Change -15.2*** -6.3*** -5.6*** -1.7*** -0.0 -5.0***(0.4) (0.4) (0.4) (0.5) (0.5) (0.5)
Average 701.3 690.1 666.9 633.1 636.0 634.9(35.0) (43.6) (57.5) (75.0) (77.2) (72.1)
SAT VerbalChange -21.6*** -11.1*** -5.4*** -2.8*** 1.3** -3.2***
(0.5) (0.5) (0.5) (0.6) (0.5) (0.5)Average 682.2 667.6 627.5 589.6 590.1 601.5
(44.9) (52.8) (72.6) (85.2) (85.3) (79.8)HS GPA
Change 0.09*** 0.03*** 0.00 0.00 -0.00 0.01**(0.00) (0.00) (0.00) (0.00) (0.00) (0.00)
Average 4.15 4.13 4.02 3.75 3.79 3.81(0.20) (0.21) (0.25) (0.44) (0.42) (0.39)
Parent CollegeChange -0.05*** -0.07*** -0.06*** -0.02*** 0.00 -0.04***
(0.00) (0.00) (0.00) (0.00) (0.00) (0.00)Average 0.82 0.79 0.75 0.70 0.69 0.74
(0.39) (0.41) (0.43) (0.46) (0.46) (0.44)Income/50k
Change -0.07*** -0.10*** -0.10*** -0.04*** 0.02*** -0.04***(0.01) (0.01) (0.00) (0.00) (0.00) (0.00)
Average 1.58 1.54 1.51 1.49 1.42 1.55(0.64) (0.65) (0.66) (0.67) (0.68) (0.65)
First-Year GPA†
Change -0.02*** -0.02*** -0.02*** -0.01*** 0.00 -0.01***(0.00) (0.00) (0.00) (0.00) (0.00) (0.00)
Average 3.34 3.30 3.10 2.91 2.95 3.10(0.14) (0.15) (0.18) (0.32) (0.27) (0.26)
Notes: “Change” shows the change in the characteristics of non-URMs predicted to be admittedin 2004-2006 relative to 1995-1997 due to the change in the weights given to SAT scores, highschool GPA, parental education and parental income in predicting admissions (standard errorin parentheses). “Average” shows the average characteristics of non-URMs predicted to beadmitted in 1995-1997 (standard deviation in parentheses). Conducted for students in the 2004-2006 cohort, with the admission rate fixed at the 2004-2006 non-URM admission rate.† Predicted, see text for details.*** p<0.01, ** p<0.05, * p<0.10.
45

Table A.12: Changes in Predicted College Outcomes of Predicted Non-URM Admits,
Simulated for the 1995-1997 Admissions Cohort
Berkeley UCLA UCSD UCD UCI UCSBPred. First-Year GPA
Change 0.02*** -0.01*** -0.01*** -0.01*** -0.00 -0.01***(0.00) (0.00) (0.00) (0.00) (0.00) (0.00)
Average 3.25 3.20 3.05 2.89 2.93 2.88(0.17) (0.16) (0.18) (0.27) (0.28) (0.27)
Pred. Cumulative GPAChange 0.01*** -0.01*** -0.01*** -0.01*** 0.00 -0.01***
(0.00) (0.00) (0.00) (0.00) (0.00) (0.00)Average 3.29 3.25 3.15 2.99 3.00 2.96
(0.14) (0.16) (0.19) (0.25) (0.23) (0.25)Pred. Bachelor
Change 0.01*** -0.00*** -0.00*** -0.00*** -0.00 -0.00***(0.00) (0.00) (0.00) (0.00) (0.00) (0.00)
Average 0.90 0.91 0.89 0.83 0.81 0.78(0.03) (0.03) (0.04) (0.06) (0.06) (0.07)
Pred. Time to DegreeChange 0.02*** 0.05*** 0.03*** 0.02*** -0.00 0.02***
(0.00) (0.00) (0.00) (0.00) (0.00) (0.00)Average 12.50 12.78 12.72 13.11 13.27 12.70
(0.21) (0.45) (0.41) (0.40) (0.36) (0.39)Intended Science
Change 0.00 0.01** 0.00 0.00 -0.00 0.00(0.00) (0.00) (0.00) (0.00) (0.00) (0.00)
Average 0.42 0.39 0.44 0.42 0.44 0.28(0.49) (0.49) (0.50) (0.49) (0.50) (0.45)
Intended Social ScienceChange -0.00 -0.00 -0.00 -0.00 0.00 0.00
(0.00) (0.00) (0.00) (0.00) (0.00) (0.00)Average 0.10 0.17 0.13 0.12 0.13 0.13
(0.30) (0.38) (0.34) (0.33) (0.34) (0.34)
Notes: “Change” shows the change in predicted outcome for non-URMs predicted to be admittedin 2004-2006 relative to 1995-1997 due to the change in the weights given to SAT scores, highschool GPA, parental education and parental income in predicting admissions (standard errorin parentheses). “Average” shows the average predicted outcome for non-URMs predicted tobe admitted in 1995-1997 (standard deviation in parentheses). Conducted for students in the1995-1997 cohort, with the admission rate fixed at the 1995-1997 non-URM admission rate.Each predicted measure of college performance is based on the performance of students in the1995-1997 cohort, additionally the predictors of first-year college GPA are allowed to vary byrace.*** p<0.01, ** p<0.05, * p<0.10.
46

Table A.13: Changes in Predicted College Outcomes of Predicted URM Admits, Simu-
lated for the 1995-1997 Admissions Cohort
Berkeley UCLA UCSD UCD UCI UCSBPred. First-Year GPA
Change 0.00 -0.01*** -0.01*** -0.01* 0.00 -0.02***(0.00) (0.00) (0.00) (0.01) (0.01) (0.00)
Average 2.91 2.82 2.74 2.59 2.73 2.65(0.19) (0.22) (0.23) (0.32) (0.31) (0.27)
Pred. Cumulative GPAChange 0.01*** -0.01 -0.02*** -0.01** 0.00 -0.02***
(0.00) (0.00) (0.00) (0.01) (0.00) (0.00)Average 3.06 2.98 2.94 2.72 2.85 2.78
(0.21) (0.22) (0.24) (0.30) (0.23) (0.26)Pred. Bachelor
Change 0.02*** 0.00*** -0.01*** -0.01*** -0.00 -0.01***(0.00) (0.00) (0.00) (0.00) (0.00) (0.00)
Average 0.84 0.84 0.82 0.75 0.76 0.72(0.08) (0.07) (0.07) (0.09) (0.07) (0.08)
Pred. Time to DegreeChange 0.02*** 0.04*** 0.03*** 0.02*** -0.00 0.04***
(0.01) (0.01) (0.01) (0.01) (0.01) (0.01)Average 12.92 13.35 13.00 13.48 13.45 12.93
(0.32) (0.53) (0.44) (0.45) (0.36) (0.38)Intended Science
Change 0.00 0.00 0.00 0.00 -0.00 0.00(0.01) (0.01) (0.01) (0.01) (0.01) (0.01)
Average 0.32 0.32 0.43 0.36 0.40 0.26(0.47) (0.47) (0.49) (0.48) (0.49) (0.44)
Intended Social ScienceChange 0.00 -0.00 0.00 0.00 0.00 0.00
(0.01) (0.01) (0.01) (0.01) (0.01) (0.01)Average 0.16 0.22 0.16 0.16 0.16 0.19
(0.36) (0.41) (0.37) (0.37) (0.37) (0.39)
Notes: “Change” shows the change in predicted outcome for URMs predicted to be admittedin 2004-2006 relative to 1995-1997 due to the change in the weights given to SAT scores, highschool GPA, parental education and parental income in predicting admissions (standard errorin parentheses). “Average” shows the average predicted outcome for non-URMs predicted to beadmitted in 1995-1997 (standard deviation in parentheses). Conducted for students in the 1995-1997 cohort, with the admission rate fixed at the 1995-1997 URM admission rate. Each predictedmeasure of college performance is based on the performance of students in the 1995-1997 cohort,additionally the predictors of first-year college GPA are allowed to vary by race.*** p<0.01, ** p<0.05, * p<0.10.
47

Table A.14: Changes in Predicted College Outcomes of Predicted Non-URM Admits,
Simulated for the 1998-2000 Admissions Cohort
Berkeley UCLA UCSD UCD UCI UCSBPred. First-Year GPA
Change -0.00*** -0.01*** -0.02*** -0.01*** 0.00 -0.01***(0.00) (0.00) (0.00) (0.00) (0.00) (0.00)
Average 3.26 3.22 3.08 2.87 2.90 3.04(0.15) (0.16) (0.19) (0.28) (0.25) (0.24)
Pred. Cumulative GPAChange 0.00** -0.01*** -0.02*** -0.01*** 0.00 -0.01***
(0.00) (0.00) (0.00) (0.00) (0.00) (0.00)Average 3.33 3.29 3.18 2.98 3.01 3.10
(0.14) (0.16) (0.18) (0.25) (0.21) (0.22)Pred. Bachelor
Change 0.01*** -0.00*** -0.00*** -0.00*** -0.00 -0.00***(0.00) (0.00) (0.00) (0.00) (0.00) (0.00)
Average 0.93 0.92 0.89 0.82 0.83 0.83(0.03) (0.03) (0.03) (0.06) (0.04) (0.05)
Pred. Time to DegreeChange 0.02*** 0.05*** 0.03*** 0.02*** -0.00* 0.02***
(0.00) (0.00) (0.00) (0.00) (0.00) (0.00)Average 12.37 12.54 12.72 12.92 13.04 12.39
(0.19) (0.40) (0.36) (0.36) (0.34) (0.35)Intended Science
Change -0.00 0.01 0.00 0.00 -0.00 -0.00(0.00) (0.00) (0.00) (0.00) (0.00) (0.00)
Average 0.43 0.39 0.42 0.41 0.43 0.28(0.49) (0.49) (0.49) (0.49) (0.50) (0.45)
Intended Social ScienceChange -0.00 -0.00 -0.00 -0.00 0.00 0.00
(0.00) (0.00) (0.00) (0.00) (0.00) (0.00)Average 0.11 0.18 0.15 0.12 0.14 0.12
(0.31) (0.38) (0.36) (0.33) (0.35) (0.33)
Notes: “Change” shows the change in predicted outcome for non-URMs predicted to be admittedin 2004-2006 relative to 1995-1997 due to the change in the weights given to SAT scores, highschool GPA, parental education and parental income in predicting admissions (standard errorin parentheses). “Average” shows the average predicted outcome for non-URMs predicted tobe admitted in 1995-1997 (standard deviation in parentheses). Conducted for students in the1998-2000 cohort, with the admission rate fixed at the 1998-2000 non-URM admission rate.Each predicted measure of college performance is based on the performance of students in the1998-2000 cohort, additionally the predictors of first-year college GPA are allowed to vary byrace.*** p<0.01, ** p<0.05, * p<0.10.
48

Table A.15: Changes in Predicted College Outcomes of Predicted URM Admits, Simu-
lated for the 1998-2000 Admissions Cohort
Berkeley UCLA UCSD UCD UCI UCSBPred. First-Year GPA
Change -0.00 -0.02*** -0.04*** -0.01** 0.01* -0.01***(0.00) (0.00) (0.00) (0.00) (0.00) (0.00)
Average 3.02 3.00 2.96 2.71 2.73 2.82(0.19) (0.19) (0.21) (0.25) (0.27) (0.21)
Pred. Cumulative GPAChange -0.00 -0.02*** -0.03*** -0.01*** 0.00 -0.01***
(0.00) (0.00) (0.00) (0.00) (0.00) (0.00)Average 3.23 3.17 3.08 2.85 2.92 2.99
(0.16) (0.17) (0.19) (0.24) (0.20) (0.22)Pred. Bachelor
Change 0.01*** -0.00*** -0.01*** -0.01*** -0.00 -0.00***(0.00) (0.00) (0.00) (0.00) (0.00) (0.00)
Average 0.90 0.89 0.86 0.78 0.81 0.80(0.05) (0.04) (0.04) (0.07) (0.05) (0.06)
Pred. Time to DegreeChange 0.05*** 0.07*** 0.07*** 0.02*** -0.01 0.02***
(0.01) (0.01) (0.01) (0.01) (0.01) (0.01)Average 12.62 12.80 12.87 13.10 13.16 12.56
(0.25) (0.43) (0.37) (0.36) (0.33) (0.35)Intended Science
Change -0.01 0.01 -0.00 -0.00 -0.00 -0.00(0.01) (0.01) (0.01) (0.01) (0.01) (0.01)
Average 0.37 0.37 0.42 0.38 0.41 0.26(0.48) (0.48) (0.49) (0.49) (0.49) (0.44)
Intended Social ScienceChange 0.00 0.00 0.01 -0.00 0.00 0.00
(0.01) (0.01) (0.01) (0.01) (0.01) (0.01)Average 0.14 0.20 0.17 0.16 0.16 0.17
(0.34) (0.40) (0.37) (0.36) (0.37) (0.38)
Notes: “Change” shows the change in predicted outcome for URMs predicted to be admittedin 2004-2006 relative to 1995-1997 due to the change in the weights given to SAT scores, highschool GPA, parental education and parental income in predicting admissions (standard errorin parentheses). “Average” shows the average predicted outcome for non-URMs predicted to beadmitted in 1995-1997 (standard deviation in parentheses). Conducted for students in the 1998-2000 cohort, with the admission rate fixed at the 1998-2000 URM admission rate. Each predictedmeasure of college performance is based on the performance of students in the 1998-2000 cohort,additionally the predictors of first-year college GPA are allowed to vary by race.*** p<0.01, ** p<0.05, * p<0.10.
49

Table A.16: Changes in Predicted College Outcomes of Predicted Non-URM Admits,
Simulated for the 2001-2003 Admissions Cohort
Berkeley UCLA UCSD UCD UCI UCSBPred. First-Year GPA
Change -0.01*** -0.02*** -0.02*** -0.01*** 0.00 -0.01***(0.00) (0.00) (0.00) (0.00) (0.00) (0.00)
Average 3.33 3.32 3.10 2.93 2.97 3.11(0.14) (0.15) (0.18) (0.29) (0.27) (0.22)
Pred. Cumulative GPAChange -0.01*** -0.02*** -0.02*** -0.01*** 0.00 -0.01***
(0.00) (0.00) (0.00) (0.00) (0.00) (0.00)Average 3.39 3.35 3.19 3.00 3.04 3.16
(0.13) (0.14) (0.19) (0.25) (0.22) (0.21)Pred. Bachelor
Change 0.00*** -0.00*** -0.01*** -0.00*** 0.00 -0.00***(0.00) (0.00) (0.00) (0.00) (0.00) (0.00)
Average 0.94 0.94 0.89 0.85 0.85 0.85(0.02) (0.02) (0.04) (0.06) (0.05) (0.04)
Pred. Time to DegreeChange 0.02*** 0.03*** 0.04*** 0.01*** -0.00** 0.01***
(0.00) (0.00) (0.00) (0.00) (0.00) (0.00)Average 12.19 12.30 12.51 12.64 12.61 12.13
(0.17) (0.31) (0.41) (0.32) (0.29) (0.27)Intended Science
Change 0.00 0.01* -0.00 0.00 -0.00 -0.00(0.00) (0.00) (0.00) (0.00) (0.00) (0.00)
Average 0.43 0.40 0.40 0.46 0.43 0.29(0.49) (0.49) (0.49) (0.50) (0.49) (0.45)
Intended Social ScienceChange -0.01* -0.00 -0.00 -0.00 0.00 0.00
(0.00) (0.00) (0.00) (0.00) (0.00) (0.00)Average 0.11 0.13 0.12 0.18 0.15 0.13
(0.31) (0.34) (0.33) (0.38) (0.35) (0.34)
Notes: “Change” shows the change in predicted outcome for non-URMs predicted to be admittedin 2004-2006 relative to 1995-1997 due to the change in the weights given to SAT scores, highschool GPA, parental education and parental income in predicting admissions (standard errorin parentheses). “Average” shows the average predicted outcome for non-URMs predicted tobe admitted in 1995-1997 (standard deviation in parentheses). Conducted for students in the2001-2003 cohort, with the admission rate fixed at the 2001-2003 non-URM admission rate.Each predicted measure of college performance is based on the performance of students in the2001-2003 cohort, additionally predicted first-year college GPA varies by race.*** p<0.01, ** p<0.05, * p<0.10.
50

Table A.17: Changes in Predicted College Outcomes of Predicted URM Admits, Simu-
lated for the 2001-2003 Admissions Cohort
Berkeley UCLA UCSD UCD UCI UCSBPred. First-Year GPA
Change -0.03*** -0.02*** -0.04*** -0.02*** 0.01** -0.01***(0.00) (0.00) (0.00) (0.00) (0.00) (0.00)
Average 3.08 3.09 2.84 2.71 2.75 2.85(0.15) (0.18) (0.22) (0.23) (0.29) (0.21)
Pred. Cumulative GPAChange -0.02*** -0.02*** -0.04*** -0.01*** 0.00 -0.01***
(0.00) (0.00) (0.00) (0.00) (0.00) (0.00)Average 3.24 3.22 3.05 2.87 2.94 3.02
(0.16) (0.16) (0.20) (0.25) (0.21) (0.22)Pred. Bachelor
Change 0.00 -0.00*** -0.02*** -0.01*** -0.00 -0.00***(0.00) (0.00) (0.00) (0.00) (0.00) (0.00)
Average 0.91 0.91 0.85 0.81 0.82 0.82(0.04) (0.03) (0.05) (0.07) (0.05) (0.05)
Pred. Time to DegreeChange 0.06*** 0.03*** 0.07*** 0.02*** -0.01 0.01***
(0.01) (0.01) (0.01) (0.01) (0.00) (0.00)Average 12.44 12.44 12.67 12.78 12.73 12.27
(0.24) (0.32) (0.42) (0.33) (0.29) (0.28)Intended Science
Change -0.00 0.00 0.00 0.00 -0.00 -0.00(0.01) (0.01) (0.01) (0.01) (0.01) (0.01)
Average 0.34 0.33 0.36 0.41 0.37 0.24(0.47) (0.47) (0.48) (0.49) (0.48) (0.43)
Intended Social ScienceChange -0.01 0.00 0.00 -0.00 -0.00 0.00
(0.01) (0.01) (0.01) (0.01) (0.01) (0.01)Average 0.17 0.19 0.17 0.23 0.20 0.19
(0.38) (0.39) (0.37) (0.42) (0.40) (0.39)
Notes: “Change” shows the change in predicted outcome for URMs predicted to be admittedin 2004-2006 relative to 1995-1997 due to the change in the weights given to SAT scores, highschool GPA, parental education and parental income in predicting admissions (standard errorin parentheses). “Average” shows the average predicted outcome for non-URMs predicted to beadmitted in 1995-1997 (standard deviation in parentheses). Conducted for students in the 2001-2003 cohort, with the admission rate fixed at the 2001-2003 URM admission rate. Each predictedmeasure of college performance is based on the performance of students in the 2001-2003 cohort,additionally predicted first-year college GPA varies by race.*** p<0.01, ** p<0.05, * p<0.10.
51
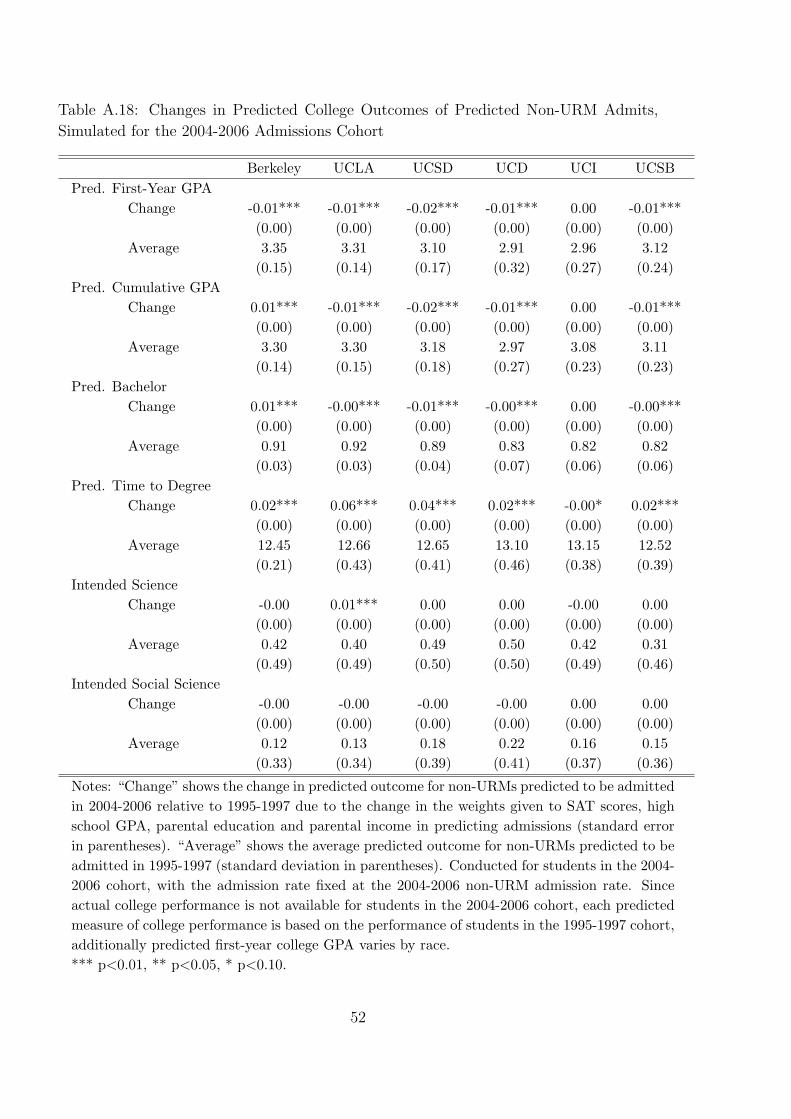
Table A.18: Changes in Predicted College Outcomes of Predicted Non-URM Admits,
Simulated for the 2004-2006 Admissions Cohort
Berkeley UCLA UCSD UCD UCI UCSBPred. First-Year GPA
Change -0.01*** -0.01*** -0.02*** -0.01*** 0.00 -0.01***(0.00) (0.00) (0.00) (0.00) (0.00) (0.00)
Average 3.35 3.31 3.10 2.91 2.96 3.12(0.15) (0.14) (0.17) (0.32) (0.27) (0.24)
Pred. Cumulative GPAChange 0.01*** -0.01*** -0.02*** -0.01*** 0.00 -0.01***
(0.00) (0.00) (0.00) (0.00) (0.00) (0.00)Average 3.30 3.30 3.18 2.97 3.08 3.11
(0.14) (0.15) (0.18) (0.27) (0.23) (0.23)Pred. Bachelor
Change 0.01*** -0.00*** -0.01*** -0.00*** 0.00 -0.00***(0.00) (0.00) (0.00) (0.00) (0.00) (0.00)
Average 0.91 0.92 0.89 0.83 0.82 0.82(0.03) (0.03) (0.04) (0.07) (0.06) (0.06)
Pred. Time to DegreeChange 0.02*** 0.06*** 0.04*** 0.02*** -0.00* 0.02***
(0.00) (0.00) (0.00) (0.00) (0.00) (0.00)Average 12.45 12.66 12.65 13.10 13.15 12.52
(0.21) (0.43) (0.41) (0.46) (0.38) (0.39)Intended Science
Change -0.00 0.01*** 0.00 0.00 -0.00 0.00(0.00) (0.00) (0.00) (0.00) (0.00) (0.00)
Average 0.42 0.40 0.49 0.50 0.42 0.31(0.49) (0.49) (0.50) (0.50) (0.49) (0.46)
Intended Social ScienceChange -0.00 -0.00 -0.00 -0.00 0.00 0.00
(0.00) (0.00) (0.00) (0.00) (0.00) (0.00)Average 0.12 0.13 0.18 0.22 0.16 0.15
(0.33) (0.34) (0.39) (0.41) (0.37) (0.36)
Notes: “Change” shows the change in predicted outcome for non-URMs predicted to be admittedin 2004-2006 relative to 1995-1997 due to the change in the weights given to SAT scores, highschool GPA, parental education and parental income in predicting admissions (standard errorin parentheses). “Average” shows the average predicted outcome for non-URMs predicted to beadmitted in 1995-1997 (standard deviation in parentheses). Conducted for students in the 2004-2006 cohort, with the admission rate fixed at the 2004-2006 non-URM admission rate. Sinceactual college performance is not available for students in the 2004-2006 cohort, each predictedmeasure of college performance is based on the performance of students in the 1995-1997 cohort,additionally predicted first-year college GPA varies by race.*** p<0.01, ** p<0.05, * p<0.10.
52

Table A.19: Changes in Predicted College Outcomes of Predicted URM Admits, Simu-
lated for the 2004-2006 Admissions Cohort
Berkeley UCLA UCSD UCD UCI UCSBPred. First-Year GPA
Change -0.03*** -0.03*** -0.04*** -0.02*** 0.01*** -0.02***(0.00) (0.00) (0.00) (0.00) (0.00) (0.00)
Average 3.14 3.12 2.90 2.71 2.82 2.85(0.16) (0.19) (0.21) (0.27) (0.25) (0.26)
Pred. Cumulative GPAChange 0.01* -0.02*** -0.03*** -0.01*** 0.00 -0.01***
(0.00) (0.00) (0.00) (0.00) (0.00) (0.00)Average 3.22 3.20 3.08 2.85 3.03 2.98
(0.16) (0.16) (0.18) (0.25) (0.20) (0.22)Pred. Bachelor
Change 0.01*** -0.00** -0.01*** -0.01*** -0.00 -0.00***(0.00) (0.00) (0.00) (0.00) (0.00) (0.00)
Average 0.89 0.90 0.86 0.79 0.82 0.77(0.04) (0.03) (0.05) (0.07) (0.05) (0.07)
Pred. Time to DegreeChange 0.05*** 0.10*** 0.05*** 0.03*** -0.01 0.02***
(0.01) (0.01) (0.01) (0.01) (0.01) (0.01)Average 12.65 12.92 12.79 13.30 13.22 12.71
(0.26) (0.48) (0.42) (0.46) (0.36) (0.39)Intended Science
Change -0.00 0.01 -0.00 0.00 -0.01 -0.00(0.01) (0.01) (0.01) (0.01) (0.01) (0.01)
Average 0.37 0.37 0.45 0.48 0.40 0.29(0.48) (0.48) (0.50) (0.50) (0.49) (0.45)
Intended Social ScienceChange 0.00 -0.00 0.01 -0.00 0.00 0.00
(0.01) (0.01) (0.01) (0.01) (0.01) (0.01)Average 0.16 0.17 0.21 0.25 0.20 0.21
(0.36) (0.37) (0.41) (0.43) (0.40) (0.40)
Notes: “Change” shows the change in predicted outcome for URMs predicted to be admittedin 2004-2006 relative to 1995-1997 due to the change in the weights given to SAT scores, highschool GPA, parental education and parental income in predicting admissions (standard errorin parentheses). “Average” shows the average predicted outcome for non-URMs predicted tobe admitted in 1995-1997 (standard deviation in parentheses). Conducted for students in the2004-2006 cohort, with the admission rate fixed at the 2004-2006 URM admission rate. Sinceactual college performance is not available for students in the 2004-2006 cohort, each predictedmeasure of college performance is based on the performance of students in the 1995-1997 cohort,additionally predicted first-year college GPA varies by race.*** p<0.01, ** p<0.05, * p<0.10.
53

Table A.20: Log of the Ratio of the 90th and 10th Percentile of Students’ Index Scores
Among Admitted Non-URMs, by Admission Cohort
Berkeley UCLA UCSD UCD UCI UCSB UCSC UCRLog 90/10 Ratio: 1995-1997 0.19 0.19 0.21 0.25 0.28 0.26 0.31 0.33Log 90/10 Ratio: 1998-2000 0.20 0.20 0.20 0.26 0.26 0.25 0.29 0.30Log 90/10 Ratio: 2001-2003 0.21 0.21 0.21 0.26 0.25 0.24 0.29 0.30Log 90/10 Ratio: 2004-2006 0.19 0.20 0.21 0.26 0.25 0.23 0.28 0.30
Notes: Shows the log of the ratio of the 90th and 10th percentile of students’ index score fornon-URMs admitted during different time periods.
54