The dynamic response of clamped rectangular Y-frame and ... · The dynamic response of clamped...
30
1 The dynamic response of clamped rectangular Y-frame and corrugated core sandwich plates V. Rubino, V. S. Deshpande 1 and N.A. Fleck Cambridge University, Engineering Department, Trumpington Street, Cambridge, CB2 1PZ, U.K. Abstract The dynamic response of fully clamped, monolithic and sandwich plates of equal areal mass has been measured by loading rectangular plates over a central patch with metal foam projectiles. All plates are made from AISI 304 stainless steel, and the sandwich topologies comprise two identical face-sheets and either Y-frame or corrugated cores. The resistance to shock loading is quantified by the permanent transverse deflection at mid-span of the plates as a function of projectile momentum. At low levels of projectile momentum both types of sandwich plate deflect less than monolithic plates of equal areal mass. However, at higher levels of projectile momentum, the sandwich plates tear while the monolithic plates remain intact. Three-dimensional finite element (FE) calculations adequately predict the measured responses, prior to the onset of tearing. These calculations reveal that the accumulated plastic strains in the front face of the sandwich plates exceed those in the monolithic plates. These high plastic strains lead to failure of the front face sheets of the sandwich plates at lower values of projectile momentum than for the equivalent monolithic plates. Keywords: Sandwich plates, dynamic response, FE simulations, lattice materials. 1 Author to whom all correspondence should be addressed. Fax: +44 1223 332662; email: [email protected].
Transcript of The dynamic response of clamped rectangular Y-frame and ... · The dynamic response of clamped...

1
The dynamic response of clamped rectangular Y-frame and corrugated core sandwich plates
V. Rubino, V. S. Deshpande1 and N.A. Fleck
Cambridge University, Engineering Department, Trumpington Street, Cambridge,
CB2 1PZ, U.K.
Abstract
The dynamic response of fully clamped, monolithic and sandwich plates of equal
areal mass has been measured by loading rectangular plates over a central patch with
metal foam projectiles. All plates are made from AISI 304 stainless steel, and the
sandwich topologies comprise two identical face-sheets and either Y-frame or
corrugated cores. The resistance to shock loading is quantified by the permanent
transverse deflection at mid-span of the plates as a function of projectile momentum.
At low levels of projectile momentum both types of sandwich plate deflect less than
monolithic plates of equal areal mass. However, at higher levels of projectile
momentum, the sandwich plates tear while the monolithic plates remain intact.
Three-dimensional finite element (FE) calculations adequately predict the measured
responses, prior to the onset of tearing. These calculations reveal that the
accumulated plastic strains in the front face of the sandwich plates exceed those in the
monolithic plates. These high plastic strains lead to failure of the front face sheets of
the sandwich plates at lower values of projectile momentum than for the equivalent
monolithic plates. Keywords: Sandwich plates, dynamic response, FE simulations, lattice materials.
1 Author to whom all correspondence should be addressed. Fax: +44 1223 332662; email: [email protected].

2
1.................................................................................................................. Introduction
Clamped plates are representative of the structures used in the design of commercial
and military vehicles. For example, the hull of a ship comprises plates welded to an
array of stiffeners. Over the past decade there have been substantial changes in ship
design, see for example the review by Paik et al. (2003). One such innovation has
been the Schelde Shipbuilding2 sandwich design of ship hulls with a Y-frame core,
see Fig. 1a. Full-scale ship collision trials reveal that the Y-frame design is more
resistant to tearing than conventional monolithic designs, see Wevers and Vredeveldt
(1999) and Ludolphy (2001). Likewise, the finite element simulations by Konter et
al. (2004) suggest that the Y-frame confers improved perforation resistance. Naar et
al. (2002) have argued in broad terms that the ability of the bending-governed Y-
frame topology to spread the impact load over a wide area, combined with the high in-
plane stretching resistance of the Y-frame, gives the enhanced performance of the Y-
frame sandwich construction over conventional single and double hull designs. The
corrugated sandwich core (Fig. 1b) is a competing prismatic topology to that of the Y-
frame.
Pedersen et al. (2006) and Rubino et al. (2007b) have investigated the quasi-static structural response of Y-frame sandwich beams while Côté et al. (2006) studied the response of sandwich beams with a corrugated core . These studies reveal that geometrical imperfections and/or non-uniform loading (such as indentation loading) induce bending within the struts of the corrugated core and reduce the compressive strength of the corrugated core to approximately that of the Y-frame core. Tilbrook et al. (2007) have performed a combined experimental and numerical investigation into the dynamic compressive response of these cores. They found that buckling of the webs is delayed at low impact velocities by inertial stabilization of the webs while plastic shock wave effects dominate the response at higher impact velocities.
Radford et al. (2005) have developed an experimental technique to subject structures
to high intensity pressure pulses using metal foam projectiles. The applied pressure
versus time pulse mimics shock loading in air and in water, with peak pressures on the order of 100 MPa and loading times of approximately 100 μs . This laboratory
method has been employed in several investigations on the dynamic response of
sandwich beams and plates, see for example Radford et al. (2006a) and Rathbun et al.
(2006). Rubino et al. (2007a) have recently used this technique to demonstrate that
sandwich beams with Y-frame and corrugated cores have a superior dynamic
performance to monolithic beams of equal areal mass; in these tests, the prismatic
axis of the cores was aligned with the longitudinal axis of the beams. However,
clamped plates are more representative of marine structural components. The main
aim of the current study is to determine the relative dynamic performance of clamped 2 Royal Schelde, P.O. Box 16 4380 AA Vlissingen, The Netherlands.

3
monolithic plates and clamped sandwich plates with Y-frame and corrugated cores.
In order to enable a fair comparison with the beam results in Rubino et al. (2007a) we
shall employ the same methodology to load the sandwich plates investigated here.
The outline of the paper is as follows. First, the manufacturing route of the sandwich
plates is detailed and the experimental protocol is described for dynamic loading the
plates over a central patch by metal foam projectiles. The experimental results are
then compared with the corresponding observations for beams with two orientations
of the core and also for monolithic plates of equal areal mass. Finally, finite element
predictions are used to estimate the onset of failure in the plates. 2.......................................................................................... Experimental investigation
Clamped rectangular sandwich plates, made from AISI 304 stainless steel and
comprising two identical face-sheets and either a Y-frame or corrugated core, were
loaded dynamically with metal foam projectiles as sketched in Fig. 2a. The main
aims of this experimental study were:
(i) To measure the shock resistance of rectangular sandwich plates with Y-frame
and corrugated cores, and of monolithic plates. All plates have an equal areal mass.
(ii) To compare the dynamic performance of clamped rectangular sandwich plates
and of end-clamped beams.
(iii) To investigate the fidelity of three-dimensional finite element calculations in
predicting the observed dynamic responses.
2.1 Specimen configuration and manufacture
The core and face sheets of the sandwich plates were made from AISI type 304 stainless steel of thickness 0.3 mmt and of density -37900 kgmf . The Y-
frame and corrugated cores had an effective density -3200 kgmc (corresponding
to a relative density 2.5 % ) and a core depth c = 22 mm. All sandwich plates had
an areal mass -22 10 kgmf cm t c .
A co-ordinate system ( 1 2 3, ,X X X ) is introduced in Fig. 2a in order to clarify the
orientations of the cores in the sandwich plates. The longitudinal and transverse axes of the Y-frame and corrugated core are aligned with the 1X and 2X directions,
respectively, while the through thickness direction of the core is along the 3X axis.
The short edge of the plate between the clamped edges is labelled b along the 2X
direction while the long edge is labelled 2L along the 1X direction; the chosen
aspect ratio Lb 2/ =0.52 matches that of Royal Schelde’s hull panels. The total depth
of the sandwich plates is denoted 2c t . The cross-sectional dimensions of the Y-

4
frame and corrugated core are given in Figs. 2b and 2c, respectively. Note that the Y-frames and corrugated cores are close-packed along the 2X –direction such that
adjacent cores touch as sketched in Fig. 2.
The manufacturing sequence for the Y-frame sandwich plates is outlined in Fig. 3.
The Y-frame webs were computer-numerical-control (CNC) folded to produce a
continuous corrugated profile with flat tops. Slots were then CNC-cut along the tops
of the corrugations as seen in Fig. 3a. Each corrugated sheet contained five Y-frame
webs. The legs of the Y-frame were CNC folded and then teeth were CNC-cut into
the bottom of these legs to mate with the slots of the corrugations (Fig. 3a). The
assembly was then laser welded together (Fig. 3b). This core assembly was of length
375 mm and of width 130 mm. Next, the Y-frame was spot welded to 375 mm 250 mm stainless steel face sheets (Figs. 3c and d). The face sheets were
then continuous laser welded to the core using CNC laser welding. In order to ensure
intimate contact between the face sheet and the core during the laser welding, an
aluminium insert temporarily supported the core (Fig. 3d).
The corrugated core, comprising ten struts (five corrugations) inclined at 60°
(Fig 2c), was also manufactured by CNC folding. The core was then laser welded to
two identical face sheets using the same procedure as that described above for the Y-
frame sandwich plates.
In order to minimize rotations and deflections of the sandwich plates along the
clamped periphery, the clamping procedure as sketched in Fig. 4 was employed.
Along the sides of the sandwich panel, two steel inserts of dimension 375 mm 60 mm 22 mm were glued between the face sheets. The ends of the
sandwich core were then dipped in epoxy resin to a depth of 62.5 mm, as sketched in
Fig. 4a. The periphery of the sandwich plates was then clamped between two steel
frames using M8 bolts, as shown in Fig. 4b. The inner dimensions of the clamping frame were 250 mm 130 mm and thus the effective dimensions of the Y-frame and
corrugated core sandwich plates (i.e. spans of the plate between the clamped edges) were 2 250 mmL and 130 mmb . Monolithic rectangular plates of thickness 1.2h mm were also made from the AISI 304 stainless steel; they possessed the same areal mass as the sandwich plates,
-210 kgmm , and were of overall dimension 375mm x 250mm. As for the sandwich case, the monolithic plates were clamped between the steel frame of Fig. 4b, giving an effective span between the clamped edges of 2 250 mmL and
130 mmb .

5
2.2 Uniaxial response of the constituent materials Tensile tests were performed on dog-bone specimens machined from the as-received AISI 304 stainless steel material. The true stress versus logarithmic strain curve
0 ( )p of the AISI 304 stainless steel measured at an applied nominal strain-rate of 310 s-1 is reported in Fig. 5a. The response is linear elastic with a Young’s modulus
GPa210E , followed by linear hardening above a yield strength of MPa210Y . The finite element model requires a description of the high strain rate response of the 304 stainless steel. The strain-rate sensitivity of the AISI 304 stainless steel was
documented by Stout and Follansbee (1986) in the range 4 -1 4 -110 s 10 s & . Following their approach, we define a dynamic strength enhancement ratio R as the
ratio of the strength d (at a plastic strain 0 1p . ) at an applied strain-rate p& to
the strength 0 ( 0 1)p . at an applied 3 -110 sp & . Stout and Follansbee (1986)
found that the ratio R is reasonably independent on the choice of plastic strain p at
which R is calculated. We make use their measured values for ( )pR & and write the
dynamic strength d versus plastic strain p response in the decoupled form:
0= ( ) ( ) p pd R & . (1)
This prescription for the strain rate sensitivity of the stainless steel is used in the finite
element calculations described in Section 4; 0 ( )p is the measured quasi-static
stress versus strain history (Fig. 5a). For illustration, the estimated true tensile stress
versus logarithmic plastic strain behaviour of the AISI 304 stainless steel is sketched
in Fig 5a at four selected values of applied strain-rate using the R values given by
Stout and Follansbee (1986).
The projectiles used to impact the plates are made from Alporas aluminium alloy foam of relative density 0 11. . The compressive response of the foam is required
in order to calibrate the constitutive parameters of the finite element model. The
quasi-static compressive response of the foam was measured at a strain-rate of 310 s-
1 using a cylindrical specimen similar to that of the projectile in the dynamic
experiments (diameter 50.8 mm and length 51 mm). The nominal compressive
response is shown in Fig. 5: the foam has a plateau strength of approximately 2.5 MPa and a nominal densification strain of 0 8D . .
2.3 Protocol for the dynamic tests
The clamped rectangular monolithic and sandwich plates were impacted by Alporas
aluminium foam projectiles over a central circular patch of diameter d, as shown in
Fig. 2a. Radford et al. (2005) have recently demonstrated that foam projectiles can be
used to provide well-characterised pressure versus time loading pulses. This method

6
has been used to measure the dynamic response of sandwich beams with lattice cores
(Radford et al. 2006a) and circular sandwich plates with metal foam cores (Radford et
al. 2006b) and lattice cores (McShane et al. 2006). The impact site of the Y-frame
and corrugated core sandwich plates is marked in Fig. 2: in keeping with the Y-frame
structures used in ships constructed by Schelde Shipbuilding, the web of the Y-frame
was adjacent to the impacted face of the plate while the Y-frame leg was attached to
the non-impacted face of the sandwich plate.
Projectiles of length 0l 51 mm and diameter 50 8d . mm were electro-discharge
machined into a circular cylindrical shape from Alporas foam blocks of density -3313 kgmp . The projectiles were fired at a velocity 0v in the range -194 ms to
-1451 ms using a gas gun with circular barrel of diameter 50.8 mm and length 4.5 m.
Results are given in terms of the projectile momentum per unit area 000 vlI p , as
listed in Table 1. The plates were inspected after each experiment in order to measure
the permanent central deflection and to detect any visible signs of failure.
3.................................................................................................... Experimental results At least four levels of momentum 0I were imparted to the monolithic and sandwich
plates by varying the metal foam projectile impact velocity. A summary of the measured deflections, core compression and observed failure modes is provided in Table 1.
3.1 Effect of projectile momentum upon the deformation of monolithic and sandwich
plates
The dynamic response of the sandwich and monolithic plates is summarised in a plot of permanent back face deflections bw at the centre of the plates versus the initial
momentum of the foam projectile 0I , see Fig. 6a. Both types of sandwich plate have
a similar performance over the projectile momentum range -2 -202 kNsm 5 kNsmI
and are perforated by the projectile at higher values of 0I . In contrast, the monolithic
plates have higher deflections bw than the sandwich plates but remain intact over the
entire range of 0I investigated.
Define the permanent core compressive strain as c/cc , where c is the
reduction in core thickness at the centre of the plate due to impact. The measured dependence of c upon 0I is plotted in Fig. 6b for the two sandwich plate
configurations. Both sandwich plates undergo similar levels of core compression over the range of 0I values investigated.
Photographs showing the impacted face of the as-tested plates ( -2
0 5 kNsmI ) within
the clamping frame are shown in Fig. 7. Tears running parallel to the 1X -axis are

7
observed on the impacted face sheets of both the Y-frame and corrugated core sandwich plates. In contrast, the monolithic plate remained intact at this value of 0I .
Partial pull-out of the monolithic plate from the clamped supports is evident in
Fig. 7a: a pen-line was traced along the inner clamped boundaries of the plates prior
to each test, and the line moved inwards during the test.
In order to gain insight into the dynamic deformation mechanisms, the monolithic and sandwich plates tested at 0 3I kNs m-2 were sectioned along their mid-span 1 0X .
Photographs of the sectioned specimens are shown in Fig. 8a for the monolithic plate, in Fig. 8b for the sandwich plate with the Y-frame core and in Fig. 8c for the sandwich plate with the corrugated cores. The sectioned profiles show that significant plastic deformation occurs in the vicinity of the foam impact site and that the plates are continuously curved. It is deduced that the dynamic deformation of plates involves the formation of travelling hinges, similar to the observed behaviour of monolithic and sandwich beams and plates reported by numerous investigators, for example Radford et al. (2006b); McShane et al. (2006) and Rubino et al. (2007a). For both types of sandwich plate, the core has sheared and compressed. 3.2 Comparison of the performance of rectangular sandwich plates and beams Rubino et al. (2007a) investigated the response of clamped Y-frame and corrugated core sandwich beams impacted by metal foam projectiles. Beams with both transverse and longitudinal core orientations were investigated in that study and constituent materials used to manufacture the sandwich beams, the core and face sheet thicknesses and core relative density were identical to those employed in the present investigation. Moreover, the spans of the beams in Rubino et al. (2007a) were 250 mm, that is equal to the length of the longer side of the rectangular plates studied here. Given these similarities between the two studies it is instructive to compare the responses of the Y-frame and corrugated core sandwich beams and plates. In qualitative terms, the deformed shape on the 1 0X plane of the plate specimens
(Fig. 8a) is in good agreement with that observed by Rubino et al. (2007a) for corrugated and Y-frame sandwich beams in the transverse configuration.
The permanent back face deflections bw at mid-spans of the Y-frame and corrugated
core sandwich beams and plates are compared in Fig. 9a and 9b, respectively. Recall that the sandwich plates have the longitudinal axis of the prismatic cores along the 1X
axis while the transverse core direction is aligned along the 2X axis. However, the
measured sandwich plate deflections are not intermediate to the sandwich beams with
transverse and longitudinal core arrangements. Rather, the sandwich plates outperform the sandwich beams (in terms of bw ) with the longitudinal core
orientation over the entire range of projectile velocities investigated here. This is
presumably due to the enhanced stretch resistance of the face sheets in the clamped
plate configuration. However, the enhanced stretching of the face-sheets results in tearing of the front face sheet at lower values of 0I compared to the sandwich beams

8
with the longitudinal core orientation as indicated in Fig. 9. Moreover, perforation of the sandwich plates occurs at 2
0 5.4 kNsmI which is about 15% lower than that for
sandwich beams with a longitudinal core orientation.
It is instructive to make a direct comparison of the deflections of the sandwich beams and plates with their monolithic counterparts. To address this, the ratio of measured permanent back face deflection at the centre of the sandwich plates to that of monolithic plates (of same mass) sandwich monolithicw w is plotted as a function of
projectile momentum 0I in Fig. 10. The data for sandwich and monolithic beams
from Rubino et al. (2007a) are included in the figure. There is only a minor effect of core topology upon the mid-span deflection for the beams and plates. However, the sandwich plates and the beams with a longitudinal core orientation outperform the monolithic plates particularly at low impulse levels; in contrast, the sandwich beams with the transverse core orientation show negligible benefit over monolithic beams of equal mass.
4........................................................................................... Finite element simulations
Finite element (FE) predictions for the monolithic and sandwich plates are presented
in this section. All computations were performed using the explicit time integration
version of the commercially available finite element code ABAQUS3 (version 6.5).
We first briefly describe the details of these FE calculations.
Three-dimensional simulations of half models of the rectangular sandwich and
monolithic plates were performed. Linear hexahedral elements (C3D8R in ABAQUS
notation) were used to model the cylindrical foam projectiles of diameter d 50.8 mm and length 510 l mm, with the elements swept about the cylindrical
axis of the foam projectile. The projectiles had 51 elements in the axial direction and
25 elements along the radius. The sandwich and monolithic plates were modelled
using four-noded shell elements (S4R in ABAQUS notation) for both the face-sheets
and the core. Perfect bonding between the core and face sheets was assumed. All
dimensions (face sheet thickness and core dimensions) were chosen to match the
experimental values and an element size of 1.0 mm was employed for all calculations
reported subsequently.
Symmetry boundary conditions were specified at mid-span ( 1 0X ) and clamped
boundary conditions were applied at LX 1 and at 2 2X b by constraining all
rotations and displacements to zero; see Fig. 2a. The loading was simulated by
impact of a metal foam projectile: at the start of the simulation the projectile with an initial velocity ov was brought into contact with the front face sheet at the centre of
3 Hibbit, Karlsson and Sorensen Inc.

9
the rectangular plates. The “general contact” option in ABAQUS was employed to
simulate contact between all adjacent surfaces. The general contact algorithm in
ABAQUS enforced hard, no-friction contact interaction using a penalty algorithm.
4.1 Material properties
The AISI 304 stainless steel was treated as a J2-flow theory rate dependent solid of density -37900 kgmf , Young’s modulus 210E GPa and Poisson ratio 0 3. .
The uniaxial tensile true stress versus equivalent plastic strain curves at plastic strain-
rates 1413 s10s10 p were tabulated in ABAQUS using the prescription
described in Section 2.2 and employing the data of Fig. 5a.
The metal foam projectile was modelled as a compressible continuum using the constitutive model of Deshpande and Fleck (2000). An isotropic yield surface is defined by: ˆ 0Y . (2) where Y is the current yield strength. The equivalent stress ̂ has the following form:
222
22
3/1
1ˆ me
, ........................................
......................................................................................................
................................................................................................ (3) where the parameter defines the shape of the yield surface, 3/kkm is the
mean stress and 2/3 ijije ss is the von-Mises effective stress in terms of the
deviatoric stress ijs . The yield strength Y is assumed to be given by an over-stress
type relation
cpY ̂ , (4)
where is the foam viscosity, p̂ is the work conjugate plastic strain rate to ̂ and
pc ˆ is the uniaxial stress versus plastic strain relation at a negligible strain rate. In
the simulations, the Alporas foam is ascribed a density of 3313 kgmp , Young’s
modulus 1 0cE . GPa, an elastic Poisson’s ratio 0 3. . Consistent with
observations reported by Deshpande and Fleck (2000) we assumed 2/3 which implies that the "plastic Poisson's ratio" 0p . The yield strength c versus
equivalent plastic strain p̂ history is calibrated using the compressive stress versus strain response presented in Fig. 5b. The assumed over-stress model smears the plastic shock wave in the foam projectile over a width (Radford et al., 2005):
D
p
wv
, (5)
where D is the nominal densification strain and v is the velocity jump across the
shock. For the purposes of this discussion, v is approximately equal to the projectile velocity ov . The values of the viscosity were chosen so that
0 /10 5 mmw l , which is approximately equal to that observed in the experiments

10
of Radford et al. (2005). Large gradients in stress and strain occur over the shock
width and thus the foam projectile was discretized by a mesh size of 1 mm in order to
resolve these gradients accurately.
4.2 Comparison of finite element predictions and measurements
Representative FE calculations of the transient deflection of the centre point of the sandwich and monolithic plates are plotted in Fig. 11 for -2
0 3.2 kNsmI . The
deflections of both the front and back face sheets of the sandwich plates are displayed.
In all cases only small elastic vibrations occur after the maximum deflections have
been attained, so that the peak deflection is close to the permanent deflection.
The predicted permanent deflections bw of the back face sheets of the sandwich
plates and of the monolithic plates are included in Fig. 6a along with the
corresponding measured values. The permanent deflections in the FE calculations are
estimated by averaging the displacements over several cycles of elastic vibration
(from trough to peak) immediately after the initial peak displacement. We conclude that at least for the lower values of 0I where no tearing of the plates was observed,
the FE simulations are able to predict the plate deflections with reasonable accuracy.
Some of the discrepancies may be accounted for as follows: (i) At the high values of 0I the observed deflections of the monolithic plates are
greater than the predictions as the plates start to pull out of the supports, see Fig. 7a. (ii) The FE calculations overestimate bw for the Y-frame plates at intermediate values
of 0I . We shall see subsequently that this is primarily due to the fact that the FE
calculations underestimate the degree of core compression in the Y-frame plates.
The FE predictions for the final core compression c at the plate centre are compared
with measurements in Fig. 6b as a function of the applied momentum 0I . Good
agreement between the measurements and predictions is achieved for the corrugated
core, however the FE calculations under-predict the core compression in the Y-frame
sandwich plates. The critical difference between the predictions and observations is that the FE calculations predict that the core compression remains constant at 0.4c
for -20 3 kNsmI while in the experiments core compression increases with
increasing 0I over the entire range of projectile velocities investigated here. We
attribute this discrepancy to the fact that tearing between the Y-frame leg and the back
face sheet was observed in all specimens but was not modelled in the FE calculations.
It is also worth noting that the slight kink in the FE predictions of the deflections of the back face of the Y-frame plates (Fig. 6a) corresponds to the 0I range over which
the FE calculations predict that the core compression remains constant.

11
Comparisons between the measured and predicted permanent deformation of the plates impacted at -2
0 3 kNsmI are included in Fig. 8. In both the experiments and
the FE calculations the plates are sectioned along their mid-span 1 0X to reveal the
core deformation in the sandwich plates. In general good agreement is obtained
although there are some discrepancies especially for the Y-frame sandwich plate as
discussed above.
4.3 Estimation of the onset of front face tearing
The final plastic strain distribution within the Y-frame and corrugated core sandwich plates was explored in the FE simulations for the choice -2
0 5.1 kNsmI . This
impulse level was chosen as it gave front face tearing of both sandwich plates, but not
complete perforation. The location and direction of the maximum principal strains in
the sandwich plates are shown in Figs. 12a and 12b for the Y-frame and corrugated
core plates, respectively. For the Y-frame plate, the highest predicted strain occurs
close to the joint between the Y-frame web and the front face sheet while for the
corrugated core high values of final plastic strain occur both in the front face sheet
and within the core itself. The plastic strain predictions of the FE calculations are
generally consistent with the observation that failure always initiates in the front face
sheet.
The FE predictions of the maximum principal plastic strains max in the face sheets of
the Y-frame and corrugated core plates are compared with those in the corresponding
sandwich beams (longitudinal core orientation) in Fig. 13a over a range of values of
0I . The FE predictions for the beams are obtained from the parallel study by Rubino
et al. (2007a). The FE calculations predict significantly higher values of max in the
plates than in the beams, especially for -20 4 kNsmI ; this is consistent with the
observation that the plates fail at lower values of 0I than the sandwich beams of
longitudinal core orientation. Comparisons between the predicted values of max for
the sandwich and monolithic plates are included Fig. 13b. Recall that failure of the front face sheet was observed at lower values of 0I in the Y-frame plate than the
corrugated core plate. Also, no failure of the monolithic plate was observed even at the highest value of 0I investigated here. Consistent with these observations, the FE
calculations predict the lowest values of max in the monolithic plates followed by the
corrugated core plates, and the largest strains occur in the Y-frame plates.
5..................................................................................................... Concluding remarks

12
Metal foam projectiles have been used to impact clamped 304 stainless steel
monolithic plates and sandwich plates with Y-frame or corrugated cores. The
permanent deflections and level of core compression of the sandwich plates have been
measured as a function of projectile momentum, and the measured responses are
compared with finite element simulations. The finite element (FE) simulations
capture the observed deformation modes to reasonable accuracy. Failure of the joints
between the core and the face sheets is not included in the FE predictions, and this
leads to some discrepancies especially for the Y-frame plates.
The sandwich plates outperform monolithic plates of equal mass at low values of the projectile momentum 0I . Moreover, comparisons with the corresponding Y-frame
and corrugated core sandwich beams revealed that the plates deflect less than the beams. However, the benefits of sandwich construction reduce with increasing 0I : (i)
the ratio of the permanent deflections of the sandwich plates to monolithic plates increases with increasing 0I and approaches unity for 2
0 6 kNsmI ; (ii) stress
concentrations at the attachment points between the core and the face sheets result in failure of the sandwich plates at lower values of 0I than for the monolithic plates. We
conclude that sandwich construction has potential for significantly enhancing the
dynamic performance of structures. However, sandwich construction must be used
with caution in heavily loaded structures: the sandwich plates may fail at lower values of 0I than for monolithic plates of equal areal mass.
Acknowledgments This work was supported by the Netherlands Institute for Metal Research: project number MC1.03163, The Optimal Design of Y-core sandwich structures.
References Côté, F., Deshpande V. S., Fleck N. A., Evans, A.G.,2006. The compressive and shear responses of corrugated and diamond lattice materials. International Journal of Solids and Structures 43, 6220-6242.
Deshpande V. S., Fleck N. A., 2000. Isotropic constitutive models for metallic foams. Journal of Mechanics and physics of Solids 48, 1253-1283.
Konter, A., and Broekhuijsen, J., and Vredeveldt, A., 2004. A quantitative assessment of the factors contributing to the accuracy of ship collision predictions with the finite element method. International Conference of Ship Collisions and Grounding, Tokyo, Japan.
Ludolphy, H., 2001. The Unsinkable Ship -Development of the Y-Shape Support Web. Proceedings of the 2nd International Conference on Collision and Grounding of Ships, Copenhagen, Denmark.
McShane G.J., Radford D.D., Deshpande V.S. and Fleck N.A., 2006 The response of clamped sandwich plates with lattice cores subjected to shock loading. European Journal of Mechanics 25, 215-229.

13
Naar, H., and Kujala, P., and Simonsen, B.C., and Ludolphy, H., 2002. Comparison of the Crashworthiness of Various Bottom and Side Structures. Marine Structures 15, 443-460.
Paik, J.K., 2003. Innovative Structural Designs of Tankers Against Ship Collisions and Grounding: A Recent State-of-the-Art Review. Marine Technology 40, 25-33.
Pedersen, C.B.W., and Deshpande, V. S., and Fleck, N.A., 2006. Compressive Response of the Y-Shaped Sandwich Core. European Journal of Mechanics-A/Solids 25, 125-141.
Radford, D.D., Fleck N.A., Deshpande V.S., 2005. The use of metal foam projectiles to simulate shock loading on a structure. International Journal of Impact Engineering 31, 1152-1171.
Radford, D.D., Fleck N.A., Deshpande V.S., 2006a. The response of clamped sandwich beams subjected to shock loading. International Journal of Impact Engineering 32, 968-987.
Radford D.D., McShane G.J., Deshpande V.S. and Fleck N.A., 2006b. The response of clamped sandwich plates with metallic foam cores to simulated blast loading. International Journal of Solids and Structures 43, 2243-2259.
Rathbun, H.J., Radford, D.D., Xue, Z., He, M.Y., Yang, J., Deshpande, V.S., Fleck, N.A., Hutchinson, J.W., Zok, F.W., Evans, A.G., 2006. Performance of metallic honeycomb-core sandwich beams under shock loading. International Journal of Solids and Structures 43, 1746-1763.
Rubino, V., Deshpande V.S., Fleck N.A., 2007a. The dynamic response of end-clamped sandwich beams with a Y-frame or corrugated core, submitted to International Journal of Impact Engineering.
Rubino, V., Deshpande V.S., Fleck N.A., 2007b. The collapse response of sandwich beams with a Y-frame core subjected to distributed and local loading, International Journal of Mechanical Sciences doi:10.1016/j.ijmecsci.2007.07.007.
Stout M. G., Follansbee P. S., 1986. Strain-rate sensitivity, strain hardening, and yield behaviour of 304L stainless steel. Trans. ASME: Journal of Engineering Materials Technology 108,344-353.
Tilbrook, M.T., Radford D.D., Deshpande V.S., Fleck N.A., 2007. Dynamic crushing of sandwich panels with prismatic lattice cores. International Journal of Solids and Structures 44, 6101-6123.
Wevers, L. J., Vredeveldt, A. W., 1999. Full Scale Ship Collision Experiments 1998, TNO-report 98-CMC-R1725, The Netherlands.

14
Figure captions Fig. 1: Sketch of the (a) Y-frame and (b) corrugated sandwich cores as used in ship hull construction. The core is sandwiched between the outer and inner hull of the ship. Fig. 2: (a) Sketch of the clamped sandwich plate geometry and the loading arrangement. Geometry of half sandwich plate for (b) Y-frame and (c) corrugated sandwich cores investigated in this study. The cross-section is also shown for each topology. All dimensions are in mm. Fig. 3: The manufacturing sequence for the Y-frame sandwich plates. (a) The leg is inserted into the slots in the folded Y-frame web. (b) The leg is laser welded to the Y-frame web. (c) The Y-frame core is spot welded on to the front face sheet of the sandwich plate. (d) An aluminium insert locates the core and face sheets and (e) the assembly is laser welded together.
Fig. 4: The clamping arrangement of the sandwich plates. (a) The steel inserts and
epoxy filling of the core ends allow for high clamping pressures. (b) The steel frame
for clamping of the plates. All dimensions are in mm. Fig. 5: (a) The measured quasi-static ( 13 s10 p ) tensile stress versus strain response of the AISI 304 stainless steel and the estimated responses at three additional values of applied plastic strain rate, using the data of Stout and Follansbee (1986). (b) The quasi-static nominal compressive stress versus nominal strain response of the Alporas metal foam. Fig. 6: Measured and FE predictions of the permanent (a) back face deflections bw
and (b) core compression at the centre of the dynamically loaded sandwich plates, as a function of the foam projectile momentum 0I . The data for the monolithic plates are
included. Symbols denote measurements while the continuous lines are the FE predictions. Front face sheet failure is denoted by encircling the salient data points of in (b). Fig. 7: Photographs showing a view of the front face of the as-tested (a) monolithic (b) Y-frame and (c) corrugated core plates. -2
0 5 kNsmI .
Fig. 8: Photographed sections of the mid-plane 1 0X of the as-tested (a) monolithic
(b) Y-frame and (c) corrugated core plates. -20 3 kNsmI .
Fig. 9: Comparison of the measured permanent deflections bw at the centre of the
back face of the (a) Y-frame and (b) corrugated core sandwich plates and beams, as a function of the foam projectile momentum 0I . The data are shown up to 0I values at
which face sheet failure is first observed. The sandwich beam data are from Rubino
et al. (2007a) and are for the cases when the prismatic axis and transverse axis of the

15
core are along the length of the beam; these orientations are labelled longitudinal and
transverse, respectively.
Fig. 10: The ratio of measured back deflections of the sandwich plates to monolithic plate versus projectile momentum 0I . The data are shown up to 0I values at which
face sheet failure is first observed. The sandwich beam data are from Rubino et al.
(2007a), with the prismatic and transverse axes of the core along the length of the
beam; these two cases are labelled longitudinal and transverse, respectively.
Fig. 11: Finite element prediction of the temporal variation of the deflection of the centre of the monolithic and sandwich plates loaded with a metal projectile
momentum of -20 3 2 kNsmI . .
Fig. 12: Sketch representing the FE predictions for the location and direction of the maximum principal strain in the (a) Y-frame and (b) corrugated core sandwich plates. The beams were impacted by the foam projectile of -2
0 5.1 kNsmI .
Fig. 13: FE predictions of the maximum principal plastic strain in the front face sheet
of the dynamically loaded sandwich plates. (a) Comparison of the Y-frame and
corrugated core sandwich beams (longitudinal core orientation) and plates. (b)
Comparison between the sandwich plates and monolithic plates. The FE predictions
for the sandwich beams are taken from Rubino et al. (2007a).
List of Tables
Table 1: The measured dynamic responses of monolithic and sandwich plates. The
symbol X denotes through-thickness tearing of the plates.
16
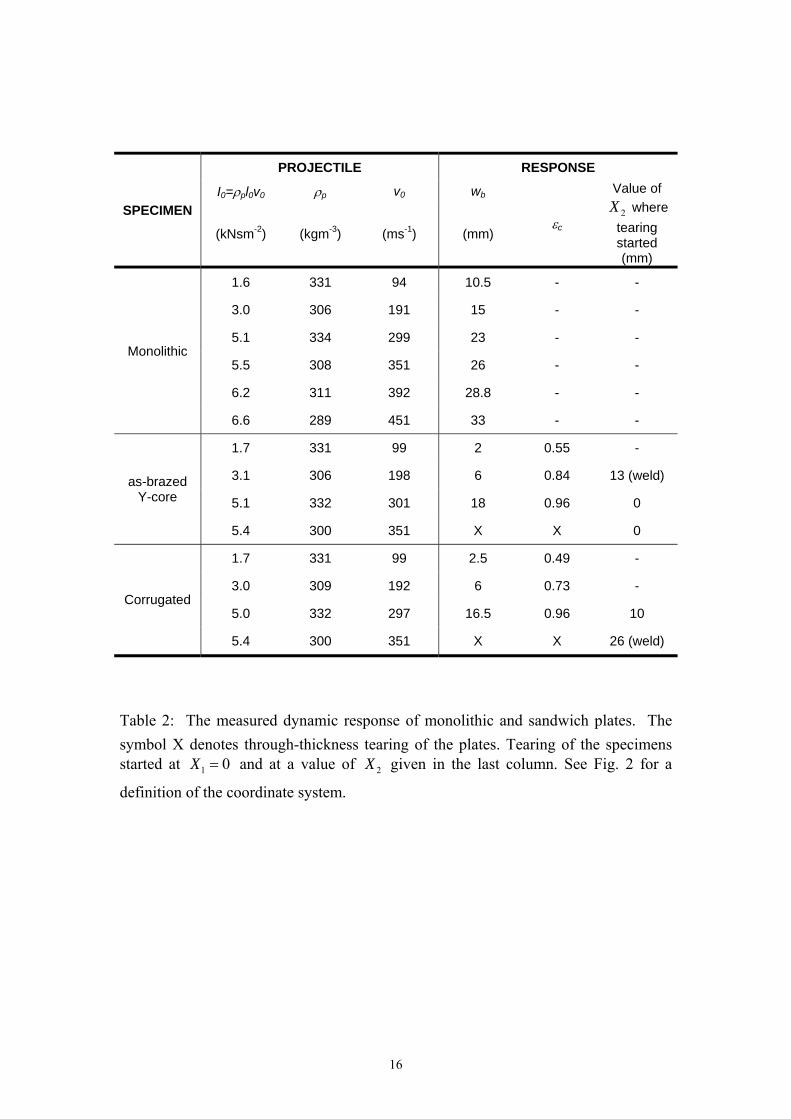
Table 2: The measured dynamic response of monolithic and sandwich plates. The
symbol X denotes through-thickness tearing of the plates. Tearing of the specimens started at 1 0X and at a value of 2X given in the last column. See Fig. 2 for a
definition of the coordinate system.
SPECIMEN
PROJECTILE RESPONSE
I0=pl0v0 p v0 wb
c
Value of
2X where
tearing started (mm)
(kNsm-2) (kgm-3) (ms-1) (mm)
Monolithic
1.6 331 94 10.5 - -
3.0 306 191 15 - -
5.1 334 299 23 - -
5.5 308 351 26 - -
6.2 311 392 28.8 - -
6.6 289 451 33 - -
as-brazed Y-core
1.7 331 99 2 0.55 -
3.1 306 198 6 0.84 13 (weld)
5.1 332 301 18 0.96 0
5.4 300 351 X X 0
Corrugated
1.7 331 99 2.5 0.49 -
3.0 309 192 6 0.73 -
5.0 332 297 16.5 0.96 10
5.4 300 351 X X 26 (weld)

17
Fig. 1: Sketch of the (a) Y-frame and (b) corrugated sandwich cores as used in ship
hull construction. The core is sandwiched between the inner and outer hulls of the
ship.
(a) (b)
inner hull
inner hull

18
Fig. 2: (a) Sketch of the clamped sandwich plate geometry and the loading
arrangement. Geometry of half sandwich plate for (b) Y-frame and (c) corrugated
sandwich cores investigated in this study. The cross-section is also shown for each
topology. All dimensions are in mm.
t
X3
b2L
c
t v0 l0
Metal Foam Projectile
d
X1
X3
(c)
(b)
(a)
Cross section
X2
Longitudinal section

19
Fig. 3: Manufacturing process for the laser welding of Y-frame sandwich plates. (a)
The leg is inserted into the correspondent slots of the main frame and (b) is next
manually welded on it along the 375 mm long side. (c) The Y-frame core is laser spot
welded on the front face sheet with spots every 10 mm, (d) the back face sheet is
added with laser spot welding. An aluminium tool (shown in the inset) is here used to
push together the two components to be spot welded. (e) A robot laser welds along
the pre-spot welded lines.
(a) (b)
(c)
(d)
(e)
Laser welding
Spot laser welding
Aluminium insert

20
Fig. 4: Sketches of the manufacturing technique used to clamp the rectangular plates.
(a) Mild steel inserts are glued between the face sheets of the long sides. A two part
epoxy resin is poured in the two extremities of the plates. (b) The plate is bolted
between two rigid rectangular frames.
Epoxy resin filler
Mild steel inserts
b
2L
S
c
a
e
Y-frame plate
Rigid frame
Rigid frame
(b) 2L b
e(a)

21
(a)
0
0.5
1
1.5
0 0.2 0.4 0.6 0.8
n
(MPa)
n
Y-frame
Corrugated core
(b)
0
10
20
30
40
0 0.2 0.4 0.6 0.8 1
n
(MPa)
n
Fig. 5: (a) Measured quasi-static compressive stress versus strain responses of Y-
frame and corrugated sandwich cores. (b) The quasi-static nominal compressive
stress versus nominal strain response of the Alporas metal foam.

22
(a)
0
400
800
1200
1600
0 0.1 0.2 0.3 0.4 0.5
(MPa)
(b)
0.8
1
1.2
1.4
1.6
1.8
10-5 10-3 10-1 101 103 105
R
Fig. 6: (a) The measured quasi-static ( 13 s10 p ) tensile stress versus strain
response of the AISI 304 stainless steel and the estimated high strain rate response at
three additional values of strain rate, using the data of Stout and Follansbee (1986).
(b) The dynamic strength enhancement ratio R as a function of plastic strain-rate p
for the AISI 304 stainless steel at a plastic strain 1.0p .
10-3
1sp
1 102
103
104
1.0p
1sp
p

23
0
10
20
30
0 2 4 6 8
MonolithicY-frameCorrugated
I0=
pl0v
0 (kNs m-2)
wb
(mm)
Y-frame (FE)
Monolithic (FE)
Corrugated-core (FE)
failure of all sandwich plates
(b)
0.3
0.4
0.5
0.6
0.7
0.8
0.9
1
0 2 4 6 8
I0=
pl0v
0 (kNs m-2)
c
Y-core (FE)
Corrugated core (FE)
front face tears front face
tears
Fig. 7: Comparison of the measured and predicted permanent (a) rear-face deflections
and (b) core compression at mid-span of the dynamically loaded monolithic and sandwich plates, as a function of the foam projectile momentum 0I . Symbols denote
measurements and the continuous lines denote FE predictions.
(a)

24
(a)
(b)
(c)
Fig. 8: Photographs of the as-tested (a) monolithic, (b) Y-frame and (c) corrugated
core sandwich plates at approximately the same value of the foam projectile initial momentum -2
0 5 kNsmI . Front face tearing is observed in both the sandwich plates.

25
(a)
(b)
(c)
Fig. 9: Comparison between the observed and FE predicted deformed profiles of the
plates sectioned at mid-span. (a) Monolithic plates, (b) Y-frame and (c) corrugated
core sandwich plates impacted by the foam projectile at -20 3 kNsmI .
Observation Prediction
X2 X3

26
(a)
0
10
20
30
40
50
0 1 2 3 4 5 6
Beam, transverse Beam,
longitudinal
Plate
I0=
pl0v
0 (kNs m-2)
front face tears (at support)
front face tears (at mid-span)
wb
(mm)
failure
(b)
0
10
20
30
40
50
0 1 2 3 4 5 6
Plate
I0=
pl0v
0 (kNs m-2)
wb
(mm)
Beam, transverse
front face tears (at support)
Beam,longitudinal
front face tears (at mid-span)
failure
Fig. 10: Comparison of the measured permanent rear-face deflections at mid-span of
the dynamically loaded (a) Y-frame and (b) corrugated core sandwich structures, as a function of the foam projectile momentum 0I . The response of the sandwich plates
(Fig. 7a) is compared to that of sandwich beams with either longitudinal or transverse
cores (see Rubino et al., 2007c).

27
0
0.2
0.4
0.6
0.8
1
0 1 2 3 4 5 6
Y-frame
Corrugated core
Beam, longitudinal
Beam, transverse
I0=
pl0v
0 (kNs m-2)
wsandwich
wmonolithic
Plate
Fig. 11: Comparison of the measured normalized permanent rear-face deflections at
mid-span of the dynamically loaded Y-frame and corrugated core sandwich structures, as a function of the foam projectile momentum 0I . The rear-face
deflection of the sandwich structure is normalized with the rear-face deflection of the
corresponding monolithic structure of the same mass.

28
0
5
10
15
20
25
30
0 0.5 1 1.5 2
Y-frameCorrugated-core
Mid
-spa
n d
efle
ctio
n (m
m)
time (ms)
Monolithic
Rear face
Front face
Fig. 12: Finite element prediction of the mid-span deflection versus time histories for
monolithic and sandwich plates with Y-frame or corrugated core loaded with a metal
projectile momentum of -20 3 2 kNsmI . .

29
Fig. 13: Sketch showing the FE predictions for the location and direction of the
maximum principal strains of the (a) Y-frame and (b) corrugated core sandwich
plates. The clamped plates were impacted with the foam projectile momentum of -2
0 5 1 kNsmI . .
0.6 0.6
0.4 0.4
Clamped
Clamped
(a)
(b)
0.6 0.6

30
(a)
0
0.2
0.4
0.6
0.8
0 2 4 6 8
I0=
pl0v
0 (kNs m-2)
max Beam,
longitudinal
Plate
failure of Y-frame plates
Beam,transverse
(b)
0
0.2
0.4
0.6
0.8
0 2 4 6 8
I0=
pl0v
0 (kNs m-2)
max
failure of corrugated core plates
Plate
Beam,transverse
Beam,longitudinal
(c)
0
0.2
0.4
0.6
0.8
0 2 4 6 8
I0=
pl0v
0 (kNs m-2)
max
Y-frame
Corrugated core
Monolithic
Fig. 14: Maximum principal plastic strain of the front face at mid-span of the
dynamically loaded (a) Y-frame and (b) corrugated core sandwich structures, as a function of the foam projectile momentum 0I . The response of the plates is
compared to beams with either longitudinal or transverse cores, see Rubino et al.
(2007c). (c) Comparison of the maximum principal plastic strain in the front face of
the sandwich plates and monolithic plates.