
The Drivers of National Innovative Capacity: Implications...
30
The Drivers of National Innovative Capacity: Implications for Spain and Latin America Michael E. Porter, Harvard Business School Jeffrey L. Furman, MIT Sloan School Scott Stern, MIT Sloan School & NBER May 31, 2000
Transcript of The Drivers of National Innovative Capacity: Implications...

The Drivers of National Innovative Capacity:
Implications for Spain and Latin America
Michael E. Porter, Harvard Business School
Jeffrey L. Furman, MIT Sloan School
Scott Stern, MIT Sloan School & NBER
May 31, 2000
1
A. Introduction
In the past decade, both academic scholars and policymakers have focused increasing
attention on the central role that technological innovation plays in economic growth. There are at
least two distinct reasons for this increased interest. First, though economists have long
recognized the centrality of technological innovation in microeconomic and macroeconomic
processes (Schumpeter, 1950; Solow, 1956; Abramovitz, 1956), leading models and frameworks
for understanding economic growth and national competitiveness did not directly incorporate the
economic drivers of the innovation process until the late 1980s and early 1990s (Romer, 1990;
Porter, 1990; Nelson, 1993). At the same time, the dramatic political changes wrought by the end
of the Cold War and the globalization of economic activity have increased the salience of
productivity growth as a principal goal of policymakers across the OECD. In turning their
attention to the sources and consequences of technological innovation, the academic and policy
communities confront a striking empirical puzzle: while R&D activity is relatively dispersed
around the world, “new-to-the-world” innovation tends to be concentrated in a few countries at a
given point in time. For example, during the 1970s and the early 1980s, only Switzerland, a
relatively small but very technology-intensive country, achieved a per capita “international”
patenting rate comparable to the rate achieved by U.S. inventors.
Motivated by the geographic concentration of “new-to-the-world” innovation, researchers
and policymakers are attempting to understand the drivers of R&D productivity differences across
countries.1 In this short paper, we review our prior research on the drivers of national R&D
productivity differences (highlighting our findings for Spain, in particular).2 We also extend this
work to consider the historical experience and contemporary challenges for the countries of Latin
1 In the past decade, there has been a dramatic rise in the number of comparative international studies of innovation and relative
productivity. From a policy perspective, there have been several influential “benchmarking” studies which have attempted toprovide a more thorough account of international differences in industrial and R&D productivity (Dertouzos, et al (1989);Porter and Stern (1999b)). At the same time, scholars in the economics of technological change became interested indocumenting the existence and characteristics of national innovation “systems” (Nelson, 1993), mostly drawing upon rich,qualitative and institutional evidence. Finally, there has been an upsurge in the use of quantitative methods, particularly thoserelying on the use of patent data, beginning with Griliches (1984).
2 See Porter and Stern (1999); Stern, Porter, and Furman (1999); and Stern and Porter (2000).

2
America. While Latin America firms have improved their competitiveness in international
markets, they continue to produce very little new-to-the-world technology: for example, several
countries in Latin America are awarded less than ten U.S. patents per year. Our research helps to
identify sources of this low rate of innovation performance as well as highlighting emerging areas
of increased strength in terms of producing world-class technological innovation.
B. Determinants of National Innovative Capacity
Our analysis is organized around a novel framework based on the concept of national
innovative capacity.3 National innovative capacity is the ability of a country – as both a political
and economic entity – to produce and commercialize a flow of innovative technology over the
long term. Innovative capacity depends on an interrelated set of investments, policies, and
resource commitments that underpin the production of new-to-the-world technologies. National
innovative capacity is not simply the realized level of innovative output; rather, it is reflected in
the presence of fundamental conditions, investments, and policies that determine the extent and
success of innovative effort in a country (e.g., high levels of science and technology resources,
policies that encourage innovative investment and activity, and innovation-oriented domestic
industrial clusters).
National innovative capacity depends in part on the technological sophistication and labor
force in a given economy, but also reflects the investments and policies of the government and
private sector that affect the incentives for and the productivity of a country’s research and
development activities. As well, national innovative capacity is distinct from both the purely
scientific or technical achievements of an economy, which do not necessarily involve the
economic application of new technology, and national industrial competitive advantage, which
3 We develop the national innovative capacity framework by drawing on three distinct areas of prior research: ideas-driven
endogenous growth theory (Romer, 1990), cluster-based theory of national industrial competitive advantage (Porter, 1990), andthe literature on national innovation systems (Nelson, 1993). Each of these perspectives identifies specific factors which maydetermine the aggregate flow of innovation produced in a given national environment. See Stern, Porter, and Furman (1999)for a complete exposition of this framework and its relationship to prior research in this area.

3
results from myriad factors in addition to the development and application of innovative
technologies (Porter, 1990).
Our framework for organizing the determinants of national innovative capacity consists of
elements from two broad categories: (1) a common pool of institutions, resource commitments,
and policies that support innovation and (2) the particular innovation orientation of groups of
interconnected industrial clusters. Figure A illustrates our framework. The left-hand side
represents the cross-cutting factors that support innovation throughout many if not all industries,
referred to as the common innovation infrastructure. These include such elements as the current
level of technological sophistication in the economy, the supply of technically oriented workers,
the extent of investments in basic research and education, and policies that affect the incentives for
innovation in any industry. The diamonds on the right side signify the innovative environment in
individual national industrial clusters.4 Driven by the forces highlighted by Porter in his studies of
national industrial competitive advantage (Porter, 1990), individual industrial clusters must
compete and evolve on the basis of sustained innovation in order to contribute to a nation’s
innovative capacity. Finally, linkages between the common innovation infrastructure and the
individual industrial clusters contribute to an economy’s ability to mobilize resources associated
with the infrastructure towards innovation opportunities in specific industrial sectors.
Common Innovation Infrastructure. Although the innovative performance of an
economy ultimately rests with the behavior of individual firms and industrial clusters, some of the
most critical investments that support innovative activity operate across all innovation-oriented
sectors in an economy. We describe such elements as an economy’s common innovation
infrastructure. Figure B illustrates three specific categories associated with the common
innovation infrastructure. First, as a country becomes more technologically sophisticated, the
average cost of generating a specific amount of innovation may decline, as innovators are able to
draw on a more varied set of approaches and potential solutions when pursuing R&D activities.
4 We focus on clusters (e.g., information technology) rather than individual industries (e.g., printers) because there are powerful
spillovers and externalities that connect the competitiveness and rate of innovation of clusters as a whole (Porter, 1990). Aswell, previous research has suggested that the scope of industrial clusters is often quite local in nature, operating at the regionalor even city level (see, e.g. Porter, 1998).

4
As such, our framework suggests that a country’s R&D productivity will depend upon the stock of
knowledge it may draw upon in the context of the innovation process (denoted At in Figure B).
Second, the level of innovative activity realized by an economy will ultimately depend on the
extent of available scientific and technical talent who may be dedicated to the production of new
technologies (denoted HA,t in Figure B).5 In addition to the size of a country’s knowledge stock
and talent pool, R&D productivity will also depend on national investments and policy choices,
such as spending on higher education, intellectual property protection, and openness to
international competition, which will have a cross-cutting impact on innovativeness across
economic sectors. (These factors are denoted together as XINF in Figure B).6
Cluster-Specific Innovation Environment. While the common innovation infrastructure
determines the general pool of innovation-supporting resources available an economy, it is
ultimately firms that introduce and commercialize innovations. In thinking about the overall
innovative performance of an economy, then, one must examine the extent to which innovation is
supported by the competitive environment in a country’s industrial clusters.7 To do this, we apply
the framework introduced by Porter (1990), highlighting how four key elements of the
microeconomic environment -- the presence of high-quality and specialized inputs; a context that
encourages investment and intense local rivalry; pressure and insight gleaned from sophisticated
local demand; and the presence of a cluster of related and supporting industries -- influence the
rate of innovation in a country’s industrial clusters (see Figure C).8 Incorporating cluster-level
dynamics into the national innovative capacity framework allows us to integrate results and
5Our model builds on the seminal growth model of Romer (1990), which derives equilibrium growth based on the endogenous
allocation of labor to the “ideas” sector of the economy (see Jones (1995; 1998) for a useful introduction and review and Porterand Stern (1999a) for further discussion of the empirical properties of the national “ideas” production function).
6 Across countries, the salience and specific manifestation of these additional factors may vary greatly. For example, in the UnitedStates, the dominant performers of basic research are members of the university system who compete with each other forfederal funding, mostly through peer-reviewed grant processes. In contrast, basic research in Germany is performed by a morediversified set of organizations, including a substantial share by several non-university-based research institutes, such as theHelmholtz research centers, the Max Planck institutes, and the “Blue List” institutes. While this heterogeneity is ofindependent research interest (see, for example, the careful comparative studies in Nelson (1993)), our focus here is on theultimate consequences of such institutions in terms of observed R&D productivity.
7 Following Porter (1990, 1998), these industrial clusters are the sources of the geographic and cross-industry spillovers whichserve to shape and reinforce national industrial competitive advantage.
8 The “diamond” framework has been used extensively to describe the dynamics of competition in national industrial clusters(Porter, 1990). Here we emphasize the extent to which the environment in a country’s industrial clusters encouragesinnovation as a specific outcome of the competitive process.

5
insights from multiple levels of analysis for our understanding of national R&D productivity
differences.
The Quality of Linkages. Finally, the relationship between industrial clusters and the
common innovation infrastructure is reciprocal: conditional on the environment for innovation in
any particular cluster, its innovative output will increase with the strength of the economy’s
common innovation infrastructure. As well, the strength of linkages between these two areas will
determine the extent to which the potential for innovation supported by the common innovation
infrastructure is translated into specific innovative outputs in a nation’s industrial clusters. In the
absence of strong linking mechanisms, upstream scientific and technical activity may spill over to
other countries more quickly than opportunities can be exploited by domestic industries.9 For
example, consider the case of the chemical industry in the second half of the 19th century. While
the underlying technology creating this industry was the result of the discoveries of the British
chemist Perkins, the sector quickly developed and became a major exporting industry for
Germany, not Britain. At least in part, this migration of the fruits of scientific discovery to
Germany was due to that country’s stronger university-industry relationships and the greater
availability of capital for technology-intensive ventures (Murmann, 1998; Arora, et al, 1998).
C. Modeling National Innovative Capacity
We use the national innovative capacity framework to direct our empirical analysis of the
determinants of R&D productivity. In effect, we estimate a production function for economically
significant technological innovations, choosing a specification in which innovations are produced
as a function of the factors underlying national innovative capacity. Letting L X be defined as the
natural logarithm of X, our main specification takes the following form:10
9 While there have been some attempts to understand the role played by these linking mechanisms in shaping R&D productivity ,
most international comparative studies have confined themselves to carefully identifying and highlighting the mechanismsassociated with institutions that play such roles in particular countries (e.g., the Fraunhofer Institutes in Germany, MITI inJapan, and Cooperative Research and Development Associations (CRADAs) in the United States).
10 More formally, we derive this model from the “ideas” production function, INF CLUST LINK Aj, t j, t j, t j, t j, t j, t j, tA (X , Y , Z ) H Aλ φδ=� ,
adapted from Romer (1990), Jones (1995), and Stern and Porter (2000).

6
INF CLUS LINK Aj,t YEAR t COUNTRY j INF j,t CLUS j,t LINK j,t j,t j,t j,tL A Y C LX LY LZ LH LAδ δ δ δ δ λ φ ε= + + + + + + +�
j,tA� represents the flow of new-to-the-world technologies from country j in year t, Aj, tH is
the total level of capital and labor resources devoted to the ideas sector of the economy, and j,tA is
the total stock of knowledge held by an economy at a given point in time to drive future ideas
production. In addition, XINF refers to the level of cross-cutting resource commitments and policy
choices which constitute the common innovation infrastructure, YCLUS refers to the particular
environments for innovation in a country’s industrial clusters, and ZLINK captures the strength of
linkages between the common infrastructure and the nation’s industrial clusters.
We conduct our analysis on a panel dataset of OECD countries from 1973 to 1995 (see
Table 1), using a novel dataset drawn primarily from World Bank, OECD, and World Economic
Forum sources. Evaluating the equation introduced above requires that we identify observable
measures for new-to-the-world innovation and each of the concepts underlying national innovative
capacity. While no measure of innovation at the national level is ideal, we organize our empirical
analysis around the observed number of “international patents” (PATENTS), a useful indicator of
the country-specific level of realized, visible “new-to-the-world” innovation at one point in time.11
The average number of PATENTS produced by a sample country in a given year is 3986. As can
be seen in Figures D, “per capita” patenting rates (PATENTS / million persons) demonstrate
substantial differences across countries. There is, however, a convergence in the realized level of
patenting among the initial top tier countries (the United States and Switzerland) and countries in
the middle and lower tiers. Most striking, Japan and Germany “join” the top group in the 1980s,
11 In the context of our prior work, “international patents” are defined as those granted by the United States Patent & Trademark
Office as well as by the home country of the inventor. Our use of international patents draws on an extensive body of priorwork (building on the foundations developed in Griliches, 1984) which has established both the advantages (as well as thelimitations) of using patent data relative to other measures of innovation (Evenson, 1984; Trajtenberg, 1990; Henderson andCockburn, 1994, 1996; Eaton and Kortum, 1996; 1998). Our prior work includes a much more complete justification for theuse of patents as a measure of national level innovative activity which relies primarily on the fact that international patentsrepresent the most useful, consistent indicator of commercially relevant innovation at the world technological frontier.

7
while a number of Northern European economies evidence relative increases in observed
innovative output over time.
D. Empirical Findings
Our principal empirical exercise relates PATENTS to variables corresponding to various
elements of national innovative capacity. Essentially, we utilize a number of observed aggregate
measures (such as the number of full-time scientists and engineers and the aggregate level of R&D
expenditures) as well as indicators of national policies (e.g., measures of the strength of
intellectual property protection and openness to international competition) to capture the strength
of the common innovation infrastructure. As well, we capture the innovation orientation of
industrial clusters and the strength of linkages by compositional variables, including a measure of
the degree to which R&D is funded by the private sector and the degree to which R&D is
performed within the university sector.
Using this framework, we have performed a number of detailed empirical analyses
dissecting the drivers of national innovative capacity (Stern and Porter, 1999; Stern, Porter, and
Furman 1999; Porter and Stern, 2000). Our analysis allows us to evaluate which factors matter
most for driving differences in historical trends in national innovative performance. In Table 2, we
present the principal model that we have used to evaluate trends in national innovative capacity
across the OECD.12 Each of the measures reflecting elements associated with national innovative
capacity are quantitatively and statistically significant (and indeed explain an extremely high
percentage of the overall variance in innovative output among OECD countries over the last
quarter century). These results imply that the extent and nature of investments in national 12 There are a number of methodological considerations which we do not have space to discuss here but which are treated more
fully in our prior work. There, we demonstrate the robustness of our results to a number of modifications, including (a) usingthe cumulative sum of patents as a measure of countries’ knowledge stock; (b) employing alternative specifications, such ascountry fixed effects and time trends; (c) including additional measures of the determinants of national innovative capacity and(d) employing alternative subsets of the data, including selecting out specific geographic regions or time periods.

8
innovative capacity are associated with observed levels of innovative output and R&D
productivity.13
Our analysis suggests that the level of observed national innovative output is significantly
affected by factors associated with level of technological sophistication of a country (GDP per
capita), the overall level of resources devoted to innovation (e.g., the employment of technical
workers, and the aggregate level of R&D spending). As well, national innovative performance
depends upon more nuanced elements of the common innovation infrastructure, including
investments in higher education, and policy variables such as an economy’s openness to
international competition and the strength of its intellectual property protections. Finally, national
innovative capacity is affected by the extent to which R&D is financed by industry and performed
by universities. Overall, looking at the various factors which help explain the observed level of
international patenting output, our analysis suggests that no single factor is sufficient to drive
national innovative capacity. Thus, our results suggest that innovation leadership will tend to
result from concerted strength along a number of distinct dimensions which contribute to
innovative capacity.
Using these results, we are able to compute an “index” of national innovative capacity for
our sample of seventeen OECD economies since 1973 (Figure E). Essentially, a country’s
innovative capacity is equal to its expected per capita international patenting rate, as calculated
from the variables and regression coefficients from Table 2. This counterfactual analysis allow us
to reach several overarching conclusions about the development of innovative capacity. First, and
perhaps most importantly, innovative capacities are converging across the OECD. Although the
13 It is important to properly interpret the coefficients on these measures. For those variables specified in log form, coefficients
reflect elasticities. For example, a 10 percent increase in GDP PER CAPITA is associated with approximately as 7.8%increase in PATENTS. For the Likert scale measures, the coefficients are equal to the predicted percentage change inPATENTS which would result from a one unit change in that variable (e.g., a one unit change in IP (e.g., from 7 to 8) isassociated with a 25 percent increase in PATENTS). Finally, coefficients on the variable expressed as a share (ED SHARE)can be interpreted as percentage increase in PATENTS resulting from a one percentage point increase in ED SHARE.

9
United States and Switzerland appear at the top of the “index” of national innovative capacity
across three decades, the relative advantage of the leader countries has declined over time. Over
this time period, there have been substantial differences across countries in the extent to which
they have invested in factors contributing to national innovative capacity. In particular, despite an
economic slowdown in the 1990s, Japan has dramatically improved its innovative capacity since
the early 1970s and evidences little sign of weakening its pace of investment. Further, the
Scandinavian economies of Denmark and Finland have made major gains in innovative capacity
since the mid-1980s, joining Sweden in establishing a region of world class innovation. In
contrast, several Western European countries, including the United Kingdom, France, and Italy,
have maintained constant (or perhaps declining) innovative capacity levels over the past quarter
century.14
The Spanish experience presents a mixed record. Relative to other countries in our
analysis, Spain has sustained a low level of national innovative capacity (and so is ranked lower
throughout the sample). In part, this record reflects the isolated political and economic
circumstances of Spain until the late 1970s. However, over the past twenty years, Spain has
experienced a substantial increase in its national innovative capacity: indeed, on a percentage
basis, Spain has registered among the fastest rates of growth in national innovative capacity among
OECD countries (consistent with the convergence phenomena identified earlier.) While Spain has
not enjoyed the transformation of countries such as South Korea, Singapore, or Israel, there is
evidence of a consistent and maintained effort to commit to policies and investments which have
increased the ability of Spanish companies to develop and commercialize world-class innovation.
14 Related analysis suggests that new centers of innovative activity are emerging outside of the OECD. Singapore, Taiwan, South
Korea, and Israel have made substantial investments and upgraded their innovative capacity over the past decade. Ireland hasalso established the infrastructure and industrial clusters consistent with strong innovative activity. In contrast, severalcountries that have drawn much attention as potential economic powers—India, China, and Malaysia—are not yet generating ameaningful level of patentable innovative output on an absolute or relative basis. None of these countries is investing rapidlyenough to be considered to possess high per capita levels of national innovative capacity.
10
E. National Innovative Capacity in Latin America
In this section we extend our prior analyses by applying the national innovative capacity
framework to Latin America. First, we contrast the innovation profile of these economies with
those of leading innovator countries in the OECD; second, we undertake a more nuanced
comparison of the differences in innovative capacity among the economies of Latin America and
in comparison with other emerging rgions.
As is the case for the OECD, the ability of Latin American countries to develop new-to-
the-world technologies is rooted in their historical investments in national innovation
infrastructures and the presence of innovation-oriented competition in national industrial clusters.
At least until recently, the countries of the Spanish-speaking world have faced barriers that have
limited progress in these areas, with severe consequences for the production of new-to-the-world
innovation. For example, in 1997, while many Latin American countries have per capita incomes
that are greater than one-fifth of those of Western Europe, the per capita rates of international
patenting in most Latin American economies are less than one-fiftieth of the rates in most Western
European countries. In other words, Latin American firms and individuals are 50 times less likely
to patent a world-class innovation than their Western European counterparts. Indeed, Latin
American inventors receive extremely few patents from the United States in absolute terms; even
large countries such as Columbia have been assigned only a handful of patents over the past
quarter century (see Table 3).
The lower level of overall national productivity in these countries plays an important role
in understanding this innovation shortfall. However, the gap between national innovative capacity
in the OECD and Latin America is also the result of several factors more specific to the process of
technological innovation. For example, prior research (see, e.g., Nelson, 1993, as well as our own
efforts) emphasizes the special role played by the university system. In many leading innovator
economies, the university system provides the training necessary for a technically skilled labor
force and undertakes the “basic” research that provides a foundation for a country’s industrial
clusters. Throughout the Spanish-speaking world, however, universities have historically played a

11
limited role in the innovation process. Rather than participating in a dynamic interaction with
industry, as occurs in countries such as the United States and Sweden, Latin American higher
education has often remained isolated from industry and only loosely involved in national science
and technology policy. Similarly, whereas openness to international competition encourages
innovation by fostering knowledge spillovers and competitive pressures, the largely closed history
of Latin American economies has impeded the development of national innovative capacity.
To understand the differences among Latin American countries themselves, we compute
and then dissect an index of national innovative capacity for a sample of seven Latin America
countries for which consistent and reliable data are available (see Table 1).15 Overall, there is a
tight relationship between the rankings according to index (which is based on the model we used
to evaluate national innovative capacity within the OECD) and realized levels of per capita
international patenting by Latin American countries. In other words, innovation performance by
Latin American economies seems to be driven by the same fundamental factors we found in our
earlier research on OECD economies.16
Relative to all other countries in the sample, Argentina is estimated to have the highest
level of national innovative capacity (see Table 4). However, Argentina’s level is still
substantially lower than that of OECD countries (e.g., while the leading countries have index
values in excess of 100 and Spain registers a level of between 15 and 20, the Argentina index
value is only slightly above 2). Following Argentina is a second tier composed of Chile and
Brazil, each estimated to have similar levels of national innovative capacity (with values just
above 1). Costa Rica in fact ranks fourth in terms of national innovative capacity, though
Venezuela is the only country in the sample poorer than Costa Rica. This result highlights the
15 The index is calculated using the weights provided by the regression coefficients from Table 2 and can be interpreted as the
predicted number of international patents per million persons in each country based on that country’s fundamental investmentsin the elements of national innovative capacity. Because of data limitations, we were unable to calculate a reliable index forother leading patentors, including Panama and Jamaica.
16 Venezuela constitutes an interesting anomaly in this regard, as its actual rate of patenting greatly exceeds the rate achieved byother countries, despite its having a low measured index of national innovative capacity. Closer investigation reveals, however,that more than 95% of the patenting in Venezuela is attributable in most years to a single company (Intevep) which, while aworld-class innovator itself, does not seem to be closely connected with other institutions or clusters of firms in Venezuelan.Indeed, the Venezuelan experience accentuates a key aspect of our model of national innovative capacity. The long-termability to translate national innovative capacity into widespread international competitiveness relies on strength in multipleareas: a single area of expertise is unlikely to yield long-term national competitive advantage.

12
degree to which national innovative capacity is more than simply a measure of economywide
wealth but reflects specific investments and policies related to an economy’s ability to produce and
commercialize new-to-the-world innovation, a finding in our prior research on OECD economies.
Finally, the remaining countries are estimated to have much lower levels of national innovative
capacity (all below 0.4): even though countries such as Columbia, Mexico and Venezuela have
achieved similar levels of GDP per capita as Chile and Brazil in the late 1990s, our estimates
suggest that these countries have invested less intensively in becoming world-class innovator
economies.
Table 5 highlights some of the specific factors which contribute to the different estimated
levels of national innovative capacity across Latin America. With respect to each of these
dimensions, Argentina is among the leaders; in particular, it possesses a substantial advantage with
respect to the number of scientists and engineers employed per capita. Each of the top four
countries according the index (Argentina, Chile, Brazil and Costa Rica) displays at least some
areas of strength. For example, Chile employs a relatively large number of scientists and engineers
(per capita) and exposes its firms to the pressures of international competition. Though its GDP
per capita is relatively low, Costa Rica has achieved strength across several dimensions of national
innovative capacity by increasing its R&D expenditures, strengthening its intellectual property
institutions, increasing the openness of its economy to international competition, and increasing
the share of R&D funded by the private sector (Porter and Kettelhohn, 2000; Hill, 2000).17
Finally, though several countries in Latin America are in the process of improving their
national innovative capacity, there remains an important gap between the experience of this region
and other emerging regions throughout the world. In prior research, we document the exponential
increase in national innovative capacity realized by several emerging economies over the past
quarter century, particularly the Asian NICs (Porter and Stern, 1999). By contrast, the Latin
American experience is characterized by, at best, modest improvements in national innovative
17 However, some countries display a more uneven national innovative capacity profile: for example, though Brazil has increased
R&D expenditures over the past decade (Hill, 2000), Brazil still offers relatively weak intellectual property protection, stillraises barriers to international competition, and devotes a relatively small share of its overall workforce to technologicalinnovation.

13
capacity. Because of data limitations, we are unable to document the changes over the past several
decades in each contributor to national innovative capacity for each of our sample countries.
However, looking at innovation performance (i.e., international patenting), we are able to provide
at least some insight into the differences across emerging regions. During the late 1970s, the
seven Latin American countries in our sample actually realized a higher level of international
patenting than a comparison group of seven emerging Asian economies; in sharp contrast, by the
second half of the 1990, patenting in the Asian economies dwarfs the Latin American output (see
Table 6 and Figure F). This difference in performance reflects, at least in part, the high rate of
investments in national innovative capacity by the emerging Asian economies compared to the
more modest upgrades realized by Latin American nations.
Overall, our analysis suggests that, despite rapid economic growth in much of Latin
America over the past ten years, the region still faces substantial challenges in developing
innovative capacity at a level commensurate with those of leading countries in the OECD.
However, some countries seem to moving to address this challenge. For example, the Costa Rican
government is exerting political leadership encouraging the development of an information
technology-based industrial cluster; these policies are in turn helping to upgrade each element of
Costa Rica’s national innovative capacity (Porter and Kettelhohn, 2000). Maintaining a consistent
record of investments and policy choices to enhance the environment for innovation will be a key
determinant of whether Latin America is able to sustain and enhance its competitiveness over the
next generation.

14
REFERENCES
Abramovitz, M. (1956). “Catching Up, Forging Ahead and Falling Behind,” Journal of EconomicHistory, 46, 385-406.
Arora, A., R. Landau, and N. Rosenberg (1998). Chemicals and Long-Term Economic Growth:Insights from the Chemical Industry. New York (NY): Wiley.
Dertouzos, M.L., Lester, R.K. and R.M. Solow (1989). Made In America: Regaining theProductive Edge, Cambridge (MA): MIT Press.
Eaton, J. and S. Kortum (1996). “Trade in Ideas: Patenting & Productivity in the OECD,”Journal of International Economics, 40(3-4), 251-278.
Eaton, J. and S. Kortum (1999). “International Technology Diffusion: Theory and Measurement,”International Economic Review. 40(3), 537-570.
Evenson, R. (1984). “International Invention: Implications for Technology Market Analysis," inZvi Griliches, ed., R&D, Patents, and Productivity. Chicago (IL): University of ChicagoPress: 89-126.
Griliches, Z. (1984). R&D, Patents, and Productivity. Chicago(IL): University of Chicago Press.
Griliches, Z. (1990). “Patent Statistics as Economic Indicators: A Survey,” Journal of EconomicLiterature, 92, 630-653.
Henderson, R. and I. Cockburn (1994). “Measuring competence? Exploring firm effects inpharmaceutical research,” Strategic Management Journal, 15 (Special Issue), 63-84.
Henderson, R. and I. Cockburn (1996). “Scale, Scope, and Spillovers: The Determinants ofResearch Productivity in Drug Discovery,” Rand Journal of Economics, 27(1), 32-59.
Hill, D. (2000). “Latin America: R&D spending jumps in Brazil, Mexico, and Costa Rica,”NSF00-316, Arlington (VA): National Science Foundation, Division of Science ResourcesStudies.
Jones, C. (1995). “R&D Based Models of Economic Growth,” Journal of Political Economy, 103,739-784.
Jones, C. (1998). Introduction to Economic Growth. New York (NY): W.W. Norton & Co.
Murmann, J.P. (1998). Knowledge and Competitive Advantage in the Synthetic Dye Industry,1850-1914: The Coevolution of Firms, Technology, and National Institutions in Great

15
Britain, Germany, and the United States. Unpublished doctoral dissertation, ColumbiaUniversity.
Nelson, R., ed. (1993). National Innovation Systems: A Comparative Analysis New York (NY):Oxford University Press.
Porter, M.E. (1990). The Competitive Advantage of Nations. New York (NY): Free Press.
Porter, M.E. (1998). “Clusters and Competition: New Agendas for Companies, Governments,and Institutions,” On Competition. Boston (MA): Harvard Business School Press.
Porter, M.E. and S. Stern (1999a). “Measuring the ‘Ideas’ Production Function,” mimeo, MITSloan School of Management.
Porter, M.E. and S. Stern (1999b). The New Challenge to America’s Prosperity: Findings fromthe Innovation Index. Washington (DC): Council on Competitiveness.
Porter, M.E., and N. Kettelhohn (2000). “Building a Cluster: Electronic and InformationTechnology in Costa Rica,” draft, Harvard Business School.
Romer, P. (1990). “Endogenous Technological Change,” Journal of Political Economy, 98, S71-S102.
Schumpeter, J.A. (1950). Capitalism, Socialism, and Democracy. New York : Harper & Row.
Solow, R.M. (1956). “A Contribution to the Theory of Economic Growth,” Quarterly Journal ofEconomics, 70, 65-94.
Stern, S., M.E. Porter, and J.L. Furman (1999). “The Determinants of National InnovativeCapacity,” Harvard Business School Working Paper 00-034.
Trajtenberg, M. (1990). “Patents as Indicators of Innovation,” Economic Analysis of ProductInnovation. Cambridge (MA): Harvard University Press.

16
TABLE 1SAMPLE COUNTRIES
A. OECD SAMPLE COUNTRIES (1973-1995)
Australia France Netherlands United Kingdom
Austria Germany* Norway United States
Canada Italy Spain
Denmark Japan Sweden
Finland New Zealand Switzerland
* Prior to 1990, data for the Federal Republic of Germany include only the federal states of West Germany;beginning in 1991, data for Germany incorporate the New Federal States of the former German DemocraticRepublic.
B. LATIN AMERICAN SAMPLE COUNTRIES
Argentina Brazil Chile Columbia
Costa Rica Mexico Venezuela

17
TABLE 2DETERMINANTS OF THE PRODUCTION OF
NEW-TO-THE-WORLD TECHNOLOGIES
Dependent Variable =ln(INTERNATIONAL PATENTS)j,t+3
National InnovativeCapacity Model
QUALITY OF THE COMMON INNOVATION INFRASTRUCTUREA L GDP PER CAPITAj,t 0.783
(0.096)HA L FTE SCIENTISTS & ENGINEERSj,t (FTE
S&E)0.883
(0.045)HA L $ R&D EXPENDITURESj,t 0.272
(0.044)XINF SHARE OF GDP SPENT ON HIGHER
EDUCATIONj,t
0.152(0.016)
XINF INTELLECTUAL PROPERTYPROTECTIONj,t (survey scale, 1-10)
0.221(0.045)
XINF OPENNESS TO INTERNATIONALTRADEj,t (survey scale, 1-10)
0.061(0.030)
CLUSTER-SPECIFIC INNOVATION ENVIRONMENTYCLUS % R&D FUNDED BY
PRIVATE SECTORj,t
0.016(0.002)
QUALITY OF THE LINKAGESZLINK % R&D PERFORMED BY UNIVERSITY
SECTORj,t
0.009(0.003)
Year fixed effects SignificantAdjusted R-Squared 0.9981Observations (17 countries x 21 years) 347
* The natural logarithm of a variable, X, is denoted L X.

18
TABLE 3TOTAL CUMULATIVE “INTERNATIONAL” PATENTING BY
SELECTED LATIN AMERICAN COUNTRIES, 1976-2000
COUNTRIES
Total PatentsAwarded toInventors by
Country
Ratio of AssigneePatents to
Inventor Patents
Total InventorPatents Per
MillionPopulation
Argentina 692 0.18 19.9Brazil 1,288 0.44 8.1Chile 149 0.33 10.5Colombia 162 0.14 4.2Costa Rica 135 0.13 38.0Dominican Republic 21 0.00 2.7Ecuador 39 0.15 3.4El Salvador 10 0.00 1.8Guatemala 34 0.21 3.4Haiti 12 0.42 1.6Honduras 14 0.29 2.5Jamaica 33 0.06 13.3Mexico 1,292 0.31 14.2Nicaragua 4 0.00 0.9Panama 59 1.73 22.4Paraguay 1 0.00 0.2Peru 70 0.13 3.0Uruguay 5 0.40 1.6Venezuela 553 0.56 25.3
* Inventor Patents refer to the total number of patents granted by the USPTO to inventors in each of the countriesbetween 1976 and May, 2000. Assignee Patents refers to the total number of patents granted by the USPTO andassigned to establishments or individuals in each of the countries between 1976 and May, 2000. Per capita patentingbased on RICYT 1996 population data.
Source: US Patent and Trademark Office (www.uspto.gov), 2000.

19
TABLE 4NATIONAL INNOVATIVE CAPCITY INDEX RANKINGS
SELECTED LATIN AMERICAN COUNTRIES, 1998
Country NIC Index
Argentina 2.50
Brazil 1.12
Chile 1.08
Costa Rica 0.64
Mexico 0.37
Colombia 0.29
Venezuela 0.16

20
TABLE 5SELECTED DETERMINANTS OF NATIONAL INNOVATIVE CAPCITY,
SELECTED LATIN AMERICAN COUNTRIES, 1998
Country name
FTE R&DWorkers perMillion Pop.
R&DExpenditure
($M) perMillion Pop.
Strength ofIntellectual
PropertyProtection
Openness toInternationalCompetitionand Trade
Argentina 1,212.2 32.8 4.7 8.5Brazil 433.7 35.3 3.3 5.4Chile 639.2 32.0 6.1 8.8Colombia n/a 9.0 5.0 5.0Costa Rica 557.0 32.2 6.0 6.0Mexico 365.3 15.2 6.1 7.9
Sources: RICYT, 2000; World Competitiveness Report (various years); and author calculations.

21
TABLE 6“INTERNATIONAL” PATENTING BY EMERGING
LATIN AMERICAN and ASIAN ECONOMIES1976-1980 & 1995-1999
Country 1976-1980 1995-1999 Growth RateEmerging Latin American Economies
Argentina 115 228 0.98Brazil 136 492 2.62Chile 12 60 4.00Colombia 28 42 0.50Costa Rica 22 48 1.18Mexico 124 431 2.48Venezuela 50 182 2.64
Emerging Asian EconomiesChina 3 577 191.33Hong Kong 176 1,694 8.63India 89 485 4.45Malaysia 13 175 12.46Singapore 17 725 41.65South Korea 23 12,062 523.43Taiwan 135 15,871 116.56
Source: US Patent and Trademark Office (www.uspto.gov), 2000.

Figure AMeasuring National Innovative Capacity
Common InnovationInfrastructure
Common InnovationInfrastructure
Cluster-SpecificConditions
Cluster-SpecificConditions
Quality of LinkagesQuality of Linkages

Figure BThe Common Innovation Infrastructure
At
HA,t
XINF,t
Includes resource commitments andpolicy choices such as:
•Investment in education & training
• Intellectual property protection
• Openness to international trade
• R&D tax policies
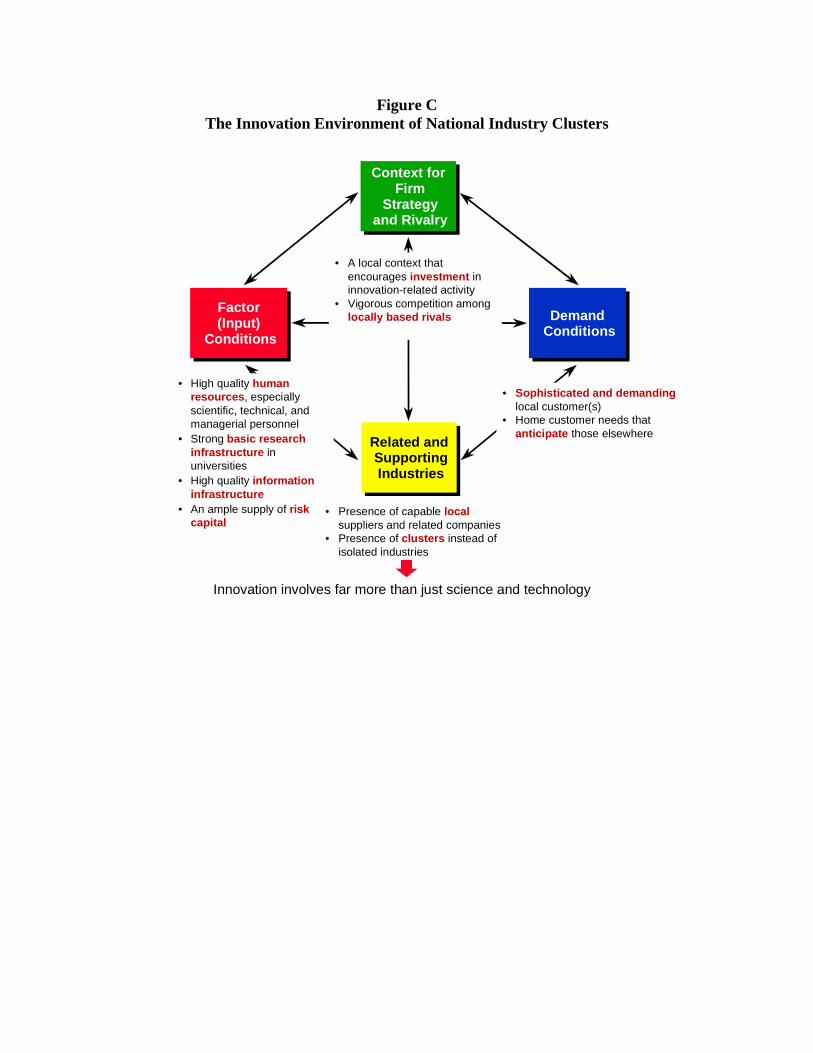
Figure CThe Innovation Environment of National Industry Clusters
• A local context thatencourages investment ininnovation-related activity
• Vigorous competition amonglocally based rivals
Context forFirm
Strategyand Rivalry
Context forFirm
Strategyand Rivalry
Related andSupportingIndustries
Related andSupportingIndustries
Factor(Input)
Conditions
Factor(Input)
Conditions
• Sophisticated and demandinglocal customer(s)
• Home customer needs thatanticipate those elsewhere
DemandConditionsDemand
Conditions
• High quality humanresources, especiallyscientific, technical, andmanagerial personnel
• Strong basic researchinfrastructure inuniversities
• High quality informationinfrastructure
• An ample supply of riskcapital
• Presence of capable localsuppliers and related companies
• Presence of clusters instead ofisolated industries
Innovation involves far more than just science and technology

Figure D-1
International Patents per Million Persons
(selected countries)
0
50
100
150
200
250
1975
1977
1979
1981
1983
1985
1987
1989
1991
1993
1995
Year
Pate
nts
per M
illio
n Pe
rson
s
Austria
France
Germany, FR
Italy
Japan
Sweden
Switzerland
USA

Figure D-2
International Patents per Million Persons
(selected countries)
0
10
20
30
40
50
60
70
80
90
100
1975
1977
1979
1981
1983
1985
1987
1989
1991
1993
1995
Year
Pate
nts
per M
illio
n Pe
rson
s
Australia
Canada
Denmark
Finland
Netherlands
New Zealand
Norway
Spain
UK
* Note: Scale differs from D-1 in order to highlight cross-country differences in this sample.

Figure E-1
Trends in National Innovative Capacity
(selected countries)
0
50
100
150
200
250
1973
1975
1977
1979
1981
1983
1985
1987
1989
1991
1993
1995
Year
Expe
cted
Pat
ents
per
Mill
ion
Pers
ons
Austria
France
Germany, FR
Italy
Japan
Switzerland
USA
Sweden

Figure E-2
Trends in National Innovative Capacity
(selected countries)
0
10
20
30
40
50
60
70
80
90
1973
1975
1977
1979
1981
1983
1985
1987
1989
1991
1993
1995
Year
Expe
cted
Pat
ents
per
Mill
ion
Pers
ons
Australia
Canada
Denmark
Finland
Netherlands
New Zealand
Norway
UK
Spain
* Note: Scale differs from E-1 in order to highlight cross-country differences in this sample.

FIGURE F
CHANGING PATTERNS OF "INTERNATIONAL" PATENTING
0
5000
10000
15000
20000
25000
30000
35000
1976-1980 1995-1999
Emerging Latin American Economies Emerging Asian Economies