THE DRI THERMAL/OPTICAL REFLECTANCE CARBON ANALYSIS … · THE DRI THERMAL/OPTICAL REFLECTANCE...
17
Atmospheric Environment Vol. 27A. No. 8, pp. 1185 1201, 1993. 0004 6981/93 $6.00+0.00 Printed in Great Britain. Pergamon Press Lid THE DRI THERMAL/OPTICAL REFLECTANCE CARBON ANALYSIS SYSTEM: DESCRIPTION, EVALUATION AND APPLICATIONS IN U.S. AIR QUALITY STUDIES JUDITH C. CHOW, JOHN G. WATSON, LYLE C. PRITCHETT, WILLIAM R. PIERSON, CLIFTON A. FRAZ1ER and RICHARD G. PURCELL Desert Research Institute, P.O. Box 60220, RenD, NV 89506, U.S.A. (First received 21 June 1991 and in final form 15 July 1992) Abstract The thermal/optical reflectance method of carbon analysis developed by Huntzicker et al. (in Particulate Carbon, Atmospheric Life Cycle, edited by Wolff G. T. and Klimisch R. L., pp. 79-88, Plenum Press, New York, 1982) has been adapted by several laboratories for the quantification of organic and elemental carbon on quartz-fiber filter deposits. While the principle used by these laboratories is identical to that of Huntzicker et al., the details differ with respect to calibration standards, analysis time, temperature ramping and volatilization/combustiontemperatures. This paper reports a variation on this method which has been applied to over 27,000 samples taken in more than a dozen urban and regional air quality studies in the U.S.A. In this variation, a 0.5 cm 2 punch from a filter is submitted to volatilization at temperatures of 120, 250, 450 and 550°C in a pure helium atmosphere, then to combustion at temperatures of 550, 700 and 800°C in a 2% oxygen and 98% helium atmosphere. The carbon which evolves at each temperature is converted to methane and quantified with a flame ionization detector. The seven separate carbon fractions facilitate evaluation of the method and increase the information content concerning the samples. The reflectance from the deposit side of the filter punch is monitored throughout the analysis. This reflectance usually decreases during volatilization in the helium atmosphere owing to the pyrolysis of organic material. When oxygen is added, the reflectance increases as the light-absorbing carbon is combusted and removed. Organic carbon is defined as that which evolves prior to re-attainment of the original reflectance, and elemental carbon is defined as that which evolves after the original reflectance has been attained. By this definition, "organic carbon" is actually organic carbon that does not absorb light at the wavelength used (632.8 nm) and "elemental carbon" is light-absorbing organic and elemental carbon. Assumptions underlying the procedure are discussed, as well as comparisons with other methods and recommendations for further work. Key word index: Aerosol, air pollution, organic and elemental carbon, light-absorbing carbon, thermal/op- tical method, reflectance/transmission, pyrolysis. INTRODUCTION Organic and elemental carbon have been found to be significant causes of light extinction and to be major chemical constituents of atmospheric aerosols (e.g. PM2.5, PMI0, TSP; particulate matter with aerodyn- amic diameter (dp) less than 2.5, 10 or 30 #m, respect- ively). By examining 1300 aerosol samples collected in 1975 from 66 urban and rural sites in the U.S.A. Shah (1981) and Shah et al. (1986) reported that carbon- aceous material constituted, on average, 13% of TSP mass; some two-thirds of the carbon was organic, attributed mostly to combustion. In the eastern Mid- west in 1980-1981, typically 19% of the TSP mass was carbon (Huntzicker et al., 1986), some two-thirds of which was organic, attributed mostly to combustion. In the Los Angeles Air Basin in 1982, typically 40% of the fine-particle mass (dp ~< 2.1 pm) was carbonaceous material (Gray et al., 1986), some two-thirds of which was organic, attributed mostly to primary emissions. Light extinction by particulate organic carbon occurs primarily through scattering, with efficiency between 2 and 5.5 m 2 g- ~ (Japar et al., 1981; Shah et al., 1984; Trijonis et al., 1988; Watson et al., 1988a, b,c; Pierson et al., 1989), depending on the relative humid- ity. Elemental carbon is the major contributor to light absorption (Rosen et al., 1978; Japar et al., 1986; Adams et al., 1990a, b) in the atmosphere, with an extinction efficiency of approximately 10 m 2 g- 1 at a wavelength (2) of 515 nm and varying as 1/2 (Japar and Szkarlat, 1981; Szkarlat and Japar, 1981, 1983; Japar et al., 1984b, 1986; Trijonis et al., 1988; Watson et al., 1988c; Adams et al., 1989, 1990a). Because carbon is such an abundant component of suspended particles (in gram-atoms it is more abund- ant than is sulfate in gram-moles), simple and reliable methods are needed to quantify it in ambient air samples. At the same time it is important to try to distinguish between organic and elemental carbon because of their differing origins and differing atmo- spheric chemical and optical properties. Thermal/optical analysis has usually been used to quantify organic and elemental carbon in source and receptor aerosol samples in air quality studies conducted in the U.S.A. There are several variations on this method with respect to: (1) the temperatures to which samples are subjected, (2) the length of analysis time at each temperature, (3) the rate of temperature 1185
Transcript of THE DRI THERMAL/OPTICAL REFLECTANCE CARBON ANALYSIS … · THE DRI THERMAL/OPTICAL REFLECTANCE...

Atmospheric Environment Vol. 27A. No. 8, pp. 1185 1201, 1993. 0004 6981/93 $6.00+0.00 Printed in Great Britain. Pergamon Press Lid
THE DRI THERMAL/OPTICAL REFLECTANCE CARBON ANALYSIS SYSTEM: DESCRIPTION, EVALUATION AND
APPLICATIONS IN U.S. AIR QUALITY STUDIES
JUDITH C. CHOW, JOHN G. WATSON, LYLE C. PRITCHETT, WILLIAM R. PIERSON, CLIFTON A. FRAZ1ER a n d RICHARD G. PURCELL
Desert Research Institute, P.O. Box 60220, RenD, NV 89506, U.S.A.
(First received 21 June 1991 and in final form 15 July 1992)
Abstract The thermal/optical reflectance method of carbon analysis developed by Huntzicker et al. (in Particulate Carbon, Atmospheric Life Cycle, edited by Wolff G. T. and Klimisch R. L., pp. 79-88, Plenum Press, New York, 1982) has been adapted by several laboratories for the quantification of organic and elemental carbon on quartz-fiber filter deposits. While the principle used by these laboratories is identical to that of Huntzicker et al., the details differ with respect to calibration standards, analysis time, temperature ramping and volatilization/combustion temperatures. This paper reports a variation on this method which has been applied to over 27,000 samples taken in more than a dozen urban and regional air quality studies in the U.S.A. In this variation, a 0.5 c m 2 punch from a filter is submitted to volatilization at temperatures of 120, 250, 450 and 550°C in a pure helium atmosphere, then to combustion at temperatures of 550, 700 and 800°C in a 2% oxygen and 98% helium atmosphere. The carbon which evolves at each temperature is converted to methane and quantified with a flame ionization detector. The seven separate carbon fractions facilitate evaluation of the method and increase the information content concerning the samples.
The reflectance from the deposit side of the filter punch is monitored throughout the analysis. This reflectance usually decreases during volatilization in the helium atmosphere owing to the pyrolysis of organic material. When oxygen is added, the reflectance increases as the light-absorbing carbon is combusted and removed. Organic carbon is defined as that which evolves prior to re-attainment of the original reflectance, and elemental carbon is defined as that which evolves after the original reflectance has been attained. By this definition, "organic carbon" is actually organic carbon that does not absorb light at the wavelength used (632.8 nm) and "elemental carbon" is light-absorbing organic and elemental carbon. Assumptions underlying the procedure are discussed, as well as comparisons with other methods and recommendations for further work.
Key word index: Aerosol, air pollution, organic and elemental carbon, light-absorbing carbon, thermal/op- tical method, reflectance/transmission, pyrolysis.
INTRODUCTION
Organic and elemental carbon have been found to be significant causes of light extinction and to be major chemical constituents of atmospheric aerosols (e.g. PM2.5, PMI0, TSP; particulate matter with aerodyn- amic diameter (dp) less than 2.5, 10 or 30 #m, respect- ively). By examining 1300 aerosol samples collected in 1975 from 66 urban and rural sites in the U.S.A. Shah (1981) and Shah et al. (1986) reported that carbon- aceous material constituted, on average, 13% of TSP mass; some two-thirds of the carbon was organic, attributed mostly to combustion. In the eastern Mid- west in 1980-1981, typically 19% of the TSP mass was carbon (Huntzicker et al., 1986), some two-thirds of which was organic, attributed mostly to combustion. In the Los Angeles Air Basin in 1982, typically 40% of the fine-particle mass (dp ~< 2.1 pm) was carbonaceous material (Gray et al., 1986), some two-thirds of which was organic, attributed mostly to primary emissions.
Light extinction by particulate organic carbon occurs primarily through scattering, with efficiency between 2 and 5.5 m 2 g- ~ (Japar et al., 1981; Shah et al., 1984; Trijonis et al., 1988; Watson et al., 1988a, b,c;
Pierson et al., 1989), depending on the relative humid- ity. Elemental carbon is the major contributor to light absorption (Rosen et al., 1978; Japar et al., 1986; Adams et al., 1990a, b) in the atmosphere, with an extinction efficiency of approximately 10 m 2 g- 1 at a wavelength (2) of 515 nm and varying as 1/2 (Japar and Szkarlat, 1981; Szkarlat and Japar, 1981, 1983; Japar et al., 1984b, 1986; Trijonis et al., 1988; Watson et al., 1988c; Adams et al., 1989, 1990a).
Because carbon is such an abundant component of suspended particles (in gram-atoms it is more abund- ant than is sulfate in gram-moles), simple and reliable methods are needed to quantify it in ambient air samples. At the same time it is important to try to distinguish between organic and elemental carbon because of their differing origins and differing atmo- spheric chemical and optical properties.
Thermal/optical analysis has usually been used to quantify organic and elemental carbon in source and receptor aerosol samples in air quality studies conducted in the U.S.A. There are several variations on this method with respect to: (1) the temperatures to which samples are subjected, (2) the length of analysis time at each temperature, (3) the rate of temperature
1185

1186 J.C. CHow et al.
increase, (4) the composition of the atmosphere sur- rounding the sample, (5) optical monitoring of pyrol- ysis/volatilization/combustion and (6) calibration standards. As will be shown in this paper, these differences in the application of thermal/optical meth- ods have little effect on the total carbon measured on a sample, but can have a significant effect on the point of delineation between organic and elemental carbon. The same is true for other carbon analysis methods. For this reason, it is essential that any widely used method or variation thereon be properly documented.
The objectives of this paper are:
• to describe the DRI thermal/optical reflectance (TOR) carbon analysis method,
• to evaluate it and compare it to other variations of the TOR method and to other carbon analysis methods,
• to discuss its application in major studies conduc- ted to date.
BACKGROUND
The TOR carbon analysis hardware and procedure are based on the preferential volatilization and oxida- tion of organic compounds and elemental carbon at different temperatures. The evolution of the concept of thermal/optical analysis is evident in a series of early papers by Novakov and colleagues (Rosen et al., 1977, 1979; Novakov, 1981, 1982). The present DRI version of the TOR method derives from research conducted at the Oregon Graduate Center (OGC, now Oregon Graduate Institute or OGI, Beaverton, OR) since 1975, as well as similar research in other laboratories (e.g. Johnson and Huntzicker, 1979; Cadle et al., 1980a, b, 1983; Johnson, 1981; Johnson et al., 1981; Mueller et al., 1981; Cadle and Groblicki, 1982; Hun- tzicker et al., 1982; Tanner et al., 1982; Adams et al., 1989; Tanner and Miguel, 1989). The first application of the thermal method to quantifying sources of suspended particulate matter was in the Portland Aerosol Characterization Study (PACS; Watson, 1979) where it was applied, but without the optical feature, to over 1000 source and ambient aerosol samples. The PACS was the first study ever to apply carbon analysis in the development of State Imple- mentation Plans (SIPs) for suspended particulate mat- ter, and it was the first study to identify emissions from wood combustion as a major contributor to urban ambient particulate concentrations. In the PACS, volatilizable (organic) carbon was defined as that which evolved between ambient temperature and 600°C in a 100% helium (He) atmosphere, and non- volatilizable (elemental) carbon was defined as that which evolved at 600°C in a 2% oxygen (02)/98% He atmosphere (Johnson and Huntzicker, 1979).
During the PACS analysis it was recognized from the darkening of the samples that, in the absence of O z, some of the deposit on the filter would char when
temperatures exceeded 300°C. This charred organic material would burn along with the particulate ele- mental carbon when 02 was added. Efforts were made with this first-generation carbon analyser to minimize this artifact by dividing the analysis into several temperature ranges. The artifact was minimized when as much carbon as possible was volatilized below 300°C. Without some means to quantify this "pyro- lysis" (charring) effect, however, it was found that significant fractions of the organic carbon might be measured as elemental carbon. It is probably true, moreover, that the organic compounds most likely to contribute to the pyrolysis problem are also the ones least removable by volatilization (or by solvent ex- traction).
After PACS, a second-generation carbon analyser was developed at OGC in which the reflectance of a helium-neon (He-Ne) laser light focused onto the sampling substrate was continuously monitored throughout the analysis (Johnson, 1981; Johnson et al., 1981). The sample was subjected to the following sequence of five conditions: 2% 02/98% He at 350°C, pure He at 600°C, 2% 02/98% He at 400°C, 2% 02/98% He at 500°C, 2% 02/98% He at 600°C. During analysis, the reflected light intensity normally decreased in He at temperatures exceeding 350°C. By the time the temperature reached ~600°C, the re- flected light intensity had attained its minimum value. Before 0 2 was added to the He atmosphere, the temperature of the oven was dropped to 400°C. When 0 2 was added, the reflected light intensity increased at a rapid rate. In this second-generation method, "vola- tile organic carbon" was defined as carbon evolved in 2% 02/98% He at 350°C. "Residual organic carbon" was defined as all of the carbon which evolved be- tween 350 and 600°C in pure He plus that which evolved at 400°C in 2% 02/98% He before the reflected light intensity regained its initial value. "Or- ganic carbon" was defined as the sum of volatile and residual organic carbon. The carbon which sub- sequently evolved at ~>400°C in 2% 02/98% He was defined as "elemental carbon". Shah (1981) re-ana- lysed the PACS samples and found that, even though total carbon concentrations were reduced by about 20% because of organic aerosol losses over the 3-year storage period, the elemental-to-total-carbon ratios using the thermal/optical approach were nevertheless lower than those measured during the PACS without optical pyrolysis correction.
Development of a third-generation instrument was initiated by Rau (1986) between 1980 and 1986. The fiber optic system of the present OGI and DRI instruments, as well as many configurational and design improvements such as the present flow control and flow patterns, oven controller, methanator and flame ionization detector (FID) power supply, all date from that work.
With the advent of the federal PM10 standard (Federal Register, 1987a, b), and EPA's guidance (EPA, 1987) to use receptor model source appor-

Thermal/optical reflectance carbon analysis 1187
? / /
i ] [ detector~t
Sample I Sample ~J port oven ]
t ] Oxidation I II °yen I | Oven control
Temperature monitor ] 1 R e flig~ltalnC¢ [
Microcomputer Gas flow control
i I Methanator ]
FID signal
Fig. 1. DRI thermal/optical reflectance carbon analyser block diagram.
tionment to develop emissions reduction strategies, the demand for carbon analysis increased signific- antly. These demands required better temperature control, sample presentation and reliability than could be provided by the one-of-a-kind research units. The hardware and procedures reported here were de- veloped at DRI to meet those needs. As the hardware has evolved, features have been added which allow substantial flexibility for research into the chemical nature of atmospheric particulate carbon and its measurement. Basic hardware improvements continue to be made as more precise and reliable components become available. These recent improvements en- hance efficiency and reliability, but do not affect the fundamental TOR analysis principle.
THERMAL/OPTICAL REFLECTANCE ('FOR) CARBON ANALYSER
The hardware for the third-generation TOR instru- ment built at DRI is shown in Fig. 1. The configura- tion of the volatilization/combustion area is shown in Fig. 2. Figure 3 is a photograph of the instrument. Except for the software and specific temperatures used, its operating details are very similar to the present OGI system.
The analyser operates by: (1) liberating carbon compounds under different temperature and oxida- tion environments from a small sample punch taken from a quartz-fiber filter, (2) converting these com- pounds to carbon dioxide (CO2) by passing the vola-
tilized compounds through an oxidizer (MnO 2 at 912°C), (3) reduction of the CO 2 to methane (CH4) by passing the flow through a methanator (firebrick impregnated with nickel catalyst at ~550°C in a stream of hydrogen) and (4) quantification of CH, by FID.
The correction for pyrolysis is made by continu- ously monitoring the filter reflectance (via a He Ne laser at a wavelength of 632.8 nm and a photodetector) throughout an analysis cycle. This reflectance, largely dominated by the presence of elemental carbon and light-absorbing heavy organic materials, decreases as pyrolysis takes place and increases as light-absorbing carbon is burned during the latter part of the analysis cycle. By monitoring the reflectance until it returns to its initial value, the portion of the elemental carbon peak corresponding to pyrolysed organic carbon can be assigned to the organic fraction. A 632-nm band- pass filter is used to block light emitted by the sample oven from reaching the photodetector.
Samples that are intended for carbon analysis are collected on quartz-fiber filters that had first been heated in air at 900°C for 3 h to lower the blank. For routine analysis, a 0.5 cm 2 circular punch is removed from the filter and placed vertically into a quartz boat, which is inserted into the oven area with a thermo- couple that also serves as a pushrod (see Fig. 2). The system after sealing is first flushed with He for 4 min to remove any residual oxygen. It is imperative also that there be an in-line scrubber to remove the last traces of 0 2 from the He coming out of the gas cylinder. A microcomputer controls the valves and the oven
1188 J.C. CHOW et al.
Te smcPeroatrUre Sample
Thermocouple pushrod Sample boat detail Quartz rod/
Acid injection (analysis position) light pipe port Quartz / Fiber
/ sample boat Heating coil / optic ~ ~ f H e N e l a s e r
/ , _ _ S a m p l e _ , Idle / / ~ . 632 n m / [ / " 1 " ~ / loaalng port zone / / ~ bandpass filter ]
Oven Punch drying ] ~ . . . . Photodetector #
support zone [ ~ Uxlaatlon Volatilization/ ~ o n e (MnO2)
Gas flow Gas flow to oven from oven
to Metbanator
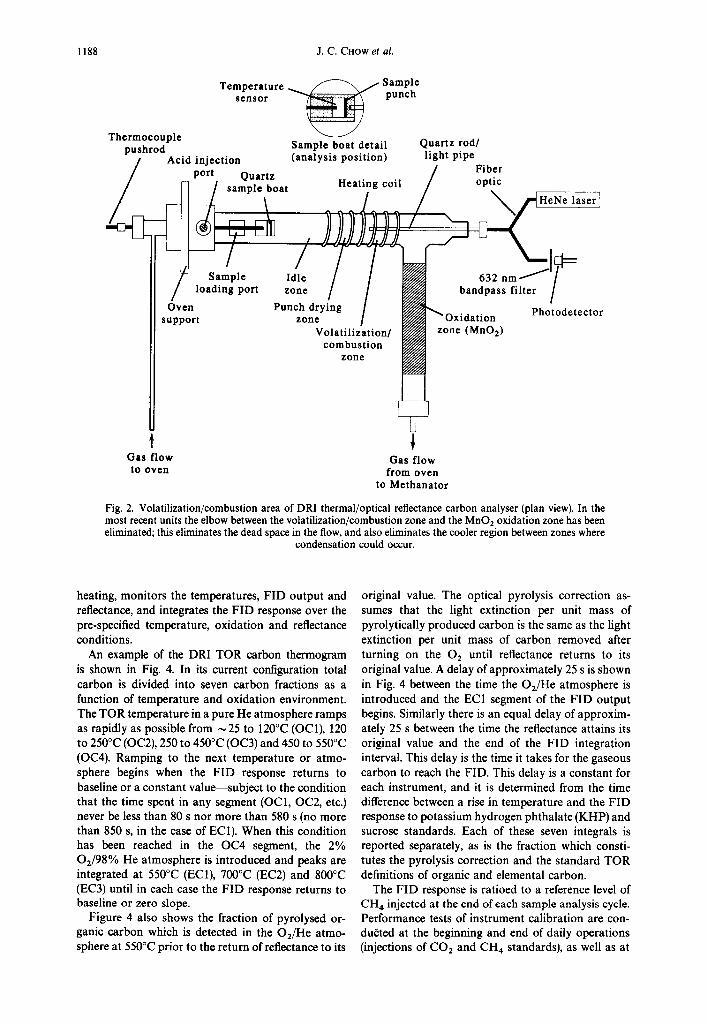
Fig. 2. Volatilization/combustion area of DRI thermal/optical reflectance carbon analyser (plan view). In the most recent units the elbow between the volatilization/combustion zone and the MnO2 oxidation zone has been eliminated; this eliminates the dead space in the flow, and also eliminates the cooler region between zones where
condensation could occur.
heating, monitors the temperatures, FID output and reflectance, and integrates the FID response over the pre-specified temperature, oxidation and reflectance conditions.
An example of the DRI TOR carbon thermogram is shown in Fig. 4. In its current configuration total carbon is divided into seven carbon fractions as a function of temperature and oxidation environment. The TOR temperature in a pure He atmosphere ramps as rapidly as possible from ~25 to 120°C (OC1), 120 to 250°C (OC2), 250 to 450°C (OC3) and 450 to 550°C (OC4). Ramping to the next temperature or atmo- sphere begins when the FID response returns to baseline or a constant value--subject to the condition that the time spent in any segment (OC1, OC2, etc.) never be less than 80 s nor more than 580 s (no more than 850 s, in the case of EC1). When this condition has been reached in the OC4 segment, the 2% 02/98% He atmosphere is introduced and peaks are integrated at 550°C (EC1), 700°C (EC2) and 800°C (EC3) until in each case the FID response returns to baseline or zero slope.
Figure 4 also shows the fraction of pyrolysed or- ganic carbon which is detected in the O2/I-Ie atmo- sphere at 550°C prior to the return of reflectance to its
original value. The optical pyrolysis correction as- sumes that the light extinction per unit mass of pyrolytically produced carbon is the same as the light extinction per unit mass of carbon removed after turning on the 02 until reflectance returns to its original value. A delay of approximately 25 s is shown in Fig. 4 between the time the O2/He atmosphere is introduced and the EC1 segment of the FID output begins. Similarly there is an equal delay of approxim- ately 25 s between the time the reflectance attains its original value and the end of the FID integration interval. This delay is the time it takes for the gaseous carbon to reach the FID. This delay is a constant for each instrument, and it is determined from the time difference between a rise in temperature and the FID response to potassium hydrogen phthalate (KHP) and sucrose standards. Each of these seven integrals is reported separately, as is the fraction which consti- tutes the pyrolysis correction and the standard TOR definitions of organic and elemental carbon.
The FID response is ratioed to a reference level of CH 4 injected at the end of each sample analysis cycle. Performance tests of instrument calibration are con- dueted at the beginning and end of daily operations (injections of CO 2 and CH 4 standards), as well as at

Thermal/optical reflectance carbon analysis 1189
Flame Acid Oxidation Ionization
Injection Port Oven Detector
Sample Oven Temperature Flow Controllers /
Controller Rotometers
Carrier Gas Supply
Line
Calibration Sample Gas Injection Oven
Port
Fig. 3. Carbon
Methanator Oven Oxidation Oven Temperature Temperature
Controller Controller
analysis hardware.
the end of each sample run (integration of CH 4 reference peak, Fig. 4). All intervening samples are re- analysed if the calibration changes by more than 5%. Table 1 summarizes the precision and accuracy of the T a R system. Detailed carbon analysis procedures can be found in the DRI standard operating procedure (Pritchett et al., 1990).
The system is calibrated every 6 months by ana- lysing samples of known amounts of CH 4, COz, sucrose and KHP. Shifts between calibrations are found to be only around 1-3%. American Chemical Society (ACS) certified reagent-grade crystal sucrose and KHP are burned as verification of the organic carbon fractions. Realistic ambient aerosol standards for organic and elemental carbon and to validate the organic/elemental carbon split are still lacking.
One of the greatest concerns in thermal or thermal/ optical carbon analysis is to be sure that trace O z is not present during the organic carbon part of the analysis--from leaks, inadequate He purification, or any other cause. Trace 0 2 , if present, will cause organic carbon to be overestimated and elemental carbon correspondingly underestimated. To check on this, the FID signal approaching the end of OC4 is monitored for any continuing downward drift that would signify the presence of trace 02. It has been suggested (S. H. Cadle, 1992, pers. commun.) that filters very lightly loaded with carbon black could be run from time to time as a further check for trace O2.
Central to the optical pyrolysis-correction concept is the presumption, stated above, that the light absorp- tion per unit mass of pyrolytically produced carbon is equal to the light absorption per unit mass of carbon burned in restoring the reflectance to its initial value (i.e. that the amount of carbon pyrolysed in creating the reflectance decrease and the amount of carbon burned in canceling the decrease are the same). There is no fundamental reason why they have to be exactly the same; and indeed they may not be (see comparison between photoacoustic and thermal/optical/extrac- tion measurements below). Accordingly, there can be a residual bias in the demarcation between light-absorb- ing and non-light-absorbing carbon. This bias can be in either direction, in principle, resulting in under- correction or overcorrection for pyrolysis. The bias would appear largest when stated as a percentage of organic carbon, or elemental carbon, in cases where the other species predominates. Usually organic car- bon is the more abundant, so the percentage effect is more significant for the elemental carbon. To date there are no estimates of possible magnitudes of such biases, but of course they would be smaller than the error of having no optical correction at all.
Another optical effect to be considered is that of light-absorbing organic carbon. If volatilizable, it should manifest itself in the thermogram by an in- crease in reflectance before the 02 is switched on. Such increases are occasionally observed, but generally only

1190 J.C. CHOW et al.
Methane Reference
Organic Carbon ~ ~ ~ Elemental Carbon k Peak
800 - i
100%He ~" t i 2 % O 2 / 9 8 % H e ! 1
700 - ~ Laser
- - 25 sac ~ " ~ ~ ; " - - - Reflectance
i - / / , 6OO- Init ial
Reflectance /
I
I ~ ~ . ~ Pyrolized Carbon
, i \ I ~ 25 sac ~ :
I I Temperature
_ J 200 -
1 O 0 - [ ~ F I D Ou tpu t
- - • OC 1"--'~"
200 400 600 800 1000 1200 1400 1600 1800 2000 2200
TIME (sec)
Fig. 4. Example of DRI thermal/optical reflectance carbon analyser thermogram. Reflectance and FID output are in relative units. Reflectance is normalized to initial reflectance and FID output is normalized to the area of the reference peak. This is an ambient sample collected on
17 May 1989 in Yellowstone National Park.
==' 5 0 0 -
4 0 0 - < Ci: uJ a .
3 0 0 - p-
Table 1. Specifications of the DRI thermal/optical reflectance carbon analyser
Subject Specification
Sample requirements Substrata: quartz-fiber filter, Pallflex 2500QAT-UP or equivalent Substrate pretreatment: pre-fired at 900°C for at least 3 h (before
sampling) Sample size: 0.5 cm 2 punch (uniform deposit) Sample storage: store below 4°C 880-4890 s (15-82 min) 0.2-750/ag carbon cm -2 0.2 #g carbon cm- 2 0.1% of full scale 0.2% of full scale _+ IO°C at temperatures <450°C +3°C at temperatures >~450°C
Analysis time Measurement range Detection limit FID precision Reflectance signal precision Sample oven temperature precision
Oxidation oven temperature
Methanator oven temperature
Lower quantifiable limits
Total carbon accuracy Total carbon precision
OC/EC split precision OC/EC split accuracy
912_+5°C
550+5°C Organic carbon: 0.5-1.0 #g carbon cm-2 Elemental carbon: 0.0-0.2 gg carbon cm- 2 Carbonate carbon: 0.0-0.4 #g carbon cm- 2
+5% For sample loading < 10 #g carbon cm-2: +0.5#g carbon cm -2 For sample loading /> 10 #g carbon cm-2: +3% 5% of the total carbon measurement To be determined*
* Probably 10% of the total carbon, by inference from the similar OGI instrument (Johnson et al., 1981).

Thermal/optical reflectance carbon analysis 1191
in soil (not aerosol) samples where it is suspected that internal oxidant is involved. This common absence of increase implies that any light-absorbing organic ma- terial is ordinarily not volatilizable at or below 550°C in a sufficient amount to be observable above the pyrolysis effect, which operates in the opposite direc- tion. In general, then, thermal/optical methods all cause light-absorbing organic carbon to be classified together with (hence, as) elemental carbon. Further- more, any organic carbon, light-absorbing or not, evolving after the pyrolysis correction depicted in Fig. 4 will be classified as elemental carbon.
To recapitulate, "elemental carbon" as measured by any thermal/optical method comprises:
(1) elemental carbon, (2) light-absorbing organic carbon, (3) organic carbon, light-absorbing or not, evolving
after the pyrolysis correction, (4) bias, in either direction, in the pyrolysis correction.
Another interference we have seen is a color change by certain non-carbon species, which affects reflec- tance; fortunately, this is very rare.
Total carbon (commonly designated as TC) is the sum of organic carbon (OC), elemental carbon (EC) and carbonate carbon (e.g. Na2CO3, MgCO 3, K2CO3, CaCO3). Carbonate carbon can be deter- mined by measuring the CO 2 evolved upon acidific- ation of the sample punch before the normal carbon analysis cycle. For carbonate determination, a 25/zl microsyringe is used to inject 20 ~1 of 0.4 M hydro- chloric acid onto the filter punch via the injection port. The sample oven is maintained at ambient temper- ature while the heating coil (Fig. 2) is off, and the evolved CO2 is measured as CH 4 by the FID in a 2% 02/98% He atmosphere. The sample punch is dried at 40°C after the FID output returns to baseline prior to commencing the routine carbon analysis.
The carbonate procedure is usually not applied in carbon analysis, since carbonate carbon has been found to constitute less than 5% of the total carbon in most samples. Without acidification, carbonate car- bon is detected as either organic or elemental carbon. According to their listed decomposition temperatures, carbonates could evolve in almost any region of the thermogram (e.g. CaCO 3, aragonite, 825°C). Novakov and colleagues (Novakov, 1981, 1982; Rosen et al., 1982) state that carbonate in their ambient aerosol samples evolved mainly at ~ 600°C, which would put it in the EC2 region of Fig. 4. Thus, even if carbonate amounts to less than 5% of the total carbon it can represent a substantial percentage of apparent ele- mental carbon if not removed first by acidification. This should always be considered in deciding whether or not to dispense with the carbonate procedure on a given type of sample. The carbonate blank introduced by absorption of ambient CO 2 onto the quartz-fiber filter also deserves consideration, especially since pre- firing the filter probably creates alkaline surface sites.
Salts of volatile organic acids, if present, will con- tribute to the carbonate reading and will be corres- pondingly missing from the organic analysis if the carbonate procedure is used. An illustrative example might be sodium acetate:
HCI(g) + N a A c ~ NaC1 + HAc(g)T.
Thus "carbonate carbon" might be referred to more properly as "'acid-released carbon" and, when the carbonate procedure is used, one should be aware of the potential effect on organic carbon.
All carbon measurements performed at DRI since mid-1987 have been made using these procedures. The intent of the temperature/atmosphere steps is to pro- vide carbon fractions which are comparable to the operational definitions of "organic carbon" and "ele- mental carbon" derived from other analysis methods. It was found, in the course of this work, that the thermograms from source samples were substantially different between one source type and another (Wat- son et al., 1991a), in that the distribution among the seven fractions was distinctive of each source type. These carbon fingerprints appear to hold promise for separating sources such as wood stoves, fireplaces, diesel-powered vehicles and gasoline-powered vehic- les from each other using receptor models.
COMPARISON WITH OTHER METHODS
The major area of concern in thermal carbon ana- lysis is that there is at present no common definition of organic or elemental carbon.* Each of the thermal carbon analysis methods divides the evolved carbon into segments which are defined by: (1) temperature, (2) rate of temperature increase, (3) composition of atmosphere surrounding the sample and (4) method of optical correction for pyrolysis.
The definitions of organic and elemental carbon are, therefore, operational and reflect the method and purpose of measurement. For light extinction budgets, light-absorbing carbon is a more useful con- cept than elemental carbon. Light-absorbing carbon is not entirely constituted by graphitic carbon, since there are many tarry organic materials which absorb light. Even the "graphitic" black carbon in the atmo- sphere has only a poorly developed graphitic struc- ture with abundant surface chemical groups such as hydroxyl. For source apportionment by receptor models, one would want to have several distinct frac- tions of carbon in both source and receptor samples. Differences in ratios of the carbon concentrations in
* The ambiguity in the definitions of organic and elemental carbon is conceptual as well as practical. For example, in the homologous series of polynuclear aromatic hydrocarbons, as carbon/hydrogen ratio approaches infinity the content in the distinction between organic and elemental carbon gradually disappears. On the other hand, operational definitions not- withstanding, any acceptable method must read sucrose as 100% organic carbon and ultrapure graphite as 100% elemental carbon.

1192 J.C. Crfow et al.
these fractions form part of the source profile which distinguishes the contribution of one source from the contributions of other sources (Watson et al., 1991a).
The comparisons discussed here comprise several variations of the thermal (T), thermal/optical reflec- tance (TOR), thermal/optical transmission (TOT) and thermal manganese oxidation (TMO) methods for organic and elemental carbon; spiking experiments for elemental carbon; and elemental carbon by optical absorption (OA), photoacoustic spectroscopy and nonextractable mass. The thermal (T) methods, as distinct from thermal/optical methods (TOR, TOT), have no optical correction for pyrolysis. The TOT method (Sunset Laboratory, 1990; Turpin et al., 1990a) differs from TOR in that it uses transmission instead of reflectance for the optical pyrolysis correc- tion. The TMO method (Mueller et al., 1982; Fung, 1990) uses MnO2, present and in contact with the sample throughout the analysis, as the oxidizing agent, and temperature is relied upon to distinguish between organic and elemental carbon; carbon evolv- ing at 525°C is classified as organic carbon, and car- bon evolving at 850°C is classified as elemental car- bon.
All of the carbon analysis methods--T, TOR, TOT, TMO--agree within 5-15% on the sum of organic and elemental carbon in ambient samples and source samples (Countess, 1990; Houck et al., 1989b; Kusko et al., 1989; Shah and Rau, 1991) and, on average, within 3% in standard samples (see Table 2). Evalu- ation of these methods then becomes a matter of assessing how they differentiate between organic and elemental carbon. Comparison with respect to ele- mental carbon alone is a convenient way to compare methods since organic carbon is essentially the com- plement of elemental carbon.
The TOR systems at OGI and DRI give similar splits between organic and elemental carbon (Count- ess, 1990; Shah and Rau, 1991), within ~ 12% referred to elemental carbon or a few per cent referred to total carbon. This result is from the Carbonaceous Species Methods Comparison Study (CSMCS; Hering et al., 1990; Lawson and Hering, 1990), conducted by the California Air Resources Board. In the CSMCS sev- eral variations of the T, TOR, TOT, TMO and OA methods were applied to ambient samples including samples from woodburning-dominated environments, source samples from diesel and various types of spark- ignition vehicles and a photolytic smog-chamber aerosol (Cadle and Mulawa, 1990; Countess, 1990; Fung, 1990; Shah and Rau, 1991; Turpin et al., 1990a).
Excellent agreement between OGI TOR elemental carbon and nonextractable (in toluene/n-propanol) mass has been obtained on diesel exhaust particulate matter (Japar et al., 1984a):
TOR/(nonextractable mass) = 1.05 _ 0.04,
r = 0.93 (n = 28).
Elemental carbon by DRI TOR is said (G. A. Allen, 1991, pers. commun.) to agree fairly well with real-time optical transmission measurements on the Lawrence Berkeley Laboratory aethalometer (Hansen et al., 1982) in the Harvard Uniontown, PA, Acidic Aerosol Study in July and August 1990:
aethalometer/TOR = 0.89 _ 0.04,
r = 0.93 (n = 72).
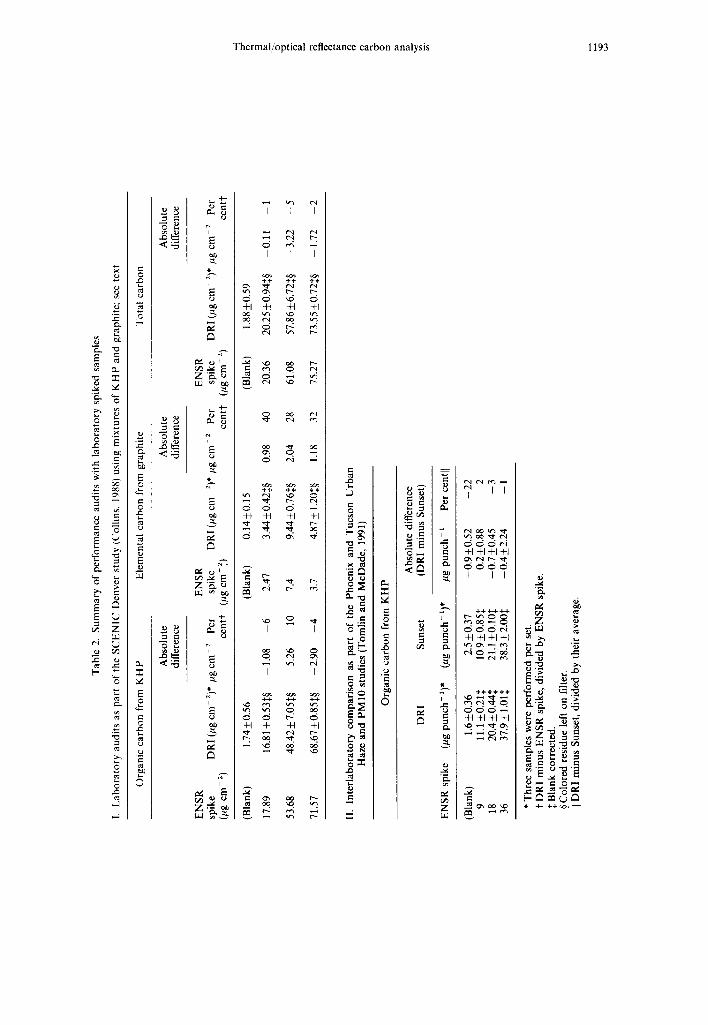
Table 2 summarizes recent laboratory audits as part of the SCENIC Denver Study (Watson et al., 1988b). These performance audits were conducted by ENSR Consulting and Engineering Inc. (Collins, 1988; Gertler et al., 1988) to test the accuracy and precision of the DRI TOR analysis. Aqueous solu- tions of KHP and methanol suspensions of graphite, the latter supposedly submicron in size (C. E. McDade, 1991, pers. commun.), were deposited in stated amounts onto the centers of pre-fired filters using a microsyringe (accuracy + 0.54%). This resulted in a dense inhomogeneous deposit. As shown in Table 2, the elemental carbon values reported by the DRI TOR method were 1-2 pg cm -2 higher than the values from gravimetric analysis (weight difference of the filter before and after deposition of the graphite). This error represents 28-40% of the elemental carbon but only 2-5% of the total carbon, and some of it may be in the gravimetric determination. Organic carbon results appear reasonable, showing an average differ- ence of 7% from the amount present. Overall, DRI TOR analyses resulted in lower-than-stated organic carbon and higher-than-stated elemental carbon, in- dicating the possibility that some organic carbon was misclassified as elemental carbon, though the error is small (~5%) relative to total carbon. The biggest problem was that the sample deposit area was smaller than the area of the laser beam so that the laser signal- to-noise ratio was poor.
There is good agreement between TOR and TOT in some studies but not in all. In the CSMCS ambient samples, collected in the Los Angeles Air Basin at Citrus College in Glendora, CA, the elemental carbon averages stood in the order T O R > O A > T M O ~ - T > T O T . The difference in elemental carbon between TOR and TOT was roughly a factor of two; elemental carbon constituted ~20% of the carbon in these samples, so the disparity corresponds to ~ 14% of the total carbon. In the CSMCS source samples, TOR and TOT agreed within ~ 1% on diesel exhaust par- ticulate matter (elemental carbon ~- 80% of total car- bon) but TOR exceeded TOT on the others, the worst being the woodsmoke-dominated samples where the disparity was four- to seven-fold in elemental carbon. Houck et al. (1989b) found disparities in comparisons of nine different types of source samples and source- dominated samples, and reported elemental carbon
ratios TOR/TMO/TOT~ 1.6/1.35/1; the comparison is discussed in more detail by Shah and Rau (1991).
T h e r m a l / o p t i c a l ref lectance c a r b o n ana lys i s 1193
~ g
8
~ rm
m
~ 8
~ 8
~ 8
+ -
I
,7
i
t*
i
r,
Z r , u
E
I
~m
=,
g-.
7 ~? 7
I I I
~ ,6 +1 +1 +1 +1
¢-q
g g _~
+1 +1 +1 +1
t ~ e q
I I I
÷ + +4.
~5 t< e5 +1 +1 +1 +1
r~
e~
+ l + l + l + l
+1+1+1+1
+ l + l + l + l
1194 J.C. CHOW et al.
Agreement in the 1-3% range between TOR at DRI and TOT at Sunset Laboratory was reported by Tom- lin and McDade (1991) in KHP spiking experiments conducted as part of the Phoenix and Tucson Urban Haze and PM10 Studies (Chow et al., 1991a, b; Wat- son et al., 1991b, c), as shown in Table 2; but the significance is limited in that KHP is by no means a severe challenge. Both laboratories read ~ 2/~g per punch higher than the spiked KHP standard.
To resolve the difference between TOR and TOT, a fourth-generation thermal/optical reflectance/trans- mittance carbon analyser has been developed by DRI for the South Coast Air Quality Management District (SCAQMD; Pritchett et al., 1991a, b). This unit pos- sesses all of the features of the third-generation sys- tem, plus:
• concurrent reflectance and transmittance measure- ments, allowing direct comparison between TOR and TOT on the same sample,
• particle light absorption (b~bs) measurements by transmittance on each of the carbon fractions,
• automatic sample insertion, enhancing sample- position reproducibility and increasing the pre- cision of the laser reflectance and transmittance measurements from sample to sample,
• modified sample processing module, to accommod- ate additional features such as a chromatographic column downstream of the oven heating coil for identifying individual species in the thermogram,
• improvements in ruggedness, ease of maintenance and repair, ease and efficiency of operation, soft- ware versatility and other practical features.
Initial testing demonstrated comparable results be- tween the third and fourth generations of carbon analysers on homogeneously deposited samples. Re- flectance and transmittance measurements on 15 am- bient samples with the fourth-generation analyser then resulted in equivalent laser demarcations (+ 5% referred to total carbon) between organic and ele- mental carbon, indicating that the TOR and TOT methods were equivalent on these samples.
Shah and Rau (1991) have suggested that in the TOR and TOT methods the reflectance of the filter surface regains its initial value before the transmit- tance does, because of unburned pyrolytic material beneath the surface, causing TOR to be undercorrec- ted for pyrolysis and hence to read erroneously high on elemental carbon while TOT is more nearly correct. Countess (1990) concludes that TOR under- estimates the amount of charring compared to TOT, and support can be found in certain observations by Turpin et al. (1990a) regarding filter blackening. On the other hand, TOR and TOT gave similar results when applied in the same instrument; in such a case hypotheses to rationalize differences, even if the hypo- thesized processes occur, are unnecessary. Many more comparisons of TOR and TOT must be made to see whether or not they are equivalent.
If TOR and TOT are equivalent, then TOR can be evaluated further through evaluation of TOT. Com- parison of the TOT method (two laboratories) with photoacoustic spectroscopy gave excellent agreement on elemental carbon. This was established on Dear- born, MI, ambient aerosol in 1986 (Adams et al., 1989) and on Claremont, CA, ambient aerosol in 1987 during the Southern California Air Quality Study (SCAQS; Adams et al., 1990a; Turpin et al., 1990b). In some of the comparisons, samples for TOT analysis were first extracted with toluene/n-propanol to re- move most of the organic carbon and thereby to reduce the pyrolysis correction. Regression analysis gave an insignificant zero intercept in all comparisons, with slopes and correlation coefficients as follows:
(1) Without extraction:
Photoacoustic/TOT = 0.92 + 0.06,
r = 0.905 (n = 59),
Claremont (Turpin et al., 1990b)
Photoacoustic/TOT = 1.08 + 0.10,
r=0.914(n=41),
Claremont (Adams et al., 1990a). (2) With extraction:
Photoacoustic/TOT = 1.10 + 0.13,
r = 0.926 (n = 14),
Dearborn (Adams et al., 1989)
Photoacoustic/TOT = 1.006 _ 0.056,
r = 0.945 (n = 26),
Claremont (Adams et aL, 1990a).
This improved agreement concomitant to extraction in the Claremont experiment by Adams et al. (1990a) should be noted. Adams et al. (1990a) surmise that in the TOT procedure there is a systematic overcorrec- tion for pyrolysis, and that the improvement effected by extraction results from removal of material capable of pyrolysing. (Note that extractable light-absorbing organic carbon would act in the opposite direction.) The authors state, "Since the two measurement tech- niques, photoacoustic spectroscopy and thermal/ex- traction, are based on entirely different principles, their excellent agreement provides strong evidence for the validity of both experimental methods for the measurement of atmospheric EC aerosol."
Note that the putative overcorrection for pyrolysis in TOT and the earlier-hypothesized undercorrection in TOR would together be consistent with elemental carbon reading higher by TOR than by TOT if such a difference does exist. All of this ignores the slope 0.92 result from Turpin et al. (1990b) above, which would be consistent with undercorrect ion for pyrolysis in TOT.
TOR and TMO agreed within a few per cent in elemental carbon in the diesel exhaust particulate sample from the CSMCS. Elemental carbon in the
Thermal/optical reflectance carbon analysis 1195
smog-chamber aerosol read ~ 2% of total carbon by TOR/TOT, 8% by TMO, and presumably was in fact zero. Otherwise, TOR was consistently higher than TMO on elemental carbon, more so when elemental carbon was a small fraction of total carbon. In the ambient samples (elemental carbon - 2 0 % of total carbon), the disparity was a factor of 1.64-1.2, or
9% of the total carbon. The worst disparity was in the two woodsmoke-dominated samples (elemental carbon - ~ l l % of total carbon), with TOR/TMO ratios 8 and 53--and with TMO lower by far than any other method (T, TOR, TOT, OA). TMO in one sample gave only 25% as much elemental carbon as the mean of the other methods and laboratories; and in the other sample, TMO gave only 4% as much.
Differences between the TOR and TMO methods were again observed during the 1987 WHITEX study (Malm et al., 1989) when the IMPROVE (Eldred et al., 1988, 1989, 1990) and SCISAS (Mueller et al., 1986; Rogers et al., 1989) samplers were collocated in Page, AZ, to obtain PM2.5 aerosol on some 60 pairs of pre- fired quartz-fiber filters. IMPROVE samples were analysed at DRI using the TOR method and the SCISAS samples were analysed at ENSR Consulting and Engineering Inc. using the TMO method. Though the total carbon concentrations were comparable (Kusko et al., 1989), the elemental carbon concentra- tions measured by TOR were five or six times the elemental carbon levels by TMO and the correlation was only modest (r=0.84; Shah, 1988). These were samples in which elemental carbon constituted ~ 35 % of the total carbon on average according to TOR, or 10% according to TMO. The wintertime samples at Page were said to contain large contributions from wood smoke (Shah, 1988). When the thermograms from the IMPROVE/TOR samples were examined, it was concluded that the elemental carbon fraction which evolved at 800°C was mostly the same material as the elemental carbon measured at 850°C by the SCISAS/TMO method.
TOR read lower than TMO on elemental carbon as often as not, with an average ratio (TOR/TMO)ave =0.944-0.88, in the comparison by Houck e ta l . (1989b) of 20 source samples and source-dominated samples (soil, road dust, fireplace, wood stove, diesel bus, field burning, construction dust, dairy dust and crude-oil-burning emissions; see also Shah and Rau, 1991). The range of concentrations in these samples was extremely broad (> 100 ×). The regression was:
TMO=0.900 TOR-0.056, r =0.971(n=20).
(The dimensions of the intercept term are #g cm-2 of filter.) In addition, TOR organic carbon was higher than TMO organic carbon in 15 of the 20 samples. These results, given the strong correlation and the near-zero intercept and the data quality that this suggests, appear to bring into question the other TOR vs TMO comparisons.
A comparison was attempted between TOR and TMO elemental carbon in the SCENIC Denver labor- AE(A) 27:8-C
atory audits on the KHP and graphite spiking ex- periments (Collins, 1988; Gertler et al., 1988). But Collins (1988) reported difficulty in obtaining TMO elemental carbon values owing to incomplete com- bustion of the carbon punch.
It is unclear, then, whether TOR is higher than TMO on elemental carbon or not. It is easy to imagine, however, why TOR should be higher than TMO on elemental carbon:
(l) The TOR optical correction may be under- correcting for pyrolysis as discussed above. Also, TOR classifies as elemental carbon all light-absorbing car- bon, and all organic carbon evolving in the region whether light-absorbing or not (e.g. organic carbon requiring 0 2 attack in order to evolve).
(2) The entire EC 1 area in Fig. 4 would probably be classified as organic carbon by the TMO method, since the TMO method classifies as organic carbon all carbon evolved at 525°C in the presence of oxidant, similar to the conditions for EC1, namely, 550°C and 2% O2. Since EC1 sometimes contains much of the light-absorbing carbon (nearly all, in the example illustrated in Fig. 4), misclassification could be of great consequence. Without knowing what the material is (e.g. elemental carbon, non-volatile organic material, undercorrected pyrolytic material), one cannot tell which method, if either, is classifying it correctly. An important point, however, is that, at the 550°C at which it evolved in 2% O 2, it did not evolve earlier when O 2 was absent (i.e. it did not evolve in OC4). Elemental carbon is reported to be oxidizable at temperatures as low as 400°C (Shah and Rau, 1991; 0 2 partial pressures not stated) or, in air, even 350°C (Cadle and Mulawa, 1990)--though rates are not stated in either report. Light-absorbing carbon, stated to be mostly graphitic in nature, is evolved from ambient and source samples at temperatures as low as 440-470°C in pure O 2 (Novakov, 1981, 1982; Rosen et al., 1982) and as low as 400-550°C in air (Rosen et al., 1977, 1979). Oxidation of elemental carbon during thermal analysis of aerosol filter samples in an air stream, in the presence of trace catalytic substances from the filter or in the sample itself, has been docu- mented by Lin and Friedlander (1988a, b,c) at temper- atures well below 500°C. Accordingly it seems likely that the TMO method must misclassify at least some elemental carbon as organic carbon; that is, at least some of the EC1 area is misclassified as organic by the TMO method. (It follows that oxidizing substances, if present, within the sample itself, could cause evolution of elemental carbon even before the O 2 is switched on in the thermal or thermal/optical methods.)
(3) The "lighter-fluid effect", as it is known in automotive programs on regenerative particulate traps, wherein elemental carbon is ignited through combustion of organic carbon, would cause elemental carbon to be misclassified as organic carbon by the TMO method.
Of these processes, the first would cause TOR ele- mental carbon to be high, the second could cause

1196 J.C. Crlow et al.
errors in either direction but probably would cause TMO elemental carbon to be low, and the third would cause TMO elemental carbon to be low.
Another factor that should be considered is that the TMO analytical conditions are derived based on properties of polycrystalline graphite as the elemental carbon. High-molecular-weight material that is vir- tually elemental carbon in composition, or in general forms of "elemental carbon" less difficult to oxidize than polycrystalline graphite, will be classified as organic by the TMO method as presently calibrated.
The excellent agreement among TOR, TMO and T O T - - a n d between TOR and nonextractable mass - - on diesel exhaust particulate matter is in- formative when set against the situation on wood- smoke-dominated samples. There is very little poly- meric or light-absorbing organic material in diesel exhaust particulate matter (Szkarlat and Japar, 1983). Most of the light-absorbing carbon exhibits a weakly ordered structure approaching that of polycrystalline graphite (Rosen and Novakov, 1977; Rosen et al.,
1978, 1979, 1982). For chemical reactivity purposes this structural description may be misleading. It is more appropriate to think of the material as consisting of assemblies of large (~ 130 carbon atoms) stacked polynuclear aromatic hydrocarbon molecules of dimensions ~ 2 x 2 nm, six layers per stack, with reactive chemical groups on many or most of the edge carbons (Ebert, 1990). Possibly this material would evolve at high enough temperatures to be classified as elemental carbon by all methods, whereas some of the light-absorbing carbon in woodsmoke-dominated samples may evolve under conditions (525°C in the presence of oxidant) which in the TMO method would classify it as organic but which in the TOR method would classify it as elemental. Also, pyrolysis should be relatively unimportant in diesel exhaust particulate matter. In fact, the TOR thermogram of diesel exhaust particulate matter exhibits very little EC1 and is almost devoid of optical evidence of pyrolysis and hence of pyrolytic material or pyrolysis correction (Watson et al., 1991a). Indeed, Japar et al. (1984a) report a pyrolysis correction amounting to only 3 + 3% of the total carbon. Thus we are led again to focus on the EC1 region and on the pyrolysis correc- tion as holding the key(s) to the differences among the various methods.
A good way to visualize part of what might be happening is to consider vulcanized rubber. Vulcaniz- ation creates crosslinks among polymer chains, after which the material is insoluble in organic solvents except under high-temperature (e.g. 180°C) oxidative attack to break the crosslinks. Fraction EC1 may well contain analogous substances which, though light- absorbing and not removable except through oxida- tion at elevated temperature, are not elemental carbon in any sense (vulcanized rubber copolymer has hydro- gen/carbon atom ratio 21.5). There is a need to explore carefully the behavior of polymeric material (e.g. cellulose) in the various carbon analytical procedures
APPLICATIONS OF THE TOR METHOD
Over 27,000 ambient and source samples have been analysed with the third-generation TOR carbon ana- lysers since mid-1987. Table 3 summarizes the major visibility, PM10 State Implementation Plan develop- ment, source characterization and special air quality studies in which the DRI TOR method described above has been applied.
SUMMARY AND RECOMMENDATIONS
The thermal/optical reflectance (TOR) method of carbon analysis has been applied to quantify organic and elemental carbon on source and receptor samples collected in most large-scale air quality studies con- ducted in the U.S.A. This paper states the history and evolution of the TOR method over the past decade. The key factors governing different carbon analysis methods are: (1) temperature setting, (2) rate of tem- perature increase, (3) composition of atmosphere sur- rounding the sample, (4) method of optical correction for pyrolysis and (5) standardization. Efforts have been made on both hardware and software of the carbon system to refine the temperature program- ming, to report multiple carbon fractions and to compare the reflectance and transmittance optical correction for pyrolysis.
The major air quality studies in which the TOR method has been applied are identified. Comparison to other methods and to other variations of the TOR method are summarized. It is often stated that the various carbon analysis methods do not agree. The actual situation is worse than that: there is not even agreement on what the disagreements are. Research is needed in the following areas:
• Evaluate the various methods, with and without sample pre-extraction, against photoacoustic spec- troscopy or other primary method for elemental carbon. Do so for a variety of sample types, includ- ing high-polymer materials and samples in which organic carbon predominates over elemental car- bon.
• Directly compare TOR vs TOT. Evaluate the as- sumptions underlying the optical pyrolysis correc- tion in each method. Employ more extensive and more diverse sample sets than were utilized above.
• Develop realistic aerosol organic, elemental and mixed organic/elemental carbon standards.
• Identify, by GC/MS and/or other means, the indi- vidual chemical species constituting the different carbon fractions (currently seven, in the DRI TOR procedure) of the various methods, especially the fractions adjacent to the division between organic and elemental carbon.
At some point further intercomparisons among meth- ods and laboratories may be warranted, but at present they are unlikely to produce anything definitive.

Thermal/optical reflectance carbon analysis
Table 3. Summary of DRI thermal/optical reflectance carbon analysis applied in major air quality studies in the U.S.A.
I. Visibility studies Winter Haze Intensive Tracer EXperiment (WHITEX; Maim et al., 1989, 1990; Mathai,
1990) Interagency Monitoring of PROtected Visual Environments (IMPROVE; Joseph et al.,
1987; Eldred et al., 1988, 1989, 1990) NorthEast States for Coordinated Air Use Management (NESCAUM; Poirot and Di
Genova, 1990; Flocchini et al., 1990) Pacific northwest REgional Visibility experiment with Natural Tracers (PREVENT;
R. A. Eldred, 1991, pers. commun.) The 1987-88 Metro Denver Brown Cloud Study (Watson et al., 1988a, b,c; Mathai,
1990) The 1989-90 Phoenix Urban Haze Study (Watson et al., 1990a, 1991b) The 1989 90 Pilot Tucson Urban Haze Study (Watson et al., 1990b, 1991c)
II. PM10 SIP development State of Nevada Air Pollution Study (SNAPS; Chow et al., 1986, 1988, 1989a; Watson et
al., 1988d; Benedict and Naylor, 1988) Rubidoux, CA, Neighborhood-scale PM10 Study (Chow et al., 1989b, c,d, 1992a) Valley Air Quality Study (VAQS; Chan et al., 1990; Chow et al., 1990a, 1992b, 1993) Santa Barbara PM10 Study (Countess, 1991) The 1989-90 Phoenix PMI0 Study (Watson et al., 1990c; Chow et al., 1991a) The 1989-90 Pilot Tucson PM10 Study (Watson et al., 1990d; Chow et al., 1991b) Development of other PM 10 SIPs (Chow et al., 1990b)
III. Special studies San Joaquin Valley Air Quality Study/Atmospheric Utility Signatures-Predictions and
EXperiment (SJVAQS/AUSPEX) Aerosol and Visibility Study (Chow and Richards, 1990a, b)
Harvard Uniontown Acidic Aerosol Study (G. A. Allen, 1991, pers commun.)
IV. Source characterization studies California Air Resources Board's Source Characterization Studies (Houck et al.,
1989a-e; Ahuja et al., 1989) Pacific Northwest Source Profile Library (Core and Houck, 1987; Core, 1989) SNAPS Source Profile Development (Watson et al., 1988d) Denver Source Profile Development (Watson et al., 1988b) Phoenix Source Profile Development (Chow et al., 1991a) Tucson Source Profile Development (Watson et al., 1990d; Chow et al., 1991b) Santa Barbara Source Profile Development (Countess, 1991)
1197
Acknowledgements The original work was initiated and sponsored by the Nevada State Legislature as part of the State of Nevada Air Pollution Study. The authors wish to thank Mr Gary Weller of DRI for preparing the graphics and Ms Susan Grobman, also of DRI, for editing the manuscript.
REFERENCES
Adams K. M., Davis L. I. Jr, Japar S. M. and Pierson W. R. (1989) Real-time in situ measurements of atmospheric optical absorption in the visible via photoacoustic spectro- scopy II. Validation for atmospheric elemental carbon aerosol. Atmospheric Environment 23, 693-700.
Adams K. M., Davis L. I. Jr, Japar S. M., Finley D. R. and Cary R. A. (1990a) Measurement of atmospheric elemental carbon: real-time data for Los Angeles during summer 1987. Atmospheric Environment 24A, 597-604.
Adams K. M., Davis L. I. Jr, Japar S. M. and Finley D. R. (1990b) Real-time in situ measurements of atmospheric optical absorption in the visible via photoacoustic spectro- scopy-IV. Visibility degradation and aerosol optical properties in Los Angeles. Atmospheric Environment 24A, 605-610.
Ahuja M. S., Paskind J., Houck J. E. and Chow J. C. (1989) Design of a study for the chemical and size character- ization of particulate matter emissions from selected sour- ces in California. In Trans. Receptor Models in Air Re-
sources Management (edited by Watson J. G.), pp. 145-158. Air and Waste Management Association, Pittsburgh, PA.
Benedict R. and Naylor M. (1988) Fine particulate receptor modeling in Las Vegas using combined gaseous and particulate source profiles. In Trans. PM10: Implementa- tion o f Standards (edited by Mathai C. V. and Stonefield D. H.), pp. 518-530. Air Pollution Control Association, Pittsburgh, PA.
Cadle S. H. and Groblicki P. J. (1982) An evaluation of methods for the determination of organic and elemental carbon in particulate samples. In Particulate Carbon: Atmospheric Life Cycle (edited by Wolff G. T. and Klimisch R. L.), pp. 89-109. Plenum Press, New York.
Cadle S. H. and Mulawa P. A. (1990) Atmospheric Carbona- ceous Species Measurement Methods Comparison Study: General Motors results. Aerosol Sci. Technol. 12, 128-141.
Cadle S. H., Groblicki P. J. and Stroup D. P. (1980a) An automated carbon analyzer for particulate samples. Ana- lyt. Chem. 52, 2201-2206.
Cadle S. H., Nebel G. J. and Williams R. L. (1980b) Measure- ments of unregulated emissions from General Motors' light-duty vehicles. SAE paper 790694 (Society of Auto- motive Engineers, Warrendale, PA, 1979). S A E Trans. 87, 2381 2401.
Cadle S. H., Groblicki P. J. and Mulawa P. A. (1983) Problems in the sampling and analysis of carbon partic- ulate. Atmospheric Environment 17, 593-600.
Chan M. C., Moon K. C. and Chow J. C. (1990) PM-10 monitoring in the San Joaquin Valley. Document AV-FR-

1198 J.C. CHOW et al.
89/6121, AV Project 91138F, prepared for San Joaquin Valley Air Pollution Study Agency, Madera, CA, and Western States Petroleum Association, Glendale, CA, by AV Projects Inc., Monrovia, CA.
Chow J. C. and Richards L. W. (1990a) San Joaquin Valley Air Quality Study (SJVAQS)/Atmospheric Utility Signa- tures-Predictions and EXperiment (AUSPEX). Moni- toring and analysis for aerosols and visibility, Volume I: program plan. DRI document 8743.1 F, prepared for Paci- fic Gas and Electric Company, San Francisco, CA, by Desert Research Institute, Reno, NV.
Chow J. C. and Richards L. W. (1990b) San Joaquin Valley Air Quality Study (SJVAQS)/Atmospheric Utility Signa- tures-Predictions and EXperiment (AUSPEX). Moni- toring and analysis for aerosols and visibility, Volume II: standard operating procedures. DRI document 8743.2F, prepared for Pacific Gas and Electric Company, San Francisco, CA, by Desert Research Institute, Reno, NV.
Chow J. C., Watson J. G., Egami R. T., Wright B., Ralph C., Naylor M., Smith J. and Serdoz R. (1986) Program plan for State of Nevada Air Pollution Study (SNAPS). DRI document 8086.1D2, Desert Research Institute, Reno, NV.
Chow J. C., Watson J. G., Frazier C. A., Egami R. T., Goodrich A. and Ralph C. (1988) Spatial and temporal source contributions to PM 10 and PM2.5 in Reno, NV. In Trans. PM10: Implementation of Standards (edited by Mathai C. V. and Stonefield D. H.), pp. 438-457. Air Pollution Control Association, Pittsburgh, PA.
Chow J. C., Watson J. G., Egami R. T., Frazier C. A. and Lu Z. (1989a) The State of Nevada Air Pollution Study (SNAPS). Executive summary. DRI document 8086.5E, prepared as part of State of Nevada Air Pollution Study by Desert Research Institute, Reno, NV.
Chow J. C., Pritchett L. C., Lu Z., Hinsvark B. and Chandra S. (1989b) A neighborhood-scale study of PM10 source contributions in Rubidoux, CA, Volume I: data interpreta- tion. DRI document 8707.1F1, prepared for South Coast Air Quality Management District, El Monte, CA, by Desert Research Institute, Reno, NV.
Chow J. C., Pritchett L. C., Lu Z., Hinsvark B. and Chandra S. (1989c) A neighborhood-scale study of PM10 source contributions in Rubidoux, CA, Volume II: ambient con- centrations data base. DRI document 8707.1F2, prepared for South Coast Air Quality Management District, E1 Monte, CA, by Desert Research Institute, Reno, NV.
Chow J. C., Pritchett L. C., Lu Z., Hinsvark B. and Chandra S. (1989d) A neighborhood-scale study of PM10 source contributions in Rubidoux, CA, Volume III: chemical mass balance receptor modeling results. DRI document 8707.1F3, prepared for South Coast Air Quality Manage- ment District, E1 Monte, CA, by Desert Research Institute, Reno, NV.
Chow J. C., Watson J. G., Lowenthal D. H., Pritchett L. C. and Richards L. W. (1990a) San Joaquin Valley Air Quality Study. Phase 2 :PM10 modeling and analysis. Volume I: receptor modeling source apportionment. Final report. DRI document 8929.1F, prepared for San Joaquin Valley Air Pollution Study Agency, Sacramento, CA, by Desert Research Institute, Reno, NV.
Chow J. C., Watson J. G., Pritchett L. C. and Frazier C. A. (1990b) Statement of qualifications for analysis of ambient and source samples, 10 May 1990. Energy and Environ- mental Engineering Center, Desert Research Institute, Reno, NV.
Chow J. C., Watson J. G., Richards L. W., Haase D. L., McDade C., Dietrich D. L, Moon D. and Sloane C. (1991a) The 1989-90 Phoenix PM10 Study. Volume II: source apportionment. DRI document 8931.6F 1, prepared for Arizona Department of Environmental Quality, Phoenix, AZ, by Desert Research Institute, Reno, NV.
Chow J. C., Watson J. G., Richards L. W., Haase D. L., McDade C., Dietrich D. L., Moon D. and Sloane C. (1991b) The 1989-90 Pilot Tucson PMI0 Study. Volume II: source apportionment. DRI document 8931.8F1, pre-
pared for Arizona Department of Environmental Quality, Phoenix, AZ, by Desert Research Institute, Reno, NV.
Chow J. C., Lu C. L., Lu Z. and Pritchett L. C. (1992a) A neighborhood-scale study of PM 10 source contributions in Rubidoux, California. Atmospheric Environment 26A, 693-706.
Chow J. C., Watson J. G., Lowenthal D. H., Solomon P., Magliano K., Ziman S. and Richards L. W. (1992b) PM10 source apportionment in California's San Joaquin Valley. Atmospheric Environment 26A, 3335-3354.
Chow J. C., Watson J. G., Lowenthal D. H., Soloman P. A., Magliano K. L., Ziman S. D. and Richards L. W. (1993) PM10 and PM2.5 compositions in California's San Joaquin Valley Aerosol Sci. Technol. 18, 105-128.
Collins J. F. (1988) Laboratory audit report for SCENIC Denver. Prepared by ERT, Camarillo, CA, for Desert Research Institute, Reno, NV.
Core J. E. (1989) Source profile development for PM-10 receptor modeling. In Trans. Receptor Models in Air Resources Management (edited by Watson J. G.), pp. 134- 144. Air and Waste Management Association, Pittsburgh, PA.
Core J. and Houck J. (1987) Pacific Northwest Source Profile Library Sampling and Analytical Protocols. Oregon Department of Environmental Quality, Portland, OR.
Countess R. J. (1990) Inter-laboratory analyses of carbona- ceous aerosol samples. Aerosol Sci. Technol. 12, 114-121.
Countess R. (1991) Santa Barbara PM-10 emission reduction study. Paper 91-52.5, presented at 84th Annual Meeting, Vancouver, BC. Air and Waste Management Association, Pittsburgh, PA.
Ebert L. B. (1990) Is soot composed predominantly of carbon clusters? Science 247, 1468-1471.
Eldred R. A., Cahill T. A., Pitchford M. and Maim W. C. (1988) IMPROVE--a new remote area particulate moni- toring system for visibility studies. Paper 88-54.3, pre- sented at 81st Annual Meeting, Dallas, TX. Air Pollution Control Association, Pittsburgh, PA.
Eldred R. A., Cahill T. A., Wilkinson L. K., Feeney P. J. and Maim W. C. (1989) Particulate characterization at remote sites across the U.S.: first year results of the NPS/IM- PROVE network. Paper 89-151.3, presented at the 82nd Annual Meeting, Anaheim, CA. Air and Waste Manage- ment Association, Pittsburgh, PA.
Eldred R. A., Cahill T. A., Wilkinson L. K., Feeney P. J., Chow J. C. and Malm W. C. (1990) Measurement of fine particles and their components in the NPS/IMPROVE network. In Trans. Visibility and Fine Particles (edited by Mathai C. V.), pp. 187-196. Air and Waste Management Association, Pittsburgh, PA.
EPA (1987) Protocol for reconciling differences among re- ceptor and dispersion models. EPA 450/4-87-008, U.S. Environmental Protection Agency, Research Triangle Park, NC.
Federal Register (1987a) Revisions to the national ambient air quality standards for particulate matter: 40 CFR Part 50. Federal Register 52, 24634, 1 July.
Federal Register (1987b) Regulations for implementing re- vised particulate matter standards: 40 CFR Parts 51 and 52. Federal Register 52, 24672, 1 July.
Flocchini R. G., Cahill T. A., Eldred R. A. and Feeney P. J. (1990) Particulate sampling in the Northeast: a description of the Northeast States for Coordinated Air Use Manage- ment (NESCAUM) network. In Trans. Visibility and Fine Particles (edited by Mathai C. V.), pp. 197-206. Air and Waste Management Association, Pittsburgh, PA.
Fung K. (1990) Particulate carbon speciation by MnO2 oxidation. Aerosol Sci. Technol. 12, 122-127.
Gertler A., Coulombe W., Broten E. and Schmidt S. (1988) 1987-88 SCENIC Denver Study: quality assurance per- formance audit results, January 1988. DRI document 8706.2D1, prepared by Desert Research Institute, Reno, NV.
Gray H. A., Cass G. R., Huntzicker J. J., Heyerdahl E. K. and
Thermal/optical reflectance carbon analysis 1199
Rau J. A. (1986) Characteristics of atmospheric organic and elemental carbon particle concentrations in Los Ange- les. Envir. Sci. Technol. 20, 580-589.
Hansen A. D. A., Rosen H. and Novakov T. (1982) Real-time measurement of the absorption coefficient of aerosol par- ticles. Appl. Opt. 21, 3060-3062.
Hering S. V., Appel B. R., Cheng W., Salaymeh F., Cadle S. H., Mulawa P. A., Cahill T. A., Eldred R. A., Surovik M., Fitz D., Howes J. E., Knapp K. T., Stockburger L., Turpin B. J., Huntzicker J. J., Zhang X.-Q. and McMurry P. H. (1990) Comparison of sampling methods for carbonaceous aerosols in ambient air. Aerosol Sci. Technol. 12, 20(~213.
Houck J. E., Chow J. C., Watson J. G., Simons C. A., Pritchett L. C., Goulet J. M. and Frazier C. A. (1989a) Determina- tion of particle size distribution and chemical composition of particulate matter from selected sources in California. Executive summary. Prepared under agreement no. A6- 175-32 for California Air Resources Board, Sacramento, CA, by OMNI Environmental Services Inc., Beaverton, OR, and Desert Research Institute, Reno, NV.
Houck J. E., Chow J. C., Watson J. G., Simons C. A., Pritchett L. C., Goulet J. M. and Frazier C. A. (1989b) Determina- tion of particle size distribution and chemical composition of particulate matter from selected sources in California. Volume I (final report). Prepared under agreement no. A6- 175-32 for California Air Resources Board, Sacramento. CA, by OMNI Environmental Services Inc., Beaverton, OR, and Desert Research Institute, Reno, NV. NTIS PB 89232805.
Houck J. E., Chow J. C., Watson J. G., Simons C. A., Pritchett L. C., Goulet J. M. and Frazier C. A. (1989c) Determina- tion of particle size distribution and chemical composition of particulate matter from selected sources in California. Volume II (appendices). Prepared under agreement no. A6-175-32 for California Air Resources Board, Sacram- ento, CA, by OMNI Environmental Services Inc., Be- averton, OR, and Desert Research Institute, Reno, NV.
Houck J. E., Chow J. C., Watson J. G., Simons C. A., Pritchett L. C., Goulet J. M. and Frazier C. A. (1989d) Determina- tion of particle size distribution and chemical composition of particulate matter from selected sources in California. Volume III (appendices). Prepared under agreement no. A6-175-32 for California Air Resources Board, Sacram- ento, CA, by OMNI Environmental Services Inc., Be- averton, OR, and Desert Research Institute, Reno, NV.
Houck J. E., Pritchett L. C., Roholt R. B., Watson J. G., Chow J. C., Goulet J. M. and Frazier C. A. (1989e) Determination of particle size distribution and chemical composition of particulate matter from selected sources in the San Joa- quin Valley. Final report. Prepared for San Joaquin Valley Air Pollution Study Agency and California Air Resources Board, Sacramento, CA, by OMNI Environmental Servi- ces Inc., Beaverton, OR. and Desert Research Institute, Reno, NV.
Huntzicker J. J., Johnson R. L., Shah J. J. and Cary R. A. (1982) Analysis of organic and elemental carbon in am- bient aerosol by a thermal-optical method. In Particulate Carbon: Atmospheric Life Cycle (edited by Wolff G. T. and Klimisch R. L.), pp. 79-88. Plenum Press, New York.
Huntzicker J. J., Heyerdahl E. K., McDow S. R., Rau J. A., Griest W. H. and MacDougall C. S. (1986) Combustion as the principal source of carbonaceous aerosol in the Ohio River valley. JAPCA 36, 705-709.
Japar S. M. and Szkarlat A. C. (1981) Measurement of diesel vehicle exhaust particulate using photoacoustic spectro- scopy. Combust. Sci. Technol. 24, 215-219.
Japar S. M., Szkarlat A. C. and Gorse R. A. Jr (1981) Optical properties of particulate emissions from on-road vehicles. Atmospheric Environment 15, 2063-2070.
Japar S. M., Szkarlat A. C., Gorse R. A. Jr, Heyerdahl E. K., Johnson R. L., Rau J. A. and Huntzicker J. J. (1984a) Comparison of solvent extraction and thermal-optical carbon analysis methods: application to diesel vehicle exhaust aerosol. Envir. Svi. Technol. 18, 231-234.
Japar S. M., Szkarlat A. C. and Pierson W. R. (1984b) The determination of the optical properties of airborne particle emissions from diesel vehicles. Sci. Total Envir. 36, 121-130.
Japar S. M., Brachaczek W. W., Gorse R. A. Jr., Norbeck J. M. and Pierson W. R. (1986) The contribution of elemental carbon to the optical properties of rural atmo- spheric aerosols. Atmospherie Environment 20, 1281-1289.
Johnson R. L. (1981) Development and evaluation of a thermal/optical method for the analysis of carbonaceous aerosol. M.S. thesis, Oregon Graduate Center, Beaverton, OR.
Johnson R. L. and Huntzicker J. J. (1979} Analysis of volatilizable and elemental carbon in ambient aerosols. In Proc. Carbonaceous Particles in the Atmosphere (edited by Novakov T.), pp. 10-13. Report LBL-9037, Lawrence Berkeley Laboratory, Berkeley, CA.
Johnson R. L., Shah J. J., Cary R. A. and Huntzicker J. J. (1981) An automated thermal optical method for the analysis of carbonaceous aerosol. In Atmospheric Aerosol: Source/Air Quality Relationships (edited by Macias E. S. and Hopke P. K.), pp. 223-233. ACS Symp. Ser. 167, A,aerican Chemical Society, Washington, DC.
Joseph D. B., Metsa J., Maim W. C. and Pitchford M. (1987) Plans for IMPROVE: a federal program to monitor visibility in Class I areas. In Trans. Visibility Protection: Research and Policy Aspects (edited by Bhardwaja P. S.), pp. 113-125. Air Pollution Control Association, Pittsburgh, PA.
Kusko B., Cahill T. A., Eldred R. A., Matsuda Y. and Miyabe H. (1989) Nondestructive analysis of total nonvolatile carbon by forward alpha scattering technique (FAST). Aerosol Sci. Technol. 10, 39(~396.
Lawson D. R. and Hering S. V. (1990) The carbonaceous species methods comparison study: an overview. Aerosol Sci. Technol. 12, 1 2.
Lin C. and Friedlander S. K. (1988a) A note on the use of glass fiber filters in the thermal analysis of carbon contain- ing aerosols. Atmospheric Environment 22, 605-607.
Lin C. and Friedlander S. K. (1988b) Soot oxidation in fibrous filters. I. Deposit structure and reaction mech- anisms. Langmuir 4, 891 898.
Lin C. and Friedlander S. K. (1988c) Soot oxidation in fibrous filters. 2. Effects of temperature, oxygen partial pressure, and sodium additives. Langmuir 4, 898-903.
Maim W. C., Pitchford M. and lyer H. K. (1989) Design and implementation of the winter haze intensive tracer ex- periment WHITEX. In Trans. Receptor Models in Air Resources Management (edited by Watson J. G.), pp. 432-458. Air and Waste Management Association, Pittsburgh, PA.
Maim W. C., Iyer H. K. and Gebhart K. (1990) Application of tracer mass balance regression to WHITEX data. In Trans. Visibility and Fine Particles (edited by Mathai C. V.), pp.
806-818. Air and Waste Management Association, Pittsburgh, PA.
Mathai C. V. (ed) (1990) Trans. Visibility and Fine Particles. Air and Waste Management Association, Pittsburgh, PA.
Mueller P. K., Hilst G. R., Hidy G. M., Lavery T. M. and Watson J. G. 0981) EPRI sulfate regional experiment: results and implications. EA-2077-SY-LD, summary pre- sentation. Electric Power Research Institute, Palo Alto, CA.
Mueller P. K., Fung K. K., Heisler S. L.. Grosjean D. and Hidy G. M. (19821 Atmospheric particulate carbon obser- vations in urban and rural areas of the United States. In Particulate Carbon: Atmospheric LiJe Cycle ledited by Wolff G. T. and Klimisch R. L.), pp. 343-370. Plenum Press, New York.
Mueller P. K., Hansen D. A. and Watson J. G. (1986) The Subregional Cooperative Electric Utility, Department of Defense, National Park Service, and Environmental Pro- tection Agency Study (SCENES) on visibility: an overview. Report EA-4664-SR, Electric Power Research Institute, Palo Alto, CA.

1200 J.C. CHOW et al.
Novakov T. (1981) Microchemical characterization of aero- sols. In Nature, Aim and Methods of Microchemistry, Proc. 8th Int. Microchemical Syrup., Graz, Austria, 25-30 August 1980 (edited by Malissa H., Grasserbauer M. and Belcher R.), pp. 141-165. Springer, Wien.
Novakov T. (1982) Soot in the atmosphere. In Particulate Carbon: Atmospheric Life Cycle (edited by Wolff G. T. and Klimisch R. L.), pp. 19-41. Plenum Press, New York.
Pierson W. R., Brachaczek W. W., Gorse R. A. Jr, Japar S. M., Norbeck J. M. and Keeler J. G. (1989) Atmospheric acidity measurements on Allegheny Mountain and the origins of ambient acidity in the northeastern United States. Atmospheric Environment 23, 431-459.
Poirot R. and Di Genova F. (1990) NESCAUM activities pertaining to regulation of visibility-impairing pollutants. In Trans. Visibility and Fine Particles (edited by Mathai C. V.), pp. 61-70. Air and Waste Management Association, Pittsburgh, PA.
Pritchett L. C., Chow J. C., Watson J. G. and Frazler C. A. (1990) Thermal/optical reflectance carbon analysis of aerosol filter samples. DRI standard operating procedure 2-204.3. Desert Research Institute, Reno, NV.
Pritchett L. C., Purcell R. G., Chow J. C. and Watson J. G. (1991a) DRI Model 4000X thermal/optical carbon ana- lyzer, owner's manual. DRI document 8747.2F, prepared by the Desert Research Institute, Reno, NV.
Pritchett L. C., Purcell R. G., Chow J. C. and Watson J. G. (1991b) DRI Model 4000X thermal/optical carbon ana- lyzer, maintenance and troubleshooting manual. DRI document 8747.1F, prepared by the Desert Research In- stitute, Reno, NV.
Rau J. A. (1986) Residential wood combustion aerosol characterization as a function of size and source appor- tionment using chemical mass balance analysis. Ph.D. dissertation, Oregon Graduate Institute, Beaverton, OR.
Rogers C. F., Watson J. G. and Mathai C. V. (1989) Design and testing of a new size classifying isokinetic sequential aerosol sampler. JAPCA 39, 1569-1576.
Rosen H. and Novakov T. (1977) Raman scattering and the characterisation of atmospheric aerosol particles. Nature 266, 708-709.
Rosen H., Hansen A. D. A., Dod R. L. and Novakov T. (1977) Application of the optical absorption technique to the characterization of the carbonaceous component of am- bient and source particulate samples. Presented at the 4th Joint Conf. Sensing of Environmental Pollutants, New Orleans, LA, 6-11 November 1977. Report LBL-6844, Lawrence Berkeley Laboratory, Berkeley, CA. October.
Rosen H., Hansen A. D. A., Gundel L. and Novakov T. (1978) Identification of the optically absorbing component in urban aerosols. Appl. Opt. 17, 3859-3861.
Rosen H., Hansen A. D. A., Gundel L. and Novakov T. (1979) Identification of the graphitic carbon component of source and ambient particulates by Raman spectroscopy and an optical attenuation technique. In Proc. Carbonaceous Par- ticles in the Atmosphere (edited by Novakov T.), pp. 49-55. Report LBL-9037, Lawrence Berkeley Laboratory, Ber- keley, CA.
Rosen H., Hansen A. D. A., Dod R. L., Gundel L. A. and Novakov T. (1982) Graphitic carbon in urban environ- ments and in the Arctic. In Particulate Carbon: Atmo- spheric Life Cycle (edited by Wolff G. T. and Klimisch R. L.), pp. 273-294. Plenum Press, New York.
Shah J. J. (1981) Measurements of carbonaceous aerosol across the U. S.: sources and role in visibility degradation. Ph.D. dissertation, Oregon Graduate Center, Beaverton, OR. University Microfilms International, Ann Arbor, MI.
Shah J. J. (1988) Resolving differences between carbonaceous aerosol measurement methods for SCENES. Draft report prepared for the Electric Power Research Institute, Palo Alto, CA.
Shah J. J. and Rau J. A. (1991) Carbonaceous Species
Methods Comparison Study; interlaboratory round robin interpretation of results. Presented at 4th Int. Conf. Car- bonaceous Particles in the Atmosphere, Vienna, Austria, 3-5 April. Also G2 Environmental Inc., final report G2E-0024 on project A832-154 to the California Air Resources Board, Sacramento, CA, November 1990.
Shah J. J., Watson J. G., Cooper J. A. and Huntzicker J. J. (1984) Aerosol chemical composition and light scattering in Portland, Oregon: the role of carbon. Atmospheric Environment 18, 235-240.
Shah J. J., Johnson R. L., Heyerdahl E. K. and Huntzicker J. J. (1986) Carbonaceous aerosol at urban and rural sites in the United States. JAPCA 36, 254-257.
Sunset Laboratory (1990) Sunset Laboratory Thermal- Optical Analysis for Organic~Elemental Carbon Aerosol. Sunset Laboratory, Forest Grove, OR.
Szkarlat A. C. and Japar S. M. (1981) Light absorption by airborne aerosols: comparison of integrating plate and spectrophone techniques. Appl. Opt. 20, 1151-1155.
Szkarlat A. C. and Japar S. M. (1983) Optical and chemical properties of particle emissions from on-road vehicles. JAPCA 33, 592-597.
Tanner R. L. and Miguel A. H. (1989) Carbonaceous aerosol sources in Rio de Janeiro. Aerosol Sci. Technol. 10, 213-223.
Tanner R. L., Gaffney J. S. and Phillips M. F. (1982) Determination of organic and elemental carbon in atmo- spheric aerosol samples by thermal evolution. Analyt. Chem. 54, 1627-1630.
Tomlin L. and McDade C. (1991) Quality assurance laborat- ory performance audit of the Phoenix and Tucson Urban Haze and PM10 studies. Document 2260-004-213, pre- pared by ENSR Consulting and Engineering, Camarillo, CA, for Desert Research Institute, Reno, NV.
Trijonis J., McGown M., Pitchford M., Biumenthal D., Roberts P., White W., Macias E., Weiss R., Waggoner A., Watson J., Chow J. and Flocchini R. (1988) The RESOL- VE project: visibility conditions and causes of visibility degradation in the Mojave Desert of California. Final report, prepared for Naval Weapons Center, China Lake, CA, by Santa Fe Research Corporation, Bloomington, MN.
Turpin B. J., Cary R. A. and Huntzicker J. J. (1990a) An in situ time-resolved analyzer for aerosol organic and elemental carbon. Aerosol Sci. Technol. 12, 161-171.
Turpin B. J., Huntzicker J. J. and Adams K. M. (1990b) Intercomparison of photoacoustic and thermal-optical methods for the measurement of atmospheric elemental carbon. Atmospheric Environment 24A, 1831-1835.
Watson J. G. (1979) Chemical element balance receptor model methodology for assessing the sources of fine and total particulate matter. Ph.D. dissertation, Oregon Graduate Center, Beaverton, OR. University Microfilms International, Ann Arbor, MI.
Watson J. G., Chow J. C., Richards L. W., Anderson S. R., Houck J. E. and Dietrich D. L. (1988a) The 1987-88 Metro Denver Brown Cloud Air Pollution Study, Volume I: program plan. DRI document 8810.1F1, prepared for the Greater Denver Chamber of Commerce, Denver, CO, by Desert Research Institute, Reno, NV.
Watson J. G., Chow J. C., Richards L. W., Anderson S. R., Houck J. E. and Dietrich D. L. (1988b) The 1987-88 Metro Denver Brown Cloud Air Pollution Study, Volume II: measurements. DRI document 8810.1F2, prepared for the Greater Denver Chamber of Commerce, Denver, CO, by Desert Research Institute, Reno, NV.
Watson J. G., Chow J. C., Richards L. W., Anderson S. R., Houck J. E. and Dietrich D. L. (1988c) The 1987-88 Metro Denver Brown Cloud Air Pollution Study, Volume III: data interpretation. DRI document 8810.1F3, prepared for the Greater Denver Chamber of Commerce, Denver, CO, by Desert Research Institute, Reno, NV.
Watson J. G., Chow J. C., Egami R. T., Frazier C. A.,

Thermal/optical reflectance carbon analysis 1201
Goodrich A. and Ralph C. (1988d) PM10 source appor- tionment in Reno and Sparks, Nevada for state imple- mentation plan development, Volume I: modeling methods and results. DRI document 8086.2F, prepared for the State of Nevada, Carson City, NV, by Desert Research Institute, Reno, NV.
Watson J. G., Chow J. C., Richards L. W., Haase D. L., McDade C., Dietrich D. L., Moon D., Chinkin L. and Sloane C. (1990a) The 1989 90 Phoenix Urban Haze Study. Volume I: program plan. DRI document 8931.1F, prepared for Arizona Department of Environmental Qual- ity, Phoenix, AZ, by Desert Research Institute, Reno, NV.
Watson J. G., Chow J. C., Richards, L. W., Haase D. L., McDade C., Dietrich D. L., Moon D., Chinkin L. and Sloane C. (1990b) The 1989-90 Pilot Tucson Urban Haze Study. Volume I: program plan. DRI document 8931.3F, prepared for Arizona Department of Environmental Qual- ity, Phoenix, AZ, by Desert Research Institute, Reno, NV.
Watson J. G., Chow J. C., Richards L. W., Haase D. L., McDade C., Dietrich D. L., Moon D., Chinkin L. and Sloane C. (1990c) The 1989-90 Phoenix PM10 Study. Volume I: program plan. DRI document 8931.2F, pre- pared for Arizona Department of Environmental Quality, Phoenix, AZ, by Desert Research Institute, Reno, NV.
Watson J. G., Chow J. C., Richards L. W., Haase D. L.,
McDade C., Dietrich D. L., Moon D., Chinkin L, and Sloane C. (1990d) The 198940 Pilot Tucson Urban Haze Study. Volume I: program plan. DRI document 8931.3F, prepared for Arizona Department of Environmental Qual- ity, Phoenix, AZ, by Desert Research Institute, Reno, NV.
Watson J. G., Chow J. C., Lowenthal D. H., Pritchett L. C., Frazier C. A., Neuroth G. R. and Robbins R. (1991a) Differences in the carbon composition of source profiles for diesel and gasoline powered vehicles. Presented at the 4th Int. Conf. on Carbonaceous Particles in the Atmo- sphere, Vienna, Austria, 3-5 April.
Watson J. G., Chow J. C., Richards L. W., Haase D. L., McDade C., Dietrich D. L., Moon D., Chinkin L. and Sloane C. (1991b) The 1989-90 Phoenix Urban Haze Study. Volume II: the apportionment of light extinction to sources. DRI document 8931.5F, prepared for Arizona Department of Environmental Quality, Phoenix, AZ, by Desert Research Institute, Reno, NV.
Watson J. G., Chow J. C., Richards L. W., Haase D. L., McDade C., Dietrich D. L., Moon D. and Sloane C. (1991c) The 1989-90 Pilot Tucson Urban Haze Study. Volume II: the apportionment of light extinction to sour- ces. DRI document 8931.7F, prepared for Arizona Depart- ment of Environmental Quality, Phoenix, AZ, by Desert Research Institute, Reno, NV.