THE DISTRICT SCHOOL BOARD OF HERNANDO COUNTY, … · the school district of hernando county,...
194
THE DISTRICT SCHOOL BOARD OF HERNANDO COUNTY, FLORIDA SUPERINTENDENT’S ANNUAL FINANCIAL REPORT FOR THE FISCAL YEAR ENDED JUNE 30, 2016 ISSUED BY: LORI M. ROMANO, PH.D., SUPERINTENDENT OF SCHOOLS SEPTEMBER 9, 2016
-
Upload
nguyenkhuong -
Category
Documents
-
view
213 -
download
0
Transcript of THE DISTRICT SCHOOL BOARD OF HERNANDO COUNTY, … · the school district of hernando county,...

THE DISTRICT SCHOOL BOARD OF HERNANDO COUNTY, FLORIDA
SUPERINTENDENT’S
ANNUAL FINANCIAL REPORT
FOR THE
FISCAL YEAR ENDED JUNE 30, 2016
ISSUED BY:
LORI M. ROMANO, PH.D., SUPERINTENDENT OF SCHOOLS
SEPTEMBER 9, 2016

THE SCHOOL DISTRICT OF HERNANDO COUNTY, FLORIDA
SUPERINTENDENT’S ANNUAL FINANCIAL REPORT
FOR THE FISCAL YEAR ENDED JUNE 30, 2016
BOARD MEMBERS
Matthew A. Foreman, Chairperson Beth Narverud, Vice Chairperson Susan Duval, School Board Member Gus Guadagnino, School Board Member Mark C. Johnson, School Board Member
ISSUED BY
Lori M. Romano, Ph.D., Superintendent Gina Michalicka, Deputy Superintendent Heather Martin, Executive Director – Business Services Joyce McIntyre – Director of Finance & Purchasing
PREPARED BY
Joyce McIntyre- Director of Finance & Purchasing

THE DISTRICT SCHOOL BOARD OF HERNANDO COUNTY, FLORIDA
SUPERINTENDENT’S ANNUAL FINANCIAL REPORT
FOR THE FISCAL YEAR ENDED JUNE 30, 2016
ISSUED BY:
SECTION I
INTRODUCTORY SECTION

ISSUED BY:

FLORIDA DEPARnIENT OF EDUCAnON SUPERL'HENDENT'S M~AL FINANCIAl. REPORT (ESE 145)
DISTRICT SCHOOL BOARD OF IIERNANDO COUNTY For the Fiscal Year Ended June 30, 2016
Return completed funn to: Flodd" IX:partrrumt ofEtincatiou Office of Funding and Financial R2porting 325 West Gaines Street, Room Bl4 TaHalms'<ee, Florida 32399-.0400
PAGE NUMBER INDEX: Minimum
RIJEorting CAFR
Exhibit A-I Exhibit B-1
Management's Disenssi on and Anal ysis ~~~~~--------~~~~~~~~~~-----~~~~----------------------------------------Staternent ofNet Position _~~~~~~~"~__"MMMMMMMM____MMM_MM__________________••••••____~~~~~~~~~~_MMMMMM________________ _
1 2
1 2
Exhibit B-2 Statement ofActivities "M~~~~~~~~~~_~_~ __~~~~MM~___MMMMMM______MMMMMMMMM___MMMMMM__MMMM~~~~~~~_~~____~~~~~~~__________ _ 3 3 Exhibit C-I B alanee Sheet - Governrnental F uuds ~M__~~~~____~~~M"~______""_"H~_N_MN_N_~.~__ .~~~ ~~~~~_~M_MMMMM_____ ~___________ _ 4 4 Exhibit C-2 Reconeiliation of the Governmental Funds Balance Sheet to the Government-wide Statement of Net
Position------___________ M __~""MM"_~~~~~~~N~M____________ MMMM_M_____________M ••••~__ ~~~~~~~_________________________
5 5 Exhibit C-3 Statement ofRevellues~ Expenditures and Changes 1n Fnnd Balanees - Governmental Funds ------------- 6 6 Exltibit C-4 Reeonciliation of the Statement of Revennes~ Expenditures and Changes in Fnnd Balances of
Governmental Fnnds to the Govel'llmeut-widc Statement of Activities -----~~~~~-----------------~-------- 7 7 Exhibit C-5 Statement ofl\et Position --. Proprietary Fnnds _______MMMM ••••••••________________________________MMMMM_ 8 8 Exhibit C-6 Statement of Revennes, Expenses and Changes in Fund Net Position - Proprietary Funds ----------....... . 9 9 Exhibit C-7 Exhibit C-8
Statement of Cash Flows ... Proprietary Funds----------·········------------------------------·••••••• Statement of Fiduciary Net POSl lion ____MMMMM _____________________~~__~~~~~____________ ---...... .
10 11
to II
Exhibit C-9 Statement of Changes in Flduciary Net Position ----------------------------------.-----------...... . 12 12 Exhibit C-IO Combining Statement ofNet Position- Major and Nonmajor Component Units ----------.-------------... . 13 13 Exhibit C-lla-d Exhibit D-l
Combining Statement ofActivities .." Major and Nonmajor Component Ultits------~~~~~-~-~---··~-~--------Notes to Finanda1Stal.emcnts _~~ .~_~~_____~~___________________~~~~~________~_______~n____M ____________
14"17 18
14-17 18
Exhibit D-2a Required ~'npplemeutary Information ... Schedule ofFnnding Progress -----------.-----"--..--"~-------- 19 19 Exhibit D-2b ~ores to Required Supplementary Information ------------~~~~~---------~-----~ 20 20 Exhibit E-l Schedule of Revenues, Expenditnrcs aoo Changes in Fund Balanees - Bndgct and Actual General
Fund ------------------------------------------------------------------------------------------------- 21 21 Exhibit E-2a-d Schedule of Revenlles. Expenditures aod Changes in Fnnd Balanees - Bndget and Aetnal ~ Major
Speeial Revenue Fuuds _~____M. ___ ~ • ~~~_______~4___ ~_______________~__~~____________F ___FF ••••••, •••"-~~~~~~------ 22-25 22-25 Exhibit F -1 a-d Combining Balance Sheet - Norunajor Governmental Funds ________~_~__________________ MM___MMMMM ________ 26-29 Exhibit F-2a-d Combining Statement of Revennes j Expeuditures and Changes in Fund Balances - Nonmajor
Govcmlnental Funds-----M~ ......~_~__MMM________~__________~~~~~~~~~~__~~~~~~~~______________________MMMM_______________ 30-33 Exhibit 0-1 Schednlc of Rcvenncs, Expenditnres and Changes in Fund Balances Budget and Actual
N onma jor Special Revenue Funds ~MM___________~~~~____________________________________----------------~----- 34 Exhibit 0-2 Schedule of Revenues, Expenditures and Changes in Fund Balances Budget and Actual··· Debt
Serviec Funds~~~~~~~~M~~MMM____________MM ________~~~~~~ ----------- ______________________~_~______ 35-36 Exhibit 0-3 Schedule of Revcunes, Expenditures 3ud Changes in Fund Balances Budget and Actual··· Capital
Projects Fnl1ds~~~~~~~~~~~~------------M-.---------~~~~------------------------------------~-~--- 37-39 ExhIbit 0-4 Schedule of Revenues) Expenditures and Changes in Fnnd Balances Budget and Actual -
Permanent Fuuds •• ~~~~--~-------~--~----~~----------~~--~-------.----------------------------~~~~~~~~~ 40 Exhibit H-I Combining Statement of Net Position - Nonmajor Enterprise Fnnds ---------,.-.-----------~---------~~~~~~~~ 41 Exhibit H-2 Combining Statement of Revenues; Expenses and Changes iu f'uurl Net Position - Nonmajor
Enterprise F unos --------------------------------------------------------- ------ -------------------- 42 ExhibitH-3 Combining Statement of Cash Flows - Noumajor Euterprise Funds -------..~.--...- ...--~~----------- 43 ExhibitH-4 Combiuing Statement ofNet Position - Internal Service Funds ----~------------.--~-~---------------------- 44 Exhibit H-5 CombIning Statement of Revennes, Expenses and Changes in Fuud Net Position -Ioternal Service
Funds ~~~________""_"~_"___________________~~~~____________________________.M~ __ M~~~________________ 45 ExhibitH-6 Combining Statement ofcash Flows -Intemal Service Funds _____________________M_____________________ 46 Exhibit 1-1 CombinIug Statetnent ofFiduciary Net Position -Inve.stment Trust Fuuds __~__~M~~______________________ 47 Exhibit 1-2 Combining Statement ofChanges in ~et Position - Investmeut Trust Fuuds -"---~------------------ 48 Exhibit T-3 Combining Statement ofFiduciary Net Position - Private-Purpose Inlst Funds --~-~----~----------------- 49 Exhibit 1-4 Combining Statement of Changes In Net Position - Private-Purpose Trust Funds ------------------- 50 Exhibit T-5 Combining Statement ofFiduciary Net Position - Pension Trust Fuuds ___MMMMMMM~~~~____~_~___________________ 51 Exhibit 1-6 Combining Statement of Changes In Net Position ~ Pension Trust Funds----------------------~~~~~~~~ 52 Exhibit 1-7 Combiniug Statement ofFiduciary l\Sscts and Liabilities - Agency Funds MMMMM __________ ~~____________~~~~~~~ 53 Exhibit 1-8a-d Combining Statement of Changes in Assets aud Liabilities Agency Funds -~~~~-~~~---~~~~---------------~~~ 54-57 Exhibit J-I Combining Statement ofNet Positiou - Nonmajor Component Units MMMMM______________~~~~_____~_~_____···_~~ 58 Exhibit J-2a-d Combining Statement of Activities - Nonmajor Component Units ____MMMMMM_____~~___ ~~~~_~~~_______________~ 59-63
The Superintendent's AJmual Financial Report (ESE 145) for the fiscal year ended June 30. 2016. was submitted in aeoordauee with rule 6A-LQ071, Florida Administrative Code (section 1 OOl.Sl{12)(b), Florida Statutes). This report was approved by the school board on SeptembCl' 6. 2016,
_-:?'ib,-,.~....:fi . '-6frn<A.1€~Signature ofDtstrict School Supctintendeut
A~_
ESE 145

DISTRICT SCHOOL BOARD OF HERNANDO COUNTY Exhibit A-1 MANAGEMENT DISCUSSION AND ANALYSIS Page1a For the Fiscal Year Ended June 30, 2016
The management of the Hernando County District School Board (District) has prepared the following discussion and analysis to provide an overview of the District’s financial activities for the fiscal year ended June 30, 2016. The information contained in the Management’s Discussion and Analysis (MD&A) is intended to highlight significant transactions, events, and conditions, and should be considered in conjunction with the District’s financial statements and notes to financial statements found immediately following the MD&A.
FINANCIAL HIGHLIGHTS
Key financial highlights for the 2015-2016 fiscal year are as follows:
Total Net Position is $207,981,309, which represents a 5.11 percent increase from the 2014-2015 fiscal year.
General revenues increased $8,742,966 or 5.80 percent of all revenues to $159,369,550.
General Fund expenses decreased $3,738,067 or 2.29 percent of all expenditures to $159,204,613.
The total combined assigned and unassigned fund balance of the General Fund representing the net fund balance that is spendable and not restricted, totals $7,498,718, or 4.71 percent of total General Fund revenues.
OVERVIEW OF THE FINANCIAL STATEMENTS
This discussion and analysis is intended to serve as an introduction to the District’s basic financial statements. The District’s basic financial statements are comprised of three components: 1) government-wide financial statements, 2) fund financial statements, and 3) notes to the financial statements. This report also contains other supplemental information in addition to the basic financial statements themselves.
Government-Wide Financial Statements. The government-wide financial statements are designed to provide readers with a broad overview of the District’s finances, in a manner similar to a private-sector business. The statements include a statement of net position and a statement of activities that are designed to provide consolidated financial information about the governmental activities of the primary government presented on the accrual basis of accounting. The statement of net position provides information about the government’s financial position, its assets, its liabilities, and its deferred outflows of resources using an economic resources measurement focus. Assets plus deferred outflows of resources, less liabilities, equals net position, which is a measure of the District’s financial health. The statement of activities presents information about the change in the District’s net position, the results of operations during the fiscal year. An increase or decrease in net position is an indication of whether the District’s financial health is improving or deteriorating.

DISTRICT SCHOOL BOARD OF HERNANDO COUNTY Exhibit A-1 MANAGEMENT DISCUSSION AND ANALYSIS Page1b For the Fiscal Year Ended June 30, 2016
Both of the government-wide financial statements distinguish functions of the District that are principally supported by taxes and intergovernmental revenues (governmental activities). The government activities of the District include such functions as instruction, pupil personnel services, administration, pupil transportation, maintenance, and other items.
The government-wide financial statements include not only the District itself (known as the primary government), but also Brooksville Engineering, Science & Technology, Inc., Gulf Coast Middle School, Inc. and Gulf Coast Academy of Science and Technology, Inc., all Charter Schools, which the District is required to report as component units. Financial information for the component units is reported separately from the financial information presented for the primary government itself.
The government-wide financial statements can be found in Exhibits B-1 and B-2 of this report.
Fund Financial Statements. A fund is a grouping of related accounts that is used to maintain control over resources that have been segregated for specific activities or objectives. The District, like other state and local governments, uses fund accounting to ensure and demonstrate compliance with finance-related legal requirements. All of the funds of the District can be classified under two categories: governmental funds and fiduciary funds.
Governmental Funds. Governmental funds are used to account for essentially the same functions reported as governmental activities in the government-wide financial statements. However, unlike the government-wide financial statements, governmental funds financial statements focus on near-term inflows and outflows of spendable resources, as well as on balances of spendable resources available at the end of the fiscal year. Such information may be useful in evaluating a government’s near-term financial requirements.
Because the focus of governmental funds is narrower than that of the government-wide financial statements, it is useful to compare the information presented for governmental funds with similar information presented for governmental activities in the government-wide financial statements. By doing so, readers may better understand the long-term impact of the government’s near-term financial decisions. Both the governmental funds balance sheet and the governmental funds statement of revenues, expenditures, and changes in fund balances provide a reconciliation to facilitate this comparison between governmental funds and governmental activities.
The District maintains 13 individual governmental funds. Information is presented separately in the governmental funds balance sheet and in the governmental funds statement of revenues, expenditures, and changes in fund balances for the General Fund, Federal Economic Stimulus Programs Funds, Special Revenue – Federal Fund, Capital Improvement Section 1011.71 Project Fund and Other Capital Projects Fund all of which are considered to be major funds. Data from the other eight governmental funds are combined into a single, aggregated presentation.

DISTRICT SCHOOL BOARD OF HERNANDO COUNTY Exhibit A-1 MANAGEMENT DISCUSSION AND ANALYSIS Page1c For the Fiscal Year Ended June 30, 2016
The District adopts an annual appropriated budget for its governmental funds. A budgetary comparison schedule has been provided for all the major funds to demonstrate compliance with this budget.
The basic governmental fund financial statements and the budgetary comparison schedules presented as required supplementary information can be found in Exhibit C-1 through Exhibit C-4 and Exhibit E of this report.
Fiduciary Funds. Fiduciary funds are used to report assets held in a trustee or fiduciary capacity for the benefit of external parties, such as student activity funds. Fiduciary funds are not reflected in the government-wide statements because the resources are not available to support the District’s own programs. In its fiduciary capacity, the District is responsible for ensuring that the assets reported in these funds are used only for their intended purposes. The District uses private-purpose trust funds to account for scholarship funds established by private donors. The District uses agency funds to account for resources held for student activities and groups.
The basic fiduciary funds financial statements can be found in Exhibit C-8 and Exhibit C-9 of this report.
Notes to Financial Statements. The notes provide additional information that is essential for a full understanding of the data provided in the government-wide and fund financial statements. The notes to financial statements can be found in Exhibit D-1 of this report.
Other Supplementary Information. In addition to this management’s discussion and analysis, this report also presents certain required supplementary information concerning the District’s progress in funding its obligations to provide postemployment benefits other than pensions to its employees. The schedule of funding progress, other postemployment benefits plan, required supplementary information can be found in Exhibit D-2 of this report.
The combining statements referred to earlier in connection with non-major governmental funds are presented immediately following the Required Supplementary. Combining and individual fund statements and other schedules can be found in Exhibits F-1 through J-2 of this report.
GOVERNMENT-WIDE FINANCIAL ANALYSIS
The following is a summary of the District’s net position as of June 30, 2016, compared to net position as of June 30, 2015:

DISTRICT SCHOOL BOARD OF HERNANDO COUNTY Exhibit A-1 MANAGEMENT DISCUSSION AND ANALYSIS Page1d For the Fiscal Year Ended June 30, 2016
June 30, June 30,
2016 2015
Current and Other Assets 52,259,286$ 47,226,865$
Capital Assets 371,838,484 380,717,720
Total Assets 424,097,770 427,944,585
Deferred Outflows of Resources 16,530,989 12,606,340
Long-Term Liabilities 219,369,944 210,970,531
Other Liabilities 2,102,986 980,717
Total Liabilities 221,472,930 211,951,248
Deferred Inflows of Resources 11,174,520 30,731,596
Net Position:
Net Investment in Capital Assets 249,509,922 247,598,971
Restricted 36,222,596 34,480,595
Unrestricted (77,751,209) (84,211,485)
Total Net Position 207,981,309$ 197,868,081$
Net Position
Governmental
Activities
The largest portion of the District’s net position reflects its investment in capital assets (e.g., land; buildings and fixed equipment; furniture, fixtures and equipment), less any related debt still outstanding net of unspent debt proceeds. The District uses these capital assets to provide services to students; consequently, these assets are not available for future spending. Although the investment in capital assets is reported net of related debt, the resources used to repay the debt must be provided from other sources, since the capital assets cannot be used to liquidate these liabilities.
The restricted portion of the District’s net position represents resources that are subject to external restrictions on how they may be used. The unrestricted net position of $77,751,209 is higher than in previous years as a result of the implementation of GASB Statement No. 68. The Statement requires employers participating in cost-sharing multi-employer defined benefit plans to report the employer’s proportionate share of the defined benefit pension plans. The requirements of this Statement resulted in reporting FRS and HIS pension liabilities of $35,576,946 and $38,091,945 respectively, at June 30, 2016.
The key elements of the changes in the District’s net position for the fiscal years ended June 30, 2016, and June 30, 2015, are as follows:

Changes in Net Position
Governmental
Activities
June 30, June 30,
2016 2015
Revenues:
Program Revenues:
Charges for Services $ 2,071,894 $ 2,382,682
Operating Grants and Contributions 9,842,901 8,909,622
Capital Grants and Contributions 1,549,777 1,063,330
General Revenues:
Property Taxes 58,664,420 56,930,269
Other Taxes 3,845,976 5,284,711
Grants and Contributions Not Restricted
to Specific Programs 120,853,413 117,033,440
Unrestricted Investment Earnings 276,542 (121,985)
Miscellaneous 106,702,679 2,661,570
194,143,639Total Revenues 303,807,602
Functions/Program Expenses:
Instruction 105,578,889 106,464,738
Student Personnel Services 8,566,070 9,271,687
Instructional Media Services 1,830,146 2,189,442
Instruction and Curriculum Development Services 4,338,366 4,611,206
Instructional Staff Training Services 2,986,950 2,834,048
Instruction Related Technology 742,693 1,495,715
Board 499,984 480,877
General Administration 1,292,744 1,391,321
School Administration 11,166,922 11,254,519
Facility Services - Non-Capitalized 6,924,639 2,430,003
Fiscal Services 777,715 1,107,565
Food Services 10,348,325 10,428,835
Central Services 1,381,340 1,538,384
Student Transportation Services 6,993,833 7,905,288
Operation of Plant 14,448,920 14,866,067
Maintenance of Plant 5,329,430 4,715,632
Administrative Technology Services 2,573,806 2,140,357
Community Services 6,064 20,549
Unallocated Interest on Long-Term Debt 97,162,338 5,804,308
Unallocated Depreciation Expense 10,824,298 12,079,806
203,030,347
Total Functions/Program Expenses 293,773,472
Increase in Net Position 10,034,130 (8,886,708)
Net Position, Beginning 197,980,855 280,264,558
Adjustment to Net Position (a)
Net Position, Ending
$
(33,676)
207,981,309 $
(73,509,769)
197,868,081
DISTRICT SCHOOL BOARD OF HERNANDO COUNTY Exhibit A-1 MANAGEMENT DISCUSSION AND ANALYSIS Page1e For the Fiscal Year Ended Ju ne 30 , 2016

DISTRICT SCHOOL BOARD OF HERNANDO COUNTY Exhibit A-1 MANAGEMENT DISCUSSION AND ANALYSIS Page1f For the Fiscal Year Ended June 30, 2016
The total governmental net position increased by $10,034,130 during the current year, as compared to a net decrease of $8,886,708 in the previous year. Total revenues increased by $109,663,963 compared to the prior year. District expenses increased $90,743,125. Direct instructional expenses, including school administration decreased $2,911,319. District-level expenses increased $3,551,922. Unallocated expenses for interest and depreciation increased $90,102,522.
FINANCIAL ANALYSIS OF THE DISTRICT’S FUNDS
Major Governmental Funds. The focus of the District’s governmental funds is to provide information on near-term inflows, outflows, and balances of spendable resources. Such information is useful in assessing the District’s financial requirements. In particular, unassigned fund balance may serve as a useful measure of a government’s net resources available for spending at the end of the fiscal year.
As of the end of the current fiscal year, the District’s governmental funds reported combined ending fund balances of $45,291,989, a increase of $3,442,575 in comparison with the prior year. The following schedule indicates the fund balances and changes in fund balances by major fund and other governmental (nonmajor) funds as reported in the basic financial statements for the fiscal years ended June 30, 2016 and June 30, 2015.
June 30, June 30, Increase Percentage
Fund Balance 2016 2015 (Decrease) Change
Major Governmental Funds:
General Fund 10,035,572$ 6,402,667$ 3,632,905$ 56.74%
Debt Service Fund 13,904,053 0 13,904,053 100.00%
Capital Projects Funds:
Local Capital Improvement 12,075,280 10,843,262 1,232,018 100.00%
Other Capital Projects 4,505,507 18,759,179 (14,253,672) -75.98%
Other Governmental Funds (nonmajor) 4,771,577 5,731,534 (959,957) -16.75%
Total Fund Balance 45,291,989$ 41,736,642$ 3,555,347$ 8.52%
General Fund. The General Fund is the primary operating fund of the District. At the end of the current fiscal year, the unassigned fund balance of the General Fund was $6,575,155, while total fund balance was $10,035,572. As a measure of the General Fund’s liquidity, it may be useful to compare both unassigned fund balance and total fund balance to total revenues. Unassigned fund balance represents 4.13 percent of General Fund revenues, while total fund balance represents 4.71 percent of that same amount.
During the current fiscal year, the total fund balance of the General Fund decreased by $7,885,820.

June 30, June 30, Increase Percentage
2016 2015 (Decrease) Change
Federal Direct Sources:
Reserve Officers Training Corps (ROTC) 212,975$ 214,600$ (1,625)$ -0.76%
Federal through State Sources:
Medicaid 663,611 489,114 174,497 35.68%
Other Federal through State Sources - - - 100.00%
State Sources:
Florida Education Finance Program (FEFP) 82,146,741 77,610,844 4,535,897 5.84%
Categorical Programs 24,656,609 23,865,698 790,911 3.31%
Other State Sources 1,061,767 1,031,368 30,399 2.95%
Local Sources:
Ad Valorem Taxes 46,435,418 45,018,129 1,417,289 3.15%
Interest Income 49,074 28,430 20,644 72.61%
Other Local Sources 4,143,355 2,367,401 1,775,954 75.02%
159,369,550$ 150,625,584$ 8,743,966$ 5.81%
Other Financing Sources:
Transfers In 5,068,054 5,300,000 (231,946) -4.38%
Other Financing Sources 59,145 87,923 (28,778) -32.73%
Total Revenues and Other Financing Sources 164,496,749$ 156,013,507$ 8,483,242$ 5.44%
General Fund Revenues and Other Financing
Sources
DISTRICT SCHOOL BOARD OF HERNANDO COUNTY Exhibit A-1 MANAGEMENT DISCUSSION AND ANALYSIS Page1g For the Fiscal Year Ended June 30, 2016
The following schedule shows the changes in General Fund revenues and transfers in for fiscal years ended June 30, 2016 and June 30, 2015.
The following schedule shows the changes in General Fund expenditures (by major object) for fiscal years ended June 30, 2016 and June 30, 2015.
June 30, June 30, Increase Percentage
2016 2015 (Decrease) Change
Salaries 102,340,759$ 105,437,200$ (3,096,441)$ -2.94%
Employee Benefits 31,737,509 32,891,081 (1,153,572) -3.51%
Purchased Services 10,901,252 9,993,774 907,478 9.08%
Energy Services 6,207,479 6,991,454 (783,975) -11.21%
Materials and Supplies 4,561,962 5,421,984 (860,022) -15.86%
Capital Outlay 2,498,652 1,342,622 1,156,030 86.10%
Other Expenditures 957,000 864,565 92,435 10.69%
Total Expenditures by Major Object 159,204,613$ 162,942,680$ (3,738,067)$ -2.29%
General Fund Expenditures by Major
Object

Original Final Increase Percentage
Budget Budget (Decrease) Change
Federal Direct Sources:
Reserve Officers Training Corps (ROTC) 221,043$ 212,975$ (8,068)$ -3.65%
Federal through State Sources:
Medicaid 375,000 663,611 288,611$ 76.96%
State Sources:
Florida Education Finance Program (FEFP) 83,787,804 82,146,741 (1,641,063)$ -1.96%
Categorical Programs 23,978,934 24,656,609 677,675$ 2.83%
Other State Sources 724,605 1,061,767 337,162$ 46.53%
Local Sources:
Ad Valorem Taxes 46,042,450 46,435,418 392,968$ 0.85%
Interest Income 49,074 49,074 -$ 0.00%
Other Local Sources 1,242,761 4,143,355 3,035,207$ 244.23%
Other Financing Sources:
Transfers In 5,300,000 5,068,054 778,445$ 14.69%
Other Financing Sources 50,000 59,145 9,145$ 100.00%
Total Revenues and Other Financing Sources 161,771,671$ 164,496,749$ 3,870,082$ 2.39%
General Fund Revenues and Other Financing Sources
DISTRICT SCHOOL BOARD OF HERNANDO COUNTY Exhibit A-1 MANAGEMENT DISCUSSION AND ANALYSIS Page1h For the Fiscal Year Ended June 30, 2016
As the table above illustrates, the largest portions of General Fund expenditures are for salaries and employee benefits with $134,078,268 expended or 84.22 percent of total expenditures in the 2015-2016 fiscal year compared to $138,328,281 or 84.89 percent in the 2014-2015 fiscal year. Expenditures are down $3,738,067 or 2.29 percent lower than the 2014-2015 fiscal year due to the implementation of budget reduction strategies.
Special Revenue – Other Federal Programs Fund. These funds are federally provided grants and entitlements that are received by the District from various federal and state agencies. Special Revenue Funds do not report fund balance because revenues are reported to the extent of expenditures.
Other Debt Service – The Fund balance of the Debt Service Fund increased by $11,690,901. This was due to unspent Capital Funds transferred to Debt Service.
Capital Projects – Nonvoted Capital Improvements Fund. The fund balance of the Capital Projects – Nonvoted Capital Improvements Fund increased by $1,232,018 to $12,075,280.
Capital Projects – Other Fund. The fund balance of the Capital Projects – Other Fund decreased by $14,293,918 to $4,505,507. Funds from Capital Projects are the primary source of funds to pay debt service.
GENERAL FUND BUDGETARY HIGHLIGHTS
The following schedule shows the changes in General Fund revenues and other financing sources between the original and final budgets for the fiscal year ended June 30, 2016.

Original Final Increase Percentage
General Fund Expenditures by Function Budget Budget (Decrease) Change
Current:
Instruction 104,019,154$ 103,110,541$ (908,613)$ -0.87%
Pupil Personnel Services 6,235,843 6,504,626 268,783$ 4.31%
Instructional Media Services 2,176,621 1,848,730 (327,891)$ -15.06%
Instruction and Curriculum Development 947,682 1,561,452 613,770$ 64.77%
Instructional Staff Training 550,272 692,982 142,710$ 25.93%
Instruction Related Technology 192,096 217,375 25,279$ 13.16%
School Board 520,081 505,584 (14,497)$ -2.79%
General Administration 1,027,128 873,493 (153,635)$ -14.96%
School Administration 10,486,854 11,266,677 779,823$ 7.44%
Facility Services - Non Capitalized 494,493 317,215 (177,278)$ -35.85%
Fiscal Services 1,197,080 785,054 (412,026)$ -34.42%
Food Services 0 557 557$ 100.00%
Central Services 1,364,931 1,393,002 28,071$ 2.06%
Pupil Transportation Services 7,882,869 7,003,616 (879,253)$ -11.15%
Operation of Plant 15,269,356 14,607,003 (662,353)$ -4.34%
Maintenance of Plant 5,699,196 5,379,915 (319,281)$ -5.60%
Administrative Related Technology Services 2,560,124 2,602,849 42,725$ 1.67%
Community Services 3,885 6,159 2,274$ 58.53%
Capital Outlay 494,493 527,783 33,290$ 6.73%
Total Expenditures by Function 161,122,158$ 159,204,613$ (1,917,545)$ -1.19%
DISTRICT SCHOOL BOARD OF HERNANDO COUNTY Exhibit A-1 MANAGEMENT DISCUSSION AND ANALYSIS Page1i For the Fiscal Year Ended June 30, 2016
Final budgeted revenues and other financing sources for the General Fund when compared to the initial budget were 2.39 percent lower. Reductions in FEFP and categorical programs funding from the State totaling $1,641,063 were due to decreases in the number of full-time students from the amounts projected. Ad Valorem Tax collections were budgeted at 96 percent as required by Section 1011.62(4)(a), Florida Statutes. However, actual collections were .85 percent higher or an increase of $392,968. Actual Collections from Other Local Sources resulted in a increase of $3,035,207 in revenues.
The following schedule shows the changes in General Fund expenditures by function between the original and final budgets for the fiscal year ended June 30, 2016.
The final budgeted expenditures were lower than the original budget by $1,917,545 or 1.19 percent. Reductions were realized through the District’s conservative spending and through savings initiatives that were implemented during the fiscal year.
CAPITAL ASSETS AND LONG-TERM DEBT
Capital Assets. The District’s investment in capital assets for governmental activities as of June 30, 2016, amounts to $371,838,484 (net of accumulated depreciation). This investment in capital assets includes land; improvements other than buildings; buildings and fixed equipment; furniture,

DISTRICT SCHOOL BOARD OF HERNANDO COUNTY Exhibit A-1 MANAGEMENT DISCUSSION AND ANALYSIS Page1j For the Fiscal Year Ended June 30, 2016
fixtures, and equipment; and motor vehicles. The total decrease of $8,977,402 in the District’s investment in capital assets (net of accumulated depreciation) for the current fiscal year was 2.36 percent.
June 30, June 30,
2016 2015
Land 10,317,174$ 10,317,174$
Improvements Other Than Buildings 11,428,117 12,548,535
Buildings and Fixed Equipment 347,369,398 355,863,048
Furniture, Fixtures, and Equipment 2,723,795 946,399
Motor Vehicles - 14,177
Construction in Progress -
Property Under Capital Leases - 1,126,553
Total Capital Assets 371,838,484$ 380,815,886$
Governmental
Activities
Additional information on the District’s capital assets can be found in Note 4 of this report.
Long-Term Debt. At the end of the current fiscal year, the District has total long-term debt outstanding of $121,479,922, which excludes compensated absences and other postemployment benefits payable. This amount is comprised of a note payable of $4,860,254, $111,464,668 in Certificates of Participation, and $5,155,000 in bonded debt.
The District’s current rating on Sales Tax Revenue Bonds from Fitch’s Rating Services is AA- with a stable outlook. The District’s current rating on outstanding Certificates of Participation (COPs) from Fitch’s Rating Services is A+ with a stable outlook.
During the current fiscal year, the District paid $4,681,318 for principal payments on long-term debt as follows:
State School Bonds 617,000$
Other Debt Service:
District Revenue Bonds 90,000
Certificates of Participation 2,737,022
Note Payable 1,237,296
Total Principal Payments 4,681,318$
Additional information on the District’s long-term debt can be found in Notes 5 through 9 of this report.

DISTRICT SCHOOL BOARD OF HERNANDO COUNTY Exhibit A-1 MANAGEMENT DISCUSSION AND ANALYSIS Page1k For the Fiscal Year Ended June 30, 2016
ECONOMIC FACTORS AND FORECAST
As of June 2016, the unemployment rate for Hernando County is currently 4.7 percent, which is a decrease from the rate of 6.9 percent a year ago. This compares to the State’s average unemployment rate of 4.9 percent. These factors were considered in preparing the District budget for the 2016-2017 fiscal year.
During the current fiscal year, the fund balance in the General Fund increased by $3,632,905 to $10,035,572. Included in this total, the District has inventories of $1,570,675 that are classified as nonspendable, $360,128 in State categorical funds reported as restricted, and $152,272 in encumbrances reported as assigned, which are reappropriated in the budget for the 2016-2017 fiscal year. Assigned fund balance also includes $771,291 health insurance rebates and profit sharing, which will be held in fund balance until appropriated. It is anticipated that this use of unassigned fund balance will be replenished at year-end through unspent appropriations and operating fund property tax revenues in excess of the budget. It is anticipated that the fund balance at June 30, 2017, will be in excess of 3 percent of general fund revenues.
REQUESTS FOR INFORMATION
This financial report is designed to provide citizens, taxpayers, customers, investors, and creditors with a general overview of the District’s finances and to demonstrate compliance and accountability for its resources. Questions concerning any of the information provided in this report or requests for additional financial information should be addressed to the Finance Department, Hernando County District School Board, 919 North Broad Street, Brooksville, Florida, 34601.

THE DISTRICT SCHOOL BOARD OF HERNANDO COUNTY, FLORIDA
SUPERINTENDENT’S ANNUAL FINANCIAL REPORT
FOR THE FISCAL YEAR ENDED JUNE 30, 2016
ISSUED BY:
SECTION II
FINANCIAL SECTION

ISSUED BY:

Exhibit B-1
Page 2
DISTRICT SCHOOL BOARD OF HERNANDO COUNTY
STATEMENT OF NET POSITION
June 30, 2016
Account
Number
Primary Government Component Units
Governmental Activities Total
Total Nonmajor
Component Units
ASSETS
Cash and Cash Equivalents 1110 30,453,792.00 30,453,792.00 242,471.00
Investments 1160 14,420,069.00 14,420,069.00 20,000.00
Accounts Receivable, Net 1131 112,938.00 112,938.00 0.00
Due From Other Agencies 1220 1,632,576.00 1,632,576.00 0.00
Capital Credit Long Term Receivables 0000 3,935,081.00 3,935,081.00 0.00
Inventory 1150 1,702,734.00 1,702,734.00 0.00
Prepaid Items 1230 2,096.00 2,096.00 25,500.00
Capital Assets
Land 1310 10,317,174.00 10,317,174.00 0.00
Nondepreciable Capital Assets 10,317,174.00 10,317,174.00 0.00
Improvements Other Than Buildings 1320 28,544,421.00 28,544,421.00 95,434.00
Less Accumulated Depreciation 1329 (17,116,304.00) (17,116,304.00) (71,117.00)
Buildings and Fixed Equipment 1330 477,871,201.00 477,871,201.00 0.00
Less Accumulated Depreciation 1339 (130,501,803.00) (130,501,803.00) 0.00
Furniture, Fixtures and Equipment 1340 38,892,031.00 38,892,031.00 335,278.00
Less Accumulated Depreciation 1349 (36,168,236.00) (36,168,236.00) (220,539.00)
Motor Vehicles 1350 15,133,841.00 15,133,841.00 275,791.00
Less Accumulated Depreciation 1359 (15,133,841.00) (15,133,841.00) (73,292.00)
Depreciable Capital Assets, Net 361,521,310.00 361,521,310.00 341,555.00
Total Capital Assets 371,838,484.00 371,838,484.00 341,555.00
Total Assets 424,097,770.00 424,097,770.00 629,526.00
DEFERRED OUTFLOWS OF RESOURCES
Pension 1940 16,530,989.00 16,530,989.00 0.00
Total Deferred Outflows of Resources 16,530,989.00 16,530,989.00 0.00
LIABILITIES
Accrued Salaries and Benefits 2110 0.00 40,681.00
Accounts Payable 2120 2,066,638.00 2,066,638.00 6,613.00
Sales Tax Payable 2260 346.00 346.00 0.00
Current Notes Payable 2250 628.00 628.00 0.00
Accrued Interest Payable 2210 29,167.00 29,167.00 0.00
Deposits Payable 2220 3,284.00 3,284.00 0.00
Due to Other Agencies 2230 2,923.00 2,923.00 0.00
Noncurrent Liabilities
Portion Due Within One Year:
Notes Payable 2310 1,237,295.00 1,237,295.00 49,633.00
Bonds Payable 2320 658,000.00 658,000.00 0.00
Unamortized Premiums- Bonds 2321 75,200.00 75,200.00
Liability for Compensated Absences 2330 1,000,000.00 1,000,000.00 0.00
Lease-Purchase Agreements Payable 2340 2,792,152.00 2,792,152.00 0.00
Unamortized Premiums- COPS 2345 24,669.00 24,669.00
Due Within One Year 5,787,316.00 5,787,316.00 49,633.00
Portion Due After One Year:
Notes Payable 2310 3,622,960.00 3,622,960.00 112,143.00
Bonds Payable 2320 4,497,000.00 4,497,000.00 0.00
Unamortized Premiums- Bonds 2325 280,066.00 280,066.00
Liability for Compensated Absences 2330 12,489,203.00 12,489,203.00 0.00
Lease-Purchase Agreements Payable 2340 108,672,516.00 108,672,516.00 0.00
Unamortized Premiums- COPS 2345 468,704.00 468,704.00
Net Other Postemployment Benefits Obligation 2360 9,883,288.00 9,883,288.00 0.00
Net Pension Liability 2365 73,668,891.00 73,668,891.00 0.00
Due in More than One Year 213,582,628.00 213,582,628.00 112,143.00
Total Long-Term Liabilities 219,369,944.00 219,369,944.00 161,776.00
Total Liabilities 221,472,930.00 221,472,930.00 209,070.00
DEFERRED INFLOWS OF RESOURCES
Deferred Revenue 2630 929,230.00 929,230.00 0.00
Pension 2640 10,245,290.00 10,245,290.00 0.00
Total Deferred Inflows of Resources 11,174,520.00 11,174,520.00 0.00
NET POSITION
Net Investment in Capital Assets 2770 249,509,922.00 249,509,922.00 179,779.00
Restricted For:
Categorical Carryover Programs 2780 360,128.00 360,128.00 0.00
Food Service 2780 3,932,628.00 3,932,628.00 0.00
Debt Service 2780 14,275,303.00 14,275,303.00 0.00
Capital Projects 2780 17,048,486.00 17,048,486.00 0.00
Other Purposes 2780 606,051.00 606,051.00 0.00
Unrestricted 2790 (77,751,209.00) (77,751,209.00) 240,677.00
Total Net Position 207,981,309.00 207,981,309.00 420,456.00
The notes to financial statements are an integral part of this statement.
ESE 145

Exhibit B-2 Page 3
DISTRICT SCHOOL BOARD OF HERNANDO COUNTY STATEMENT OF ACTIVITIES For the Fiscal Year Ended June 30, 2016
FUNCTIONS Account Number Expenses
Charges for Services
Governmental Activities: Instruction 5000 105,578,889.00 84,512.00 Student Support Services 6100 8,566,070.00 Instructional Media Services 6200 1,830,146.00 Instruction and Curriculum Development Services 6300 4,338,366.00 Instructional Staff Training Services 6400 2,986,950.00 Instruction-Related Technology 6500 742,693.00 Board 7100 499,984.00 General Administration 7200 1,292,744.00 School Administration 7300 11,166,922.00 Facilities Acquisition and Construction 7400 6,924,639.00 Fiscal Services 7500 777,715.00 Food Services 7600 10,348,325.00 1,835,379.00 Central Services 7700 1,381,340.00 Student Transportation Services 7800 6,993,833.00 152,003.00 Operation of Plant 7900 14,448,920.00 Maintenance of Plant 8100 5,329,430.00 Administrative Technology Services 8200 2,573,806.00 Community Services 9100 6,064.00 Interest on Long-Term Debt 9200 97,162,338.00 Unallocated Depreciation/Amortization Expense 10,824,298.00
Total Governmental Activities 293,773,472.00 2,071,894.00 Business-type Activities:
Self-Insurance Consortium Daycare Operations Other Business-Type Activity
Total Primary Government 293,773,472.00 2,071,894.00 Component Units:
Total Nonmajor Component Units 2,593,561.00 210,375.00 Total Component Units 2,593,561.00 210,375.00
General Revenues: Taxes:
Property Taxes, Levied for Operational Purposes Property Taxes, Levied for Debt Service Property Taxes, Levied for Capital Projects Local Sales Taxes
Grants and Contributions Not Restricted to Specific Programs Investment Earnings Miscellaneous Special Items Extraordinary Items Transfers Total General Revenues, Special Items, Extraordinary Items and Transfers Change in Net Position Net Position, July 1, 2015 Adjustments to Net Position Net Position, June 30, 2016
The notes to financial statements are an integral part of this statement. ESE 145

Exhibit B-2 Page 3
Program Revenues Net (Expense) Revenue and Changes in Net Position Operating Grants and
Contributions
Capital Grants and
Contributions
Primary Government Component
Units Governmental
Activities Total
(105,494,377.00) (105,494,377.00) (8,566,070.00) (8,566,070.00) (1,830,146.00) (1,830,146.00) (4,338,366.00) (4,338,366.00) (2,986,950.00) (2,986,950.00)
(742,693.00) (742,693.00) (499,984.00) (499,984.00)
(1,292,744.00) (1,292,744.00) (11,166,922.00) (11,166,922.00)
877,569.00 (6,047,070.00) (6,047,070.00) (777,715.00) (777,715.00)
9,842,901.00 1,329,955.00 1,329,955.00 (1,381,340.00) (1,381,340.00) (6,841,830.00) (6,841,830.00)
(14,448,920.00) (14,448,920.00) (5,329,430.00) (5,329,430.00) (2,573,806.00) (2,573,806.00)
(6,064.00) (6,064.00) 672,208.00 (96,490,130.00) (96,490,130.00)
(10,824,298.00) (10,824,298.00) 9,842,901.00 1,549,777.00 (280,308,900.00) (280,308,900.00)
0.00 0.00 0.00
9,842,901.00 1,549,777.00 (280,308,900.00) (280,308,900.00)
0.00 19,687.00 (2,363,499.00) 0.00 19,687.00 (2,363,499.00)
46,435,418.00 46,435,418.00 0.00 0.00 0.00
12,229,002.00 12,229,002.00 0.00 3,845,976.00 3,845,976.00 0.00
120,853,413.00 120,853,413.00 129,986.00 276,542.00 276,542.00 0.00
106,702,679.00 106,702,679.00 2,255,653.00 0.00 0.00 0.00 0.00 0.00 0.00
290,343,030.00 290,343,030.00 2,385,639.00 10,034,130.00 10,034,130.00 22,140.00
197,980,855.00 197,980,855.00 398,316.00 (33,676.00) (33,676.00) 0.00
207,981,309.00 207,981,309.00 420,456.00

Exhibit C-1
Page 4
DISTRICT SCHOOL BOARD OF HERNANDO COUNTY
BALANCE SHEET
GOVERNMENTAL FUNDS
June 30, 2016
Account
Number
General
100
Other Federal
Programs
420
Other
Debt Service
290
Nonvoted Capital
Improvement Fund
370
Other
Capital Projects
390
ASSETS AND DEFERRED OUTFLOWS OF RESOURCES
ASSETS
Cash and Cash Equivalents 1110 4,721,493.00 0.00 9,361,146.00 6,853,612.00 4,645,946.00
Investments 1160 4,110,946.00 0.00 4,542,907.00 5,333,969.00 311,547.00
Taxes Receivable, Net 1120 0.00 0.00 0.00 0.00 0.00
Accounts Receivable, Net 1131 110,185.00 0.00 0.00 0.00 0.00
Interest Receivable on Investments 1170 0.00 0.00 0.00 0.00 0.00
Due From Other Agencies 1220 256,046.00 561,152.00 0.00 7,984.00 799,791.00
Due From Budgetary Funds 1141 459,398.00 0.00 0.00 0.00 0.00
Due From Insurer 1180 0.00 0.00 0.00 0.00 0.00
Deposits Receivable 1210 0.00 0.00 0.00 0.00 0.00
Due From Internal Funds 1142 0.00 0.00 0.00 0.00 0.00
Cash with Fiscal/Service Agents 1114 0.00 0.00 0.00 0.00 0.00
Inventory 1150 1,570,675.00 0.00 0.00 0.00 0.00
Prepaid Items 1230 2,096.00 0.00 0.00 0.00 0.00
Long-Term Investments 1460 0.00 0.00 0.00 0.00 0.00
Total Assets 11,230,839.00 561,152.00 13,904,053.00 12,195,565.00 5,757,284.00
DEFERRED OUTFLOWS OF RESOURCES
Accumulated Decrease in Fair Value of Hedging Derivatives 1910 0.00 0.00 0.00 0.00 0.00
Total Deferred Outflows of Resources 0.00 0.00 0.00 0.00 0.00
Total Assets and Deferred Outflows of Resources 11,230,839.00 561,152.00 13,904,053.00 12,195,565.00 5,757,284.00
LIABILITIES, DEFERRED INFLOWS OF RESOURCES
AND FUND BALANCES
LIABILITIES
Cash Overdraft 2125 0.00 0.00 0.00 0.00 0.00
Accrued Salaries and Benefits 2110 0.00 0.00 0.00 0.00 0.00
Payroll Deductions and Withholdings 2170 0.00 0.00 0.00 0.00 0.00
Accounts Payable 2120 1,188,086.00 101,754.00 0.00 120,285.00 477,693.00
Due to Internal Accounts 346.00 0.00 0.00 0.00 0.00
Sales Tax Payable 2260 628.00 0.00 0.00 0.00 0.00
Current Notes Payable 2250 0.00 0.00 0.00 0.00 0.00
Accrued Interest Payable 2210 0.00 0.00 0.00 0.00 0.00
Deposits Payable 2220 3,284.00 0.00 0.00 0.00 0.00
Due to Other Agencies 2230 2,923.00 0.00 0.00 0.00 0.00
Due to Budgetary Funds 2161 0.00 459,398.00 0.00 0.00 0.00
Due to Internal Funds 2162 0.00 0.00 0.00 0.00 0.00
Due to Fiscal Agent 2240 0.00 0.00 0.00 0.00 0.00
Pension Liability 2115 0.00 0.00 0.00 0.00 0.00
Other Postemployment Benefits Liability 2116 0.00 0.00 0.00 0.00 0.00
Judgments Payable 2130 0.00 0.00 0.00 0.00 0.00
Construction Contracts Payable 2140 0.00 0.00 0.00 0.00 0.00
Construction Contracts Payable - Retained Percentage 2150 0.00 0.00 0.00 0.00 0.00
Matured Bonds Payable 2180 0.00 0.00 0.00 0.00 0.00
Matured Interest Payable 2190 0.00 0.00 0.00 0.00 0.00
Unearned Revenue 2410 0.00 0.00 0.00 0.00 0.00
Unavailable Revenue 2410 0.00 0.00 0.00 0.00 0.00
Total Liabilities 1,195,267.00 561,152.00 0.00 120,285.00 477,693.00
DEFERRED INFLOWS OF RESOURCES
Accumulated Increase in Fair Value of Hedging Derivatives 2610 0.00 0.00 0.00 0.00 0.00
Deferred Revenues 2630 0.00 0.00 0.00 0.00 774,084.00
Total Deferred Inflows of Resources 0.00 0.00 0.00 0.00 774,084.00
FUND BALANCES
Nonspendable:
Inventory 2711 1,570,675.00 0.00 0.00 0.00 0.00
Prepaid Amounts 2712 0.00 0.00 0.00 0.00 0.00
Permanent Fund Principal 2713 0.00 0.00 0.00 0.00 0.00
Other Not in Spendable Form 2719 0.00 0.00 0.00 0.00 0.00
Total Nonspendable Fund Balances 2710 1,570,675.00 0.00 0.00 0.00 0.00
Restricted for:
Economic Stabilization 2721 0.00 0.00 0.00 0.00 0.00
Federal Required Carryover Programs 2722 0.00 0.00 0.00 0.00 0.00
State Required Carryover Programs 2723 360,128.00 0.00 0.00 0.00 0.00
Local Sales Tax and Other Tax Levy 2724 0.00 0.00 0.00 0.00 0.00
Debt Service 2725 0.00 0.00 13,904,053.00 0.00 0.00
Capital Projects 2726 0.00 0.00 0.00 12,075,280.00 4,505,507.00
Restricted for Workforce Development 2729 606,051.00 0.00 0.00 0.00 0.00
Restricted for Food Service 2729 0.00 0.00 0.00 0.00 0.00
Total Restricted Fund Balances 2720 966,179.00 0.00 13,904,053.00 12,075,280.00 4,505,507.00
Committed to:
Economic Stabilization 2731 0.00 0.00 0.00 0.00 0.00
Contractual Agreements 2732 0.00 0.00 0.00 0.00 0.00
Committed for ________________ 2739 0.00 0.00 0.00 0.00 0.00
Committed for ________________ 2739 0.00 0.00 0.00 0.00 0.00
Total Committed Fund Balances 2730 0.00 0.00 0.00 0.00 0.00
Assigned to:
Special Revenue 2741 0.00 0.00 0.00 0.00 0.00
Debt Service 2742 0.00 0.00 0.00 0.00 0.00
Capital Projects 2743 0.00 0.00 0.00 0.00 0.00
Permanent Fund 2744 0.00 0.00 0.00 0.00 0.00
Assigned for Health Insurance 2749 771,291.00 0.00 0.00 0.00 0.00
Assigned for Encumbrances 2749 152,272.00 0.00 0.00 0.00 0.00
Total Assigned Fund Balances 2740 923,563.00 0.00 0.00 0.00 0.00
Total Unassigned Fund Balances 2750 6,575,155.00 0.00 0.00 0.00 0.00
Total Fund Balances 2700 10,035,572.00 0.00 13,904,053.00 12,075,280.00 4,505,507.00
Total Liabilities, Deferred Inflows of
Resources and Fund Balances 11,230,839.00 561,152.00 13,904,053.00 12,195,565.00 5,757,284.00
The notes to financial statements are an integral part of this statement.
ESE 145

Exhibit C-1
Page 4
DISTRICT SCHOOL BOARD OF HERNANDO COUNTY
BALANCE SHEET
GOVERNMENTAL FUNDS
June 30, 2016
ASSETS AND DEFERRED OUTFLOWS OF RESOURCES
ASSETS
Cash and Cash Equivalents
Investments
Taxes Receivable, Net
Accounts Receivable, Net
Interest Receivable on Investments
Due From Other Agencies
Due From Budgetary Funds
Due From Insurer
Deposits Receivable
Due From Internal Funds
Cash with Fiscal/Service Agents
Inventory
Prepaid Items
Long-Term Investments
Total Assets
DEFERRED OUTFLOWS OF RESOURCES
Accumulated Decrease in Fair Value of Hedging Derivatives
Total Deferred Outflows of Resources
Total Assets and Deferred Outflows of Resources
LIABILITIES, DEFERRED INFLOWS OF RESOURCES
AND FUND BALANCES
LIABILITIES
Cash Overdraft
Accrued Salaries and Benefits
Payroll Deductions and Withholdings
Accounts Payable
Due to Internal Accounts
Sales Tax Payable
Current Notes Payable
Accrued Interest Payable
Deposits Payable
Due to Other Agencies
Due to Budgetary Funds
Due to Internal Funds
Due to Fiscal Agent
Pension Liability
Other Postemployment Benefits Liability
Judgments Payable
Construction Contracts Payable
Construction Contracts Payable - Retained Percentage
Matured Bonds Payable
Matured Interest Payable
Unearned Revenue
Unavailable Revenue
Total Liabilities
DEFERRED INFLOWS OF RESOURCES
Accumulated Increase in Fair Value of Hedging Derivatives
Deferred Revenues
Total Deferred Inflows of Resources
1110
1160
1120
1131
1170
1220
1141
1180
1210
1142
1114
1150
1230
1460
1910
2125
2110
2170
2120
2260
2250
2210
2220
2230
2161
2162
2240
2115
2116
2130
2140
2150
2180
2190
2410
2410
2610
2630
Account
Number
Other
Governmental
Funds
Total
Governmental
Funds
4,871,595.00 30,453,792.00
120,700.00 14,420,069.00
0.00 0.00
2,753.00 112,938.00
0.00 0.00
7,603.00 1,632,576.00
0.00 459,398.00
0.00 0.00
0.00 0.00
0.00 0.00
0.00 0.00
132,059.00 1,702,734.00
0.00 2,096.00
0.00 0.00
5,134,710.00 48,783,603.00
0.00 0.00
0.00 0.00
5,134,710.00 48,783,603.00
0.00 0.00
0.00 0.00
0.00 0.00
178,820.00 2,066,638.00
0.00 346.00
0.00 628.00
0.00 0.00
29,167.00 29,167.00
0.00 3,284.00
0.00 2,923.00
0.00 459,398.00
0.00 0.00
0.00 0.00
0.00 0.00
0.00 0.00
0.00 0.00
0.00 0.00
0.00 0.00
0.00 0.00
0.00 0.00
0.00 0.00
0.00 0.00
207,987.00 2,562,384.00
0.00 0.00
155,146.00 929,230.00
155,146.00 929,230.00
FUND BALANCES
Nonspendable:
Inventory 2711 132,059.00 1,702,734.00
Prepaid Amounts 2712 0.00 0.00
Permanent Fund Principal 2713 0.00 0.00
Other Not in Spendable Form 2719 0.00 0.00
Total Nonspendable Fund Balances 2710 132,059.00 1,702,734.00
Restricted for:
Economic Stabilization 2721 0.00 0.00
Federal Required Carryover Programs 2722 0.00 0.00
State Required Carryover Programs 2723 0.00 360,128.00
Local Sales Tax and Other Tax Levy 2724 0.00 0.00
Debt Service 2725 371,250.00 14,275,303.00
Capital Projects 2726 467,699.00 17,048,486.00
Restricted for Workforce Development 2729 0.00 606,051.00
Restricted for Food Service 2729 3,800,569.00 3,800,569.00
Total Restricted Fund Balances 2720 4,639,518.00 36,090,537.00
Committed to:
Economic Stabilization 2731 0.00 0.00
Contractual Agreements 2732 0.00 0.00
Committed for ________________ 2739 0.00 0.00
Committed for ________________ 2739 0.00 0.00
Total Committed Fund Balances 2730 0.00 0.00
Assigned to:
Special Revenue 2741 0.00 0.00
Debt Service 2742 0.00 0.00
Capital Projects 2743 0.00 0.00
Permanent Fund 2744 0.00 0.00
Assigned for Health Insurance 2749 0.00 771,291.00
Assigned for Encumbrances 2749 0.00 152,272.00
Total Assigned Fund Balances 2740 0.00 923,563.00
Total Unassigned Fund Balances 2750 0.00 6,575,155.00
Total Fund Balances 2700 4,771,577.00 45,291,989.00
Total Liabilities, Deferred Inflows of
Resources and Fund Balances 5,134,710.00 48,783,603.00
The notes to financial statements are an integral part of this statement.
ESE 145

(THIS PAGE LEFT INTENTIONALLY BLANK)

Exhibit C-2 Page 5
DISTRICT SCHOOL BOARD OF HERNANDO COUNTY RECONCILIATION OF THE GOVERNMENTAL FUNDS BALANCE SHEET TO THE GOVERNMENT-WIDE STATEMENT OF NET POSITION For the Fiscal Year Ended June 30, 2016
Total Fund Balances - Governmental Funds
Amounts reported for governmental activities in the statement of net position are different because:
Capital assets, net of accumulated depreciation, used in governmental activities are not financial resources and, therefore, are not reported as assets in the governmental funds.
Nondepreciable Capital Assets Depreciable Capital Assets
Capital credits to be received in future years are not available to liquidate liabilities in governmental funds, but are accrued in the government-wide statements.
Deferred Outflows and Inflows of Resources are not available in the current period and, therefore, are not reported in the governmental funds. Deferred Outflows and Inflows of Resources at year-end consist of:
Deferred Outflows of Resources Deferred Inflows of Resources
Long-term liabilities are not due and payable in the current period and, therefore, are not reported as liabilities in the governmental funds. Long-term liabilities at year-end consist of:
Bonds Payable Lease-Purchase Agreements Payable Note Payable Other Postemployment Benefits Payable Net Pension Liability Compensated Absences Payable
10,317,174361,521,310
16,530,989(10,245,290)
5,510,266111,958,041
4,860,2559,883,288
73,668,89113,489,203
$ 45,291,989
371,838,484
3,935,081
6,285,699
(219,369,944)
Total Net Position - Governmental Activities $ 207,981,309
The notes to financial statements are an integral part of this statement. ESE 145

Exhibit C-3
Page 6
DISTRICT SCHOOL BOARD OF HERNANDO COUNTY
STATEMENT OF REVENUES, EXPENDITURES AND CHANGES IN
FUND BALANCES - GOVERNMENTAL FUNDS
For the Fiscal Year Ended June 30, 2016
Account
Number
General
100
Other Federal
Programs
420
Other
Debt Service
290
REVENUES
Federal Direct 3100 212,975.00 0.00 0.00
Federal Through State and Local 3200 663,611.00 11,833,607.00 0.00
State Sources 3300 107,865,117.00 0.00 0.00
Local Sources:
Property Taxes Levied, Tax Redemptions and Excess Fees for
Operational Purposes
3411, 3421,
3423 46,435,418.00 0.00 0.00
Property Taxes Levied, Tax Redemptions and Excess Fees for Debt
Service
3412, 3421,
3423 0.00 0.00 0.00
Property Taxes Levied, Tax Redemptions and Excess Fees for
Capital Projects
3413, 3421,
3423 0.00 0.00 0.00
Local Sales Taxes 3418, 3419 0.00 0.00 0.00
Charges for Service - Food Service 345X 0.00 0.00 0.00
Impact Fees 3496 0.00 0.00 0.00
Other Local Revenue 4,192,429.00 0.00 (41.00)
Total Local Sources 3400 50,627,847.00 0.00 (41.00)
Total Revenues 159,369,550.00 11,833,607.00 (41.00)
EXPENDITURES
Current:
Instruction 5000 103,110,541.00 3,427,412.00 0.00
Student Support Services 6100 6,504,626.00 2,142,638.00 0.00
Instructional Media Services 6200 1,848,730.00 0.00 0.00
Instruction and Curriculum Development Services 6300 1,561,452.00 2,822,817.00 0.00
Instructional Staff Training Services 6400 692,982.00 2,326,297.00 0.00
Instruction-Related Technology 6500 217,375.00 529,516.00 0.00
Board 7100 505,584.00 0.00 0.00
General Administration 7200 873,493.00 435,330.00 0.00
School Administration 7300 11,266,677.00 0.00 0.00
Facilities Acquisition and Construction 7410 317,215.00 0.00 0.00
Fiscal Services 7500 785,054.00 0.00 0.00
Food Services 7600 557.00 0.00 0.00
Central Services 7700 1,393,002.00 0.00 0.00
Student Transportation Services 7800 7,003,616.00 36,492.00 0.00
Operation of Plant 7900 14,607,003.00 0.00 0.00
Maintenance of Plant 8100 5,379,915.00 0.00 0.00
Administrative Technology Services 8200 2,602,849.00 0.00 0.00
Community Services 9100 6,159.00 0.00 0.00
Debt Service: (Function 9200)
Redemption of Principal 710 0.00 0.00 3,974,318.00
Interest 720 0.00 0.00 3,263,742.00
Dues and Fees 730 0.00 0.00 785,696.00
Miscellaneous 790 0.00 0.00 101,664,652.00
Capital Outlay:
Facilities Acquisition and Construction 7420 126,925.00 870.00 0.00
Other Capital Outlay 9300 400,858.00 112,235.00 0.00
Total Expenditures 159,204,613.00 11,833,607.00 109,688,408.00
Excess (Deficiency) of Revenues Over (Under) Expenditures 164,937.00 0.00 (109,688,449.00)
OTHER FINANCING SOURCES (USES)
Issuance of Bonds 3710 0.00 0.00 0.00
Premium on Sale of Bonds 3791 0.00 0.00 0.00
Discount on Sale of Bonds 891 0.00 0.00 0.00
Proceeds of Lease-Purchase Agreements 3750 0.00 0.00 0.00
Premium on Lease-Purchase Agreements 3793 0.00 0.00 0.00
Discount on Lease-Purchase Agreements 893 0.00 0.00 0.00
Loans 3720 0.00 0.00 0.00
Sale of Capital Assets 3730 0.00 0.00 0.00
Loss Recoveries 3740 59,145.00 0.00 0.00
Proceeds of Forward Supply Contract 3760 0.00 0.00 0.00
Proceeds from Special Facility Construction Account 3770 0.00 0.00 0.00
Face Value of Refunding Bonds 3715 0.00 0.00 102,198,598.00
Premium on Refunding Bonds 3792 0.00 0.00 0.00
Discount on Refunding Bonds 892 0.00 0.00 0.00
Refunding Lease-Purchase Agreements 3755 0.00 0.00 0.00
Premium on Refunding Lease-Purchase Agreements 3794 0.00 0.00 0.00
Discount on Refunding Lease-Purchase Agreements 894 0.00 0.00 0.00
Payments to Refunding Escrow Agent (Function 9299) 760 0.00 0.00 0.00
Transfers In 3600 5,068,054.00 0.00 19,544,893.00
Transfers Out 9700 (1,655,417.00) 0.00 (364,141.00)
Total Other Financing Sources (Uses) 3,471,782.00 0.00 121,379,350.00
SPECIAL ITEMS
__________________________________________ 0.00 0.00 0.00
EXTRAORDINARY ITEMS
__________________________________________ 0.00 0.00 0.00
Net Change in Fund Balances 3,636,719.00 0.00 11,690,901.00
Fund Balances, July 1, 2015 2800 6,402,667.00 0.00 2,213,152.00
Adjustments to Fund Balances 2891 (3,814.00) 0.00 0.00
Fund Balances, June 30, 2016 2700 10,035,572.00 0.00 13,904,053.00
The notes to financial statements are an integral part of this statement.
ESE 145

__________________________________________
__________________________________________
Exhibit C-3
Page 6
DISTRICT SCHOOL BOARD OF HERNANDO COUNTY
STATEMENT OF REVENUES, EXPENDITURES AND CHANGES IN
FUND BALANCES - GOVERNMENTAL FUNDS
For the Fiscal Year Ended June 30, 2016
REVENUES
Federal Direct
Federal Through State and Local
State Sources
Local Sources:
Property Taxes Levied, Tax Redemptions and Excess Fees for
Operational Purposes
Property Taxes Levied, Tax Redemptions and Excess Fees for Debt
Service
Property Taxes Levied, Tax Redemptions and Excess Fees for
Capital Projects
Local Sales Taxes
Charges for Service - Food Service
Impact Fees
Other Local Revenue
Total Local Sources
Total Revenues
EXPENDITURES
Current:
Instruction Student Support Services Instructional Media Services Instruction and Curriculum Development Services Instructional Staff Training Services Instruction-Related Technology Board General Administration School Administration Facilities Acquisition and Construction Fiscal Services Food Services Central Services Student Transportation Services Operation of Plant Maintenance of Plant Administrative Technology Services Community Services
Debt Service: (Function 9200)
Redemption of Principal Interest Dues and Fees Miscellaneous
Capital Outlay:
Facilities Acquisition and Construction Other Capital Outlay
Total Expenditures
Excess (Deficiency) of Revenues Over (Under) Expenditures
OTHER FINANCING SOURCES (USES)
Issuance of Bonds
Premium on Sale of Bonds
Discount on Sale of Bonds
Proceeds of Lease-Purchase Agreements
Premium on Lease-Purchase Agreements
Discount on Lease-Purchase Agreements
Loans
Sale of Capital Assets
Loss Recoveries
Proceeds of Forward Supply Contract
Proceeds from Special Facility Construction Account
Face Value of Refunding Bonds
Premium on Refunding Bonds Discount on Refunding Bonds
Refunding Lease-Purchase Agreements
Premium on Refunding Lease-Purchase Agreements
Discount on Refunding Lease-Purchase Agreements
Payments to Refunding Escrow Agent (Function 9299)
Transfers In
Transfers Out
Total Other Financing Sources (Uses)
SPECIAL ITEMS
EXTRAORDINARY ITEMS
Net Change in Fund Balances
Fund Balances, July 1, 2015
Adjustments to Fund Balances
Fund Balances, June 30, 2016
Account
Number
3100
3200
3300
3411, 3421, 3423
3412, 3421, 3423
3413, 3421, 3423
3418, 3419 345X 3496
3400
5000
6100
6200
6300
6400
6500
7100
7200
7300
7410
7500
7600
7700
7800
7900
8100
8200
9100
710
720
730
790
7420
9300
3710
3791
891
3750
3793
893
3720
3730
3740
3760
3770
3715
3792
892
3755
3794
894
760
3600
9700
2800 2891 2700
Nonvoted Capital
Improvement Fund
370
Other
Capital Projects
390
Other
Governmental
Funds
Total
Governmental
Funds
0.00 0.00 0.00 212,975.00
0.00 0.00 9,706,267.00 22,203,485.00
0.00 61,819.00 1,902,695.00 109,829,631.00
0.00 0.00 0.00 46,435,418.00
0.00 0.00 0.00 0.00
12,229,002.00 0.00 0.00 12,229,002.00
0.00 3,845,976.00 0.00 3,845,976.00
0.00 0.00 1,823,798.00 1,823,798.00
0.00 0.00 0.00 0.00
38,941.00 346,375.00 30,273.00 4,607,977.00
12,267,943.00 4,192,351.00 1,854,071.00 68,942,171.00
12,267,943.00 4,254,170.00 13,463,033.00 201,188,262.00
0.00 0.00 0.00 106,537,953.00
0.00 0.00 0.00 8,647,264.00
0.00 0.00 0.00 1,848,730.00
0.00 0.00 0.00 4,384,269.00
0.00 0.00 0.00 3,019,279.00
0.00 0.00 0.00 746,891.00
0.00 0.00 0.00 505,584.00
0.00 0.00 0.00 1,308,823.00
0.00 0.00 0.00 11,266,677.00
6,139,621.00 176,104.00 396,324.00 7,029,264.00
0.00 0.00 0.00 785,054.00
0.00 0.00 10,447,012.00 10,447,569.00
0.00 0.00 0.00 1,393,002.00
0.00 0.00 0.00 7,040,108.00
0.00 0.00 0.00 14,607,003.00
0.00 0.00 0.00 5,379,915.00
0.00 0.00 0.00 2,602,849.00
0.00 0.00 0.00 6,159.00
0.00 0.00 617,000.00 4,591,318.00
0.00 0.00 278,154.00 3,541,896.00
0.00 0.00 784.00 786,480.00
0.00 0.00 632.00 101,665,284.00
51,577.00 578,667.00 327,094.00 1,085,133.00
29,013.00 0.00 201,146.00 743,252.00
6,220,211.00 754,771.00 12,268,146.00 299,969,756.00
6,047,732.00 3,499,399.00 1,194,887.00 (98,781,494.00)
0.00 0.00 0.00 0.00
0.00 0.00 0.00 0.00
0.00 0.00 0.00 0.00
0.00 0.00 0.00 0.00
0.00 0.00 0.00 0.00
0.00 0.00 0.00 0.00
0.00 0.00 0.00 0.00
0.00 0.00 0.00 0.00
0.00 0.00 0.00 59,145.00
0.00 0.00 0.00 0.00
0.00 0.00 0.00 0.00
0.00 0.00 0.00 102,198,598.00
0.00 0.00 0.00 0.00
0.00 0.00 0.00 0.00
0.00 0.00 0.00 0.00
0.00 0.00 0.00 0.00
0.00 0.00 0.00 0.00
0.00 0.00 0.00 0.00
252,340.00 0.00 55,888.00 24,921,175.00
(5,068,054.00) (17,833,563.00) 0.00 (24,921,175.00)
(4,815,714.00) (17,833,563.00) 55,888.00 102,257,743.00
0.00 0.00 0.00 0.00
0.00 0.00 0.00 0.00
1,232,018.00 (14,334,164.00) 1,250,775.00 3,476,249.00
10,843,262.00 18,799,425.00 3,518,382.00 41,776,888.00
0.00 40,246.00 2,420.00 38,852.00
12,075,280.00 4,505,507.00 4,771,577.00 45,291,989.00
The notes to financial statements are an integral part of this statement.
ESE 145

(THIS PAGE LEFT INTENTIONALLY BLANK)

Exhibit C-4 Page 7
DISTRICT SCHOOL BOARD OF HERNANDO COUNTY RECONCILIATION OF THE STATEMENT OF REVENUES, EXPENDITURES AND CHANGES IN FUND BALANCES OF GOVERNMENTAL FUNDS TO THE GOVERNMENT-WIDE STATEMENT OF ACTIVITIES For the Fiscal Year Ended June 30, 2016
Net Change in Fund Balances - Governmental Funds $ 3,476,249
Amounts reported for governmental activities in the statement of activities are different because:
Governmental funds report capital outlays as expenditures; however, in the statement of activities, the cost of those assets is allocated over their estimated useful lives as a depreciation expense. This is the amount of depreciation expense in excess of capital outlays in the current period.
Capital Outlay-Facilities and Construction-Governmental Funds Capital Outlay-Other Capital Outlay-Governmental Funds Less: Depreciation Expense
1,085,133743,252
(10,839,782) (9,011,397)
Long-term debt proceeds provide current financial resources to the governmental funds, but issuing debt increases long-term liabilities in the statement of net assets. Repayment of long-term debt is an expenditure in the governmental funds, but the repayment reduces long-term liabilities in the statement of net assets. This is the amount by which repayments exceeded proceeds in the current period.
Lease Purchase Agreement Proceeds Lease Purchase Agreement Refunded Debt Repayments
(90,645,000) 102,198,598
1,604,881 13,158,479
Premiums are reported in the governmental funds in the year debt is issued, but are capitalized and amortized over the life of the debt in the statement of activities.
Unamortized Premium: Prior year Less: Current Year
1,244,961(848,639)
$ 396,322
The net decrease in net pension liability and deferred outflows and inflows is reported in the statement of activities but not in the fund statements. 1,938,599
Capital credits to be received in future years are accrued in the government-wide statemetns, but the credits do not provide current financial resources and are not recognized in the governmental funds.
Current Year Accruals Less: Prior Year Net Increase in Capital Credits Receivable
3,935,081(3,705,645)
$ 229,436
In the statement of activities, the cost of compensated absences is measured by the amounts earned during the year, while in the governmental funds expenditures are recognized based on the amounts actually paid for compensated absences. This is the net amount of compensated absences used in excess of the amount earned in the current period. $ 954,391
Other postemployment benefits costs are recorded in the governmental funds under the pay-as-you-go method, but under the full accrual method in the government-wide statements. This is the net increase in the other postemployment benefits liability for the current period. (1,107,949)
Change in Net Position of Governmental Activities 10,034,130
The notes to financial statements are an integral part of this statement. ESE 145

Exhibit C-5 Page 8
DISTRICT SCHOOL BOARD OF HERNANDO COUNTY STATEMENT OF NET POSITION PROPRIETARY FUNDS June 30, 2016
Account Number
Business-Type Activities - Enterprise Funds Self-Insurance
Consortium 911
Self-Insurance Consortium
912
Self-Insurance Consortium
913
Self-Insurance Consortium
914 ASSETS
Cash and Cash Equivalents 1110 0.00 0.00 0.00 0.00 Investments 1160 0.00 0.00 0.00 0.00 Accounts Receivable, Net 1131 0.00 0.00 0.00 0.00 Interest Receivable on Investments 1170 0.00 0.00 0.00 0.00 Due From Other Agencies 1220 0.00 0.00 0.00 0.00 Due From Insurer 1180 0.00 0.00 0.00 0.00 Due From Budgetary Funds 1141 0.00 0.00 0.00 0.00 Deposits Receivable 1210 0.00 0.00 0.00 0.00 Cash with Fiscal/Service Agents 1114 0.00 0.00 0.00 0.00 Section 1011.13, F.S., Loan Proceeds 1420 0.00 0.00 0.00 0.00 Inventory 1150 0.00 0.00 0.00 0.00 Prepaid Items 1230 0.00 0.00 0.00 0.00 Long-Term Investments 1460 0.00 0.00 0.00 0.00 Prepaid Insurance Costs 1430 0.00 0.00 0.00 0.00 Other Postemployment Benefits Asset 1410 0.00 0.00 0.00 0.00 Pension Asset 1415 0.00 0.00 0.00 0.00
Capital Assets: Land 1310 0.00 0.00 0.00 0.00 Land Improvements - Nondepreciable 1315 0.00 0.00 0.00 0.00 Construction in Progress 1360 0.00 0.00 0.00 0.00
Nondepreciable Capital Assets 0.00 0.00 0.00 0.00 Improvements Other Than Buildings 1320 0.00 0.00 0.00 0.00
Accumulated Depreciation 1329 0.00 0.00 0.00 0.00 Buildings and Fixed Equipment 1330 0.00 0.00 0.00 0.00
Accumulated Depreciation 1339 0.00 0.00 0.00 0.00 Furniture, Fixtures and Equipment 1340 0.00 0.00 0.00 0.00
Accumulated Depreciation 1349 0.00 0.00 0.00 0.00 Motor Vehicles 1350 0.00 0.00 0.00 0.00
Accumulated Depreciation 1359 0.00 0.00 0.00 0.00 Property Under Capital Leases 1370 0.00 0.00 0.00 0.00
Accumulated Depreciation 1379 0.00 0.00 0.00 0.00 Computer Software 1382 0.00 0.00 0.00 0.00
Accumulated Amortization 1389 0.00 0.00 0.00 0.00 Depreciable Capital Assets, Net 0.00 0.00 0.00 0.00
Total Capital Assets 0.00 0.00 0.00 0.00 Total Assets 0.00 0.00 0.00 0.00 DEFERRED OUTFLOWS OF RESOURCES Accumulated Decrease in Fair Value of Hedging Derivatives 1910 0.00 0.00 0.00 0.00 Net Carrying Amount of Debt Refunding 1920 0.00 0.00 0.00 0.00 Pension 1940 0.00 0.00 0.00 0.00 Other Postemployment Benefits 1950 0.00 0.00 0.00 0.00 Total Deferred Outflows of Resources 0.00 0.00 0.00 0.00 LIABILITIES
Cash Overdraft 2125 0.00 0.00 0.00 0.00 Accrued Salaries and Benefits 2110 0.00 0.00 0.00 0.00 Payroll Deductions and Withholdings 2170 0.00 0.00 0.00 0.00 Accounts Payable 2120 0.00 0.00 0.00 0.00 Sales Tax Payable 2260 0.00 0.00 0.00 0.00 Accrued Interest Payable 2210 0.00 0.00 0.00 0.00 Deposits Payable 2220 0.00 0.00 0.00 0.00 Due to Other Agencies 2230 0.00 0.00 0.00 0.00 Due to Budgetary Funds 2161 0.00 0.00 0.00 0.00 Pension Liability 2115 0.00 0.00 0.00 0.00 Other Postemployment Benefits Liability 2116 0.00 0.00 0.00 0.00 Judgments Payable 2130 0.00 0.00 0.00 0.00 Estimated Unpaid Claims - Self-Insurance Program 2271 0.00 0.00 0.00 0.00 Estimated Liability for Claims Adjustment 2272 0.00 0.00 0.00 0.00 Unearned Revenues 2410 0.00 0.00 0.00 0.00
Noncurrent Liabilities Portion Due Within One Year:
Obligations Under Capital Leases 2315 0.00 0.00 0.00 0.00 Liability for Compensated Absences 2330 0.00 0.00 0.00 0.00 Estimated Liability for Long-Term Claims 2350 0.00 0.00 0.00 0.00 Net Other Postemployment Benefits Obligation 2360 0.00 0.00 0.00 0.00 Net Pension Liability 2365 0.00 0.00 0.00 0.00 Other Long-Term Liabilities 2380 0.00 0.00 0.00 0.00 Due Within One Year 0.00 0.00 0.00 0.00
Portion Due After One Year: Obligations Under Capital Leases 2315 0.00 0.00 0.00 0.00 Liability for Compensated Absences 2330 0.00 0.00 0.00 0.00 Estimated Liability for Long-Term Claims 2350 0.00 0.00 0.00 0.00 Net Other Postemployment Benefits Obligation 2360 0.00 0.00 0.00 0.00 Net Pension Liability 2365 0.00 0.00 0.00 0.00 Other Long-Term Liabilities 2380 0.00 0.00 0.00 0.00 Due in More Than One Year 0.00 0.00 0.00 0.00
Total Long-Term Liabilities 0.00 0.00 0.00 0.00 Total Liabilities 0.00 0.00 0.00 0.00 DEFERRED INFLOWS OF RESOURCES Accumulated Increase in Fair Value of Hedging Derivatives 2610 0.00 0.00 0.00 0.00 Deficit Net Carrying Amount of Debt Refunding 2620 0.00 0.00 0.00 0.00 Deferred Revenues 2630 0.00 0.00 0.00 0.00 Pension 2640 0.00 0.00 0.00 0.00 Other Postemployment Benefits 2650 0.00 0.00 0.00 0.00 Total Deferred Inflows of Resources 0.00 0.00 0.00 0.00 NET POSITION Net Investment in Capital Assets 2770 0.00 0.00 0.00 0.00 Restricted for ____________________ 2780 0.00 0.00 0.00 0.00 Unrestricted 2790 0.00 0.00 0.00 0.00 Total Net Position 0.00 0.00 0.00 0.00
The notes to financial statements are an integral part of this statement. ESE 145

Exhibit C-5 Page 8
Governmental Activities -
Internal Service Funds
ARRA Consortium
915
Other
921
Other
922
Other Enterprise
Funds Totals
0.00 0.00 0.00 0.00 0.00 0.00 0.00 0.00 0.00 0.00 0.00 0.00 0.00 0.00 0.00 0.00 0.00 0.00 0.00 0.00 0.00 0.00 0.00 0.00 0.00 0.00 0.00 0.00 0.00 0.00 0.00 0.00 0.00 0.00 0.00 0.00 0.00 0.00 0.00 0.00 0.00 0.00 0.00 0.00 0.00 0.00 0.00 0.00 0.00 0.00 0.00 0.00 0.00 0.00 0.00 0.00 0.00 0.00 0.00 0.00 0.00 0.00 0.00 0.00 0.00 0.00 0.00 0.00 0.00 0.00 0.00 0.00 0.00 0.00 0.00 0.00 0.00 0.00 0.00 0.00 0.00 0.00 0.00 0.00 0.00 0.00 0.00 0.00 0.00 0.00 0.00 0.00 0.00 0.00 0.00 0.00
0.00 0.00 0.00 0.00 0.00 0.00 0.00 0.00 0.00 0.00 0.00 0.00 0.00 0.00 0.00 0.00 0.00 0.00 0.00 0.00 0.00 0.00 0.00 0.00 0.00 0.00 0.00 0.00 0.00 0.00 0.00 0.00 0.00 0.00 0.00 0.00 0.00 0.00 0.00 0.00 0.00 0.00 0.00 0.00 0.00 0.00 0.00 0.00 0.00 0.00 0.00 0.00 0.00 0.00 0.00 0.00 0.00 0.00 0.00 0.00 0.00 0.00 0.00 0.00 0.00 0.00 0.00 0.00 0.00 0.00 0.00 0.00 0.00 0.00 0.00 0.00 0.00 0.00 0.00 0.00 0.00 0.00 0.00 0.00 0.00 0.00 0.00 0.00 0.00 0.00 0.00 0.00 0.00 0.00 0.00 0.00 0.00 0.00 0.00 0.00 0.00 0.00 0.00 0.00 0.00 0.00 0.00 0.00 0.00 0.00 0.00 0.00 0.00 0.00
0.00 0.00 0.00 0.00 0.00 0.00 0.00 0.00 0.00 0.00 0.00 0.00 0.00 0.00 0.00 0.00 0.00 0.00 0.00 0.00 0.00 0.00 0.00 0.00 0.00 0.00 0.00 0.00 0.00 0.00
0.00 0.00 0.00 0.00 0.00 0.00 0.00 0.00 0.00 0.00 0.00 0.00 0.00 0.00 0.00 0.00 0.00 0.00 0.00 0.00 0.00 0.00 0.00 0.00 0.00 0.00 0.00 0.00 0.00 0.00 0.00 0.00 0.00 0.00 0.00 0.00 0.00 0.00 0.00 0.00 0.00 0.00 0.00 0.00 0.00 0.00 0.00 0.00 0.00 0.00 0.00 0.00 0.00 0.00 0.00 0.00 0.00 0.00 0.00 0.00 0.00 0.00 0.00 0.00 0.00 0.00 0.00 0.00 0.00 0.00 0.00 0.00 0.00 0.00 0.00 0.00 0.00 0.00 0.00 0.00 0.00 0.00 0.00 0.00 0.00 0.00 0.00 0.00 0.00 0.00
0.00 0.00 0.00 0.00 0.00 0.00 0.00 0.00 0.00 0.00 0.00 0.00 0.00 0.00 0.00 0.00 0.00 0.00 0.00 0.00 0.00 0.00 0.00 0.00 0.00 0.00 0.00 0.00 0.00 0.00 0.00 0.00 0.00 0.00 0.00 0.00 0.00 0.00 0.00 0.00 0.00 0.00
0.00 0.00 0.00 0.00 0.00 0.00 0.00 0.00 0.00 0.00 0.00 0.00 0.00 0.00 0.00 0.00 0.00 0.00 0.00 0.00 0.00 0.00 0.00 0.00 0.00 0.00 0.00 0.00 0.00 0.00 0.00 0.00 0.00 0.00 0.00 0.00 0.00 0.00 0.00 0.00 0.00 0.00 0.00 0.00 0.00 0.00 0.00 0.00 0.00 0.00 0.00 0.00 0.00 0.00
0.00 0.00 0.00 0.00 0.00 0.00 0.00 0.00 0.00 0.00 0.00 0.00 0.00 0.00 0.00 0.00 0.00 0.00 0.00 0.00 0.00 0.00 0.00 0.00 0.00 0.00 0.00 0.00 0.00 0.00 0.00 0.00 0.00 0.00 0.00 0.00
0.00 0.00 0.00 0.00 0.00 0.00 0.00 0.00 0.00 0.00 0.00 0.00 0.00 0.00 0.00 0.00 0.00 0.00 0.00 0.00 0.00 0.00 0.00 0.00

Exhibit C-6 Page 9
DISTRICT SCHOOL BOARD OF HERNANDO COUNTY STATEMENT OF REVENUES, EXPENSES AND CHANGES IN FUND NET POSITION PROPRIETARY FUNDS For the Fiscal Year Ended June 30, 2016
Account Number
Business-Type Activities - Enterprise Funds Self-Insurance
Consortium 911
Self-Insurance Consortium
912
Self-Insurance Consortium
913
Self-Insurance Consortium
914 OPERATING REVENUES Charges for Services 3481 0.00 0.00 0.00 0.00 Charges for Sales 3482 0.00 0.00 0.00 0.00 Premium Revenue 3484 0.00 0.00 0.00 0.00 Other Operating Revenues 3489 0.00 0.00 0.00 0.00 Total Operating Revenues 0.00 0.00 0.00 0.00 OPERATING EXPENSES Salaries 100 0.00 0.00 0.00 0.00 Employee Benefits 200 0.00 0.00 0.00 0.00 Purchased Services 300 0.00 0.00 0.00 0.00 Energy Services 400 0.00 0.00 0.00 0.00 Materials and Supplies 500 0.00 0.00 0.00 0.00 Capital Outlay 600 0.00 0.00 0.00 0.00 Other 700 0.00 0.00 0.00 0.00 Depreciation and Amortization Expense 780 0.00 0.00 0.00 0.00 Total Operating Expenses 0.00 0.00 0.00 0.00 Operating Income (Loss) 0.00 0.00 0.00 0.00 NONOPERATING REVENUES (EXPENSES) Investment Income 3430 0.00 0.00 0.00 0.00 Gifts, Grants and Bequests 3440 0.00 0.00 0.00 0.00 Other Miscellaneous Local Sources 3495 0.00 0.00 0.00 0.00 Loss Recoveries 3740 0.00 0.00 0.00 0.00 Gain on Disposition of Assets 3780 0.00 0.00 0.00 0.00 Interest 720 0.00 0.00 0.00 0.00 Miscellaneous 790 0.00 0.00 0.00 0.00 Loss on Disposition of Assets 810 0.00 0.00 0.00 0.00 Total Nonoperating Revenues (Expenses) 0.00 0.00 0.00 0.00 Income (Loss) Before Operating Transfers 0.00 0.00 0.00 0.00 Transfers In 3600 0.00 0.00 0.00 0.00 Transfers Out 9700 0.00 0.00 0.00 0.00 SPECIAL ITEMS ___________________________________________ 0.00 0.00 0.00 0.00 EXTRAORDINARY ITEMS ___________________________________________ 0.00 0.00 0.00 0.00 Change In Net Position 0.00 0.00 0.00 0.00 Net Position, July 1, 2015 2880 0.00 0.00 0.00 0.00 Adjustments to Net Position 2896 0.00 0.00 0.00 0.00 Net Position, June 30, 2016 2780 0.00 0.00 0.00 0.00
The notes to financial statements are an integral part of this statement. ESE 145

Exhibit C-6 Page 9
Governmental Activities -
Internal Service Funds
ARRA Consortium
915 Other 921
Other 922
Other Enterprise
Funds Totals
0.00 0.00 0.00 0.00 0.00 0.00 0.00 0.00 0.00 0.00 0.00 0.00 0.00 0.00 0.00 0.00 0.00 0.00 0.00 0.00 0.00 0.00 0.00 0.00 0.00 0.00 0.00 0.00 0.00 0.00
0.00 0.00 0.00 0.00 0.00 0.00 0.00 0.00 0.00 0.00 0.00 0.00 0.00 0.00 0.00 0.00 0.00 0.00 0.00 0.00 0.00 0.00 0.00 0.00 0.00 0.00 0.00 0.00 0.00 0.00 0.00 0.00 0.00 0.00 0.00 0.00 0.00 0.00 0.00 0.00 0.00 0.00 0.00 0.00 0.00 0.00 0.00 0.00 0.00 0.00 0.00 0.00 0.00 0.00 0.00 0.00 0.00 0.00 0.00 0.00
0.00 0.00 0.00 0.00 0.00 0.00 0.00 0.00 0.00 0.00 0.00 0.00 0.00 0.00 0.00 0.00 0.00 0.00 0.00 0.00 0.00 0.00 0.00 0.00 0.00 0.00 0.00 0.00 0.00 0.00 0.00 0.00 0.00 0.00 0.00 0.00 0.00 0.00 0.00 0.00 0.00 0.00 0.00 0.00 0.00 0.00 0.00 0.00 0.00 0.00 0.00 0.00 0.00 0.00 0.00 0.00 0.00 0.00 0.00 0.00 0.00 0.00 0.00 0.00 0.00 0.00 0.00 0.00 0.00 0.00 0.00 0.00
0.00 0.00 0.00 0.00 0.00 0.00
0.00 0.00 0.00 0.00 0.00 0.00 0.00 0.00 0.00 0.00 0.00 0.00 0.00 0.00 0.00 0.00 0.00 0.00 0.00 0.00 0.00 0.00 0.00 0.00 0.00 0.00 0.00 0.00 0.00 0.00

Exhibit C-7 Page 10
DISTRICT SCHOOL BOARD OF HERNANDO COUNTY STATEMENT OF CASH FLOWS PROPRIETARY FUNDS For the Fiscal Year Ended June 30, 2016
Business-Type Activities - Enterprise Funds Self-Insurance
Consortium 911
Self-Insurance Consortium
912
Self-Insurance Consortium
913
Self-Insurance Consortium
914 CASH FLOWS FROM OPERATING ACTIVITIES Receipts from customers and users 0.00 0.00 0.00 0.00 Receipts from interfund services provided 0.00 0.00 0.00 0.00 Payments to suppliers 0.00 0.00 0.00 0.00 Payments to employees 0.00 0.00 0.00 0.00 Payments for interfund services used 0.00 0.00 0.00 0.00 Other receipts (payments) 0.00 0.00 0.00 0.00 Net cash provided (used) by operating activities 0.00 0.00 0.00 0.00 CASH FLOWS FROM NONCAPITAL FINANCING ACTIVITIES Subsidies from operating grants 0.00 0.00 0.00 0.00 Transfers from other funds 0.00 0.00 0.00 0.00 Transfers to other funds 0.00 0.00 0.00 0.00 Net cash provided (used) by noncapital financing activities 0.00 0.00 0.00 0.00 CASH FLOWS FROM CAPITAL AND RELATED FINANCING ACTIVITIES Proceeds from capital debt 0.00 0.00 0.00 0.00 Capital contributions 0.00 0.00 0.00 0.00 Proceeds from disposition of capital assets 0.00 0.00 0.00 0.00 Acquisition and construction of capital assets 0.00 0.00 0.00 0.00 Principal paid on capital debt 0.00 0.00 0.00 0.00 Interest paid on capital debt 0.00 0.00 0.00 0.00 Net cash provided (used) by capital and related financing activities 0.00 0.00 0.00 0.00 CASH FLOWS FROM INVESTING ACTIVITIES Proceeds from sales and maturities of investments 0.00 0.00 0.00 0.00 Interest and dividends received 0.00 0.00 0.00 0.00 Purchase of investments 0.00 0.00 0.00 0.00 Net cash provided (used) by investing activities 0.00 0.00 0.00 0.00 Net increase (decrease) in cash and cash equivalents 0.00 0.00 0.00 0.00 Cash and cash equivalents - July 1, 2015 0.00 0.00 0.00 0.00 Cash and cash equivalents - June 30, 2016 0.00 0.00 0.00 0.00 Reconciliation of operating income (loss) to net cash provided (used) by operating activities: Operating income (loss) 0.00 0.00 0.00 0.00 Adjustments to reconcile operating income (loss) to net cash provided (used) by operating activities:
Depreciation/Amortization expense 0.00 0.00 0.00 0.00 Commodities used from USDA program 0.00 0.00 0.00 0.00 Change in assets and liabilities:
(Increase) decrease in accounts receivable 0.00 0.00 0.00 0.00 (Increase) decrease in interest receivable 0.00 0.00 0.00 0.00 (Increase) decrease in due from insurer 0.00 0.00 0.00 0.00 (Increase) decrease in deposits receivable 0.00 0.00 0.00 0.00 (Increase) decrease in due from other funds 0.00 0.00 0.00 0.00 (Increase) decrease in due from other agencies 0.00 0.00 0.00 0.00 (Increase) decrease in inventory 0.00 0.00 0.00 0.00 (Increase) decrease in prepaid items 0.00 0.00 0.00 0.00 (Increase) decrease in pension 0.00 0.00 0.00 0.00 Increase (decrease) in salaries and benefits payable 0.00 0.00 0.00 0.00 Increase (decrease) in payroll tax liabilities 0.00 0.00 0.00 0.00 Increase (decrease) in accounts payable 0.00 0.00 0.00 0.00 Increase (decrease) in cash overdraft 0.00 0.00 0.00 0.00 Increase (decrease) in judgments payable 0.00 0.00 0.00 0.00 Increase (decrease) in sales tax payable 0.00 0.00 0.00 0.00 Increase (decrease) in accrued interest payable 0.00 0.00 0.00 0.00 Increase (decrease) in deposits payable 0.00 0.00 0.00 0.00 Increase (decrease) in due to other funds 0.00 0.00 0.00 0.00 Increase (decrease) in due to other agencies 0.00 0.00 0.00 0.00 Increase (decrease) in unearned revenues 0.00 0.00 0.00 0.00 Increase (decrease) in pension 0.00 0.00 0.00 0.00 Increase (decrease) in other postemployment benefits 0.00 0.00 0.00 0.00 Increase (decrease) in estimated unpaid claims - Self-Insurance Prog. 0.00 0.00 0.00 0.00 Increase (decrease) in estimated liability for claims adjustment 0.00 0.00 0.00 0.00
Total adjustments 0.00 0.00 0.00 0.00 Net cash provided (used) by operating activities 0.00 0.00 0.00 0.00 Noncash investing, capital and financing activities: Borrowing under capital lease 0.00 0.00 0.00 0.00 Contributions of capital assets 0.00 0.00 0.00 0.00 Purchase of equipment on account 0.00 0.00 0.00 0.00 Capital asset trade-ins 0.00 0.00 0.00 0.00 Net Increase/(Decrease) in the fair value of investments 0.00 0.00 0.00 0.00 Commodities received through USDA program 0.00 0.00 0.00 0.00
The notes to financial statements are an integral part of this statement. ESE 145

Exhibit C-7 Page 10
Governmental Activities -
Internal Service Funds
ARRA Consortium
915
Other
921
Other
922
Other Enterprise
Funds Totals
0.00 0.00 0.00 0.00 0.00 0.00 0.00 0.00 0.00 0.00 0.00 0.00 0.00 0.00 0.00 0.00 0.00 0.00 0.00 0.00 0.00 0.00 0.00 0.00 0.00 0.00 0.00 0.00 0.00 0.00 0.00 0.00 0.00 0.00 0.00 0.00 0.00 0.00 0.00 0.00 0.00 0.00
0.00 0.00 0.00 0.00 0.00 0.00 0.00 0.00 0.00 0.00 0.00 0.00 0.00 0.00 0.00 0.00 0.00 0.00 0.00 0.00 0.00 0.00 0.00 0.00
0.00 0.00 0.00 0.00 0.00 0.00 0.00 0.00 0.00 0.00 0.00 0.00 0.00 0.00 0.00 0.00 0.00 0.00 0.00 0.00 0.00 0.00 0.00 0.00 0.00 0.00 0.00 0.00 0.00 0.00 0.00 0.00 0.00 0.00 0.00 0.00 0.00 0.00 0.00 0.00 0.00 0.00
0.00 0.00 0.00 0.00 0.00 0.00 0.00 0.00 0.00 0.00 0.00 0.00 0.00 0.00 0.00 0.00 0.00 0.00 0.00 0.00 0.00 0.00 0.00 0.00 0.00 0.00 0.00 0.00 0.00 0.00 0.00 0.00 0.00 0.00 0.00 0.00 0.00 0.00 0.00 0.00 0.00 0.00
0.00 0.00 0.00 0.00 0.00 0.00
0.00 0.00 0.00 0.00 0.00 0.00 0.00 0.00 0.00 0.00 0.00 0.00
0.00 0.00 0.00 0.00 0.00 0.00 0.00 0.00 0.00 0.00 0.00 0.00 0.00 0.00 0.00 0.00 0.00 0.00 0.00 0.00 0.00 0.00 0.00 0.00 0.00 0.00 0.00 0.00 0.00 0.00 0.00 0.00 0.00 0.00 0.00 0.00 0.00 0.00 0.00 0.00 0.00 0.00 0.00 0.00 0.00 0.00 0.00 0.00 0.00 0.00 0.00 0.00 0.00 0.00 0.00 0.00 0.00 0.00 0.00 0.00 0.00 0.00 0.00 0.00 0.00 0.00 0.00 0.00 0.00 0.00 0.00 0.00 0.00 0.00 0.00 0.00 0.00 0.00 0.00 0.00 0.00 0.00 0.00 0.00 0.00 0.00 0.00 0.00 0.00 0.00 0.00 0.00 0.00 0.00 0.00 0.00 0.00 0.00 0.00 0.00 0.00 0.00 0.00 0.00 0.00 0.00 0.00 0.00 0.00 0.00 0.00 0.00 0.00 0.00 0.00 0.00 0.00 0.00 0.00 0.00 0.00 0.00 0.00 0.00 0.00 0.00 0.00 0.00 0.00 0.00 0.00 0.00 0.00 0.00 0.00 0.00 0.00 0.00 0.00 0.00 0.00 0.00 0.00 0.00 0.00 0.00 0.00 0.00 0.00 0.00 0.00 0.00 0.00 0.00 0.00 0.00
0.00 0.00 0.00 0.00 0.00 0.00 0.00 0.00 0.00 0.00 0.00 0.00 0.00 0.00 0.00 0.00 0.00 0.00 0.00 0.00 0.00 0.00 0.00 0.00 0.00 0.00 0.00 0.00 0.00 0.00 0.00 0.00 0.00 0.00 0.00 0.00

Exhibit C-8 Page 11
DISTRICT SCHOOL BOARD OF HERNANDO COUNTY STATEMENT OF FIDUCIARY ASSETS AND LIABILITIES FIDUCIARY FUNDS June 30, 2016
Account Number
Total Agency Funds 89X
ASSETS Cash and Cash Equivalents 1110 1,680,893.00 Investments 1160 0.00 Accounts Receivable, Net 1131 13,043.00 Pension Contributions Receivable 1132 Interest Receivable on Investments 1170 0.00 Due From Budgetary Funds 1141 355.00 Due From Other Agencies 1220 0.00 Inventory 1150 0.00 Total Assets 1,694,291.00 DEFERRED OUTFLOWS OF RESOURCES Accumulated Decrease in Fair Value of Hedging Derivatives 1910 Pension 1940 Other Postemployment Benefits 1950 Total Deferred Outflows of Resources LIABILITIES Cash Overdraft 2125 0.00 Accrued Salaries and Benefits 2110 0.00 Payroll Deductions and Withholdings 2170 0.00 Accounts Payable 2120 0.00 Internal Accounts Payable 2290 1,694,291.00 Due to Other Agencies 2230 Due to Budgetary Funds 2161 0.00 Total Liabilities 1,694,291.00 DEFERRED INFLOWS OF RESOURCES Accumulated Increase in Fair Value of Hedging Derivatives 2610 Pension 2640 Other Postemployment Benefits 2650 Total Deferred Inflows of Resources NET POSITION Held in Trust for Pension Benefits 2785 Held in Trust for Other Purposes 2785 Total Net Position
The notes to financial statements are an integral part of this statement. ESE 145

Exhibit C-9 Page 12
DISTRICT SCHOOL BOARD OF HERNANDO COUNTY STATEMENT OF CHANGES IN FIDUCIARY NET POSITION FIDUCIARY FUNDS For the Fiscal Year Ended June 30, 2016
Account Number
Total Investment Trust Funds 84X
Total Private-Purpose Trust Funds 85X
Total Pension Trust Funds
87X ADDITIONS Contributions:
Employer 0.00 0.00 0.00 Plan Members 0.00 0.00 0.00 Gifts, Grants and Bequests 3440 0.00 0.00 0.00
Investment Income: Interest on Investments 3431 0.00 0.00 0.00 Gain on Sale of Investments 3432 0.00 0.00 0.00 Net Increase (Decrease) in the Fair Value of Investments 3433 0.00 0.00 0.00
Total Investment Income 0.00 0.00 0.00 Less Investment Expense 0.00 0.00 0.00
Net Investment Income 0.00 0.00 0.00 Total Additions 0.00 0.00 0.00 DEDUCTIONS Salaries 100 0.00 0.00 0.00 Employee Benefits 200 0.00 0.00 0.00 Purchased Services 300 0.00 0.00 0.00 Other 700 0.00 0.00 0.00 Refunds of Contributions 0.00 0.00 0.00 Administrative Expenses 0.00 0.00 0.00 Total Deductions 0.00 0.00 0.00 Change In Net Position 0.00 0.00 0.00 Net Position Held In Trust, July 1, 2015 2885 0.00 0.00 0.00 Adjustments to Net Position 2896 0.00 0.00 0.00 Net Position Held in Trust for Pension Benefits and Other Purposes, June 30, 2016 2785 0.00 0.00 0.00
The notes to financial statements are an integral part of this statement. ESE 145

Exhibit C-10 Page 13
DISTRICT SCHOOL BOARD OF HERNANDO COUNTY COMBINING STATEMENT OF NET POSITION MAJOR AND NONMAJOR COMPONENT UNITS June 30, 2016
Account Number
Total Nonmajor Component Units
Total Component Units
ASSETS Cash and Cash Equivalents 1110 242,471.00 242,471.00 Investments 1160 20,000.00 20,000.00 Prepaid Items 1230 25,500.00 25,500.00 Improvements Other Than Buildings 1320 95,434.00 95,434.00
Less Accumulated Depreciation 1329 (71,117.00) (71,117.00) Furniture, Fixtures and Equipment 1340 335,278.00 335,278.00
Less Accumulated Depreciation 1349 (220,539.00) (220,539.00) Motor Vehicles 1350 275,791.00 275,791.00
Less Accumulated Depreciation 1359 (73,292.00) (73,292.00) Depreciable Capital Assets, Net 341,555.00 341,555.00
Total Capital Assets 341,555.00 341,555.00 Total Assets 629,526.00 629,526.00 LIABILITIES
Accrued Salaries and Benefits 2110 40,681.00 40,681.00 Accounts Payable 2120 6,613.00 6,613.00
Noncurrent Liabilities Portion Due Within One Year:
Notes Payable 2310 49,633.00 49,633.00 Due Within One Year 49,633.00 49,633.00
Portion Due After One Year: Notes Payable 2310 112,143.00 112,143.00 Due in More than One Year 112,143.00 112,143.00
Total Long-Term Liabilities 161,776.00 161,776.00 Total Liabilities 209,070.00 209,070.00 NET POSITION Net Investment in Capital Assets 2770 179,779.00 179,779.00 Restricted For:
Categorical Carryover Programs 2780 0.00 0.00 Food Service 2780 0.00 0.00 Debt Service 2780 0.00 0.00 Capital Projects 2780 0.00 0.00 Other Purposes 2780 0.00 0.00
Unrestricted 2790 240,677.00 240,677.00 Total Net Position 420,456.00 420,456.00
The notes to financial statements are an integral part of this statement. ESE 145

Exhibit C-11a Page 14
DISTRICT SCHOOL BOARD OF HERNANDO COUNTY COMBINING STATEMENT OF ACTIVITIES MAJOR AND NONMAJOR COMPONENT UNITS Major Component Unit Name For the Fiscal Year Ended June 30, 2016
FUNCTIONS Account Number Expenses
Program Revenues Net (Expense) Revenue and Changes
in Net Position Component Unit
Charges for Services
Operating Grants and
Contributions
Capital Grants and
Contributions Component Unit Activities:
Instruction 5000 0.00 0.00 0.00 0.00 0.00 Student Support Services 6100 0.00 0.00 0.00 0.00 0.00 Instructional Media Services 6200 0.00 0.00 0.00 0.00 0.00 Instruction and Curriculum Development Services 6300 0.00 0.00 0.00 0.00 0.00 Instructional Staff Training Services 6400 0.00 0.00 0.00 0.00 0.00 Instruction-Related Technology 6500 0.00 0.00 0.00 0.00 0.00 Board 7100 0.00 0.00 0.00 0.00 0.00 General Administration 7200 0.00 0.00 0.00 0.00 0.00 School Administration 7300 0.00 0.00 0.00 0.00 0.00 Facilities Acquisition and Construction 7400 0.00 0.00 0.00 0.00 0.00 Fiscal Services 7500 0.00 0.00 0.00 0.00 0.00 Food Services 7600 0.00 0.00 0.00 0.00 0.00 Central Services 7700 0.00 0.00 0.00 0.00 0.00 Student Transportation Services 7800 0.00 0.00 0.00 0.00 0.00 Operation of Plant 7900 0.00 0.00 0.00 0.00 0.00 Maintenance of Plant 8100 0.00 0.00 0.00 0.00 0.00 Administrative Technology Services 8200 0.00 0.00 0.00 0.00 0.00 Community Services 9100 0.00 0.00 0.00 0.00 0.00 Interest on Long-Term Debt 9200 0.00 0.00 0.00 0.00 0.00 Unallocated Depreciation/Amortization Expense 0.00 0.00
Total Component Unit Activities 0.00 0.00 0.00 0.00 0.00
General Revenues: Taxes:
Property Taxes, Levied for Operational Purposes Property Taxes, Levied for Debt Service Property Taxes, Levied for Capital Projects Local Sales Taxes
Grants and Contributions Not Restricted to Specific Programs Investment Earnings Miscellaneous Special Items Extraordinary Items Transfers Total General Revenues, Special Items, Extraordinary Items and Transfers Change in Net Position Net Position, July 1, 2015 Adjustments to Net Position Net Position, June 30, 2016
The notes to financial statements are an integral part of this statement. ESE 145
0.00 0.00 0.00 0.00 0.00 0.00 0.00 0.00 0.00 0.00 0.00 0.00 0.00 0.00 0.00

Exhibit C-11b Page 15
DISTRICT SCHOOL BOARD OF HERNANDO COUNTY COMBINING STATEMENT OF ACTIVITIES (CONTINUED) MAJOR AND NONMAJOR COMPONENT UNITS Major Component Unit Name For the Fiscal Year Ended June 30, 2016
FUNCTIONS Account Number Expenses
Program Revenues Net (Expense) Revenue and Changes
in Net Position Component Unit
Charges for Services
Operating Grants and
Contributions
Capital Grants and
Contributions Component Unit Activities:
Instruction 5000 0.00 0.00 0.00 0.00 0.00 Student Support Services 6100 0.00 0.00 0.00 0.00 0.00 Instructional Media Services 6200 0.00 0.00 0.00 0.00 0.00 Instruction and Curriculum Development Services 6300 0.00 0.00 0.00 0.00 0.00 Instructional Staff Training Services 6400 0.00 0.00 0.00 0.00 0.00 Instruction-Related Technology 6500 0.00 0.00 0.00 0.00 0.00 Board 7100 0.00 0.00 0.00 0.00 0.00 General Administration 7200 0.00 0.00 0.00 0.00 0.00 School Administration 7300 0.00 0.00 0.00 0.00 0.00 Facilities Acquisition and Construction 7400 0.00 0.00 0.00 0.00 0.00 Fiscal Services 7500 0.00 0.00 0.00 0.00 0.00 Food Services 7600 0.00 0.00 0.00 0.00 0.00 Central Services 7700 0.00 0.00 0.00 0.00 0.00 Student Transportation Services 7800 0.00 0.00 0.00 0.00 0.00 Operation of Plant 7900 0.00 0.00 0.00 0.00 0.00 Maintenance of Plant 8100 0.00 0.00 0.00 0.00 0.00 Administrative Technology Services 8200 0.00 0.00 0.00 0.00 0.00 Community Services 9100 0.00 0.00 0.00 0.00 0.00 Interest on Long-Term Debt 9200 0.00 0.00 0.00 0.00 0.00 Unallocated Depreciation/Amortization Expense 0.00 0.00
Total Component Unit Activities 0.00 0.00 0.00 0.00 0.00
General Revenues: Taxes:
Property Taxes, Levied for Operational Purposes Property Taxes, Levied for Debt Service Property Taxes, Levied for Capital Projects Local Sales Taxes
Grants and Contributions Not Restricted to Specific Programs Investment Earnings Miscellaneous Special Items Extraordinary Items Transfers Total General Revenues, Special Items, Extraordinary Items and Transfers Change in Net Position Net Position, July 1, 2015 Adjustments to Net Position Net Position, June 30, 2016
The notes to financial statements are an integral part of this statement. ESE 145
0.00 0.00 0.00 0.00 0.00 0.00 0.00 0.00 0.00 0.00 0.00 0.00 0.00 0.00 0.00

Exhibit C-11c Page 16
DISTRICT SCHOOL BOARD OF HERNANDO COUNTY COMBINING STATEMENT OF ACTIVITIES (CONTINUED) MAJOR AND NONMAJOR COMPONENT UNITS TOTAL NONMAJOR COMPONENT UNITS For the Fiscal Year Ended June 30, 2016
FUNCTIONS Account Number Expenses
Program Revenues Net (Expense) Revenue and Changes
in Net Position Component Unit
Charges for Services
Operating Grants and
Contributions
Capital Grants and
Contributions Component Unit Activities:
Instruction 5000 1,443,345.00 209,113.00 0.00 0.00 (1,234,232.00) Student Support Services 6100 0.00 0.00 0.00 0.00 0.00 Instructional Media Services 6200 0.00 0.00 0.00 0.00 0.00 Instruction and Curriculum Development Services 6300 0.00 0.00 0.00 0.00 0.00 Instructional Staff Training Services 6400 1,506.00 0.00 0.00 0.00 (1,506.00) Instruction-Related Technology 6500 0.00 0.00 0.00 0.00 0.00 Board 7100 56,538.00 0.00 0.00 0.00 (56,538.00) General Administration 7200 84,309.00 0.00 0.00 0.00 (84,309.00) School Administration 7300 529,473.00 0.00 0.00 0.00 (529,473.00) Facilities Acquisition and Construction 7400 228,150.00 0.00 0.00 19,687.00 (208,463.00) Fiscal Services 7500 36,141.00 0.00 0.00 0.00 (36,141.00) Food Services 7600 3,129.00 1,262.00 0.00 0.00 (1,867.00) Central Services 7700 5,096.00 0.00 0.00 0.00 (5,096.00) Student Transportation Services 7800 65,724.00 0.00 0.00 0.00 (65,724.00) Operation of Plant 7900 41,293.00 0.00 0.00 0.00 (41,293.00) Maintenance of Plant 8100 0.00 0.00 0.00 0.00 0.00 Administrative Technology Services 8200 0.00 0.00 0.00 0.00 0.00 Community Services 9100 0.00 0.00 0.00 0.00 0.00 Interest on Long-Term Debt 9200 10,635.00 0.00 0.00 0.00 (10,635.00) Unallocated Depreciation/Amortization Expense 88,222.00 (88,222.00)
Total Component Unit Activities 2,593,561.00 210,375.00 0.00 19,687.00 (2,363,499.00)
General Revenues: Taxes:
Property Taxes, Levied for Operational Purposes Property Taxes, Levied for Debt Service Property Taxes, Levied for Capital Projects Local Sales Taxes
Grants and Contributions Not Restricted to Specific Programs Investment Earnings Miscellaneous Special Items Extraordinary Items Transfers Total General Revenues, Special Items, Extraordinary Items and Transfers Change in Net Position Net Position, July 1, 2015 Adjustments to Net Position Net Position, June 30, 2016
The notes to financial statements are an integral part of this statement. ESE 145
0.00 0.00 0.00 0.00
129,986.00 0.00
2,255,653.00 0.00 0.00 0.00
2,385,639.00 22,140.00
398,316.00 0.00
420,456.00

Exhibit C-11d Page 17
DISTRICT SCHOOL BOARD OF HERNANDO COUNTY COMBINING STATEMENT OF ACTIVITIES MAJOR AND NONMAJOR COMPONENT UNITS TOTAL COMPONENT UNITS For the Fiscal Year Ended June 30, 2016
FUNCTIONS Account Number Expenses
Program Revenues Net (Expense) Revenue and Changes
in Net Position Component Unit
Charges for Services
Operating Grants and
Contributions
Capital Grants and
Contributions Component Unit Activities:
Instruction 5000 1,443,345.00 209,113.00 0.00 0.00 (1,234,232.00) Student Support Services 6100 0.00 0.00 0.00 0.00 0.00 Instructional Media Services 6200 0.00 0.00 0.00 0.00 0.00 Instruction and Curriculum Development Services 6300 0.00 0.00 0.00 0.00 0.00 Instructional Staff Training Services 6400 1,506.00 0.00 0.00 0.00 (1,506.00) Instruction-Related Technology 6500 0.00 0.00 0.00 0.00 0.00 Board 7100 56,538.00 0.00 0.00 0.00 (56,538.00) General Administration 7200 84,309.00 0.00 0.00 0.00 (84,309.00) School Administration 7300 529,473.00 0.00 0.00 0.00 (529,473.00) Facilities Acquisition and Construction 7400 228,150.00 0.00 0.00 19,687.00 (208,463.00) Fiscal Services 7500 36,141.00 0.00 0.00 0.00 (36,141.00) Food Services 7600 3,129.00 1,262.00 0.00 0.00 (1,867.00) Central Services 7700 5,096.00 0.00 0.00 0.00 (5,096.00) Student Transportation Services 7800 65,724.00 0.00 0.00 0.00 (65,724.00) Operation of Plant 7900 41,293.00 0.00 0.00 0.00 (41,293.00) Maintenance of Plant 8100 0.00 0.00 0.00 0.00 0.00 Administrative Technology Services 8200 0.00 0.00 0.00 0.00 0.00 Community Services 9100 0.00 0.00 0.00 0.00 0.00 Interest on Long-Term Debt 9200 10,635.00 0.00 0.00 0.00 (10,635.00) Unallocated Depreciation/Amortization Expense 88,222.00 (88,222.00)
Total Component Unit Activities 2,593,561.00 210,375.00 0.00 19,687.00 (2,363,499.00)
General Revenues: Taxes:
Property Taxes, Levied for Operational Purposes Property Taxes, Levied for Debt Service Property Taxes, Levied for Capital Projects Local Sales Taxes
Grants and Contributions Not Restricted to Specific Programs Investment Earnings Miscellaneous Special Items Extraordinary Items Transfers Total General Revenues, Special Items, Extraordinary Items and Transfers Change in Net Position Net Position, July 1, 2015 Adjustments to Net Position Net Position, June 30, 2016
The notes to financial statements are an integral part of this statement. ESE 145
0.00 0.00 0.00 0.00
129,986.00 0.00
2,255,653.00 0.00 0.00 0.00
2,385,639.00 22,140.00
398,316.00 0.00
420,456.00

THE DISTRICT SCHOOL BOARD OF HERNANDO COUNTY, FLORIDA
SUPERINTENDENT’S ANNUAL FINANCIAL REPORT
FOR THE FISCAL YEAR ENDED JUNE 30, 2016
ISSUED BY:
SECTION III
NOTES TO THE FINANCIAL SECTION

ISSUED BY:

DISTRICT SCHOOL BOARD OF HERNANDO COUNTY, FLORIDA NOTES TO FINANCIAL STATEMENTS
June 30, 2016
1. SUMMARY OF SIGNIFICANT ACCOUNTING POLICIES
Reporting Entity
The Hernando County District School Board (Board) has direct responsibility for operation, control, and supervision of Hernando County School District (District) schools and is considered a primary government for financial reporting. The District is considered part of the Florida system of public education. The governing body of the District is the Board, which is composed of five elected members. The appointed Superintendent of Schools is the executive officer of the Board. Geographic boundaries of the District correspond with those of Hernando County.
Criteria for determining if other entities are potential component units which should be reported within the District's basic financial statements are identified and described in the Governmental Accounting Standards Board's (GASB) Codification of Governmental Accounting and Financial Reporting Standards, Sections 2100 and 2600. The application of these criteria provides for identification of any entities for which the District School Board is financially accountable and other organizations for which the nature and significance of their relationship with the School Board are such that exclusion would cause the District's basic financial statements to be misleading.
Based on the application of these criteria, the following component units are included within the Board's reporting entity:
Blended Component Unit. The Hernando School Board Leasing Corporation (Leasing Corporation) was formed in July 2011 to facilitate financing for the acquisition of facilities and equipment as further discussed in Note 6. The governing board of the Leasing Corporation is the District School Board. Due to the substantive economic relationship between the District and the Leasing Corporation, the financial activities of the Leasing Corporation are included in the accompanying basic financial statements. Separate financial statements of the Leasing Corporation are not published.
Discretely Presented Component Units. The component unit columns in the government-wide financial statements include the financial data of The Hernando County Education Direct Support Organization, Inc., (Foundation), and the following charter schools: Brooksville Engineering, Science & Technology, Inc., Gulf Coast Middle School, Inc., and the Gulf Coast Academy of Science and Technology, Inc.
The Foundation is a separate not-for-profit corporation organized and operated as a direct-support organization under Section 1001.453, Florida Statutes, to receive, hold, invest, and administer property and to make expenditures to or for the benefit of the District. The Foundation is considered to be a component unit of the District because of the nature and significance of its relationship to the District.
37

DISTRICT SCHOOL BOARD OF HERNANDO COUNTY, FLORIDA NOTES TO FINANCIAL STATEMENTS
June 30, 2016
The charter schools are separate not-for-profit corporations organized pursuant to Chapter 617, Florida Statutes, the Florida Not For Profit Corporation Act, and Section 1002.33, Florida Statutes. The charter schools operate under a charter of the sponsoring District. The charter schools are considered to be a component units of the District because the District is financially accountable for the charter schools as the District established the charter schools by approval of the charter, which is tantamount to the initial appointment of the charter schools, and there is the potential for the charter schools to impose specific financial burdens on the District. In addition, pursuant to the Florida Constitution, the charter schools are public schools and the District is responsible for the operation, control, and supervision of public schools within the District.
Annual audits of the Foundation’s and the charter schools’ financial statements are conducted by independent certified public accountants and are filed in the District’s administrative office at 919 North Broad Street, Brooksville, Florida, 34601.
Basis of Presentation
Government-wide Financial Statements - Government-wide financial statements, including the statement of net position and the statement of activities, present information about the School District as a whole. These statements include the nonfiduciary financial activity of the primary government and its component units.
Government-wide financial statements are prepared using the economic resources measurement focus. The statement of activities presents a comparison between direct expenses and program revenues for each function or program of the District’s governmental activities. Direct expenses are those that are specifically associated with a service, program, or department and are thereby clearly identifiable to a particular function. Depreciation expense associated with the District’s motor vehicles is allocated to the applicable functions, while remaining depreciation expense is not readily associated with a particular function and is reported as unallocated.
Program revenues include charges paid by the recipient of the goods or services offered by the program, and grants and contributions that are restricted to meeting the operational or capital requirements of a particular program. Revenues that are not classified as program revenues are presented as general revenues. The comparison of direct expenses with program revenues identifies the extent to which each governmental function is self-financing or draws from the general revenues of the District.
The effects of interfund activity have been eliminated from the government-wide financial statements.
Fund Financial Statements - Fund financial statements provide detailed information about the District in the governmental and fiduciary funds. The focus of
38

DISTRICT SCHOOL BOARD OF HERNANDO COUNTY, FLORIDA NOTES TO FINANCIAL STATEMENTS
June 30, 2016
governmental fund financial statements is on major funds rather than reporting funds by type. Each major fund is reported in a separate column. Nonmajor funds are aggregated and reported in a single column. Because the focus of governmental fund financial statements differs from the focus of government-wide financial statements, reconciliation is presented with each of the governmental fund financial statements.
The District reports the following major governmental funds:
General Fund – to account for all financial resources not required to be accounted for in another fund, and for certain revenues from the State that are legally restricted to be expended for specific current operating purposes.
Special Revenue – Other Federal Programs Fund – to account for certain Federal Grant program revenue sources that are legally restricted for specified purposes. This Special Revenue Fund tracks Federal grants and entitlements that are received by the District from various Federal and State agencies.
Special Revenue – Federal Economic Stimulus Programs Fund – to account for revenues received as part of the American Recovery and Reinvestment Act (ARRA).
Capital Project – Local Capital Improvement Fund – to account for the financial resources generated by the local capital improvement tax levy to be used for educational capital outlay needs, including new construction, renovation, and remodeling project, and debt service payments on lease-purchase agreements for educational facilities.
Capital Projects – Other Fund – to account for the financial resources generated by the local voted sales tax and the impact fees levied by the Hernando County Board of County Commissioners. The sales tax is to be used for new school construction. The impact fees may be used for educational capital outlay needs, including new construction, renovation and remodeling projects, and debt service payments.
Additionally, the District reports the following fiduciary fund types:
Private-Purpose Trust Fund – to account for resources of the Hernando High School Renaissance Scholarship Endowment Fund which are used for student scholarships.
Agency Funds – to account for resources of the school internal funds which are used to administer moneys collected at the various schools in connection with school, student athletic, class, and club activities.
During the course of operations the District has activity between funds for various purposes. Any residual balances outstanding at fiscal year-end are reported as due
39

DISTRICT SCHOOL BOARD OF HERNANDO COUNTY, FLORIDA NOTES TO FINANCIAL STATEMENTS
June 30, 2016
from/to other funds. While these balances are reported in fund financial statements, certain eliminations are made in the preparation of the government-wide financial statements. Further, certain activity occurs during the year involving transfers of resources between funds. In fund financial statements, these amounts are reported at gross amounts as transfers in and out. While reported in fund financial statements, certain eliminations are made in the preparation of the government-wide financial statements to report only the net amount of transfers.
Basis of Accounting
Basis of accounting refers to when revenues and expenditures, or expenses, are recognized in the accounts and reported in the financial statements. Basis of accounting relates to the timing of the measurements made, regardless of the measurement focus applied.
The government-wide financial statements are prepared using the accrual basis of accounting, as are the fiduciary funds financial statements. Revenues are recognized when earned and expenses are recognized when a liability is incurred, regardless of the timing of the related cash flows. Property taxes are recognized in the year for which they are levied. Revenues from grants, entitlements, and donations are recognized in the fiscal year in which all eligibility requirements imposed by the provider have been satisfied.
Governmental fund financial statements are prepared using the modified accrual basis of accounting. Revenues, except for certain grant revenues, are recognized when they become measurable and available. Revenues are considered to be available when they are collectible within the current period or soon enough thereafter to pay liabilities of the current period.
The District considers property taxes, sales taxes, and interest to be available if they are collected within 30 days of the end of the current fiscal year. When grant terms provide that the expenditure of resources is the prime factor for determining eligibility for Federal, State, and other grant resources, revenue is recognized at the time the expenditure is made.
Under the modified accrual basis of accounting, expenditures are generally recognized when the related fund liability is incurred, except for principal and interest on long-term debt, claims and judgments, pensions, and other postemployment benefits, and compensated absences, which are recognized when due. Allocations of cost, such as depreciation, are not recognized in governmental funds.
Revenues can be classified into two kinds of transactions: (a) exchange and exchange-like transactions, in which each party receives and gives up essentially equal value and (b) non-exchange transactions, in which a government gives (or receives) value without directly receiving (or giving) equal value in exchange. Revenue resulting from exchange transactions is recorded on the accrual basis when the exchange takes place.
40

DISTRICT SCHOOL BOARD OF HERNANDO COUNTY, FLORIDA NOTES TO FINANCIAL STATEMENTS
June 30, 2016
Revenues resulting from non-exchange transactions are further classified into (a) derived tax revenues, (b) imposed non-exchange revenues, (c) government-mandated non-exchange transactions, and (d) voluntary non-exchange transactions. Derived tax revenues (e.g., sales tax) are recorded when the exchange transaction occurs. Imposed non-exchange transactions (e.g., property taxes) are recorded when use of the resource is required or first permitted by time requirements (e.g., for property taxes, the period for which they are levied). Government-mandated and voluntary non-exchange transactions, (e.g., Federal mandates, grants, and donations) are recorded when all eligibility requirements have been met. When both restricted and unrestricted resources are available for use, it is the District’s policy to use restricted resources first, then unrestricted resources as they are needed.
The three charter schools, shown as discretely presented component units, are accounted for as governmental organizations and follow the same accounting model as the District’s governmental activities.
The Hernando County Education Direct Support Organization, Inc., shown as a discretely presented component unit, is accounted for under the not-for-profit basis of accounting and uses the accrual basis of accounting whereby revenues are recognized when earned and expenses are recognized when incurred.
Deposits and Investments
The District’s cash and cash equivalents are considered to be demand deposits. On June 30, 2016, the carrying amount of the District’s bank deposit accounts was $30,453,975.
Cash deposits are held by banks qualified as public depositories under Florida law. All deposits are insured by Federal depository insurance and collateralized with securities held in Florida's multiple financial institution collateral pool as required by Chapter 280, Florida Statutes. The Agency Funds consider cash as those accounts used as demand deposit accounts and considers cash equivalents as those amounts invested in certificates of deposit.
Investments consist of amounts placed in State Board of Administration (SBA) Debt Service accounts for investment of debt service moneys and amounts placed with the SBA for participation in Florida PRIME (formerly known as the Local Government Surplus Funds Trust Fund Investment Pool) investment pool created by Section 218.405, Florida Statutes, and those made locally. The investment pools operate under investment guidelines established by Section 215.47, Florida Statutes.
The District’s investments in Florida PRIME and the Florida Education Investment Trust Fund (FEIT), which SBA and FEIT indicate are Securities and Exchange Commission Rule 2a7-like external investment pools, as of June 30, 2016, are similar to money market funds in which shares are owned in the fund rather than the underlying investments. These investments are reported at fair value, which is amortized cost.
41

DISTRICT SCHOOL BOARD OF HERNANDO COUNTY, FLORIDA NOTES TO FINANCIAL STATEMENTS
June 30, 2016
Investments made locally consist of money market mutual funds and United States Treasury securities, and are reported at fair value. Types and amounts of investments held at fiscal year-end are described in a subsequent note on investments.
Inventories
Inventories consist of expendable supplies held for consumption in the course of District operations. Inventories are stated at average cost, except for transportation and food service inventories which are stated at last invoice, which approximates the first-in, first-out basis. The United States Department of Agriculture donated foods are stated at their fair value as determined at the time of donation to the District’s food service program by the Florida Department of Agriculture and Consumer Services, Bureau of Food Distribution. The costs of inventories are recorded as expenditures when used rather than purchased.
Capital Assets
Expenditures for capital assets acquired or constructed for general District purposes are reported in the governmental fund that financed the acquisition or construction. The capital assets so acquired are reported at cost in the government-wide statement of net position but are not reported in the governmental fund financial statements. Capital assets are defined by the District as those costing more than $1,000. Such assets are recorded at historical cost or estimated historical cost if purchased or constructed. Donated assets are recorded at fair value at the date of donation.
Interest costs incurred during construction of capital assets are not considered material and are not capitalized as part of the cost of construction.
Capital assets are depreciated using the composite method over the following estimated useful lives:
Description
Estimated
Lives
Buildings and Fixed Equipment 50 years
Improvements Other than Buildings 25 years
Furniture, Fixtures, and Equipment 7 years
Motor Vehicles 10 years
Current-year information relative to changes in capital assets is described in a subsequent note.
Pensions
In the government-wide statement of net position, liabilities are recognized for the District’s proportionate share of each pension plan’s net pension liability. For
42
DISTRICT SCHOOL BOARD OF HERNANDO COUNTY, FLORIDA NOTES TO FINANCIAL STATEMENTS
June 30, 2016
purposes of measuring the net pension liability, deferred outflows of resources and deferred inflows of resources related to pensions, and pension expense, information about the fiduciary net position of the Florida Retirement System (FRS) defined benefit plan and the Health Insurance Subsidy (HIS) defined benefit plan and additions to/deductions from the FRS’s and the HIS’s fiduciary net position have been determined on the same basis as they are reported by the FRS and the HIS plans. For this purpose, benefit payments (including refunds of employee contributions) are recognized when due and payable in accordance with benefit terms. Investments are reported at fair value.
The District’s retirement plans and related amounts are described in a subsequent note.
Long-Term Liabilities
Long-term obligations that will be paid from resources to be received in the future by governmental funds are reported as liabilities in the government-wide statement of net position. Debt premiums and discounts are deferred and amortized over the life of the bonds using the effective interest method. Bonds and certificates of participation payable are reported net of the applicable premium or discount. As a result of the implementation of GASB Statement No. 65, debt issuance costs are no longer treated as deferred charges.
Governmental fund types recognize debt premiums and discounts, as well as debt issuance costs, during the current period. The face amount of debt issued, and premiums on debt issuances, are reported as other financing sources. Issuance costs, whether or not withheld from the actual debt proceeds received, are reported as debt service expenditures.
In the government-wide financial statements, compensated absences (i.e., paid absences for employee vacation leave and sick leave) are accrued as liabilities to the extent that it is probable that the benefits will result in termination payments. A liability for these amounts is reported in the governmental fund financial statements only if it has matured, for example, unused reimbursable leave still outstanding following employee resignations and retirements.
Changes in long-term liabilities for the current year are reported in a subsequent note.
Deferred Outflows/Inflows of Resources
In addition to assets, the statement of net position reports a separate section for deferred outflows of resources. This separate financial statement element, deferred outflows of resources, represents a consumption of net position that applies to future periods and so will not be recognized as an outflow of resources (expense/expenditure) until then. The District only has one item that qualifies for reporting in this category, the deferred amounts related to pensions. The deferred outflows of resources related to pensions are discussed in a subsequent note.
43
DISTRICT SCHOOL BOARD OF HERNANDO COUNTY, FLORIDA NOTES TO FINANCIAL STATEMENTS
June 30, 2016
In addition to liabilities, the statement of net position and the governmental funds balance sheet report a separate section for deferred inflows of resources. This separate financial statement element, deferred inflows of resources, represents an acquisition of net position that applies to a future periods and so will not be recognized as an inflow of resources (revenue) until that time. The District has two types of items that qualify for reporting in this category. The first is the deferred amount on pension reported only in the government-wide statement of net position. A deferred amount on pension results from the difference in the expected and actual amounts of experience, earnings, and contributions. This amount is deferred and amortized over the service life of all employees that are provided with pensions through the pension plan except earnings which are amortized over five years. The second item is unavailable revenue from Hernando County impact fees and the State of Florida for Capital Outlay and Debt Service.
State Revenue Sources
Revenues from State sources for current operations are primarily from the Florida Education Finance Program (FEFP) administered by the Florida Department of Education (Department) under the provisions of Section 1011.62, Florida Statutes. In accordance with this law, the District determines and reports the number of full-time equivalent (FTE) students and related data to the Department. The Department performs certain edit checks on the reported number of FTE and related data, and calculates the allocation of funds to the District. The District is permitted to amend its original reporting for a period of nine months following the date of the original reporting. Such amendments may impact funding allocations for subsequent years.
The Department may also adjust subsequent fiscal period allocations based upon an audit of the District's compliance in determining and reporting FTE and related data. Normally, such adjustments are treated as reductions or additions of revenue in the year when the adjustments are made.
The State provides financial assistance to administer certain categorical educational programs. State Board of Education rules require that revenue earmarked for certain programs be expended only for the program for which the money is provided, and require that the money not expended as of the close of the fiscal year be carried forward into the following year to be expended for the same categorical educational programs. The Department generally requires that categorical educational program revenues be accounted for in the General Fund. A portion of the fund balance of the General Fund is restricted in the governmental fund financial statements for the balance of categorical educational program resources.
The State allocates gross receipts taxes, generally known as Public Education Capital Outlay money, to the District on an annual basis. The District is authorized to expend these funds only upon applying for and receiving an encumbrance authorization from the Department.
44

DISTRICT SCHOOL BOARD OF HERNANDO COUNTY, FLORIDA NOTES TO FINANCIAL STATEMENTS
June 30, 2016
A schedule of revenue from State sources for the current year is presented in a subsequent note.
District Property Taxes
The School Board is authorized by State law to levy property taxes for district school operations, capital improvements, and debt service.
Property taxes consist of ad valorem taxes on real and personal property within the District. Property values are determined by the Hernando County Property Appraiser, and property taxes are collected by the Hernando County Tax Collector.
The School Board adopted the 2015 tax levy on July 19, 2015. Tax bills are mailed in October and taxes are payable between November 1 of the year assessed and March 31 of the following year at discounts of up to 4 percent for early payment.
Taxes become a lien on the property on January 1, and are delinquent on April 1, of the year following the year of assessment. State law provides for enforcement of collection of personal property taxes by seizure of the property to satisfy unpaid taxes, and for enforcement of collection of real property taxes by the sale of interest-bearing tax certificates to satisfy unpaid taxes. The procedures result in the collection of essentially all taxes prior to June 30 of the year following the year of assessment.
Property tax revenues are recognized in the government-wide financial statements when the Board adopts the tax levy. Property tax revenues are recognized in the governmental fund financial statements when taxes are received by the District, except that revenue is accrued for taxes collected by the Hernando County Tax Collector at fiscal year-end but not remitted to the District. Millages and taxes levied for the current year are presented in a subsequent note.
Local Sales Tax
On March 9, 2004, the voters of Hernando County approved a one-half cent school capital outlay sales tax on sales in Hernando County for ten years, commencing January 1, 2005 and ending December 31, 2014, to pay for the construction of certain educational facilities and other related costs, in accordance with Section 212.055(6), Florida Statutes. An extension of the one half cent school capital outlay sales tax was not approved by the voters on November 4, 2014, however a new ten year one-half cent sales tax, commencing on January 1, 2016, was subsequently approved in a special election held on September 8, 2015.
Educational Impact Fees
The District receives residual educational impact fees based on an ordinance adopted by the Hernando County Commission (County) on October 28, 1986; however, the County currently has a moratorium prohibiting the collection of such impact fees. The fees are collected by the County and each municipality within the
45

DISTRICT SCHOOL BOARD OF HERNANDO COUNTY, FLORIDA NOTES TO FINANCIAL STATEMENTS
June 30, 2016
County for most new residential construction based on an interlocal agreement. The fees shall be used solely for the purpose of providing capital improvements to the public educational system necessitated by new residential development, and shall not be used for any expenditure that would be classified as a maintenance or repair expense. The authorized uses include land acquisition; facility design and construction costs; furniture and equipment; and payment of principal, interest, and related costs of indebtedness necessitated by new residential development. Because the educational impact fee is similar to a capital-type special assessment, it is reported as program revenue in the government-wide financial statements. The District anticipates reinstatement of the impact fees in the future.
Federal Revenue Sources
The District receives Federal awards for the enhancement of various educational programs, including American Recovery and Reinvestment Act (ARRA) funds. Federal awards are generally received based on applications submitted to, and approved by, various granting agencies. For Federal awards in which a claim to these grant proceeds is based on incurring eligible expenditures, revenue is recognized to the extent that eligible expenditures have been incurred.
2. ACCOUNTING CHANGES
The District participates in the FRS defined benefit pension plan and the HIS defined benefit plan administered by Florida Division of Retirement. As a participating employer, the District implemented GASB Statement No. 68, Accounting and Financial Reporting for Pensions, which requires employers participating in cost-sharing multiple-employer defined benefit pension plans to report the employers’ proportionate share of the net pension liabilities and related pension amounts of the defined benefit pension plans.
3. INVESTMENTS
Cash and Cash Equivalents and Investment Portfolio. On February 15, 2000, the District formally adopted a comprehensive investment policy, as revised on January 14, 2014, pursuant to Section 218.415, Florida Statutes, that established permitted investments, asset allocation and issuer limits, credit rating requirements, and maturity limits to protect the District’s cash and investment assets. The District maintains a common cash and investment pool for the use of all funds. In addition, cash and investments are separately held by the District’s special revenue, debt service, capital projects, enterprise and trust funds.
Investment Portfolio. Investment holdings, totaling $14,482,132, consist of amounts placed in a Local Government Surplus Funds Trust Fund, Registered Investment Companies (Money Market Mutual Funds), an Intergovernmental Investment Pool, and U.S. Treasury Bonds, and are reported at fair value in accordance with GASB Statement No. 31, Accounting and Financial Reporting for Certain Investments and for External Investment Pools.
46

DISTRICT SCHOOL BOARD OF HERNANDO COUNTY, FLORIDA NOTES TO FINANCIAL STATEMENTS
June 30, 2016
Section 218,415, Florida Statutes, limits the types of investments that the District can invest in unless specifically authorized in the District’s investment policy. The District’s formal investment policy allows for the following investments: United States Government Securities, Unites States Government Agencies, Federal Instrumentalities, Non-Negotiable Interest Bearing Time Certificates of Deposit, Commercial Paper, Bankers Acceptances, Corporate Notes, State and/or Local Government Taxable and/or Tax-Exempt Debt, Registered Investment Companies (Money Market Mutual Funds), Local Government Surplus Funds Trust Fund (“Florida PRIME”), and Intergovernmental Investment Pools.
As of June 30, 2016, the District has the following investments and maturities:
Weighted Average
Security Type Fair Value Duration
State Board of Administration:
Florida PRIME (1) $5,109,656 38.8 days
Debt Service Accounts 95,786 .50
Intergovernmental Investment Pool:
FEIT 9,214,752 41 days
6.63
U.S. Treasury Bonds 61,938 years
Total $14,482,132 0.14
The Florida PRIME (the “SBA) June 30, 2016, report was the source for of the weighted average maturity and credit rating for Florida Prime. https://www.sbafla.com/prime/
The Fund Fact Sheet as of June 30, 2016, was the source for the Florida Education Investment Trust Fund’s credit rating and weighted average maturity. http://www.feitfund.com/
Interest Rate Risk
Interest rate risk is the risk that changes in interest rates will adversely affect the fair value of an investment. Section 218.415(17), Florida Statutes, limits investment maturities to provide sufficient liquidity to pay obligations as they come due. The District’s investment policy limits interest rate risk by attempting to match investment maturities with known cash needs and anticipated cash flow requirements. Investments of current operating funds shall have maturities of no longer than 24 months. Investments of bond reserves, construction funds, and other non-operating funds (“core funds”) shall have a term appropriate to the need for funds and in accordance with debt covenants. The purchase of
47

DISTRICT SCHOOL BOARD OF HERNANDO COUNTY, FLORIDA NOTES TO FINANCIAL STATEMENTS
June 30, 2016
investments for core funds with maturities longer than 5 years requires Board approval prior to purchase.
The money market mutual funds and Florida Prime use a weighted average days to maturity (WAM).
The District also uses WAM as a measurement of interest rate risk and as of June 30, 2016, the investment portfolio had a weighted average duration of 0.14 years. A portifolio’s WAM reflects the average maturity in days based on final maturity or reset date, in the case of floating rate instruments. WAM measures the sensitivity of the portfolio to interest rate changes.
Credit Risk
Credit risk is the risk that an issuer or other counterparty to an investment will not fulfill its obligations. The District’s investment policy permits for investments which are limited to credit quality ratings from nationally recognized rating agencies as follows:
Commercial paper of any United States company that is rated, at the time or purchase, “Prime-1” by Moody’s and “A-1” by Standard & Poor’s (prime commercial paper).
Bankers’ acceptances which are issued by a domestic bank which has at the time of purchase, an unsecured, uninsured and unguaranteed obligation rating of at least “Prime-1” by Moody’s or “A-1” by Standard & Poor’s.
Corporate notes issued by corporations organized and operating within the United States or by depository institutions licensed by the United States that have a long term debt rating, at the time or purchase, at a minimum single “A” category by any two nationally recognized statistical rating organizations.
State and/or local government taxable and/or tax-exempt debt, general obligation and/or revenue bonds, rated at least “Aa” by Moody’s or “AA” by Standard & Poor’s for long-term debt, or rated at least “MIG-2” by Moody’s or “SP-2” by Standard & Poor’s for short-term debt.
Registered Investment Companies (Money Market Mutual Funds) shall be rated “AAAm” by Standard & Poor’s or the equivalent by another national rating agency.
Investment pools shall be rated “AAA” by Standard & Poor’s or the equivalent by another rating agency.
As of June 30, 2016, $14,420,194 of the District’s investment securities were individually rated “AAAm” by Standard & Poor’s, $61,938 rated “AA+” by Standard & Poor’s.
48

DISTRICT SCHOOL BOARD OF HERNANDO COUNTY, FLORIDA NOTES TO FINANCIAL STATEMENTS
June 30, 2016
The District’s investments in the SBA debt service accounts are to provide for debt service payments on bond debt issued by the SBE for the benefit of the District. The District relies on policies developed by the SBA for managing interest rate risk and credit risk for this account.
As of June 30, 2016, the District had the following credit quality:
Standard & Poor's Security Type Credit Rating
State Board of Administration:
Florida PRIME AAAm
Debt Service Accounts N/A
Intergovernmental Investment Pool:
FEIT AAAm
U.S. Treasury Bonds AA+
Custodial Credit Risk
Custodial credit risk for investments is the risk that, in the event of the failure of the counterparty to a transaction, the District will not be able to recover the value of investment or collateral securities that are in the possession of an outside party. The District’s investment policy pursuant to Section 218.415(18), Florida Statutes, requires securities, with the exception of certificates of deposits, shall be held with a third-party custodian; and all securities purchased by, and all collateral obtained by the District should be properly designated as an asset of the District. The securities must be held in an account separate and apart from the assets of the financial institution. A third-party custodian is defined as any bank depository chartered by the Federal Government, the State of Florida, or any other state or territory of the United States which has a branch or principal place of business in the State of Florida, or by a national association organized and existing under the laws of the United States which is authorized to accept and execute trusts and is doing business in the State of Florida. Certificates of Deposit will be placed in the provider’s safekeeping department for the term of the deposit.
As of June 30, 2016, the District’s investment portfolio was held with a third-party custodian as required by the District’s investment policy.
Concentration of Credit Risk
49

DISTRICT SCHOOL BOARD OF HERNANDO COUNTY, FLORIDA NOTES TO FINANCIAL STATEMENTS
June 30, 2016
The District’s investment policy has established asset allocation and issuer limits, which are designed to reduce concentration of credit risk of the District’s investment portfolio, for the following investments:
A maximum of 100% of available funds may be invested in the United States Government Securities, 50% of available funds may be invested in United States Government agencies with a 25% limit on individual issuers, 75% of available funds may be invested in Federal Instrumentalities with a 25% limit on individual issuers, 75% of available funds may be invested in non-negotiable interest bearing time certificates of deposit with a 25% limit on individual issuers, 25% of available funds may be invested in commercial paper with a 10% limit on individual issuers, 25% of available funds may be invested in corporate notes with a 10% limit on individual issuers, 30% of available funds may be invested in State and/or Local Government Taxable and/or Tax-Exempt Debt with a 10% limit on individual issuers, 50% of available funds may be invested in Registered Investment Companies (Money Market Mutual Funds) with a 25% limit of individual issuers, and 25% of available funds may be invested in Intergovernmental Investment Pools.
As of June 30, 2016, the District had the following issuer concentration based on fair value:
Portfolio Asset
Security Type Fair Value Allocation
State Board of Administration:
Florida PRIME $5,109,656 35.28%
Debt Service Accounts 95,7869 0.66%
Intergovernmental Investment Pool
FEIT 9,214,752 63.63%
U.S. Treasury Bonds 61,938 0.43%
Total $14,482,132 100.00%
Foreign Currency Risk
The District investment policy does not allow for investments in foreign currency therefore the District has no exposure to foreign currency risk.
4. CHANGES IN CAPITAL ASSETS
Changes in capital assets are presented in the table below.
50

Balance Balance
July 1, 2015 Additions Deletions Transfers June 30, 2016
GOVERNMENTAL ACTIVITIES
Capital Assets Not Being Depreciated:
Land (660) 10,317,174$ -$ -$ -$ 10,317,174$
Total Capital Assets Not Being Depreciated 10,317,174 - - - 10,317,174
Capital Assets Being Depreciated:
Improvements Other Than Buildings (670) 28,523,062 21,359 - - 28,544,421
Buildings and Fixed Equipment (680) 476,807,427 1,063,774 477,871,201
Furniture, Fixtures, and Equipment (641/643/691) 38,030,803 875,413 14,185 38,892,031
Motor Vehicles (652 Vehicles) (651 Buses) 15,133,841 - - 15,133,841
Property Under Capital Leases - - - -
Total Capital Assets Being Depreciated 558,495,133 1,960,546 14,185 - 560,441,494
Less Accumulated Depreciation for:
Improvements Other Than Buildings 15,974,527 1,141,777 17,116,304
Buildings and Fixed Equipment 120,944,379 9,557,424 - 130,501,803
Furniture, Fixtures, and Equipment 36,057,324 125,097 14,185 36,168,236
Motor Vehicles 15,118,357 15,484 - 15,133,841
Property Under Capital Leases -
Total Accumulated Depreciation 188,094,587 10,839,782 14,185 - 198,920,184
Total Capital Assets Being Depreciated, Net 370,400,546 (8,879,236) - - 361,521,310
Governmental Activities Capital Assets, Net 380,717,720$ (8,879,236)$ -$ -$ 371,838,484$
DISTRICT SCHOOL BOARD OF HERNANDO COUNTY, FLORIDA NOTES TO FINANCIAL STATEMENTS
June 30, 2016
Depreciation expense was charged to functions as follows:
Function Amount
Governmental Activities
Facilities Acquisition & Construction 2,244
Food Services 3,335
Central Services 445
Operation of Plant 4,663
Maintenance of Plant 1,718
Transportation 2,248
Administrative Related Technology 831
Unallocated 10,824,298
Total Depreciation Expense - Governmental Activities 10,839,782$
51

DISTRICT SCHOOL BOARD OF HERNANDO COUNTY, FLORIDA NOTES TO FINANCIAL STATEMENTS
June 30, 2016
Balance at
June 30, 2016
Banc of America Public Capital Corp
4,860,254$
Fiscal Year
Ending June 30 Total Principal Interest
2017 1,347,189 1,261,601 85,588
2018 1,347,189 1,286,383 60,806
2019 1,347,189 1,311,651 35,537
2020 1,010,391 1,000,619 9,772
Total 5,051,957$ 4,860,254$ 191,703$
$14,419,695, was borrowed on 3-16-07, under provisions of Section
1013.23, Florida Statutes at an Interest rate of 3.83 percent.
Proceeds were used to refinance the purchase of energy savings
equipment. The ending principal balance was $6,403,131 before
refinancing on 3-17-15. $6,403,131 was borrowed at an interest rate
of 1.95 percent. This maturity date is 3-20-20.
5. NOTES PAYABLE
Notes payable is comprised of the following:
6. CERTIFICATES OF PARTICIPATION
The District entered into various financing arrangements each of which was characterized as a lease-purchase agreement, with the Florida School Boards Association, Inc., whereby the District secured financing of various educational facilities in the total amount of $30,000,000 for the Certificates of Participation, Series 2003A; $106,670,000 for the Certificates of Participation, Series 2005 and $29,162,000 for the Certificates of Participation, Series 2013A. The Certificates of Participation, Series 2013A were used to advance refund the outstanding Certificates of Participation, Series 2003A. The financings were accomplished through the issuance of Certificates of Participation to be repaid from the proceeds of rents paid by the District.
The District entered into a financing arrangement on June14, 2016, to advance refund the Certificates of Participation, Series 2005. The refunding was accomplished through the issuance of Certificates of Participation, Series 2016A,totaling $90,645,000, to be repaid by the proceeds of rents paid by the District.
On August 10, 2011, the Florida School Boards Association, Inc., irrevocably assigned to the Hernando School Board Leasing Corporation (Leasing Corporation) all of itsrights, title and interest under the Master Trust Agreement and the Ground Lease Agreements.
As a condition of the financing arrangement, the District has given ground leases on District property to the Leasing Corporation, with terms ranging from 20 to 30 years.
52

Series 2005 Certificates Series 2013 Certificates
Explorer K-8 School Challenger K-8 School Science and Mathematics
Winding Waters K-8 School
Grade Specific Additions at Pine Grove Elementary School,
West Hernando Middle School, and Central High School
Improvements and Additions to Hernando High School
Improvements and Additions to Springstead High School
Improvements and Additions to Spring Hill Elementary School
Fiscal Year Ending June 30 Total Principal Interest
2017 7,143,838$ 2,792,152$ 4,351,686$
2018 8,241,351 4,094,429$ 4,146,922$
2019 8,245,664 4,220,260$ 4,025,404$
2020 8,236,914 4,337,543$ 3,899,371$
2021 8,243,164 4,473,872$ 3,769,292$
2022-2026 42,453,178 26,086,412 16,366,766
2027-2031 43,276,500 33,295,000 9,981,500
2032-2035 34,612,850 32,165,000 2,447,850
Total Minimum Lease Payments 160,453,459 111,464,668 48,988,791
Unamortized COP Premiums 493,373 493,373
Total 160,946,832$ 111,958,041$ 48,988,791$
DISTRICT SCHOOL BOARD OF HERNANDO COUNTY, FLORIDA NOTES TO FINANCIAL STATEMENTS
June 30, 2016
The properties covered by the ground leases are, together with the improvements constructed thereon from the financing proceeds, leased back to the District. If the District fails to renew the lease and to provide for the rent payments through to term, the District may be required to surrender the sites included under the Ground Lease Agreements for the benefit of the securers of the Certificates for a period of time specified by the arrangement which may be up to 35 years from the date of inception of the arrangements.
The District properties included in the ground leases under this arrangement include land on which the projects have been constructed. The projects related to the ground leases are as follows:
The lease payments for the 2013A & 2016A Series are payable by the District, semiannually, on July 1 and January 1, at interest rates ranging from 2.08 to 5 percent. The payment of principal and interest on the bonds underlying the lease agreements are due on July 1 and January 1 of each year. The July 1 payment is typically made on or around June 15 and is considered to be a reduction of bond principal as of June 30.
The following is a schedule by years of future minimum lease payments under the lease agreements together with the present value of minimum lease payments as of June 30:
7. BONDS PAYABLE 53

DISTRICT SCHOOL BOARD OF HERNANDO COUNTY, FLORIDA NOTES TO FINANCIAL STATEMENTS
June 30, 2016
Original Debt Amount Interest Rates Annual
Bond Type Issue Amount Outstanding (Percent) Maturity To
State School Bonds:
Series 2009A, Refunding 370,000$ 95,000$ 5.0 2019
Series 2010A, Refunding 1,435,000 1,150,000 3.50 - 5.0 2030
Series 2011A, Refunding 365,000 285,000 3.0 - 5.0 2023
Series 2014A, Refunding 523,000 463,000 3.0 - 5.0 2025
Series 2014B, Refunding 1,299,000 927,000 2.0-5.0 2020
Subtotal 3,992,000 2,920,000
Unamortized Premium 792,352 355,266
State School Bonds 4,784,352 3,275,266
District Revenue Bonds:
Series 2001, Refunding 3,290,000 2,235,000 4.85 - 5.125 2031
Total Bonds Payable 8,074,352$ 5,510,266$
Bonds payable at June 30, 2016, are as follows:
The various bonds were issued to finance capital outlay projects of the District. The following is a description of the bonded debt issues:
State School Bonds
These bonds are issued by the State Board of Education (SBE) on behalf of the District. The bonds mature serially, and are secured by a pledge of the District's portion of the State-assessed motor vehicle license tax.
The State's full faith and credit is also pledged as security for these bonds. Principal and interest payments, investment of Debt Service Fund resources, and compliance with reserve requirements are administered by the SBE and the SBA.
District Revenue Bonds
Refunding and Capital Improvement Revenue Bonds, Series 2001. These bonds were issued in June 2001 to refund the Refunding and Improvement Revenue Bonds, Series 1992, and to finance the costs of various capital improvements within the school district. These bonds were authorized by Chapter 79-471, Laws of Florida, which provides that the bonds be secured from racetrack funds and jai alai fronton funds accruing annually to the District from the State’s Pari-mutuel Tax Collection Trust Fund pursuant to Chapter 550, Florida Statutes (effective July 1, 2000, tax
54

DISTRICT SCHOOL BOARD OF HERNANDO COUNTY, FLORIDA NOTES TO FINANCIAL STATEMENTS
June 30, 2016
Fiscal Year Ending June 30 Total Principal Interest
State School Bonds:
2017 673,640 563,000 110,640
2018 678,590 594,000 84,590
2019 290,140 233,000 57,140
2020 256,540 208,000 48,540
2021-2025 971,900 812,000 159,900
2026-2030 573,500 510,000 63,500
3,444,310 2,920,000 524,310
Unamortized Bond Premium 355,266 355,266
Total State School Bonds 3,799,576 3,275,266 524,310
District Revenue Bonds:
2017 205,372 95,000 110,372
2018 205,619 100,000 105,619
2019 205,622 105,000 100,622
2020 205,313 110,000 95,313
2021-2025 1,017,063 630,000 387,063
2026-2030 1,016,703 810,000 206,703
2031-2032 404,859 385,000 19,859
Total District Revenue Bonds 3,260,550 2,235,000 1,025,550
Total 7,060,126$ 5,510,266$ 1,549,860$
proceeds are distributed pursuant to Section 212.20(6)(d)7.a., Florida Statutes (2001), now Section 212.20(6)(d)6.a., Florida Statutes (2014). The annual distribution is remitted by the Florida Department of Financial Services to the District. The District has pledged as sole security for the bonds, the entire annual pari-mutuel tax proceeds of $209,750, which is remitted by the Florida Department of Financial Services to the District. The pledged revenue is committed until final maturity of the debt, or December 1, 2031. Approximately 98 percent of this revenue stream has been pledged in connection with the debt service on the revenue bonds. As required by the bond resolution, the District has established the sinking fund and reserve account and has accumulated and maintained adequate resources in the sinking fund and reserve account.
The Series 2001 bonds, totaling $3.3 million, were issued to provide funds, together with other available funds of the Board, sufficient to refund the District’s outstanding Refunding Revenue Bonds, Series 1990 and finance the costs of acquisition, construction, and installation of, and renovation to, certain capital improvements and educational facilities within the District, and pay costs associated with the issuance of the bonds.
Annual requirements to amortize all bonded debt outstanding as of June 30, 2016, are as follows:
55

DEFEASED DEBT
In prior years, the Board defeased in substance certain outstanding bonds by placing the proceeds of new bonds in irrevocable trusts to provide for all future debt service payments on the old bonds. Accordingly, the trust account assets and the liability for the in-substance defeased bonds are not included in the District’s financial statements.
On December 2, 2014, bond proceeds totaling $1,299,000 received for the issuance of the SBE Capital Outlay Bonds, 2014 Series B, refunded certain callable portions of the SBE Capital Outlay Bonds, 2005 Series A and 2005 Series B. Accordingly, $55,000 of the Series A and $1,400,000 of the Series B is considered defeased.
On June 30, 2016, bonds considered defeased in substance are as follows:
Amount
Bond Issues Outstanding
Refunding and Capital Improvement Revenue Bonds, Series 1992 640,000$
State School Bonds, Series 1999A 140,000
State School Bonds, Series 2003A 355,000
State School Bonds, Series 2004A 245,000
State School Bonds, Series 2005A 315,000
State School Bonds, Series 2004B 1,400,000
Total Defeased Debt 3,095,000$
Balance Balance
Description June 30, 2015 Additions Deductions June 30, 2016 Due in One Year
GOVERNMENTAL ACTIVITIES
Bonds Payable 5,772,000$ 617,000$ 5,155,000$ 658,000$
Unamortized Premium 430,466 75,200 355,266$ 75,200
Total Bonds Payable 6,202,466 - 692,200 5,510,266 733,200
Lease-Purchase Agreements Payable 122,636,690 90,645,000 101,817,022 111,464,668 2,792,152
Unamortized Premium 814,495 493,373 814,495 493,373 24,669
Total Certificates of Participation Payable 123,451,185 91,138,373 102,631,517 111,958,041 2,816,821
- - -
Note Payable 6,097,551 1,237,296 4,860,255 1,261,601
Other Post Employment Benefits 8,775,339 1,107,949 9,883,288 -
Net Pension Liability (1) 52,000,396 46,458,724 24,790,229 73,668,891
Compensated Absences Payable 14,443,594 954,391 13,489,203 1,000,000
Total Governmental Activities 158,970,135$ 92,246,322$ 105,515,404$ 145,701,053$ 5,811,622$
DISTRICT SCHOOL BOARD OF HERNANDO COUNTY, FLORIDA NOTES TO FINANCIAL STATEMENTS
June 30, 2016
8.
9. CHANGES IN LONG-TERM LIABILITIES
The following is a summary of changes in long-term liabilities:
56

DISTRICT SCHOOL BOARD OF HERNANDO COUNTY, FLORIDA NOTES TO FINANCIAL STATEMENTS
June 30, 2016
For the governmental activities, compensated absences, pensions, and other postemployment benefits are generally liquidated with resources of the General Fund.
10. FUND BALANCE REPORTING
GASB Statement No. 54, Fund Balance Reporting and Governmental Fund Type Definitions (GASB 54) provides a more structured classification of fund balance and to improve the usefulness of fund balance reporting to the users of the District’s financial statements. The reporting standard establishes a hierarchy for fund balance classifications and the constraints imposed on the uses of those resources.
GASB 54 provides two major types of fund balances, which are nonspendable and spendable. Nonspendable fund balances are balances that cannot be spent because they are not expected to be converted to cash or they are legally or contractually required to remain intact. Examples of this classification are prepaid items, inventories, and principal (corpus) of an endowment fund. The District has inventory items that are considered nonspendable. The District has no nonspendable funds related to endowment.
In addition to the nonspendable fund balance, GASB 54 has provided a hierarchy of the spendable fund balances, based on a hierarchy of spending constraints.
Restricted: Fund balances that are constrained by external parties, constitutional provisions, or enabling legislation.
Committed: Fund balances that contain constraints imposed by formal action of the government from its highest level of decision making authority. At the end of the fiscal year, there were no commitments.
Assigned: Fund balances that contain self-imposed constraints by the governing body to be used for a particular purpose.
Unassigned: Fund balance of the General Fund that is not constrained for any particular purpose.
The District has classified its fund balances with the following hierarchy:
Nonspendable: The District has inventories totaling $1,483,166 that are classified as nonspendable. Spendable: The District has classified the spendable fund balances as Restricted, Assigned, and Unassigned and considered each to have been spent when expenditures are incurred. The District currently has no fund balances classified as Committed.
Restricted for State Categorical Programs, Workforce Development, Food Services, Debt Service, and Capital Projects:
Federal Laws, Florida Statutes, and local ordinances require that specifically designated for the purposes of capital and debt service requirements and for certain designated State categorical spending. These funds have been included in the
57

Debt Local Other Nonmajor Total
Service Capital Capital Governmental Governmental
General Funds Improvement Projects Funds Funds
Fund Balances:
Nonspendable:
Inventory 1,570,675$ 132,059$ 1,702,734$
Long-Term Accounts Receivable -$
Other Not in Spendable Form -$
-$
Restricted:
State Categoricals 360,128 - 360,128$
Workforce Development 606,051 606,051$
Debt Service 13,904,053 371,250 14,275,303$
Capital Projects 10,776,737 4,505,507 467,699 15,749,943$
Food Services 3,800,569 3,800,569$
Assigned:
School Operations:
Encumbrances 152,272 1,298,543 - - 1,450,815$
DOE Obligations - - -$
Health Insurance Rebates & Profit Sharing 771,291 771,291$
- -$
Unassigned: 6,575,155 6,575,155$
Total Fund Balances 10,035,572$ 13,904,053$ 12,075,280$ 4,505,507$ 4,771,577$ 45,291,989$
Major Funds
DISTRICT SCHOOL BOARD OF HERNANDO COUNTY, FLORIDA NOTES TO FINANCIAL STATEMENTS
June 30, 2016
restricted category of fund balance. The restricted fund balance totaled $34,791,994 and represented $360,128 for State categorical programs, $606,051 for workforce development programs, $3,800,569 for food services, $14,275,303 for debt service, and $15,749,943 for capital projects.
Assigned for School Operations, Department Of Education (Department) Obligations, Health Insurance Rebates:
In accordance with Fund Balance Policy 7.11, the assigned fund balance includes amounts which are assigned for a specific purpose by the Board or by delegation to the Superintendent or his or her designee. The School Board has set aside certain spendable fund balance for school operations. At year end, the assigned general fund balance of $923,563 consists of $152,272 assigned for outstanding encumbrances for school operations and $771,291 assigned for health insurance rebates received to be used for premium increases.
Unassigned:
The unassigned fund balance for the General Fund is $6,575,155.
58

June 30, 2016
At the end of the fiscal year, the assigned/unassigned general fund balance was $7,498,718 or 4.71 percent of general fund revenues.
INTERFUND RECEIVABLES, PAYABLES, AND TRANSFERS
The following is a summary of interfund receivables and payables reported in the fund financial statements:
Funds Receivables Payables
Major Funds:
General 459,398$ -$
Other Federal Programs 459,398
ARRA Stimulas -
Nonmajor Governmental - -
Total Governmental Funds 459,398$ 459,398$
Interfund
Funds Transfers In Transfers Out
Major Funds:
General 5,068,054$ 1,655,417$
Other Debt 19,544,893 364,141$
Capital Projects:
Local Capital Improvement 5,068,054
Other Capital Outlay 252,340 17,833,563
Nonmajor Governmental 55,888
Total Governmental Funds 24,921,175$ 24,921,175$
Interfund
DISTRICT SCHOOL BOARD OF HERNANDO COUNTY, FLORIDA NOTES TO FINANCIAL STATEMENTS
11.
Interfund receivables and payables are temporary loans of cash between funds allowable under Section 1011.09, Florida Statutes, for a period of less than 13 months. The temporary loans do not restrict, impede, or limit implementation or fulfillment of the original purposes for which the moneys were received in the fund providing the advancement.
The following is a summary of interfund transfers reported in the fund financial statements:
Interfund transfers represent permanent transfers of moneys between funds. In general, funds are transferred from the General Fund and Capital Projects Funds to the Debt Service Funds for annual debt payments and from the Capital Projects Funds to the General Fund to assist in financing maintenance operations of the District and payment of property-casualty insurance premiums.
12. SCHEDULE OF STATE REVENUE SOURCES
59

DISTRICT SCHOOL BOARD OF HERNANDO COUNTY, FLORIDA NOTES TO FINANCIAL STATEMENTS
June 30, 2016
The following is a schedule of the District’s State revenue for the 2014-2015 fiscal year:
Source Amount
Florida Education Finance Program:
Transportation 4,763,892$
Instructional Materials 1,768,745
Florida Teachers Lead 362,603
Other 75,251,501
School Recognition 1,251,270
Categorical Educational Program - Class Size Reduction 23,405,339
Workforce Development Program 565,514
Motor Vehicle License Tax (Capital Outlay and Debt Service) 868,282
Food Service Supplement 136,634
Discretionary Lottery Funds -
Charter School Capital Outlay 19,687
Interest on Investment of Bond Reserves 2,749
Miscellaneous 1,433,415
Total 109,829,631$
Millages Taxes Levied
GENERAL FUND
Nonvoted School Tax:
Required Local Effort 4.948 39,996,145$
Required Local Effort -Prior Period Adj. 0.000
Basic Discretionary Local Effort 0.748 6,046,305$
CAPITAL PROJECTS FUNDS
Nonvoted Tax:
Local Capital Improvements 1.500 12,124,943
Total 7.196 58,167,393$
Accounting policies relating to certain State revenue sources are described in Note 1.
13. PROPERTY TAXES
The following is a summary of millages and taxes levied on the 2015 tax roll for 2015-2016 fiscal year:
14. RETIREMENT PLANS
60

DISTRICT SCHOOL BOARD OF HERNANDO COUNTY, FLORIDA NOTES TO FINANCIAL STATEMENTS
June 30, 2016
A. Florida Retirement System (FRS) – Defined Benefit Pension Plans
General Information about the FRS
The FRS was created in Chapter 121, Florida Statutes, to provide a defined benefit pension plan for participating public employees. The FRS was amended in 1998 to add the Deferred Retirement Option Program under the defined benefit plan and amended in 2000 to provide a defined contribution plan alternative to the defined benefit plan for FRS members effective July 1, 2002. This integrated defined contribution pension plan is the FRS Investment Plan. Chapter 112, Florida Statutes, established the Retiree HIS Program, a cost-sharing multiple-employer defined benefit pension plan, to assist retired members of any State-administered retirement system in paying the costs of health insurance.
Essentially all regular employees of the District are eligible to enroll as members of the State-administered FRS. Provisions relating to the FRS are established by Chapters 121 and 122, Florida Statutes; Chapter 112, Part IV, Florida Statutes; Chapter 238, Florida Statutes; and FRS Rules, Chapter 60S, Florida Administrative Code; wherein eligibility, contributions, and benefits are defined and described in detail. Such provisions may be amended at any time by further action from the Florida Legislature. The FRS is a single retirement system administered by the Florida Department of Management Services, Division of Retirement, and consists of the two cost-sharing, multiple-employer defined benefit plans and other nonintegrated programs. A comprehensive annual financial report of the FRS, which includes its financial statements, required supplementary information, actuarial report, and other relevant information, is available from the Florida Department of Management Services Web site (www.dms.myflorida.com).
The District’s pension expense totaled $5,588,867 for the fiscal year ended June 30, 2016.
FRS Pension Plan
Plan Description. The FRS Pension Plan (Plan) is a cost-sharing multiple-employer defined benefit pension plan, with a Deferred Retirement Option Program (DROP) for eligible employees. The general classes of membership are as follows:
Regular Class – Members of the FRS who do not qualify for membership in the other classes.
Elected County Officers Class – Members who hold specified elective offices in local government.
Senior Management Service Class (SMSC) – Members in senior management level positions
Employees enrolled in the Plan prior to July 1, 2011, vest at 6 years of creditable service and employees enrolled in the Plan on or after July 1, 2011, vest at 8 years of creditable service. All vested members, enrolled prior to July 1, 2011, are eligible for normal retirement benefits at age 62 or at any age after 30 years of service. All members
61

Class, Initial Enrollment, and Retirement Age/Years of Service % Value
Regular Class members initially enrolled before July 1, 2011
Retirement up to age 62 or up to 30 years of service 1.60
Retirement at age 63 or with 31 years of service 1.63
Retirement at age 64 or with 32 years of service 1.65
Retirement at age 65 or with 33 or more years of service 1.68
Regular Class members initially enrolled on or after July 1, 2011
Retirement up to age 65 or up to 33 years of service 1.60
Retirement at age 66 or with 34 years of service 1.63
Retirement at age 67 or with 35 years of service 1.65
Retirement at age 68 or with 36 or more years of service 1.68
Elected County Officers 3.00
Senior Management Service Class 2.00
DISTRICT SCHOOL BOARD OF HERNANDO COUNTY, FLORIDA NOTES TO FINANCIAL STATEMENTS
June 30, 2016
enrolled in the Plan on or after July 1, 2011, once vested, are eligible for normal retirement benefits at age 65 or any time after 33 years of creditable service. Members of the Plan may include up to 4 years of credit for military service toward creditable service. The Plan also includes an early retirement provision; however, there is a benefit reduction for each year a member retires before his or her normal retirement date. The Plan provides retirement, disability, death benefits, and annual cost-of-living adjustments to eligible participants.
DROP, subject to provisions of Section 121.091, Florida Statutes, permits employees eligible for normal retirement under the Plan to defer receipt of monthly benefit payments while continuing employment with an FRS participating employer. An employee may participate in DROP for a period not to exceed 60 months after electing to participate, except that certain instructional personnel may participate for up to 96 months. During the period of DROP participation, deferred monthly benefits are held in the FRS Trust Fund and accrue interest. The net pension liability does not include amounts for DROP participants, as these members are considered retired and are not accruing additional pension benefits.
Benefits Provided. Benefits under the Plan are computed on the basis of age and/or years of service, average final compensation, and service credit. Credit for each year of service is expressed as a percentage of the average final compensation. For members initially enrolled before July 1, 2011, the average final compensation is the average of the five highest fiscal years’ earnings; for members initially enrolled on or after July 1, 2011, the average final compensation is the average of the 8 highest fiscal years’ earnings. The total percentage value of the benefit received is determined by calculating the total value of all service, which is based on the retirement class to which the member belonged when the service credit was earned. Members are eligible for in-line-of-duty or regular disability and survivors’ benefits. The following chart shows the percentage value for each year of service credit earned:
62

DISTRICT SCHOOL BOARD OF HERNANDO COUNTY, FLORIDA NOTES TO FINANCIAL STATEMENTS
June 30, 2016
Percent of Gross Salary
Employee Employer (1)
Florida Retirement System, Regular 3.00 7.26
Florida Retirement System, Elected County Officers 3.00 42.27
Florida Retirement System, Senior Management Service 3.00 21.43
Deferred Retirement Option Program - Applicable to
Members from All of the Above Classes 0.00 12.88
Florida Retirement System, Reemployed Retiree (2) 4.31
Notes:
(1) Employer rates include 1.66 percent for the postemployment health insurance subsidy. Also,
employer rates, other than for DROP participants, include .04 percent for administrative costs
of the PEORP.
(2)
Class
Contribution rates are dependent upon the retirement class in which reemployed.
As provided in Section 121.101, Florida Statutes, if the member is initially enrolled in the FRS before July 1, 2011, and all service credit was accrued before July 1, 2011, the annual cost-of-living adjustment is 3 percent per year. If the member is initially enrolled before July 1, 2011, and has service credit on or after July 1, 2011, there is an individually calculated cost-of-living adjustment. The annual cost-of-living adjustment is a proportion of 3 percent determined by dividing the sum of the pre-July 2011 service credit by the total service credit at retirement multiplied by 3 percent. Plan members initially enrolled on or after July 1, 2011, will not have a cost-of-living adjustment after retirement.
Contributions. The Florida Legislature establishes contribution rates for participating employers and employees. Contribution rates during the 2015-2016 fiscal year were as follows:
Pension Liabilities, Pension Expense, and Deferred Outflows of Resources and Deferred Inflows of Resources Related to Pensions. At June 30, 2016, the District reported a liability of $18,654,686 for its proportionate share of the Plan’s net pension liability. The net pension liability was measured as of June 30, 2015, and the total pension liability used to calculate the net pension liability was determined by an actuarial valuation as of June 30, 2015. The District’s proportionate share of the net pension liability was based on the District’s 2014-2015 fiscal year contributions relative to the 2014-2015 fiscal year contributions of all participating members. At June 30, 2016, the District’s proportionate share was 0.275441373781394 percent, which was a decrease of 0.0001905893 from its proportionate share measured as of June 30, 2015.
For the fiscal year ended June 30, 2016, the District recognized the Plan pension expense of $4,078,203. In addition, the District reported deferred outflows of resources and deferred inflows of resources related to pensions from the following sources:
63

DISTRICT SCHOOL BOARD OF HERNANDO COUNTY, FLORIDA NOTES TO FINANCIAL STATEMENTS
June 30, 2016
Description
Differences between expected and
actual experience $ (843,777.00) $ 3,755,872
Change of assumptions 2,361,361
Net difference between projected and actual
earnings on FRS pension plan investments (8,494,874)
Changes in proportion and differences between
District FRS contributions and proportionate
share of contributions 5,588,867
District FRS contributions subsequent to
the measurement date (778,624)
Total $ (10,117,275) $ 11,706,100
Deferred Outflows
of Resources
Deferred Inflows
of Resources
The deferred outflows of resources related to pensions, totaling $5,588,867, resulting from District contributions to the Plan subsequent to the measurement date, will be recognized as a reduction of the net pension liability in the fiscal year ended June 30, 2016. Other amounts reported as deferred outflows of resources and deferred inflows of resources related to pensions will be recognized in pension expense as follows:
Fiscal Year Ending June 30
2016 $ (2,970,135)
2017 (2,970,135)
2018 (2,970,135)
2019 4,038,653
2020 658,808
Thereafter 212,902
Total $ (4,000,041)
Amount
Actuarial Assumptions. The total pension liability in the July 1, 2014 actuarial valuation was determined using the following actuarial assumptions, applied to all periods included in the measurement:
Inflation 2.60 percent
Salary Increases 3.25 percent, average, including inflation
Investment rate of return 7.65 percent, net of pension plan investment expense,
including inflation
Mortality rates were based on the Generational RP-2000 with Projection Scale BB.
64

DISTRICT SCHOOL BOARD OF HERNANDO COUNTY, FLORIDA NOTES TO FINANCIAL STATEMENTS
June 30, 2016
Compound
Annual Annual
Target Arithmetic (Geometric) Standard
Asset Class Allocation (1) Return Return Deviation
Cash 1.00% 3.11% 3.10% 1.65%
Intermediate-Term Bonds 18.00% 4.18% 4.05% 5.15%
High Yield Bonds 3.00% 6.79% 6.25% 10.95%
Broad US Equities 26.50% 8.51% 6.95% 18.90%
Developed Foreign Equities 21.20% 8.66% 6.85% 20.40%
Emerging Market Equities 5.30% 11.58% 7.60% 31.15%
Private Equity 6.00% 11.80% 8.11% 30.00%
Hedge Funds / Absolute Return 7.00% 5.81% 5.35% 10.00%
Real Estate (Property) 12.00% 7.11% 6.35% 13.00%
Total 100.00%
Assumed inflation - Mean 2.60% 2.00%
The actuarial assumptions used in the July 1, 2014, valuation were based on the results of an actuarial experience study for the period July 1, 2008, through June 30, 2013.
The long-term expected rate of return on pension plan investments was not based on historical returns, but instead is based on a forward-looking capital market economic model. The allocation policy’s description of each asset class was used to map the target allocation to the asset classes shown below. Each asset class assumption is based on a consistent set of underlying assumptions, and includes an adjustment for the inflation assumption. The target allocation and best estimates of arithmetic real rates of return for each major asset class are summarized in the following table:
Note: (1) As outlined in the Plan’s investment policy
Discount Rate. The discount rate used to measure the total pension liability was 7.65 percent. The Plan’s fiduciary net position was projected to be available to make all projected future benefit payments of current active and inactive employees. Therefore, the discount rate for calculating the total pension liability is equal to the long-term expected rate of return.
Sensitivity of the District’s Proportionate Share of the Net Position Liability to Changes in the Discount Rate. The following presents the District’s proportionate share of the net pension liability calculated using the discount rate of 7.65 percent, as well as what the District’s proportionate share of the net pension liability would be if it were calculated using a discount rate that is 1 percentage-point lower (6.65 percent) or 1 percentage-point higher (8.65 percent) than the current rate:
65

DISTRICT SCHOOL BOARD OF HERNANDO COUNTY, FLORIDA NOTES TO FINANCIAL STATEMENTS
June 30, 2016
1% Current 1%
Decrease Discount Rate Increase
(6.65%) (7.65%) (8.65%)
District's proportionate share of
the net pension liability 92,187,917$ 35,576,948$ (11,532,678)$
Pension Plan Fiduciary Net Position. Detailed information about the Plan’s fiduciary net position is available in the separately issued FRS Pension Plan and Other State-Administered Systems Comprehensive Annual Financial Report.
HIS Pension Plan
Plan Description. The HIS Pension Plan (HIS Plan) is a cost-sharing multiple-employer defined benefit pension plan established under Section 112.363, Florida Statutes, and may be amended by the Florida Legislature at any time. The benefit is a monthly payment to assist retirees of State-administered retirement systems in paying their health insurance costs and is administered by the Division of Retirement within the Florida Department of Management Services.
Benefits Provided. For the fiscal year ended June 30, 2016, eligible retirees and beneficiaries received a monthly HIS payment of $5 for each year of creditable service completed at the time of retirement, with a minimum HIS payment of $30 and a maximum HIS payment of $150 per month, pursuant to Section 112.363, Florida Statutes. To be eligible to receive a HIS Plan benefit, a retiree under a State-administered retirement system must provide proof of health insurance coverage, which may include Medicare.
Contributions. The HIS Plan is funded by required contributions from FRS participating employers as set by the Florida Legislature. Employer contributions are a percentage of gross compensation for all active FRS members. For the fiscal year ended June 30, 2016 the contribution rate was 1.26 percent of payroll pursuant to section 112.363, Florida Statutes. The District contributed 100 percent of its statutorily required contributions for the current and preceding 3 years. HIS Plan contributions are deposited in a separate trust fund from which payments are authorized. HIS Plan benefits are not guaranteed and are subject to annual legislative appropriation. In the event the legislative appropriation or available funds fail to provide full subsidy benefits to all participants, benefits may be reduced or canceled.
The District’s contributions to the HIS Plan totaled $1,583,194 for the fiscal year ended June 30, 2016.
Pension Liabilities, Pension Expense, and Deferred Outflows of Resources Related to Pensions. At June 30, 2016, the District reported a net pension liability of $38,091,943 for its proportionate share of the HIS Plan’s net pension liability. The current portion of
66
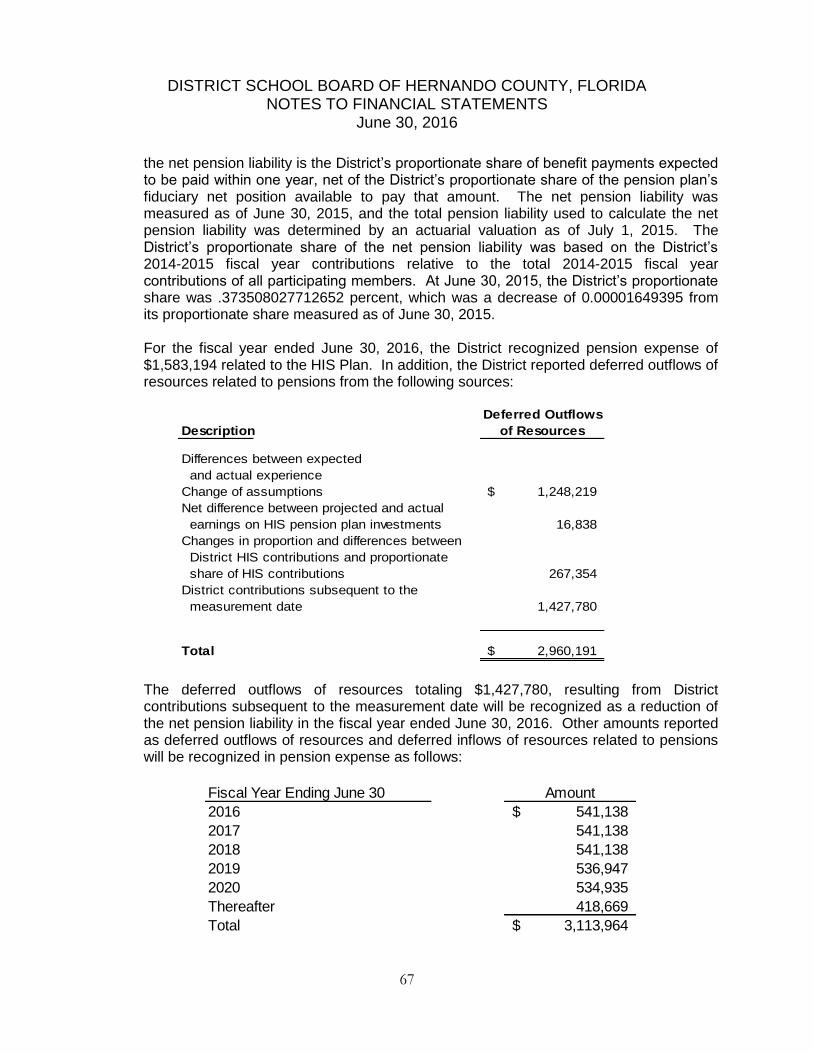
DISTRICT SCHOOL BOARD OF HERNANDO COUNTY, FLORIDA NOTES TO FINANCIAL STATEMENTS
June 30, 2016
the net pension liability is the District’s proportionate share of benefit payments expected to be paid within one year, net of the District’s proportionate share of the pension plan’s fiduciary net position available to pay that amount. The net pension liability was measured as of June 30, 2015, and the total pension liability used to calculate the net pension liability was determined by an actuarial valuation as of July 1, 2015. The District’s proportionate share of the net pension liability was based on the District’s 2014-2015 fiscal year contributions relative to the total 2014-2015 fiscal year contributions of all participating members. At June 30, 2015, the District’s proportionate share was .373508027712652 percent, which was a decrease of 0.00001649395 from its proportionate share measured as of June 30, 2015.
For the fiscal year ended June 30, 2016, the District recognized pension expense of $1,583,194 related to the HIS Plan. In addition, the District reported deferred outflows of resources related to pensions from the following sources:
Deferred Outflows
Description of Resources
Differences between expected
and actual experience
Change of assumptions 1,248,219$
Net difference between projected and actual
earnings on HIS pension plan investments 16,838
Changes in proportion and differences between
District HIS contributions and proportionate
share of HIS contributions 267,354
District contributions subsequent to the
measurement date 1,427,780
Total 2,960,191$
Fiscal Year Ending June 30 Amount
2016 541,138$
2017 541,138
2018 541,138
2019 536,947
2020 534,935
Thereafter 418,669
Total 3,113,964$
The deferred outflows of resources totaling $1,427,780, resulting from District contributions subsequent to the measurement date will be recognized as a reduction of the net pension liability in the fiscal year ended June 30, 2016. Other amounts reported as deferred outflows of resources and deferred inflows of resources related to pensions will be recognized in pension expense as follows:
67

DISTRICT SCHOOL BOARD OF HERNANDO COUNTY, FLORIDA NOTES TO FINANCIAL STATEMENTS
June 30, 2016
Actuarial Assumptions. The total pension liability in the July 1, 2014, actuarial valuation was determined using the following actuarial assumptions, applied to all periods included in the measurement:
Inflation 2.60 percent
Salary Increases 3.25 percent, average, including inflation
Municipal Bond Rate 4.29 percent
Mortality rates were based on the Generational RP-2000 with Projected Scale BB.
While an experience study had not been completed for the plan, the Florida Retirement System Actuarial Assumptions Conference reviewed the actuarial assumptions for the plan.
Discount Rate. The discount rate used to measure the total pension liability was 3.8 percent. In general, the discount rate for calculating the total pension liability is equal to the single rate equivalent to discounting at the long-term expected rate of return for benefit payments prior to the projected depletion date. Because the HIS benefit is essentially funded on a pay-as-you-go basis, the depletion date is considered to be immediate, and the single equivalent discount rate is equal to the municipal bond rate selected by the HIS Plan sponsor. The Bond Buyer General Obligation 20-Bond Municipal Bond Index was adopted as the applicable municipal bond index.
Sensitivity of the District’s Proportionate Share of the Net Pension Liability to Changes in the Discount Rate. The following presents the District’s proportionate share of the net pension liability calculated using the discount rate of 3.8 percent, as well as what the District’s proportionate share of the net pension liability would be if it were calculated using a discount rate that is 1-percentage-point lower (2.80 percent) or 1-percentage-point higher (4.80 percent) than the current rate:
Decrease Discount Rate Increase
(2.80%) (3.80%) (4.80%)
District's proportionate share of
the net pension liability 37,025,369$ 36,644,449$ 36,263,530$
Pension Plan Fiduciary Net Position. Detailed information about the HIS Plan’s fiduciary net position is available in the separately issued FRS Pension Plan and Other State Administered Systems Comprehensive Annual Financial Report.
B. FRS – Defined Contribution Pension Plan
The District contributes to the FRS Investment Plan (Investment Plan), a defined contribution pension plan, for its eligible employees electing to participate in the
68

DISTRICT SCHOOL BOARD OF HERNANDO COUNTY, FLORIDA NOTES TO FINANCIAL STATEMENTS
June 30, 2016
Investment Plan. The Investment Plan is administered by the SBA, and is reported in the SBA’s annual financial statements and in the State of Florida Comprehensive Annual Financial Report.
As provided in Section 121.4501, Florida Statutes, eligible FRS members may elect to participate in the Investment Plan in lieu of the FRS defined-benefit plan. District employees participating in DROP are not eligible to participate in the Investment Plan. Employer and employee contributions, including amounts contributed to individual member’s accounts, are defined by law, but the ultimate benefit depends in part on the performance of investment funds. Benefit terms, including contribution requirements, for the Investment Plan are established and may be amended by the Florida Legislature. The Investment Plan is funded with the same employer and employee contribution rates that are based on salary and membership class (Regular Class, Elected County Officers, etc.), as the FRS defined benefit plan. Contributions are directed to individual member accounts, and the individual members allocate contributions and account balances among various approved investment choices. Costs of administering plan, including the FRS Financial Guidance Program, are funded through an employer contribution of 0.04 percent of payroll and by forfeited benefits of plan members. Allocations to the investment member’s accounts during the 2015-2016 fiscal year were as follows:
Percent of
Gross
Class Compensation
FRS, Regular 6.30
FRS, Elected County Officers 11.34
FRS, Senior Management Service 7.67
For all membership classes, employees are immediately vested in their own contributions and are vested after 1 year of service for employer contributions and investment earnings. If an accumulated benefit obligation for service credit originally earned under the FRS Pension Plan is transferred to the Investment Plan, the member must have the years of service required for FRS Pension Plan vesting (including the service credit represented by the transferred funds) to be vested for these funds and the earnings on the funds. Nonvested employer contributions are placed in a suspense account for up to 5 years. If the employee returns to FRS-covered employment within the 5-year period, the employee will regain control over their account. If the employee does not return within the 5-year period, the employee will forfeit the accumulated account balance. For the fiscal year ended June 30, 2016, the information for the amount of forfeitures was unavailable from the SBA; however, management believes that these amounts, if any, would be immaterial to the District.
After termination and applying to receive benefits, the member may rollover vested funds to another qualified plan, structure a periodic payment under the Investment Plan, receive a lump-sum distribution, leave the funds invested for future distribution, or any combination of these options. Disability coverage is provided; the member may either transfer the account balance to the FRS Pension Plan when approved for disability retirement to receive guaranteed lifetime monthly benefits under the FRS Pension Plan,
69

DISTRICT SCHOOL BOARD OF HERNANDO COUNTY, FLORIDA NOTES TO FINANCIAL STATEMENTS
June 30, 2016
or remain in the Investment Plan and rely upon that account balance for retirement income.
The District’s Investment Plan pension expense totaled $1,165,922 for the fiscal year ended June 30, 2016.
15. OTHER POSTEMPLOYMENT BENEFITS PAYABLE
Plan Description. The Other Postemployment Benefits Plan (OPEB Plan) is a single-employer defined benefit plan administered by the District. Pursuant to the provisions of Section 112.0801, Florida Statutes, former employees who retire from the District and eligible dependents, may continue to participate in the District’s fully insured group health plan. The District subsidizes the premium rates paid by retirees by allowing them to participate in the Plan at blended group (implicitly subsidized) premium rates for both active and retired employees. These rates provide an implicit subsidy for retirees because, on an actuarial basis, their current and future claims are expected to result in higher costs to the Plan on average than those of active employees. Retirees are required to enroll in the Federal Medicare program for their primary coverage as soon as they are eligible. The Plan does not issue a stand-alone report and is not included in the report of a Public Employee Retirement System or another entity.
Funding Policy. Benefit provisions for the Plan are pursuant to provisions of Section 112.081, Florida Statutes, and are amended through negotiations between the District and the respective unions.
The District has not advance-funded or established a funding methodology for the annual Other Postemployment Benefit (OPEB) costs or the net OPEB obligation, and the Plan is financed on a pay-as-you-go basis. For the 2015-2016 fiscal year, 106 retirees received postemployment group healthcare benefits. The District’s contribution to the OPEB obligation is the implicit subsidy for the retirees, which was $262,693. Plan members receiving benefits contributed $826,046 through their required contributions ranging from $576 to $617 per month for retiree-only coverage and from $1,103 to $1,173 for retiree and spouse coverage, depending on health plan selected.
Annual OPEB Cost and Net OPEB Obligation. The District’s annual OPEB cost (expense) is calculated based on the annual required contribution (ARC), an amount actuarially determined in accordance with the parameters of Governmental Accounting Standards Board Statement No. 45, Accounting and Financial Reporting by Employers for Postemployment Benefits Other Than Pensions. The ARC represents a level of funding that is paid on an ongoing basis, is projected to cover normal cost each year and amortize any unfunded actuarial liabilities over a period not to exceed 30 years. The following table shows the District’s annual OPEB cost for the fiscal year, the amount actually contributed to the plan, and changes in the District’s net OPEB obligation for Postemployment Healthcare Benefits:
70
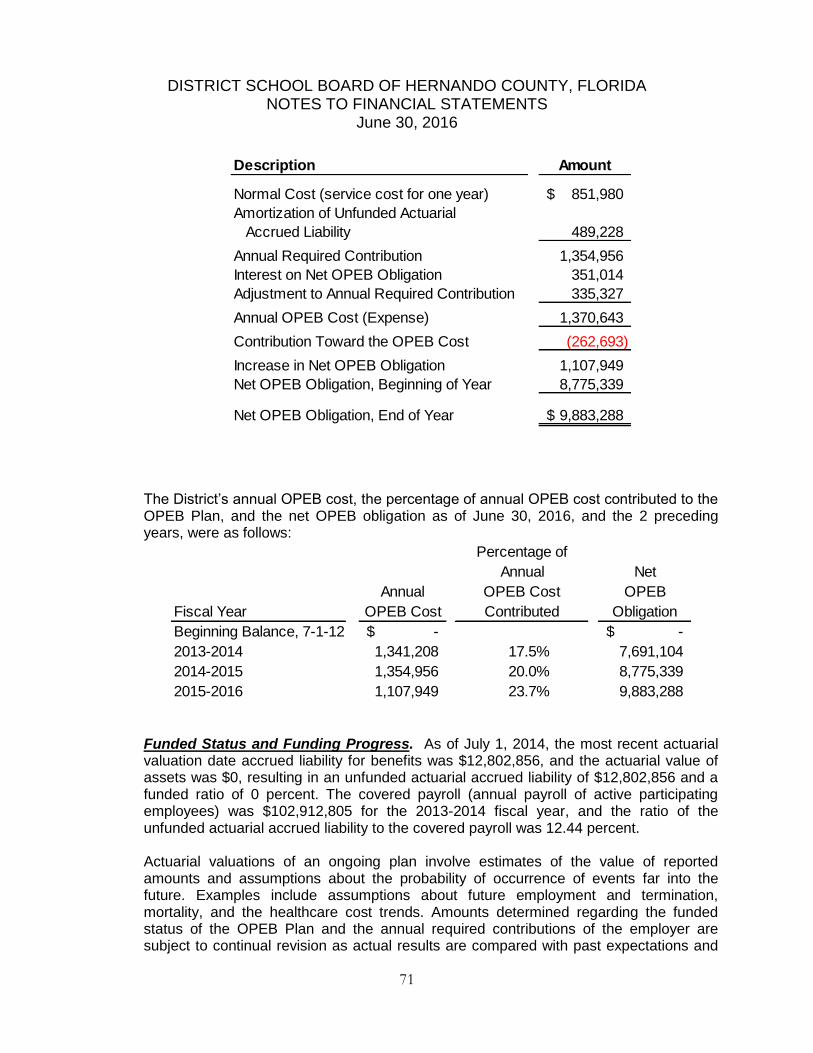
Description Amount
Normal Cost (service cost for one year) 851,980$
Amortization of Unfunded Actuarial
Accrued Liability 489,228
Annual Required Contribution 1,354,956
Interest on Net OPEB Obligation 351,014
Adjustment to Annual Required Contribution 335,327
Annual OPEB Cost (Expense) 1,370,643
Contribution Toward the OPEB Cost (262,693)
Increase in Net OPEB Obligation 1,107,949
Net OPEB Obligation, Beginning of Year 8,775,339
Net OPEB Obligation, End of Year 9,883,288$
Percentage of
Annual Net
Annual OPEB Cost OPEB
Fiscal Year OPEB Cost Contributed Obligation
Beginning Balance, 7-1-12 -$ -$
2013-2014 1,341,208 17.5% 7,691,104
2014-2015 1,354,956 20.0% 8,775,339
2015-2016 1,107,949 23.7% 9,883,288
DISTRICT SCHOOL BOARD OF HERNANDO COUNTY, FLORIDA NOTES TO FINANCIAL STATEMENTS
June 30, 2016
The District’s annual OPEB cost, the percentage of annual OPEB cost contributed to the OPEB Plan, and the net OPEB obligation as of June 30, 2016, and the 2 preceding years, were as follows:
Funded Status and Funding Progress. As of July 1, 2014, the most recent actuarial valuation date accrued liability for benefits was $12,802,856, and the actuarial value of assets was $0, resulting in an unfunded actuarial accrued liability of $12,802,856 and a funded ratio of 0 percent. The covered payroll (annual payroll of active participating employees) was $102,912,805 for the 2013-2014 fiscal year, and the ratio of the unfunded actuarial accrued liability to the covered payroll was 12.44 percent.
Actuarial valuations of an ongoing plan involve estimates of the value of reported amounts and assumptions about the probability of occurrence of events far into the future. Examples include assumptions about future employment and termination, mortality, and the healthcare cost trends. Amounts determined regarding the funded status of the OPEB Plan and the annual required contributions of the employer are subject to continual revision as actual results are compared with past expectations and
71

DISTRICT SCHOOL BOARD OF HERNANDO COUNTY, FLORIDA NOTES TO FINANCIAL STATEMENTS
June 30, 2016
new estimates are made about the future. The schedule of funding progress presents multiyear trend information about whether the actuarial value of the OPEB Plan assets is increasing or decreasing over time relative to the actuarial accrued liabilities for benefits. The schedule of funding progress can be found on page 82 of this report.
Actuarial Methods and Assumptions. Projections of benefits for financial reporting purposes are based on the substantive plan provisions, as understood by the employer and participating members, and include the types of benefits provided at the time of each valuation and the historical pattern of sharing of benefit costs between the employer and participating members. The actuarial methods and assumptions used include techniques that are designed to reduce the effects of short-term volatility in actuarial accrued liabilities and the actuarial value of the assets, consistent with the long-term perspective of the calculations.
The District’s OPEB actuarial valuation as of July 1, 2014, used the projected unit credit actuarial cost method to estimate the unfunded actuarial accrued liability as of June 30, 2016, and to estimate the District’s 2014-2015 fiscal year annual required contribution. Because the OPEB liability is currently unfunded, the actuarial assumption included a 4 percent rate of return on invested assets. The actuarial assumptions also included a payroll growth rate of 3 percent annually and an annual healthcare cost trend of 7.75 percent for the 2014-15 fiscal year, reduced by 0.5 percent per year, to an ultimate rate of 5 percent after 6 years. The unfunded actuarial accrued liability is being amortized as a level percentage of projected payrolls on an open basis over a 30-year period. The remaining amortization period at June 30, 2015, was 30 years.
16. COMMITMENTS
The District uses encumbrance accounting for recording purchase order commitments for goods and services. At June 30, 2016, encumbrances totaled $2,565,194 consisting of $152,272 within the General Fund, $1,298,543 within the Local Capital Improvement Fund, $567,895 within the Other Capital Projects Fund, and $546,483 within non-major governmental funds.
17. MEMBERSHIP IN NONPROFIT CORPORATION
The District participated in a nonprofit electric cooperative, the Withlacoochee River Electric Cooperative, Inc., established under the provisions of Chapter 425, Florida Statutes. In accordance with this statute, revenues in excess of operating expenses, unless determined by a vote of the membership, are distributed by the Cooperative on a pro rata basis to its members. The policy of the Cooperative is to credit the excess revenues to members’ accounts. Capital credits are distributed only after the Cooperative attains a certain margin of profit required by the Rural Electrification Administration. At June 30, 2016, the accumulated credits to the District’s account are $3,935,081. During the 2015-2016 fiscal year, the District received $141,052 in capital credits.
72

DISTRICT SCHOOL BOARD OF HERNANDO COUNTY, FLORIDA NOTES TO FINANCIAL STATEMENTS
June 30, 2016
18. RISK MANAGEMENT PROGRAMS
The District is exposed to various risks of loss related to torts; theft of, damage to, and destruction of assets; errors and omissions; injuries to employees; and natural disasters. The District is a participating district of the North East Florida Educational Consortium (Consortium) under which several district school boards have established a combined limited self-insurance program for property protection, general liability, automobile liability, workers’ compensation, money and securities, employee fidelity and faithful performance, boiler and machinery, and other coverage deemed necessary by the members and participants of the Consortium. Section 1001.42(12) (k), Florida Statutes, provides the authority for the District to enter into such a risk management program. The Consortium is self-sustaining through member and participant assessments (premiums), and purchases coverage through commercial companies for claims in excess of specified amounts. Reinsurance from commercial companies provided excess property coverage of up to $75 million during the 2015-2016 fiscal year, which is the same excess property coverage provided during the 2014-2015 fiscal year. The Board of Directors for the Consortium is composed of superintendents of all member districts. The Putnam County District School Board serves as fiscal agent for the Consortium.
Settled claims resulting from these risks have not exceeded commercial insurance coverage in any of the past 3 fiscal years.
Health and hospitalization coverage is being provided through purchased commercial insurance with minimum deductibles for each line of coverage. Settled claims resulting from these risks have not exceeded commercial coverage in any of the past 3 fiscal years.
19. LITIGATION AND CONTINGENCIES
The District is subject to potential litigation in the normal course of business. It is the opinion of management, after giving consideration to the District's related insurance coverage, as well as the Florida statutory limitations on governmental liability on uninsured risks, that the amount of losses resulting from litigation, which exceed the above-mentioned limits, would not be material to the financial position of the District.
Amounts received or receivable from grantors are subject to audit and adjustment by grantor agencies, principally the federal government. Any disallowed claims, including amounts already collected, may constitute a liability of the applicable funds. The amount, if any, of expenditures, which may be disallowed by grantors, cannot be determined at this time. In the opinion of the management of the District, no material refunds will be required as a result of expenditures disallowed by grantors.
73

ISSUED BY:

THE DISTRICT SCHOOL BOARD OF HERNANDO COUNTY, FLORIDA
SUPERINTENDENT’S ANNUAL FINANCIAL REPORT
FOR THE FISCAL YEAR ENDED JUNE 30, 2016
ISSUED BY:
SECTION IV
REQUIRED SUPPLEMENTARY INFORMATION

(THIS PAGE LEFT INTENTIONALLY BLANK)

Exhibit D-2a
Page 19
DISTRICT SCHOOL BOARD OF HERNANDO COUNTY
REQUIRED SUPPLEMENTARY INFORMATION -
SCHEDULE OF FUNDING PROGRESS
OTHER POSTEMPLOYMENT BENEFITS PLAN
June 30, 2016
UAAL as a
Actuarial Accrued Liability Percent
Actuarial Actuarial Value (AAL) Projected Unit Covered of Covered
Valuation of Assets Credit Unfunded AAL (UAAL) Funded Ratio Payroll Payroll
Date (a) (b) (b-a) (a/b) (c) [(b-a)/c]
7/1/2010 $ - $ 8,635,415 $ 8,635,415 0.00% $ 107,618,848 8.00%
7/1/2012 $ - $ 11,102,322 $ 11,102,322 0.00% $ 107,618,848 10.60%
7/1/2014 $ - $ 12,802,856 $ 12,802,856 0.00% $ 107,618,848 12.40%
7/1/2015 $ - $ 12,802,856 $ 12,802,856 0.00% $ 107,618,848 12.40%
ESE 145

Exhibit D-2b Page 20
DISTRICT SCHOOL BOARD OF COUNTY NOTES TO REQUIRED SUPPLEMENTARY INFORMATION For the Fiscal Year Ended
1. BUDGETARY BASIS OF ACCOUNTING
2. SCHEDULE OF FUNDING PROGRESS OTHER POSTEMPLOYMENT BENEFITS Ӎ
ESE 145

Exhibit E-1
Page 21
DISTRICT SCHOOL BOARD OF HERNANDO COUNTY
SCHEDULE OF REVENUES, EXPENDITURES AND CHANGES IN FUND BALANCES - BUDGET AND ACTUAL
GENERAL FUND
For the Fiscal Year Ended June 30, 2016
Account
Number
Budgeted Amounts
Actual
Amounts
Variance with
Final Budget -
Positive (Negative) Original Final
REVENUES
Federal Direct 3100 221,043.00 212,975.00 212,975.00 0.00
Federal Through State and Local 3200 375,000.00 663,611.00 663,611.00 0.00
State Sources 3300 108,491,343.00 107,865,117.00 107,865,117.00 0.00
Local Sources:
Property Taxes Levied, Tax Redemptions and Excess Fees for
Operational Purposes
3411, 3421,
3423 46,042,450.00 46,435,418.00 46,435,418.00 0.00
Property Taxes Levied, Tax Redemptions and Excess Fees for
Debt Service
3412, 3421,
3423 100,000.00 0.00 0.00 0.00
Property Taxes Levied, Tax Redemptions and Excess Fees for
Capital Projects
3413, 3421,
3423 0.00 0.00 0.00
Local Sales Taxes 3418, 3419 0.00 0.00 0.00
Charges for Service - Food Service 345X 0.00 0.00 0.00
Impact Fees 3496 0.00 0.00 0.00
Other Local Revenue 1,191,835.00 4,192,429.00 4,192,429.00 0.00
Total Local Sources 3400 47,334,285.00 50,627,847.00 50,627,847.00 0.00
Total Revenues 156,421,671.00 159,369,550.00 159,369,550.00 0.00
EXPENDITURES
Current:
Instruction 5000 104,019,154.00 103,110,541.00 103,110,541.00 0.00
Student Support Services 6100 6,235,843.00 6,504,626.00 6,504,626.00 0.00
Instructional Media Services 6200 2,176,621.00 1,848,730.00 1,848,730.00 0.00
Instruction and Curriculum Development Services 6300 947,682.00 1,561,452.00 1,561,452.00 0.00
Instructional Staff Training Services 6400 550,272.00 692,982.00 692,982.00 0.00
Instruction-Related Technology 6500 192,096.00 217,375.00 217,375.00 0.00
Board 7100 520,081.00 505,584.00 505,584.00 0.00
General Administration 7200 1,027,128.00 873,493.00 873,493.00 0.00
School Administration 7300 10,486,854.00 11,266,677.00 11,266,677.00 0.00
Facilities Acquisition and Construction 7410 494,493.00 317,215.00 317,215.00 0.00
Fiscal Services 7500 1,197,080.00 785,054.00 785,054.00 0.00
Food Services 7600 0.00 557.00 557.00 0.00
Central Services 7700 1,364,931.00 1,393,002.00 1,393,002.00 0.00
Student Transportation Services 7800 7,882,869.00 7,003,616.00 7,003,616.00 0.00
Operation of Plant 7900 15,269,356.00 14,607,003.00 14,607,003.00 0.00
Maintenance of Plant 8100 5,699,196.00 5,379,915.00 5,379,915.00 0.00
Administrative Technology Services 8200 2,560,124.00 2,602,849.00 2,602,849.00 0.00
Community Services 9100 3,885.00 6,159.00 6,159.00 0.00
Debt Service: (Function 9200)
Redemption of Principal 710 0.00 0.00 0.00
Interest 720 0.00 0.00 0.00
Due and Fees 730 0.00 0.00 0.00
Miscellaneous 790 0.00 0.00 0.00
Capital Outlay:
Facilities Acquisition and Construction 7420 494,493.00 126,925.00 126,925.00 0.00
Other Capital Outlay 9300 0.00 400,858.00 400,858.00 0.00
Total Expenditures 161,122,158.00 159,204,613.00 159,204,613.00 0.00
Excess (Deficiency) of Revenues Over (Under) Expenditures (4,700,487.00) 164,937.00 164,937.00 0.00
OTHER FINANCING SOURCES (USES)
Issuance of Bonds 3710 0.00 0.00 0.00
Premium on Sale of Bonds 3791 0.00 0.00 0.00
Discount on Sale of Bonds 891 0.00 0.00 0.00
Proceeds of Lease-Purchase Agreements 3750 0.00 0.00 0.00
Premium on Lease-Purchase Agreements 3793 0.00 0.00 0.00
Discount on Lease-Purchase Agreements 893 0.00 0.00 0.00
Loans 3720 0.00 0.00 0.00
Sale of Capital Assets 3730 0.00 0.00 0.00
Loss Recoveries 3740 50,000.00 59,145.00 59,145.00 0.00
Proceeds of Forward Supply Contract 3760 0.00 0.00 0.00
Face Value of Refunding Bonds 3715 0.00 0.00 0.00
Premium on Refunding Bonds 3792 0.00 0.00 0.00
Discount on Refunding Bonds 892 0.00 0.00 0.00
Refunding Lease-Purchase Agreements 3755 0.00 0.00 0.00
Premium on Refunding Lease-Purchase Agreements 3794 0.00 0.00 0.00
Discount on Refunding Lease-Purchase Agreements 894 0.00 0.00 0.00
Payments to Refunding Escrow Agent (Function 9299) 760 0.00 0.00 0.00
Transfers In 3600 5,300,000.00 5,068,054.00 5,068,054.00 0.00
Transfers Out 9700 (1,367,289.00) (1,655,417.00) (1,655,417.00) 0.00
Total Other Financing Sources (Uses) 3,982,711.00 3,471,782.00 3,471,782.00 0.00
SPECIAL ITEMS
__________________________________________ 0.00 0.00 0.00
EXTRAORDINARY ITEMS
__________________________________________ 0.00 0.00 0.00
Net Change in Fund Balances (717,776.00) 3,636,719.00 3,636,719.00 0.00
Fund Balances, July 1, 2015 2800 6,402,667.00 6,402,667.00 6,402,667.00 0.00
Adjustments to Fund Balances 2891 (3,814.00) (3,814.00) (3,814.00) 0.00
Fund Balances, June 30, 2016 2700 10,035,572.00 10,035,572.00 10,035,572.00 0.00
ESE 145

Exhibit E-2a
Page 22
DISTRICT SCHOOL BOARD OF HERNANDO COUNTY
SCHEDULE OF REVENUES, EXPENDITURES AND CHANGES IN FUND BALANCES - BUDGET AND ACTUAL
MAJOR SPECIAL REVENUE FUNDS - OTHER FEDERAL PROGRAMS
For the Fiscal Year Ended June 30, 2016
Account
Number
Budgeted Amounts
Actual
Amounts
Variance with
Final Budget -
Positive (Negative) Original Final
REVENUES
Federal Direct 3100 0.00 0.00 0.00
Federal Through State and Local 3200 11,770,360.00 11,833,607.00 11,833,607.00 0.00
State Sources 3300 0.00 0.00 0.00
Local Sources:
Property Taxes Levied, Tax Redemptions and Excess Fees for
Operational Purposes
3411, 3421,
3423 0.00 0.00
Property Taxes Levied, Tax Redemptions and Excess Fees for
Debt Service
3412, 3421,
3423 0.00 0.00
Property Taxes Levied, Tax Redemptions and Excess Fees for
Capital Projects
3413, 3421,
3423 0.00 0.00
Local Sales Taxes 3418, 3419 0.00 0.00
Charges for Service - Food Service 345X 0.00 0.00
Impact Fees 3496 0.00 0.00
Other Local Revenue 0.00 0.00
Total Local Sources 3400 0.00 0.00 0.00 0.00
Total Revenues 11,770,360.00 11,833,607.00 11,833,607.00 0.00
EXPENDITURES
Current:
Instruction 5000 3,580,594.00 3,427,412.00 3,427,412.00 0.00
Student Support Services 6100 1,890,387.00 2,142,638.00 2,142,638.00 0.00
Instructional Media Services 6200 0.00 0.00 0.00
Instruction and Curriculum Development Services 6300 2,940,070.00 2,822,817.00 2,822,817.00 0.00
Instructional Staff Training Services 6400 2,210,918.00 2,326,297.00 2,326,297.00 0.00
Instruction-Related Technology 6500 600,492.00 529,516.00 529,516.00 0.00
Board 7100 0.00 0.00 0.00
General Administration 7200 515,199.00 435,330.00 435,330.00 0.00
School Administration 7300 0.00 0.00 0.00
Facilities Acquisition and Construction 7410 0.00 0.00 0.00
Fiscal Services 7500 0.00 0.00 0.00
Food Services 7600 0.00 0.00 0.00
Central Services 7700 0.00 0.00 0.00
Student Transportation Services 7800 32,700.00 36,492.00 36,492.00 0.00
Operation of Plant 7900 0.00 0.00 0.00
Maintenance of Plant 8100 0.00 0.00 0.00
Administrative Technology Services 8200 0.00 0.00 0.00
Community Services 9100 0.00 0.00 0.00
Debt Service: (Function 9200)
Redemption of Principal 710 0.00 0.00
Interest 720 0.00 0.00
Dues and Fees 730 0.00 0.00
Miscellaneous 790 0.00 0.00
Capital Outlay:
Facilities Acquisition and Construction 7420 870.00 870.00 0.00
Other Capital Outlay 9300 112,235.00 112,235.00 0.00
Total Expenditures 11,770,360.00 11,833,607.00 11,833,607.00 0.00
Excess (Deficiency) of Revenues Over (Under) Expenditures 0.00 0.00 0.00 0.00
OTHER FINANCING SOURCES (USES)
Issuance of Bonds 3710 0.00 0.00
Premium on Sale of Bonds 3791 0.00 0.00
Discount on Sale of Bonds 891 0.00 0.00
Proceeds of Lease-Purchase Agreements 3750 0.00 0.00
Premium on Lease-Purchase Agreements 3793 0.00 0.00
Discount on Lease-Purchase Agreements 893 0.00 0.00
Loans 3720 0.00 0.00
Sale of Capital Assets 3730 0.00 0.00
Loss Recoveries 3740 0.00 0.00
Proceeds of Forward Supply Contract 3760 0.00 0.00
Face Value of Refunding Bonds 3715 0.00 0.00
Premium on Refunding Bonds 3792 0.00 0.00
Discount on Refunding Bonds 892 0.00 0.00
Refunding Lease-Purchase Agreements 3755 0.00 0.00
Premium on Refunding Lease-Purchase Agreements 3794 0.00 0.00
Discount on Refunding Lease-Purchase Agreements 894 0.00 0.00
Payments to Refunding Escrow Agent (Function 9299) 760 0.00 0.00
Transfers In 3600 0.00 0.00
Transfers Out 9700 0.00 0.00
Total Other Financing Sources (Uses) 0.00 0.00 0.00 0.00
SPECIAL ITEMS
__________________________________________ 0.00 0.00
EXTRAORDINARY ITEMS
__________________________________________ 0.00 0.00
Net Change in Fund Balances 0.00 0.00 0.00 0.00
Fund Balances, July 1, 2015 2800 0.00 0.00
Adjustments to Fund Balances 2891 0.00 0.00
Fund Balances, June 30, 2016 2700 0.00 0.00 0.00 0.00
ESE 145

Exhibit E-2b Page 23
DISTRICT SCHOOL BOARD OF HERNANDO COUNTY SCHEDULE OF REVENUES, EXPENDITURES AND CHANGES IN FUND BALANCES - BUDGET AND ACTUAL MAJOR DEBT SERVICE FUND - OTHER DEBT SERVICE For the Fiscal Year Ended June 30, 2016
Account Number
Budgeted Amounts Actual
Amounts
Variance with Final Budget -
Positive (Negative)Original Final REVENUES Federal Direct 3100 0.00 Federal Through State and Local 3200 0.00 State Sources 3300 0.00 Local Sources:
Property Taxes Levied, Tax Redemptions and Excess Fees for Operational Purposes
3411, 3421, 3423 0.00
Property Taxes Levied, Tax Redemptions and Excess Fees for Debt Service
3412, 3421, 3423 0.00
Property Taxes Levied, Tax Redemptions and Excess Fees for Capital Projects
3413, 3421, 3423 0.00
Local Sales Taxes 3418, 3419 0.00 Charges for Service - Food Service 345X 0.00 Impact Fees 3496 0.00 Other Local Revenue-Investments Earned 3433 0.00 (41.00) (41.00) 0.00 Total Local Sources 3400 0.00 (41.00) (41.00) 0.00
Total Revenues 0.00 (41.00) (41.00) 0.00 EXPENDITURES Current:
Instruction 5000 0.00 Student Support Services 6100 0.00 Instructional Media Services 6200 0.00 Instruction and Curriculum Development Services 6300 0.00 Instructional Staff Training Services 6400 0.00 Instruction-Related Technology 6500 0.00 Board 7100 0.00 General Administration 7200 0.00 School Administration 7300 0.00 Facilities Acquisition and Construction 7410 0.00 Fiscal Services 7500 0.00 Food Services 7600 0.00 Central Services 7700 0.00 Student Transportation Services 7800 0.00 Operation of Plant 7900 0.00 Maintenance of Plant 8100 0.00 Administrative Technology Services 8200 0.00 Community Services 9100 0.00
Debt Service: (Function 9200) Redemption of Principal 710 5,334,318.00 3,974,318.00 3,974,318.00 0.00 Interest 720 5,265,847.00 3,263,742.00 3,263,742.00 0.00 Dues and Fees 730 10,500.00 785,696.00 785,696.00 0.00 Miscellaneous 790 0.00
Capital Outlay: Facilities Acquisition and Construction 7420 0.00 Other Capital Outlay 9300 0.00
Total Expenditures 10,610,665.00 8,023,756.00 8,023,756.00 0.00 Excess (Deficiency) of Revenues Over (Under) Expenditures (10,610,665.00) (8,023,797.00) (8,023,797.00) 0.00 OTHER FINANCING SOURCES (USES) Issuance of Bonds 3710 0.00
Premium on Sale of Bonds 3791 0.00 Discount on Sale of Bonds 891 0.00
Proceeds of Lease-Purchase Agreements 3750 0.00 Premium on Lease-Purchase Agreements 3793 0.00 Discount on Lease-Purchase Agreements 893 0.00
Loans 3720 0.00 Sale of Capital Assets 3730 0.00 Loss Recoveries 3740 0.00 Proceeds of Forward Supply Contract 3760 0.00 Face Value of Refunding Bonds 3715 0.00 102,198,598.00 102,198,598.00 0.00
Premium on Refunding Bonds 3792 0.00 Discount on Refunding Bonds 892 0.00
Refunding Lease-Purchase Agreements 3755 0.00 Premium on Refunding Lease-Purchase Agreements 3794 0.00 Discount on Refunding Lease-Purchase Agreements 894 0.00
Payments to Refunding Escrow Agent (Function 9299) 760 0.00 (101,664,652.00) (101,664,652.00) 0.00 Transfers In 3600 10,609,103.00 19,544,893.00 19,544,893.00 0.00 Transfers Out 9700 0.00 (364,141.00) (364,141.00) 0.00 Total Other Financing Sources (Uses) 10,609,103.00 19,714,698.00 19,714,698.00 0.00 SPECIAL ITEMS __________________________________________ 0.00 EXTRAORDINARY ITEMS __________________________________________ 0.00 Net Change in Fund Balances (1,562.00) 11,690,901.00 11,690,901.00 0.00 Fund Balances, July 1, 2015 2800 2,213,152.00 2,213,152.00 2,213,152.00 0.00 Adjustments to Fund Balances 2891 0.00 Fund Balances, June 30, 2016 2700 2,211,590.00 13,904,053.00 13,904,053.00 0.00
ESE 145

Exhibit E-2c Page 24
DISTRICT SCHOOL BOARD OF HERNANDO COUNTY SCHEDULE OF REVENUES, EXPENDITURES AND CHANGES IN FUND BALANCES - BUDGET AND ACTUAL MAJOR CAPITAL PROJECTS FUND - NON VOTED CAP. IMPROVEMENTS (SEC 1011.71 (2), F.S. For the Fiscal Year Ended June 30, 2016
Account Number
Budgeted Amounts Actual
Amounts
Variance with Final Budget -
Positive (Negative)Original Final REVENUES Federal Direct 3100 0.00 Federal Through State and Local 3200 0.00 State Sources 3300 0.00 Local Sources:
Property Taxes Levied, Tax Redemptions and Excess Fees for Operational Purposes
3411, 3421, 3423 0.00 35,860.00 35,860.00 0.00
Property Taxes Levied, Tax Redemptions and Excess Fees for Debt Service
3412, 3421, 3423 0.00 0.00
Property Taxes Levied, Tax Redemptions and Excess Fees for Capital Projects
3413, 3421, 3423 12,124,943.00 12,193,142.00 12,193,142.00 0.00
Local Sales Taxes 3418, 3419 0.00 0.00 Charges for Service - Food Service 345X 0.00 0.00 Impact Fees 3496 0.00 0.00 Other Local Revenue- Interest Earnings 3430 10,000.00 38,941.00 38,941.00 0.00 Total Local Sources 3400 12,134,943.00 12,267,943.00 12,267,943.00 0.00
Total Revenues 12,134,943.00 12,267,943.00 12,267,943.00 0.00 EXPENDITURES Current:
Instruction 5000 0.00 Student Support Services 6100 0.00 Instructional Media Services 6200 0.00 Instruction and Curriculum Development Services 6300 0.00 Instructional Staff Training Services 6400 0.00 Instruction-Related Technology 6500 0.00 Board 7100 0.00 General Administration 7200 0.00 School Administration 7300 0.00 Facilities Acquisition and Construction 7410 7,567,497.00 6,220,211.00 6,220,211.00 0.00 Fiscal Services 7500 0.00 Food Services 7600 0.00 Central Services 7700 0.00 Student Transportation Services 7800 0.00 Operation of Plant 7900 0.00 Maintenance of Plant 8100 0.00 Administrative Technology Services 8200 0.00 Community Services 9100 0.00
Debt Service: (Function 9200) Redemption of Principal 710 0.00 Interest 720 0.00 Dues and Fees 730 0.00 Miscellaneous 790 0.00
Capital Outlay: Facilities Acquisition and Construction 7420 0.00 Other Capital Outlay 9300 0.00
Total Expenditures 7,567,497.00 6,220,211.00 6,220,211.00 0.00 Excess (Deficiency) of Revenues Over (Under) Expenditures 4,567,446.00 6,047,732.00 6,047,732.00 0.00 OTHER FINANCING SOURCES (USES) Issuance of Bonds 3710 0.00
Premium on Sale of Bonds 3791 0.00 Discount on Sale of Bonds 891 0.00
Proceeds of Lease-Purchase Agreements 3750 0.00 Premium on Lease-Purchase Agreements 3793 0.00 Discount on Lease-Purchase Agreements 893 0.00
Loans 3720 0.00 Sale of Capital Assets 3730 0.00 Loss Recoveries 3740 0.00 Proceeds of Forward Supply Contract 3760 0.00 Proceeds from Special Facility Construction Account 3770 0.00 Face Value of Refunding Bonds 3715 0.00
Premium on Refunding Bonds 3792 0.00 Discount on Refunding Bonds 892 0.00
Refunding Lease-Purchase Agreements 3755 0.00 Premium on Refunding Lease-Purchase Agreements 3794 0.00 Discount on Refunding Lease-Purchase Agreements 894 0.00
Payments to Refunding Escrow Agent (Function 9299) 760 0.00 Transfers In 3600 252,340.00 252,340.00 0.00 Transfers Out 9700 (5,300,000.00) (5,068,054.00) (5,068,054.00) 0.00 Total Other Financing Sources (Uses) (5,300,000.00) (4,815,714.00) (4,815,714.00) 0.00 SPECIAL ITEMS __________________________________________ 0.00 EXTRAORDINARY ITEMS __________________________________________ 0.00 Net Change in Fund Balances (732,554.00) 1,232,018.00 1,232,018.00 0.00 Fund Balances, July 1, 2015 2800 10,843,262.00 10,843,262.00 10,843,262.00 0.00 Adjustments to Fund Balances 2891 0.00 0.00 Fund Balances, June 30, 2016 2700 10,110,708.00 12,075,280.00 12,075,280.00 0.00
ESE 145

Exhibit E-2d
Page 25
DISTRICT SCHOOL BOARD OF HERNANDO COUNTY
SCHEDULE OF REVENUES, EXPENDITURES AND CHANGES IN FUND BALANCES - BUDGET AND ACTUAL
MAJOR CAPITAL PROJECTS FUND - OTHER CAPITAL PROJECTS
For the Fiscal Year Ended June 30, 2016
Account
Number
Budgeted Amounts
Actual
Amounts
Variance with
Final Budget -
Positive (Negative) Original Final
REVENUES
Federal Direct 3100 0.00
Federal Through State and Local 3200 0.00
State Sources 3300 50,000.00 61,819.00 61,819.00 0.00
Local Sources:
Property Taxes Levied, Tax Redemptions and Excess Fees for
Operational Purposes
3411, 3421,
3423 0.00
Property Taxes Levied, Tax Redemptions and Excess Fees for Debt
Service
3412, 3421,
3423 0.00
Property Taxes Levied, Tax Redemptions and Excess Fees for
Capital Projects
3413, 3421,
3423 0.00
Local Sales Taxes 3418, 3419 3,845,976.00 3,845,976.00 0.00
Charges for Service - Food Service 345X 0.00
Impact Fees 3496 160,673.00 160,673.00 0.00
Other Local Revenue 185,702.00 185,702.00 0.00
Total Local Sources 3400 0.00 4,192,351.00 4,192,351.00 0.00
Total Revenues 50,000.00 4,254,170.00 4,254,170.00 0.00
EXPENDITURES
Current:
Instruction 5000 0.00
Student Support Services 6100 0.00
Instructional Media Services 6200 0.00
Instruction and Curriculum Development Services 6300 0.00
Instructional Staff Training Services 6400 0.00
Instruction-Related Technology 6500 0.00
Board 7100 0.00
General Administration 7200 0.00
School Administration 7300 0.00
Facilities Acquisition and Construction 7410 0.00 754,771.00 754,771.00 0.00
Fiscal Services 7500 0.00
Food Services 7600 0.00
Central Services 7700 0.00
Student Transportation Services 7800 0.00
Operation of Plant 7900 0.00
Maintenance of Plant 8100 0.00
Administrative Technology Services 8200 0.00
Community Services 9100 0.00
Debt Service: (Function 9200)
Redemption of Principal 710 0.00
Interest 720 0.00
Dues and Fees 730 0.00
Miscellaneous 790 0.00
Capital Outlay:
Facilities Acquisition and Construction 7420 0.00
Other Capital Outlay 9300 0.00
Total Expenditures 0.00 754,771.00 754,771.00 0.00
Excess (Deficiency) of Revenues Over (Under) Expenditures 50,000.00 3,499,399.00 3,499,399.00 0.00
OTHER FINANCING SOURCES (USES)
Issuance of Bonds 3710 0.00
Premium on Sale of Bonds 3791 0.00
Discount on Sale of Bonds 891 0.00
Proceeds of Lease-Purchase Agreements 3750 0.00
Premium on Lease-Purchase Agreements 3793 0.00
Discount on Lease-Purchase Agreements 893 0.00
Loans 3720 0.00
Sale of Capital Assets 3730 0.00
Loss Recoveries 3740 0.00
Proceeds of Forward Supply Contract 3760 0.00
Proceeds from Special Facility Construction Account 3770 0.00
Face Value of Refunding Bonds 3715 0.00
Premium on Refunding Bonds 3792 0.00
Discount on Refunding Bonds 892 0.00
Refunding Lease-Purchase Agreements 3755 0.00
Premium on Refunding Lease-Purchase Agreements 3794 0.00
Discount on Refunding Lease-Purchase Agreements 894 0.00
Payments to Refunding Escrow Agent (Function 9299) 760 0.00
Transfers In 3600 0.00
Transfers Out 9700 (9,261,814.00) (17,833,563.00) (17,833,563.00) 0.00
Total Other Financing Sources (Uses) (9,261,814.00) (17,833,563.00) (17,833,563.00) 0.00
SPECIAL ITEMS
__________________________________________ 0.00
EXTRAORDINARY ITEMS
__________________________________________ 0.00
Net Change in Fund Balances (9,211,814.00) (14,334,164.00) (14,334,164.00) 0.00
Fund Balances, July 1, 2015 2800 18,839,671.00 18,839,671.00 18,839,671.00 0.00
Adjustments to Fund Balances 2891 (40,246.00) (40,246.00) (40,246.00) 0.00
Fund Balances, June 30, 2016 2700 4,425,015.00 4,425,015.00 4,425,015.00 0.00

ISSUED BY:

THE DISTRICT SCHOOL BOARD OF HERNANDO COUNTY, FLORIDA
SUPERINTENDENT’S ANNUAL FINANCIAL REPORT
FOR THE FISCAL YEAR ENDED JUNE 30, 2016
ISSUED BY:
SECTION V
COMBINING AND INDIVIDUAL FUND STATEMENTS AND SCHEDULES

ISSUED BY:

Exhibit F-1a Page 26
DISTRICT SCHOOL BOARD OF HERNANDO COUNTY COMBINING BALANCE SHEET NONMAJOR GOVERNMENTAL FUNDS June 30, 2016
Account Number
Special Revenue Funds Food
Services 410
Total Nonmajor Special Revenue
Funds ASSETS AND DEFERRED OUTFLOWS OF RESOURCES ASSETS Cash and Cash Equivalents 1110 4,009,289.00 4,009,289.00 Investments 1160 14,300.00 14,300.00 Taxes Receivable, Net 1120 0.00 0.00 Accounts Receivable, Net 1131 2,753.00 2,753.00 Interest Receivable on Investments 1170 0.00 0.00 Due From Other Agencies 1220 1,771.00 1,771.00 Due From Budgetary Funds 1141 0.00 0.00 Due From Insurer 1180 0.00 0.00 Deposits Receivable 1210 0.00 0.00 Due From Internal Funds 1142 0.00 0.00 Cash with Fiscal/Service Agents 1114 0.00 0.00 Inventory 1150 132,059.00 132,059.00 Prepaid Items 1230 0.00 0.00 Long-Term Investments 1460 0.00 0.00 Total Assets 4,160,172.00 4,160,172.00 DEFERRED OUTFLOWS OF RESOURCES Accumulated Decrease in Fair Value of Hedging Derivatives 1910 0.00 0.00 Total Deferred Outflows of Resources 0.00 0.00 Total Assets and Deferred Outflows of Resources 4,160,172.00 4,160,172.00 LIABILITIES, DEFERRED INFLOWS OF RESOURCES
AND FUND BALANCES LIABILITIES Cash Overdraft 2125 0.00 0.00 Accrued Salaries and Benefits 2110 0.00 0.00 Payroll Deductions and Withholdings 2170 0.00 0.00 Accounts Payable 2120 78,230.00 78,230.00 Sales Tax Payable 2260 0.00 0.00 Current Notes Payable 2250 0.00 0.00 Accrued Interest Payable 2210 0.00 0.00 Deposits Payable 2220 0.00 0.00 Due to Other Agencies 2230 0.00 0.00 Due to Budgetary Funds 2161 0.00 0.00 Due to Internal Funds 2162 0.00 0.00 Due to Fiscal Agent 2240 0.00 0.00 Pension Liability 2115 0.00 0.00 Other Postemployment Benefits Liability 2116 0.00 0.00 Judgments Payable 2130 0.00 0.00 Construction Contracts Payable 2140 0.00 0.00 Construction Contracts Payable - Retained Percentage 2150 0.00 0.00 Matured Bonds Payable 2180 0.00 0.00 Matured Interest Payable 2190 0.00 0.00 Unearned Revenues 2410 0.00 0.00 Unavailable Revenues 2410 0.00 0.00 Total Liabilities 78,230.00 78,230.00 DEFERRED INFLOWS OF RESOURCES Accumulated Increase in Fair Value of Hedging Derivatives 2610 0.00 0.00 Deferred Revenues 2630 149,314.00 149,314.00 Total Deferred Inflows of Resources 149,314.00 149,314.00 FUND BALANCES Nonspendable:
Inventory 2711 132,059.00 132,059.00 Prepaid Amounts 2712 0.00 0.00 Permanent Fund Principal 2713 0.00 0.00 Other Not in Spendable Form 2719 0.00 0.00
Total Nonspendable Fund Balances 2710 132,059.00 132,059.00 Restricted for:
Economic Stabilization 2721 0.00 0.00 Federal Required Carryover Programs 2722 0.00 0.00 State Required Carryover Programs 2723 0.00 0.00 Local Sales Tax and Other Tax Levy 2724 0.00 0.00 Debt Service 2725 0.00 0.00 Capital Projects 2726 0.00 0.00 Restricted for _________________ 2729 0.00 0.00 Restricted for _________________ 2729 3,800,569.00 3,800,569.00
Total Restricted Fund Balances 2720 3,800,569.00 3,800,569.00 Committed to:
Economic Stabilization 2731 0.00 0.00 Contractual Agreements 2732 0.00 0.00 Committed for ________________ 2739 0.00 0.00 Committed for ________________ 2739 0.00 0.00
Total Committed Fund Balances 2730 0.00 0.00 Assigned to:
Special Revenue 2741 0.00 0.00 Debt Service 2742 0.00 0.00 Capital Projects 2743 0.00 0.00 Permanent Fund 2744 0.00 0.00 Assigned for __________________ 2749 0.00 0.00 Assigned for __________________ 2749 0.00 0.00
Total Assigned Fund Balances 2740 0.00 0.00 Total Unassigned Fund Balances 2750 0.00 0.00
Total Fund Balances 2700 3,932,628.00 3,932,628.00 Total Liabilities, Deferred Inflows of Resources and Fund Balances 4,160,172.00 4,160,172.00
The notes to financial statements are an integral part of this statement. ESE 145

Exhibit F-1b Page 27
DISTRICT SCHOOL BOARD OF HERNANDO COUNTY COMBINING BALANCE SHEET (CONTINUED) NONMAJOR GOVERNMENTAL FUNDS June 30, 2016
Account Number
Debt Service Funds SBE/COBI
Bonds 210
Special Act Bonds
220
Total Nonmajor Debt Service
Funds ASSETS AND DEFERRED OUTFLOWS OF RESOURCES ASSETS Cash and Cash Equivalents 1110 0.00 299,326.00 299,326.00 Investments 1160 95,786.00 5,305.00 101,091.00 Taxes Receivable, Net 1120 0.00 0.00 0.00 Accounts Receivable, Net 1131 0.00 0.00 0.00 Interest Receivable on Investments 1170 0.00 0.00 0.00 Due From Other Agencies 1220 0.00 0.00 0.00 Due From Budgetary Funds 1141 0.00 0.00 0.00 Due From Insurer 1180 0.00 0.00 0.00 Deposits Receivable 1210 0.00 0.00 0.00 Due From Internal Funds 1142 0.00 0.00 0.00 Cash with Fiscal/Service Agents 1114 0.00 0.00 0.00 Inventory 1150 0.00 0.00 0.00 Prepaid Items 1230 0.00 0.00 0.00 Long-Term Investments 1460 0.00 0.00 0.00 Total Assets 95,786.00 304,631.00 400,417.00 DEFERRED OUTFLOWS OF RESOURCES Accumulated Decrease in Fair Value of Hedging Derivatives 1910 0.00 0.00 0.00 Total Deferred Outflows of Resources 0.00 0.00 0.00 Total Assets and Deferred Outflows of Resources 95,786.00 304,631.00 400,417.00 LIABILITIES, DEFERRED INFLOWS OF RESOURCES
AND FUND BALANCES LIABILITIES Cash Overdraft 2125 0.00 0.00 0.00 Accrued Salaries and Benefits 2110 0.00 0.00 0.00 Payroll Deductions and Withholdings 2170 0.00 0.00 0.00 Accounts Payable 2120 0.00 0.00 0.00 Sales Tax Payable 2260 0.00 0.00 0.00 Current Notes Payable 2250 0.00 0.00 0.00 Accrued Interest Payable 2210 29,167.00 0.00 29,167.00 Deposits Payable 2220 0.00 0.00 0.00 Due to Other Agencies 2230 0.00 0.00 0.00 Due to Budgetary Funds 2161 0.00 0.00 0.00 Due to Internal Funds 2162 0.00 0.00 0.00 Due to Fiscal Agent 2240 0.00 0.00 0.00 Pension Liability 2115 0.00 0.00 0.00 Other Postemployment Benefits Liability 2116 0.00 0.00 0.00 Judgments Payable 2130 0.00 0.00 0.00 Construction Contracts Payable 2140 0.00 0.00 0.00 Construction Contracts Payable - Retained Percentage 2150 0.00 0.00 0.00 Matured Bonds Payable 2180 0.00 0.00 0.00 Matured Interest Payable 2190 0.00 0.00 0.00 Unearned Revenues 2410 0.00 0.00 0.00 Unavailable Revenues 2410 0.00 0.00 0.00 Total Liabilities 29,167.00 0.00 29,167.00 DEFERRED INFLOWS OF RESOURCES Accumulated Increase in Fair Value of Hedging Derivatives 2610 0.00 0.00 0.00 Deferred Revenues 2630 0.00 0.00 0.00 Total Deferred Inflows of Resources 0.00 0.00 0.00 FUND BALANCES Nonspendable:
Inventory 2711 0.00 0.00 0.00 Prepaid Amounts 2712 0.00 0.00 0.00 Permanent Fund Principal 2713 0.00 0.00 0.00 Other Not in Spendable Form 2719 0.00 0.00 0.00
Total Nonspendable Fund Balances 2710 0.00 0.00 0.00 Restricted for:
Economic Stabilization 2721 0.00 0.00 0.00 Federal Required Carryover Programs 2722 0.00 0.00 0.00 State Required Carryover Programs 2723 0.00 0.00 0.00 Local Sales Tax and Other Tax Levy 2724 0.00 0.00 0.00 Debt Service 2725 66,619.00 304,631.00 371,250.00 Capital Projects 2726 0.00 0.00 0.00 Restricted for _________________ 2729 0.00 0.00 0.00 Restricted for _________________ 2729 0.00 0.00 0.00
Total Restricted Fund Balances 2720 66,619.00 304,631.00 371,250.00 Committed to:
Economic Stabilization 2731 0.00 0.00 0.00 Contractual Agreements 2732 0.00 0.00 0.00 Committed for ________________ 2739 0.00 0.00 0.00 Committed for ________________ 2739 0.00 0.00 0.00
Total Committed Fund Balances 2730 0.00 0.00 0.00 Assigned to:
Special Revenue 2741 0.00 0.00 0.00 Debt Service 2742 0.00 0.00 0.00 Capital Projects 2743 0.00 0.00 0.00 Permanent Fund 2744 0.00 0.00 0.00 Assigned for __________________ 2749 0.00 0.00 0.00 Assigned for __________________ 2749 0.00 0.00 0.00
Total Assigned Fund Balances 2740 0.00 0.00 0.00 Total Unassigned Fund Balances 2750 0.00 0.00 0.00
Total Fund Balances 2700 66,619.00 304,631.00 371,250.00 Total Liabilities, Deferred Inflows of Resources and Fund Balances 95,786.00 304,631.00 400,417.00
The notes to financial statements are an integral part of this statement. ESE 145

Exhibit F-1c Page 28
DISTRICT SCHOOL BOARD OF HERNANDO COUNTY COMBINING BALANCE SHEET (CONTINUED) NONMAJOR GOVERNMENTAL FUNDS June 30, 2016
Account Number
Capital Projects Funds Capital Outlay Bond Issues
(COBI) 310
Public Education Capital Outlay (PECO)
340
Capital Outlay and Debt Service
360
Total Nonmajor Capital Projects
Funds ASSETS AND DEFERRED OUTFLOWS OF RESOURCES ASSETS Cash and Cash Equivalents 1110 0.00 146,510.00 416,470.00 562,980.00 Investments 1160 1,245.00 0.00 4,064.00 5,309.00 Taxes Receivable, Net 1120 0.00 0.00 0.00 0.00 Accounts Receivable, Net 1131 0.00 0.00 0.00 0.00 Interest Receivable on Investments 1170 0.00 0.00 0.00 0.00 Due From Other Agencies 1220 0.00 0.00 5,832.00 5,832.00 Due From Budgetary Funds 1141 0.00 0.00 0.00 0.00 Due From Insurer 1180 0.00 0.00 0.00 0.00 Deposits Receivable 1210 0.00 0.00 0.00 0.00 Due From Internal Funds 1142 0.00 0.00 0.00 0.00 Cash with Fiscal/Service Agents 1114 0.00 0.00 0.00 0.00 Inventory 1150 0.00 0.00 0.00 0.00 Prepaid Items 1230 0.00 0.00 0.00 0.00 Long-Term Investments 1460 0.00 0.00 0.00 0.00 Total Assets 1,245.00 146,510.00 426,366.00 574,121.00 DEFERRED OUTFLOWS OF RESOURCES Accumulated Decrease in Fair Value of Hedging Derivatives 1910 0.00 0.00 0.00 0.00 Total Deferred Outflows of Resources 0.00 0.00 0.00 0.00 Total Assets and Deferred Outflows of Resources 1,245.00 146,510.00 426,366.00 574,121.00 LIABILITIES, DEFERRED INFLOWS OF RESOURCES
AND FUND BALANCES LIABILITIES Cash Overdraft 2125 0.00 0.00 0.00 0.00 Accrued Salaries and Benefits 2110 0.00 0.00 0.00 0.00 Payroll Deductions and Withholdings 2170 0.00 0.00 0.00 0.00 Accounts Payable 2120 0.00 100,590.00 0.00 100,590.00 Sales Tax Payable 2260 0.00 0.00 0.00 0.00 Current Notes Payable 2250 0.00 0.00 0.00 0.00 Accrued Interest Payable 2210 0.00 0.00 0.00 0.00 Deposits Payable 2220 0.00 0.00 0.00 0.00 Due to Other Agencies 2230 0.00 0.00 0.00 0.00 Due to Budgetary Funds 2161 0.00 0.00 0.00 0.00 Due to Internal Funds 2162 0.00 0.00 0.00 0.00 Due to Fiscal Agent 2240 0.00 0.00 0.00 0.00 Pension Liability 2115 0.00 0.00 0.00 0.00 Other Postemployment Benefits Liability 2116 0.00 0.00 0.00 0.00 Judgments Payable 2130 0.00 0.00 0.00 0.00 Construction Contracts Payable 2140 0.00 0.00 0.00 0.00 Construction Contracts Payable - Retained Percentage 2150 0.00 0.00 0.00 0.00 Matured Bonds Payable 2180 0.00 0.00 0.00 0.00 Matured Interest Payable 2190 0.00 0.00 0.00 0.00 Unearned Revenues 2410 0.00 0.00 0.00 0.00 Unavailable Revenues 2410 0.00 0.00 0.00 0.00 Total Liabilities 0.00 100,590.00 0.00 100,590.00 DEFERRED INFLOWS OF RESOURCES Accumulated Increase in Fair Value of Hedging Derivatives 2610 0.00 0.00 0.00 0.00 Deferred Revenues 2630 0.00 0.00 5,832.00 5,832.00 Total Deferred Inflows of Resources 0.00 0.00 5,832.00 5,832.00 FUND BALANCES Nonspendable:
Inventory 2711 0.00 0.00 0.00 0.00 Prepaid Amounts 2712 0.00 0.00 0.00 0.00 Permanent Fund Principal 2713 0.00 0.00 0.00 0.00 Other Not in Spendable Form 2719 0.00 0.00 0.00 0.00
Total Nonspendable Fund Balances 2710 0.00 0.00 0.00 0.00 Restricted for:
Economic Stabilization 2721 0.00 0.00 0.00 0.00 Federal Required Carryover Programs 2722 0.00 0.00 0.00 0.00 State Required Carryover Programs 2723 0.00 0.00 0.00 0.00 Local Sales Tax and Other Tax Levy 2724 0.00 0.00 0.00 0.00 Debt Service 2725 0.00 0.00 0.00 0.00 Capital Projects 2726 1,245.00 45,920.00 420,534.00 467,699.00 Restricted for _________________ 2729 0.00 0.00 0.00 0.00 Restricted for _________________ 2729 0.00 0.00 0.00 0.00
Total Restricted Fund Balances 2720 1,245.00 45,920.00 420,534.00 467,699.00 Committed to:
Economic Stabilization 2731 0.00 0.00 0.00 0.00 Contractual Agreements 2732 0.00 0.00 0.00 0.00 Committed for ________________ 2739 0.00 0.00 0.00 0.00 Committed for ________________ 2739 0.00 0.00 0.00 0.00
Total Committed Fund Balances 2730 0.00 0.00 0.00 0.00 Assigned to:
Special Revenue 2741 0.00 0.00 0.00 0.00 Debt Service 2742 0.00 0.00 0.00 0.00 Capital Projects 2743 0.00 0.00 0.00 0.00 Permanent Fund 2744 0.00 0.00 0.00 0.00 Assigned for __________________ 2749 0.00 0.00 0.00 0.00 Assigned for __________________ 2749 0.00 0.00 0.00 0.00
Total Assigned Fund Balances 2740 0.00 0.00 0.00 0.00 Total Unassigned Fund Balances 2750 0.00 0.00 0.00 0.00
Total Fund Balances 2700 1,245.00 45,920.00 420,534.00 467,699.00 Total Liabilities, Deferred Inflows of Resources and Fund Balances 1,245.00 146,510.00 426,366.00 574,121.00
The notes to financial statements are an integral part of this statement. ESE 145

Exhibit F-1d Page 29
DISTRICT SCHOOL BOARD OF HERNANDO COUNTY COMBINING BALANCE SHEET (CONTINUED) NONMAJOR GOVERNMENTAL FUNDS June 30, 2016
Total Nonmajor
Account Governmental Number Funds
ASSETS AND DEFERRED OUTFLOWS OF RESOURCES ASSETS Cash and Cash Equivalents 1110 4,871,595.00 Investments 1160 120,700.00 Taxes Receivable, Net 1120 0.00 Accounts Receivable, Net 1131 2,753.00 Interest Receivable on Investments 1170 0.00 Due From Other Agencies 1220 7,603.00 Due From Budgetary Funds 1141 0.00 Due From Insurer 1180 0.00 Deposits Receivable 1210 0.00 Due From Internal Funds 1142 0.00 Cash with Fiscal/Service Agents 1114 0.00 Inventory 1150 132,059.00 Prepaid Items 1230 0.00 Long-Term Investments 1460 0.00 Total Assets 5,134,710.00 DEFERRED OUTFLOWS OF RESOURCES Accumulated Decrease in Fair Value of Hedging Derivatives 1910 0.00 Total Deferred Outflows of Resources 0.00 Total Assets and Deferred Outflows of Resources 5,134,710.00 LIABILITIES, DEFERRED INFLOWS OF RESOURCES
AND FUND BALANCES LIABILITIES Cash Overdraft 2125 0.00 Accrued Salaries and Benefits 2110 0.00 Payroll Deductions and Withholdings 2170 0.00 Accounts Payable 2120 178,820.00 Sales Tax Payable 2260 0.00 Current Notes Payable 2250 0.00 Accrued Interest Payable 2210 29,167.00 Deposits Payable 2220 0.00 Due to Other Agencies 2230 0.00 Due to Budgetary Funds 2161 0.00 Due to Internal Funds 2162 0.00 Due to Fiscal Agent 2240 0.00 Pension Liability 2115 0.00 Other Postemployment Benefits Liability 2116 0.00 Judgments Payable 2130 0.00 Construction Contracts Payable 2140 0.00 Construction Contracts Payable - Retained Percentage 2150 0.00 Matured Bonds Payable 2180 0.00 Matured Interest Payable 2190 0.00 Unearned Revenues 2410 0.00 Unavailable Revenues 2410 0.00 Total Liabilities 207,987.00 DEFERRED INFLOWS OF RESOURCES Accumulated Increase in Fair Value of Hedging Derivatives 2610 0.00 Deferred Revenues 2630 155,146.00 Total Deferred Inflows of Resources 155,146.00 FUND BALANCES Nonspendable:
Inventory 2711 132,059.00 Prepaid Amounts 2712 0.00 Permanent Fund Principal 2713 0.00 Other Not in Spendable Form 2719 0.00
Total Nonspendable Fund Balances 2710 132,059.00 Restricted for:
Economic Stabilization 2721 0.00 Federal Required Carryover Programs 2722 0.00 State Required Carryover Programs 2723 0.00 Local Sales Tax and Other Tax Levy 2724 0.00 Debt Service 2725 371,250.00 Capital Projects 2726 467,699.00 Restricted for _________________ 2729 0.00 Restricted for _________________ 2729 3,800,569.00
Total Restricted Fund Balances 2720 4,639,518.00 Committed to:
Economic Stabilization 2731 0.00 Contractual Agreements 2732 0.00 Committed for ________________ 2739 0.00 Committed for ________________ 2739 0.00
Total Committed Fund Balances 2730 0.00 Assigned to:
Special Revenue 2741 0.00 Debt Service 2742 0.00 Capital Projects 2743 0.00 Permanent Fund 2744 0.00 Assigned for __________________ 2749 0.00 Assigned for __________________ 2749 0.00
Total Assigned Fund Balances 2740 0.00 Total Unassigned Fund Balances 2750 0.00
Total Fund Balances 2700 4,771,577.00 Total Liabilities, Deferred Inflows of Resources and Fund Balances 5,134,710.00
The notes to financial statements are an integral part of this statement. ESE 145

Exhibit F-2a Page 30
DISTRICT SCHOOL BOARD OF HERNANDO COUNTY COMBINING STATEMENT OF REVENUES, EXPENDITURES AND CHANGES IN FUND BALANCES NONMAJOR GOVERNMENTAL FUNDS For the Fiscal Year Ended June 30, 2016
Account Number
Special Revenue Funds Food
Services 410
Total Nonmajor Special Revenue
Funds REVENUES Federal Direct 3100 0.00 0.00 Federal Through State and Local 3200 9,706,267.00 9,706,267.00 State Sources 3300 136,634.00 136,634.00 Local Sources:
Property Taxes Levied, Tax Redemptions and Excess Fees for Operational Purposes
3411, 3421, 3423 0.00 0.00
Property Taxes Levied, Tax Redemptions and Excess Fees for Debt Service
3412, 3421, 3423 0.00 0.00
Property Taxes Levied, Tax Redemptions and Excess Fees for Capital Projects
3413, 3421, 3423 0.00 0.00
Local Sales Taxes 3418, 3419 0.00 0.00 Charges for Service - Food Service 345X 1,823,798.00 1,823,798.00 Impact Fees 3496 0.00 0.00 Other Local Revenue 29,924.00 29,924.00 Total Local Sources 3400 1,853,722.00 1,853,722.00
Total Revenues 11,696,623.00 11,696,623.00 EXPENDITURES Current:
Instruction 5000 0.00 0.00 Student Support Services 6100 0.00 0.00 Instructional Media Services 6200 0.00 0.00 Instruction and Curriculum Development Services 6300 0.00 0.00 Instructional Staff Training Services 6400 0.00 0.00 Instruction-Related Technology 6500 0.00 0.00 Board 7100 0.00 0.00 General Administration 7200 0.00 0.00 School Administration 7300 0.00 0.00 Facilities Acquisition and Construction 7410 0.00 0.00 Fiscal Services 7500 0.00 0.00 Food Services 7600 10,447,012.00 10,447,012.00 Central Services 7700 0.00 0.00 Student Transportation Services 7800 0.00 0.00 Operation of Plant 7900 0.00 0.00 Maintenance of Plant 8100 0.00 0.00 Administrative Technology Services 8200 0.00 0.00 Community Services 9100 0.00 0.00
Debt Service: (Function 9200) Redemption of Principal 710 0.00 0.00 Interest 720 0.00 0.00 Dues and Fees 730 0.00 0.00 Miscellaneous 790 0.00 0.00
Capital Outlay: Facilities Acquisition and Construction 7420 30,888.00 30,888.00 Other Capital Outlay 9300 201,146.00 201,146.00
Total Expenditures 10,679,046.00 10,679,046.00 Excess (Deficiency) of Revenues Over (Under) Expenditures 1,017,577.00 1,017,577.00 OTHER FINANCING SOURCES (USES) Issuance of Bonds 3710 0.00 0.00
Premium on Sale of Bonds 3791 0.00 0.00 Discount on Sale of Bonds 891 0.00 0.00
Proceeds of Lease-Purchase Agreements 3750 0.00 0.00 Premium on Lease-Purchase Agreements 3793 0.00 0.00 Discount on Lease-Purchase Agreements 893 0.00 0.00
Loans 3720 0.00 0.00 Sale of Capital Assets 3730 0.00 0.00 Loss Recoveries 3740 0.00 0.00 Proceeds of Forward Supply Contract 3760 0.00 0.00 Proceeds from Special Facility Construction Account 3770 0.00 0.00 Face Value of Refunding Bonds 3715 0.00 0.00
Premium on Refunding Bonds 3792 0.00 0.00 Discount on Refunding Bonds 892 0.00 0.00
Refunding Lease-Purchase Agreements 3755 0.00 0.00 Premium on Refunding Lease-Purchase Agreements 3794 0.00 0.00 Discount on Refunding Lease-Purchase Agreements 894 0.00 0.00
Payments to Refunding Escrow Agent (Function 9299) 760 0.00 0.00 Transfers In 3600 55,888.00 55,888.00 Transfers Out 9700 0.00 0.00 Total Other Financing Sources (Uses) 55,888.00 55,888.00 SPECIAL ITEMS __________________________________________ 0.00 0.00 EXTRAORDINARY ITEMS __________________________________________ 0.00 0.00 Net Change in Fund Balances 1,073,465.00 1,073,465.00 Fund Balances, July 1, 2015 2800 2,856,743.00 2,856,743.00 Adjustments to Fund Balances 2891 2,420.00 2,420.00 Fund Balances, June 30, 2016 2700 3,932,628.00 3,932,628.00
The notes to financial statements are an integral part of this statement. ESE 145

Exhibit F-2b Page 31
DISTRICT SCHOOL BOARD OF HERNANDO COUNTY COMBINING STATEMENT OF REVENUES, EXPENDITURES AND CHANGES IN FUND BALANCES (CONTINUED) NONMAJOR GOVERNMENTAL FUNDS For the Fiscal Year Ended June 30, 2016
Account Number
Debt Service Funds SBE/COBI
Bonds 210
Special Act Bonds
220
Total Nonmajor Debt Service
Funds REVENUES Federal Direct 3100 0.00 0.00 0.00 Federal Through State and Local 3200 0.00 0.00 0.00 State Sources 3300 672,208.00 209,750.00 881,958.00 Local Sources:
Property Taxes Levied, Tax Redemptions and Excess Fees for Operational Purposes
3411, 3421, 3423 0.00 0.00 0.00
Property Taxes Levied, Tax Redemptions and Excess Fees for Debt Service
3412, 3421, 3423 0.00 0.00 0.00
Property Taxes Levied, Tax Redemptions and Excess Fees for Capital Projects
3413, 3421, 3423 0.00 0.00 0.00
Local Sales Taxes 3418, 3419 0.00 0.00 0.00 Charges for Service - Food Service 345X 0.00 0.00 0.00 Impact Fees 3496 0.00 0.00 0.00 Other Local Revenue 0.00 349.00 349.00 Total Local Sources 3400 0.00 349.00 349.00
Total Revenues 672,208.00 210,099.00 882,307.00 EXPENDITURES Current:
Instruction 5000 0.00 0.00 0.00 Student Support Services 6100 0.00 0.00 0.00 Instructional Media Services 6200 0.00 0.00 0.00 Instruction and Curriculum Development Services 6300 0.00 0.00 0.00 Instructional Staff Training Services 6400 0.00 0.00 0.00 Instruction-Related Technology 6500 0.00 0.00 0.00 Board 7100 0.00 0.00 0.00 General Administration 7200 0.00 0.00 0.00 School Administration 7300 0.00 0.00 0.00 Facilities Acquisition and Construction 7410 0.00 0.00 0.00 Fiscal Services 7500 0.00 0.00 0.00 Food Services 7600 0.00 0.00 0.00 Central Services 7700 0.00 0.00 0.00 Student Transportation Services 7800 0.00 0.00 0.00 Operation of Plant 7900 0.00 0.00 0.00 Maintenance of Plant 8100 0.00 0.00 0.00 Administrative Technology Services 8200 0.00 0.00 0.00 Community Services 9100 0.00 0.00 0.00
Debt Service: (Function 9200) Redemption of Principal 710 527,000.00 90,000.00 617,000.00 Interest 720 163,329.00 114,825.00 278,154.00 Dues and Fees 730 209.00 575.00 784.00 Miscellaneous 790 0.00 0.00 0.00
Capital Outlay: Facilities Acquisition and Construction 7420 0.00 0.00 0.00 Other Capital Outlay 9300 0.00 0.00 0.00
Total Expenditures 690,538.00 205,400.00 895,938.00 Excess (Deficiency) of Revenues Over (Under) Expenditures (18,330.00) 4,699.00 (13,631.00) OTHER FINANCING SOURCES (USES) Issuance of Bonds 3710 0.00 0.00 0.00
Premium on Sale of Bonds 3791 0.00 0.00 0.00 Discount on Sale of Bonds 891 0.00 0.00 0.00
Proceeds of Lease-Purchase Agreements 3750 0.00 0.00 0.00 Premium on Lease-Purchase Agreements 3793 0.00 0.00 0.00 Discount on Lease-Purchase Agreements 893 0.00 0.00 0.00
Loans 3720 0.00 0.00 0.00 Sale of Capital Assets 3730 0.00 0.00 0.00 Loss Recoveries 3740 0.00 0.00 0.00 Proceeds of Forward Supply Contract 3760 0.00 0.00 0.00 Proceeds from Special Facility Construction Account 3770 0.00 0.00 0.00 Face Value of Refunding Bonds 3715 0.00 0.00 0.00
Premium on Refunding Bonds 3792 0.00 0.00 0.00 Discount on Refunding Bonds 892 0.00 0.00 0.00
Refunding Lease-Purchase Agreements 3755 0.00 0.00 0.00 Premium on Refunding Lease-Purchase Agreements 3794 0.00 0.00 0.00 Discount on Refunding Lease-Purchase Agreements 894 0.00 0.00 0.00
Payments to Refunding Escrow Agent (Function 9299) 760 0.00 0.00 0.00 Transfers In 3600 0.00 0.00 0.00 Transfers Out 9700 0.00 0.00 0.00 Total Other Financing Sources (Uses) 0.00 0.00 0.00 SPECIAL ITEMS __________________________________________ 0.00 0.00 0.00 EXTRAORDINARY ITEMS __________________________________________ 0.00 0.00 0.00 Net Change in Fund Balances (18,330.00) 4,699.00 (13,631.00) Fund Balances, July 1, 2015 2800 84,949.00 299,932.00 384,881.00 Adjustments to Fund Balances 2891 0.00 0.00 0.00 Fund Balances, June 30, 2016 2700 66,619.00 304,631.00 371,250.00
The notes to financial statements are an integral part of this statement. ESE 145

Exhibit F-2c Page 32
DISTRICT SCHOOL BOARD OF HERNANDO COUNTY COMBINING STATEMENT OF REVENUES, EXPENDITURES AND CHANGES IN FUND BALANCES (CONTINUED) NONMAJOR GOVERNMENTAL FUNDS For the Fiscal Year Ended June 30, 2016
Account Number
Capital Projects Funds Capital Outlay Bond Issues
(COBI) 310
Public Education Capital Outlay (PECO)
340
Capital Outlay and Debt Service
360
Total Nonmajor Capital Projects
Funds REVENUES Federal Direct 3100 0.00 0.00 0.00 0.00 Federal Through State and Local 3200 0.00 0.00 0.00 0.00 State Sources 3300 0.00 698,433.00 185,670.00 884,103.00 Local Sources:
Property Taxes Levied, Tax Redemptions and Excess Fees for Operational Purposes
3411, 3421, 3423 0.00 0.00 0.00 0.00
Property Taxes Levied, Tax Redemptions and Excess Fees for Debt Service
3412, 3421, 3423 0.00 0.00 0.00 0.00
Property Taxes Levied, Tax Redemptions and Excess Fees for Capital Projects
3413, 3421, 3423 0.00 0.00 0.00 0.00
Local Sales Taxes 3418, 3419 0.00 0.00 0.00 0.00 Charges for Service - Food Service 345X 0.00 0.00 0.00 0.00 Impact Fees 3496 0.00 0.00 0.00 0.00 Other Local Revenue 0.00 0.00 0.00 0.00 Total Local Sources 3400 0.00 0.00 0.00 0.00
Total Revenues 0.00 698,433.00 185,670.00 884,103.00 EXPENDITURES Current:
Instruction 5000 0.00 0.00 0.00 0.00 Student Support Services 6100 0.00 0.00 0.00 0.00 Instructional Media Services 6200 0.00 0.00 0.00 0.00 Instruction and Curriculum Development Services 6300 0.00 0.00 0.00 0.00 Instructional Staff Training Services 6400 0.00 0.00 0.00 0.00 Instruction-Related Technology 6500 0.00 0.00 0.00 0.00 Board 7100 0.00 0.00 0.00 0.00 General Administration 7200 0.00 0.00 0.00 0.00 School Administration 7300 0.00 0.00 0.00 0.00 Facilities Acquisition and Construction 7410 0.00 396,324.00 0.00 396,324.00 Fiscal Services 7500 0.00 0.00 0.00 0.00 Food Services 7600 0.00 0.00 0.00 0.00 Central Services 7700 0.00 0.00 0.00 0.00 Student Transportation Services 7800 0.00 0.00 0.00 0.00 Operation of Plant 7900 0.00 0.00 0.00 0.00 Maintenance of Plant 8100 0.00 0.00 0.00 0.00 Administrative Technology Services 8200 0.00 0.00 0.00 0.00 Community Services 9100 0.00 0.00 0.00 0.00
Debt Service: (Function 9200) Redemption of Principal 710 0.00 0.00 0.00 0.00 Interest 720 0.00 0.00 0.00 0.00 Dues and Fees 730 0.00 0.00 0.00 0.00 Miscellaneous 790 0.00 0.00 632.00 632.00
Capital Outlay: Facilities Acquisition and Construction 7420 0.00 296,206.00 0.00 296,206.00 Other Capital Outlay 9300 0.00 0.00 0.00 0.00
Total Expenditures 0.00 692,530.00 632.00 693,162.00 Excess (Deficiency) of Revenues Over (Under) Expenditures 0.00 5,903.00 185,038.00 190,941.00 OTHER FINANCING SOURCES (USES) Issuance of Bonds 3710 0.00 0.00 0.00 0.00
Premium on Sale of Bonds 3791 0.00 0.00 0.00 0.00 Discount on Sale of Bonds 891 0.00 0.00 0.00 0.00
Proceeds of Lease-Purchase Agreements 3750 0.00 0.00 0.00 0.00 Premium on Lease-Purchase Agreements 3793 0.00 0.00 0.00 0.00 Discount on Lease-Purchase Agreements 893 0.00 0.00 0.00 0.00
Loans 3720 0.00 0.00 0.00 0.00 Sale of Capital Assets 3730 0.00 0.00 0.00 0.00 Loss Recoveries 3740 0.00 0.00 0.00 0.00 Proceeds of Forward Supply Contract 3760 0.00 0.00 0.00 0.00 Proceeds from Special Facility Construction Account 3770 0.00 0.00 0.00 0.00 Face Value of Refunding Bonds 3715 0.00 0.00 0.00 0.00
Premium on Refunding Bonds 3792 0.00 0.00 0.00 0.00 Discount on Refunding Bonds 892 0.00 0.00 0.00 0.00
Refunding Lease-Purchase Agreements 3755 0.00 0.00 0.00 0.00 Premium on Refunding Lease-Purchase Agreements 3794 0.00 0.00 0.00 0.00 Discount on Refunding Lease-Purchase Agreements 894 0.00 0.00 0.00 0.00
Payments to Refunding Escrow Agent (Function 9299) 760 0.00 0.00 0.00 0.00 Transfers In 3600 0.00 0.00 0.00 0.00 Transfers Out 9700 0.00 0.00 0.00 0.00 Total Other Financing Sources (Uses) 0.00 0.00 0.00 0.00 SPECIAL ITEMS __________________________________________ 0.00 0.00 0.00 0.00 EXTRAORDINARY ITEMS __________________________________________ 0.00 0.00 0.00 0.00 Net Change in Fund Balances 0.00 5,903.00 185,038.00 190,941.00 Fund Balances, July 1, 2015 2800 1,245.00 40,017.00 235,496.00 276,758.00 Adjustments to Fund Balances 2891 0.00 0.00 0.00 0.00 Fund Balances, June 30, 2016 2700 1,245.00 45,920.00 420,534.00 467,699.00
The notes to financial statements are an integral part of this statement. ESE 145
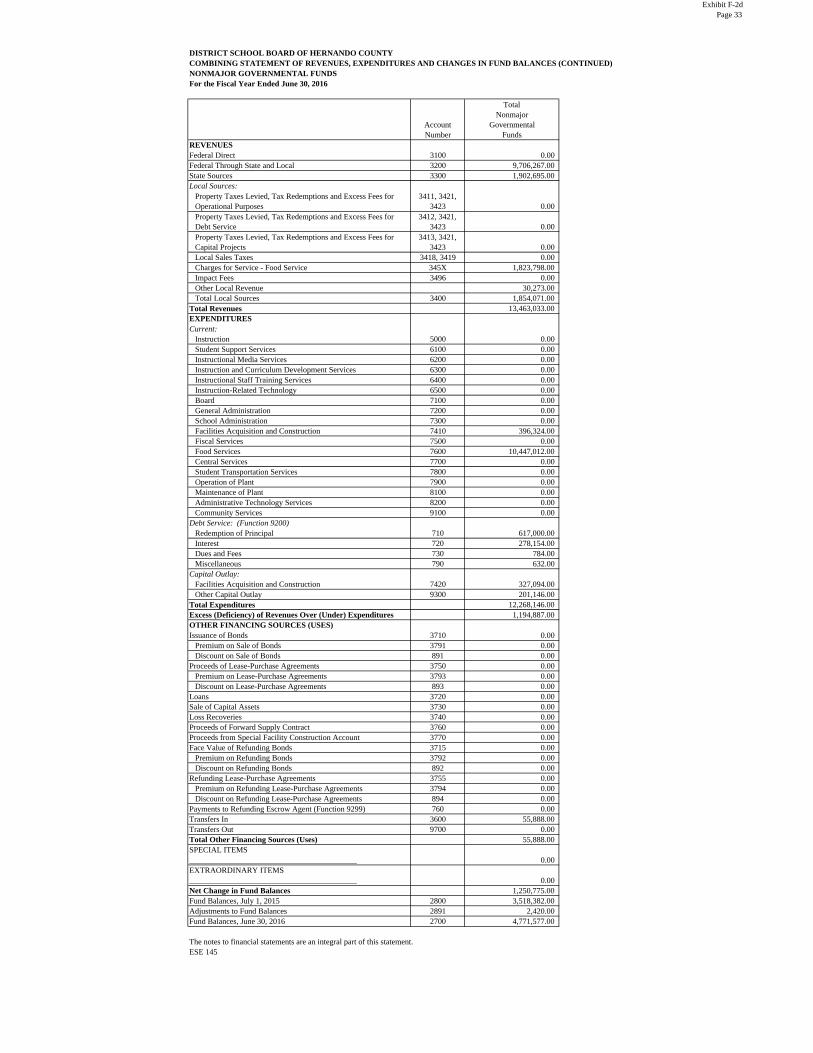
Exhibit F-2d Page 33
DISTRICT SCHOOL BOARD OF HERNANDO COUNTY COMBINING STATEMENT OF REVENUES, EXPENDITURES AND CHANGES IN FUND BALANCES (CONTINUED) NONMAJOR GOVERNMENTAL FUNDS For the Fiscal Year Ended June 30, 2016
Account Number
Total Nonmajor
Governmental Funds
REVENUES Federal Direct 3100 0.00 Federal Through State and Local 3200 9,706,267.00 State Sources 3300 1,902,695.00 Local Sources:
Property Taxes Levied, Tax Redemptions and Excess Fees for Operational Purposes
3411, 3421, 3423 0.00
Property Taxes Levied, Tax Redemptions and Excess Fees for Debt Service
3412, 3421, 3423 0.00
Property Taxes Levied, Tax Redemptions and Excess Fees for Capital Projects
3413, 3421, 3423 0.00
Local Sales Taxes 3418, 3419 0.00 Charges for Service - Food Service 345X 1,823,798.00 Impact Fees 3496 0.00 Other Local Revenue 30,273.00 Total Local Sources 3400 1,854,071.00
Total Revenues 13,463,033.00 EXPENDITURES Current:
Instruction 5000 0.00 Student Support Services 6100 0.00 Instructional Media Services 6200 0.00 Instruction and Curriculum Development Services 6300 0.00 Instructional Staff Training Services 6400 0.00 Instruction-Related Technology 6500 0.00 Board 7100 0.00 General Administration 7200 0.00 School Administration 7300 0.00 Facilities Acquisition and Construction 7410 396,324.00 Fiscal Services 7500 0.00 Food Services 7600 10,447,012.00 Central Services 7700 0.00 Student Transportation Services 7800 0.00 Operation of Plant 7900 0.00 Maintenance of Plant 8100 0.00 Administrative Technology Services 8200 0.00 Community Services 9100 0.00
Debt Service: (Function 9200) Redemption of Principal 710 617,000.00 Interest 720 278,154.00 Dues and Fees 730 784.00 Miscellaneous 790 632.00
Capital Outlay: Facilities Acquisition and Construction 7420 327,094.00 Other Capital Outlay 9300 201,146.00
Total Expenditures 12,268,146.00 Excess (Deficiency) of Revenues Over (Under) Expenditures 1,194,887.00 OTHER FINANCING SOURCES (USES) Issuance of Bonds 3710 0.00
Premium on Sale of Bonds 3791 0.00 Discount on Sale of Bonds 891 0.00
Proceeds of Lease-Purchase Agreements 3750 0.00 Premium on Lease-Purchase Agreements 3793 0.00 Discount on Lease-Purchase Agreements 893 0.00
Loans 3720 0.00 Sale of Capital Assets 3730 0.00 Loss Recoveries 3740 0.00 Proceeds of Forward Supply Contract 3760 0.00 Proceeds from Special Facility Construction Account 3770 0.00 Face Value of Refunding Bonds 3715 0.00
Premium on Refunding Bonds 3792 0.00 Discount on Refunding Bonds 892 0.00
Refunding Lease-Purchase Agreements 3755 0.00 Premium on Refunding Lease-Purchase Agreements 3794 0.00 Discount on Refunding Lease-Purchase Agreements 894 0.00
Payments to Refunding Escrow Agent (Function 9299) 760 0.00 Transfers In 3600 55,888.00 Transfers Out 9700 0.00 Total Other Financing Sources (Uses) 55,888.00 SPECIAL ITEMS __________________________________________ 0.00 EXTRAORDINARY ITEMS __________________________________________ 0.00 Net Change in Fund Balances 1,250,775.00 Fund Balances, July 1, 2015 2800 3,518,382.00 Adjustments to Fund Balances 2891 2,420.00 Fund Balances, June 30, 2016 2700 4,771,577.00
The notes to financial statements are an integral part of this statement. ESE 145

Exhibit G-1 Page 34
DISTRICT SCHOOL BOARD OF HERNANDO COUNTY SCHEDULE OF REVENUES, EXPENDITURES AND CHANGES IN FUND BALANCES - BUDGET AND ACTUAL NON MAJOR SPECIAL REVENUE FUNDS - OTHER FEDERAL PROGRAMS For the Fiscal Year Ended June 30, 2016
Account Number
Budgeted Amounts Actual
Amounts
Variance with Final Budget -
Positive (Negative)Original Final REVENUES Federal Direct 3100 0.00 Federal Through State and Local 3200 7,690,000.00 9,706,267.00 9,706,267.00 0.00 State Sources 3300 338,000.00 136,634.00 136,634.00 0.00 Local Sources:
Property Taxes Levied, Tax Redemptions and Excess Fees for Operational Purposes
3411, 3421, 3423 0.00
Property Taxes Levied, Tax Redemptions and Excess Fees for Debt Service
3412, 3421, 3423 0.00
Property Taxes Levied, Tax Redemptions and Excess Fees for Capital Projects
3413, 3421, 3423 0.00
Local Sales Taxes 3418, 3419 0.00 Charges for Service - Food Service 345X 2,527,000.00 1,844,892.00 1,844,892.00 0.00 Impact Fees 3496 0.00 Other Local Revenue- Miscellaneous 2,500.00 8,830.00 8,830.00 Total Local Sources 3400 2,529,500.00 1,853,722.00 1,853,722.00 0.00
Total Revenues 10,557,500.00 11,696,623.00 11,696,623.00 0.00 EXPENDITURES Current:
Instruction 5000 0.00 Student Support Services 6100 0.00 Instructional Media Services 6200 0.00 Instruction and Curriculum Development Services 6300 0.00 Instructional Staff Training Services 6400 0.00 Instruction-Related Technology 6500 0.00 Board 7100 0.00 General Administration 7200 0.00 School Administration 7300 0.00 Facilities Acquisition and Construction 7410 0.00 Fiscal Services 7500 0.00 Food Services 7600 10,176,055.00 10,679,046.00 10,679,046.00 0.00 Central Services 7700 0.00 Student Transportation Services 7800 0.00 Operation of Plant 7900 0.00 Maintenance of Plant 8100 0.00 Administrative Technology Services 8200 0.00 Community Services 9100 0.00
Debt Service: (Function 9200) Redemption of Principal 710 0.00 Interest 720 0.00 Dues and Fees 730 0.00 Miscellaneous 790 0.00
Capital Outlay: Facilities Acquisition and Construction 7420 0.00 Other Capital Outlay 9300 0.00
Total Expenditures 10,176,055.00 10,679,046.00 10,679,046.00 0.00 Excess (Deficiency) of Revenues Over (Under) Expenditures 381,445.00 1,017,577.00 1,017,577.00 0.00 OTHER FINANCING SOURCES (USES) Issuance of Bonds 3710 0.00
Premium on Sale of Bonds 3791 0.00 Discount on Sale of Bonds 891 0.00
Proceeds of Lease-Purchase Agreements 3750 0.00 Premium on Lease-Purchase Agreements 3793 0.00 Discount on Lease-Purchase Agreements 893 0.00
Loans 3720 0.00 Sale of Capital Assets 3730 0.00 Loss Recoveries 3740 0.00 Proceeds of Forward Supply Contract 3760 0.00 Face Value of Refunding Bonds 3715 0.00
Premium on Refunding Bonds 3792 0.00 Discount on Refunding Bonds 892 0.00
Refunding Lease-Purchase Agreements 3755 0.00 Premium on Refunding Lease-Purchase Agreements 3794 0.00 Discount on Refunding Lease-Purchase Agreements 894 0.00
Payments to Refunding Escrow Agent (Function 9299) 760 0.00 Transfers In 3600 20,000.00 55,888.00 55,888.00 0.00 Transfers Out 9700 0.00 Total Other Financing Sources (Uses) 20,000.00 55,888.00 55,888.00 0.00 SPECIAL ITEMS __________________________________________ 0.00 EXTRAORDINARY ITEMS __________________________________________ 0.00 Net Change in Fund Balances 401,445.00 1,073,465.00 1,073,465.00 0.00 Fund Balances, July 1, 2015 2800 2,856,743.00 2,856,743.00 2,856,743.00 0.00 Adjustments to Fund Balances 2891 2,420.00 2,420.00 2,420.00 0.00 Fund Balances, June 30, 2016 2700 3,260,608.00 3,932,628.00 3,932,628.00 0.00

Exhibit G-2 Page 35
DISTRICT SCHOOL BOARD OF HERNANDO COUNTY SCHEDULE OF REVENUES, EXPENDITURES AND CHANGES IN FUND BALANCES - BUDGET AND ACTUAL NON MAJOR DEBT SERVICE FUNDS - OTHER DEBT SERVICE For the Fiscal Year Ended June 30, 2016
Account Number
Budgeted Amounts Actual
Amounts
Variance with Final Budget -
Positive (Negative)Original Final REVENUES Federal Direct 3100 0.00 Federal Through State and Local 3200 0.00 State Sources 3300 700,000.00 672,208.00 672,208.00 0.00 Local Sources:
Property Taxes Levied, Tax Redemptions and Excess Fees for Operational Purposes
3411, 3421, 3423 0.00
Property Taxes Levied, Tax Redemptions and Excess Fees for Debt Service
3412, 3421, 3423 0.00
Property Taxes Levied, Tax Redemptions and Excess Fees for Capital Projects
3413, 3421, 3423 0.00
Local Sales Taxes 3418, 3419 0.00 Charges for Service - Food Service 345X 0.00 Impact Fees 3496 0.00 Other Local Revenue 0.00 Total Local Sources 3400 0.00 0.00 0.00 0.00
Total Revenues 700,000.00 672,208.00 672,208.00 0.00 EXPENDITURES Current:
Instruction 5000 0.00 Student Support Services 6100 0.00 Instructional Media Services 6200 0.00 Instruction and Curriculum Development Services 6300 0.00 Instructional Staff Training Services 6400 0.00 Instruction-Related Technology 6500 0.00 Board 7100 0.00 General Administration 7200 0.00 School Administration 7300 0.00 Facilities Acquisition and Construction 7410 0.00 Fiscal Services 7500 0.00 Food Services 7600 0.00 Central Services 7700 0.00 Student Transportation Services 7800 0.00 Operation of Plant 7900 0.00 Maintenance of Plant 8100 0.00 Administrative Technology Services 8200 0.00 Community Services 9100 0.00
Debt Service: (Function 9200) Redemption of Principal 710 527,000.00 527,000.00 527,000.00 0.00 Interest 720 163,330.00 163,329.00 163,329.00 0.00 Dues and Fees 730 5,500.00 209.00 209.00 0.00 Miscellaneous 790
Capital Outlay: Facilities Acquisition and Construction 7420 Other Capital Outlay 9300
Total Expenditures 695,830.00 690,538.00 690,538.00 0.00 Excess (Deficiency) of Revenues Over (Under) Expenditures 4,170.00 (18,330.00) (18,330.00) 0.00 OTHER FINANCING SOURCES (USES) Issuance of Bonds 3710
Premium on Sale of Bonds 3791 Discount on Sale of Bonds 891
Proceeds of Lease-Purchase Agreements 3750 Premium on Lease-Purchase Agreements 3793 Discount on Lease-Purchase Agreements 893
Loans 3720 Sale of Capital Assets 3730 Loss Recoveries 3740 Proceeds of Forward Supply Contract 3760 Face Value of Refunding Bonds 3715
Premium on Refunding Bonds 3792 Discount on Refunding Bonds 892
Refunding Lease-Purchase Agreements 3755 Premium on Refunding Lease-Purchase Agreements 3794 Discount on Refunding Lease-Purchase Agreements 894
Payments to Refunding Escrow Agent (Function 9299) 760 Transfers In 3600 Transfers Out 9700 Total Other Financing Sources (Uses) 0.00 0.00 0.00 0.00 SPECIAL ITEMS __________________________________________ EXTRAORDINARY ITEMS __________________________________________ Net Change in Fund Balances 4,170.00 (18,330.00) (18,330.00) 0.00 Fund Balances, July 1, 2015 2800 84,949.00 84,949.00 84,949.00 0.00 Adjustments to Fund Balances 2891 0.00 Fund Balances, June 30, 2016 2700 89,119.00 66,619.00 66,619.00 0.00
ESE 145

Exhibit G-3 Page 36
DISTRICT SCHOOL BOARD OF HERNANDO COUNTY SCHEDULE OF REVENUES, EXPENDITURES AND CHANGES IN FUND BALANCES - BUDGET AND ACTUAL CAPITAL PROJECTS FUND - NON VOTED CAPITAL IMPROVEMENT FUND For the Fiscal Year Ended June 30, 2016
Account Number
Budgeted Amounts Actual
Amounts
Variance with Final Budget -
Positive (Negative)Original Final REVENUES Federal Direct 3100 0.00 Federal Through State and Local 3200 0.00 State Sources 3300 0.00 Local Sources:
Property Taxes Levied, Tax Redemptions and Excess Fees for Operational Purposes
3411, 3421, 3423 0.00
Property Taxes Levied, Tax Redemptions and Excess Fees for Debt Service
3412, 3421, 3423 0.00
Property Taxes Levied, Tax Redemptions and Excess Fees for Capital Projects
3413, 3421, 3423 12,124,943.00 0.00
Local Sales Taxes 3418, 3419 0.00 Charges for Service - Food Service 345X 0.00 Impact Fees 3496 0.00 Other Local Revenue 3440 10,000.00 0.00 Total Local Sources 3400 12,134,943.00 0.00 0.00 0.00
Total Revenues 12,134,943.00 0.00 0.00 0.00 EXPENDITURES Current:
Instruction 5000 0.00 Student Support Services 6100 0.00 Instructional Media Services 6200 0.00 Instruction and Curriculum Development Services 6300 0.00 Instructional Staff Training Services 6400 0.00 Instruction-Related Technology 6500 0.00 Board 7100 0.00 General Administration 7200 0.00 School Administration 7300 0.00 Facilities Acquisition and Construction 7410 7,567,497.00 0.00 Fiscal Services 7500 0.00 Food Services 7600 0.00 Central Services 7700 0.00 Student Transportation Services 7800 0.00 Operation of Plant 7900 0.00 Maintenance of Plant 8100 0.00 Administrative Technology Services 8200 0.00 Community Services 9100 0.00
Debt Service: (Function 9200) Redemption of Principal 710 0.00 Interest 720 0.00 Dues and Fees 730 0.00 Miscellaneous 790 0.00
Capital Outlay: Facilities Acquisition and Construction 7420 0.00 Other Capital Outlay 9300 0.00
Total Expenditures 7,567,497.00 0.00 0.00 0.00 Excess (Deficiency) of Revenues Over (Under) Expenditures 4,567,446.00 0.00 0.00 0.00 OTHER FINANCING SOURCES (USES) Issuance of Bonds 3710 0.00
Premium on Sale of Bonds 3791 0.00 Discount on Sale of Bonds 891 0.00
Proceeds of Lease-Purchase Agreements 3750 0.00 Premium on Lease-Purchase Agreements 3793 0.00 Discount on Lease-Purchase Agreements 893 0.00
Loans 3720 0.00 Sale of Capital Assets 3730 0.00 Loss Recoveries 3740 0.00 Proceeds of Forward Supply Contract 3760 0.00 Proceeds from Special Facility Construction Account 3770 0.00 Face Value of Refunding Bonds 3715 0.00
Premium on Refunding Bonds 3792 0.00 Discount on Refunding Bonds 892 0.00
Refunding Lease-Purchase Agreements 3755 0.00 Premium on Refunding Lease-Purchase Agreements 3794 0.00 Discount on Refunding Lease-Purchase Agreements 894 0.00
Payments to Refunding Escrow Agent (Function 9299) 760 0.00 Transfers In 3600 0.00 Transfers Out 9700 (5,300,000.00) 0.00 Total Other Financing Sources (Uses) (5,300,000.00) 0.00 0.00 0.00 SPECIAL ITEMS __________________________________________ 0.00 EXTRAORDINARY ITEMS __________________________________________ 0.00 Net Change in Fund Balances (732,554.00) 0.00 0.00 0.00 Fund Balances, July 1, 2015 2800 10,843,262.00 0.00 Adjustments to Fund Balances 2891 0.00 Fund Balances, June 30, 2016 2700 10,110,708.00 0.00 0.00 0.00
ESE 145

Exhibit G-3 Page 37
DISTRICT SCHOOL BOARD OF HERNANDO COUNTY SCHEDULE OF REVENUES, EXPENDITURES AND CHANGES IN FUND BALANCES - BUDGET AND ACTUAL CAPITAL PROJECTS FUNDS - CAPITAL OUTLAY BOND ISSUES (COBI) For the Fiscal Year Ended June 30, 2016
Account Number
Budgeted Amounts Actual
Amounts
Variance with Final Budget -
Positive (Negative)Original Final REVENUES Federal Direct 3100 0.00 Federal Through State and Local 3200 0.00 State Sources 3300 0.00 Local Sources:
Property Taxes Levied, Tax Redemptions and Excess Fees for Operational Purposes
3411, 3421, 3423 0.00
Property Taxes Levied, Tax Redemptions and Excess Fees for Debt Service
3412, 3421, 3423 0.00
Property Taxes Levied, Tax Redemptions and Excess Fees for Capital Projects
3413, 3421, 3423 0.00 0.00
Local Sales Taxes 3418, 3419 0.00 Charges for Service - Food Service 345X 0.00 Impact Fees 3496 0.00 Other Local Revenue 3440 0.00 0.00 Total Local Sources 3400 0.00 0.00 0.00 0.00
Total Revenues 0.00 0.00 0.00 0.00 EXPENDITURES Current:
Instruction 5000 0.00 Student Support Services 6100 0.00 Instructional Media Services 6200 0.00 Instruction and Curriculum Development Services 6300 0.00 Instructional Staff Training Services 6400 0.00 Instruction-Related Technology 6500 0.00 Board 7100 0.00 General Administration 7200 0.00 School Administration 7300 0.00 Facilities Acquisition and Construction 7410 0.00 0.00 Fiscal Services 7500 0.00 Food Services 7600 0.00 Central Services 7700 0.00 Student Transportation Services 7800 0.00 Operation of Plant 7900 0.00 Maintenance of Plant 8100 0.00 Administrative Technology Services 8200 0.00 Community Services 9100 0.00
Debt Service: (Function 9200) Redemption of Principal 710 0.00 Interest 720 0.00 Dues and Fees 730 0.00 Miscellaneous 790 0.00
Capital Outlay: Facilities Acquisition and Construction 7420 0.00 Other Capital Outlay 9300 0.00
Total Expenditures 0.00 0.00 0.00 0.00 Excess (Deficiency) of Revenues Over (Under) Expenditures 0.00 0.00 0.00 0.00 OTHER FINANCING SOURCES (USES) Issuance of Bonds 3710 0.00
Premium on Sale of Bonds 3791 0.00 Discount on Sale of Bonds 891 0.00
Proceeds of Lease-Purchase Agreements 3750 0.00 Premium on Lease-Purchase Agreements 3793 0.00 Discount on Lease-Purchase Agreements 893 0.00
Loans 3720 0.00 Sale of Capital Assets 3730 0.00 Loss Recoveries 3740 0.00 Proceeds of Forward Supply Contract 3760 0.00 Proceeds from Special Facility Construction Account 3770 0.00 Face Value of Refunding Bonds 3715 0.00
Premium on Refunding Bonds 3792 0.00 Discount on Refunding Bonds 892 0.00
Refunding Lease-Purchase Agreements 3755 0.00 Premium on Refunding Lease-Purchase Agreements 3794 0.00 Discount on Refunding Lease-Purchase Agreements 894 0.00
Payments to Refunding Escrow Agent (Function 9299) 760 0.00 Transfers In 3600 0.00 Transfers Out 9700 0.00 0.00 Total Other Financing Sources (Uses) 0.00 0.00 0.00 0.00 SPECIAL ITEMS __________________________________________ 0.00 EXTRAORDINARY ITEMS __________________________________________ 0.00 Net Change in Fund Balances 0.00 0.00 0.00 0.00 Fund Balances, July 1, 2015 2800 1,245.00 1,245.00 1,245.00 0.00 Adjustments to Fund Balances 2891 0.00 Fund Balances, June 30, 2016 2700 1,245.00 1,245.00 1,245.00 0.00
ESE 145

Exhibit G-3b Page 38
DISTRICT SCHOOL BOARD OF HERNANDO COUNTY SCHEDULE OF REVENUES, EXPENDITURES AND CHANGES IN FUND BALANCES - BUDGET AND ACTUAL NON MAJOR CAPITAL PROJECTS FUND - PUBLIC CAPITAL OUTLAY (PECO) For the Fiscal Year Ended June 30, 2016
Account Number
Budgeted Amounts Actual
Amounts
Variance with Final Budget -
Positive (Negative)Original Final REVENUES Federal Direct 3100 0.00 Federal Through State and Local 3200 0.00 State Sources 3300 674,542.00 698,433.00 698,433.00 0.00 Local Sources:
Property Taxes Levied, Tax Redemptions and Excess Fees for Operational Purposes
3411, 3421, 3423 0.00
Property Taxes Levied, Tax Redemptions and Excess Fees for Debt Service
3412, 3421, 3423 0.00
Property Taxes Levied, Tax Redemptions and Excess Fees for Capital Projects
3413, 3421, 3423 0.00
Local Sales Taxes 3418, 3419 0.00 Charges for Service - Food Service 345X 0.00 Impact Fees 3496 0.00 Other Local Revenue 0.00 Total Local Sources 3400 0.00 0.00 0.00 0.00
Total Revenues 674,542.00 698,433.00 698,433.00 0.00 EXPENDITURES Current:
Instruction 5000 0.00 Student Support Services 6100 0.00 Instructional Media Services 6200 0.00 Instruction and Curriculum Development Services 6300 0.00 Instructional Staff Training Services 6400 0.00 Instruction-Related Technology 6500 0.00 Board 7100 0.00 General Administration 7200 0.00 School Administration 7300 0.00 Facilities Acquisition and Construction 7410 292,915.00 692,530.00 692,530.00 0.00 Fiscal Services 7500 0.00 Food Services 7600 0.00 Central Services 7700 0.00 Student Transportation Services 7800 0.00 Operation of Plant 7900 0.00 Maintenance of Plant 8100 0.00 Administrative Technology Services 8200 0.00 Community Services 9100 0.00
Debt Service: (Function 9200) Redemption of Principal 710 0.00 Interest 720 0.00 Dues and Fees 730 0.00 Miscellaneous 790 0.00
Capital Outlay: Facilities Acquisition and Construction 7420 0.00 Other Capital Outlay 9300 0.00
Total Expenditures 292,915.00 692,530.00 692,530.00 0.00 Excess (Deficiency) of Revenues Over (Under) Expenditures 381,627.00 5,903.00 5,903.00 0.00 OTHER FINANCING SOURCES (USES) Issuance of Bonds 3710 0.00
Premium on Sale of Bonds 3791 0.00 Discount on Sale of Bonds 891 0.00
Proceeds of Lease-Purchase Agreements 3750 0.00 Premium on Lease-Purchase Agreements 3793 0.00 Discount on Lease-Purchase Agreements 893 0.00
Loans 3720 0.00 Sale of Capital Assets 3730 0.00 Loss Recoveries 3740 0.00 Proceeds of Forward Supply Contract 3760 0.00 Proceeds from Special Facility Construction Account 3770 0.00 Face Value of Refunding Bonds 3715 0.00
Premium on Refunding Bonds 3792 0.00 Discount on Refunding Bonds 892 0.00
Refunding Lease-Purchase Agreements 3755 0.00 Premium on Refunding Lease-Purchase Agreements 3794 0.00 Discount on Refunding Lease-Purchase Agreements 894 0.00
Payments to Refunding Escrow Agent (Function 9299) 760 0.00 Transfers In 3600 0.00 Transfers Out 9700 0.00 0.00 Total Other Financing Sources (Uses) 0.00 0.00 0.00 0.00 SPECIAL ITEMS __________________________________________ 0.00 EXTRAORDINARY ITEMS __________________________________________ 0.00 Net Change in Fund Balances 381,627.00 5,903.00 5,903.00 0.00 Fund Balances, July 1, 2015 2800 40,017.00 40,017.00 40,017.00 0.00 Adjustments to Fund Balances 2891 0.00 Fund Balances, June 30, 2016 2700 421,644.00 45,920.00 45,920.00 0.00
ESE 145

Exhibit G-3b Page 39
DISTRICT SCHOOL BOARD OF HERNANDO COUNTY SCHEDULE OF REVENUES, EXPENDITURES AND CHANGES IN FUND BALANCES - BUDGET AND ACTUAL NON MAJOR CAPITAL PROJECTS FUND - CAPITAL OUTLAY DEBT SERVICE For the Fiscal Year Ended June 30, 2016
Account Number
Budgeted Amounts Actual
Amounts
Variance with Final Budget -
Positive (Negative)Original Final REVENUES Federal Direct 3100 0.00 Federal Through State and Local 3200 0.00 State Sources 3300 100,000.00 185,670.00 185,670.00 0.00 Local Sources:
Property Taxes Levied, Tax Redemptions and Excess Fees for Operational Purposes
3411, 3421, 3423 0.00
Property Taxes Levied, Tax Redemptions and Excess Fees for Debt Service
3412, 3421, 3423 0.00
Property Taxes Levied, Tax Redemptions and Excess Fees for Capital Projects
3413, 3421, 3423 0.00
Local Sales Taxes 3418, 3419 0.00 Charges for Service - Food Service 345X 0.00 Impact Fees 3496 0.00 Other Local Revenue 0.00 Total Local Sources 3400 0.00 0.00 0.00 0.00
Total Revenues 100,000.00 185,670.00 185,670.00 0.00 EXPENDITURES Current:
Instruction 5000 0.00 Student Support Services 6100 0.00 Instructional Media Services 6200 0.00 Instruction and Curriculum Development Services 6300 0.00 Instructional Staff Training Services 6400 0.00 Instruction-Related Technology 6500 0.00 Board 7100 0.00 General Administration 7200 0.00 School Administration 7300 0.00 Facilities Acquisition and Construction 7410 0.00 Fiscal Services 7500 0.00 Food Services 7600 0.00 Central Services 7700 0.00 Student Transportation Services 7800 0.00 Operation of Plant 7900 0.00 Maintenance of Plant 8100 0.00 Administrative Technology Services 8200 0.00 Community Services 9100 0.00
Debt Service: (Function 9200) Redemption of Principal 710 0.00 Interest 720 0.00 Dues and Fees 730 632.00 632.00 0.00 Miscellaneous 790 0.00
Capital Outlay: Facilities Acquisition and Construction 7420 0.00 Other Capital Outlay 9300 0.00
Total Expenditures 0.00 632.00 632.00 0.00 Excess (Deficiency) of Revenues Over (Under) Expenditures 100,000.00 185,038.00 185,038.00 0.00 OTHER FINANCING SOURCES (USES) Issuance of Bonds 3710 0.00
Premium on Sale of Bonds 3791 0.00 Discount on Sale of Bonds 891 0.00
Proceeds of Lease-Purchase Agreements 3750 0.00 Premium on Lease-Purchase Agreements 3793 0.00 Discount on Lease-Purchase Agreements 893 0.00
Loans 3720 0.00 Sale of Capital Assets 3730 0.00 Loss Recoveries 3740 0.00 Proceeds of Forward Supply Contract 3760 0.00 Proceeds from Special Facility Construction Account 3770 0.00 Face Value of Refunding Bonds 3715 0.00
Premium on Refunding Bonds 3792 0.00 Discount on Refunding Bonds 892 0.00
Refunding Lease-Purchase Agreements 3755 0.00 Premium on Refunding Lease-Purchase Agreements 3794 0.00 Discount on Refunding Lease-Purchase Agreements 894 0.00
Payments to Refunding Escrow Agent (Function 9299) 760 0.00 Transfers In 3600 0.00 Transfers Out 9700 0.00 0.00 Total Other Financing Sources (Uses) 0.00 0.00 0.00 0.00 SPECIAL ITEMS __________________________________________ 0.00 EXTRAORDINARY ITEMS __________________________________________ 0.00 Net Change in Fund Balances 100,000.00 185,038.00 185,038.00 0.00 Fund Balances, July 1, 2015 2800 235,496.00 235,496.00 235,496.00 0.00 Adjustments to Fund Balances 2891 0.00 Fund Balances, June 30, 2016 2700 335,496.00 420,534.00 420,534.00 0.00
ESE 145

Exhibit G-4 Page 40
DISTRICT SCHOOL BOARD OF HERNANDO COUNTY SCHEDULE OF REVENUES, EXPENDITURES AND CHANGES IN FUND BALANCES - BUDGET AND ACTUAL PERMANENT FUNDS For the Fiscal Year Ended June 30, 2016
Account Number
Budgeted Amounts Actual
Amounts
Variance with Final Budget -
Positive (Negative)Original Final REVENUES Federal Direct 3100 0.00 Federal Through State and Local 3200 0.00 State Sources 3300 0.00 Local Sources:
Property Taxes Levied, Tax Redemptions and Excess Fees for Operational Purposes
3411, 3421, 3423 0.00
Property Taxes Levied, Tax Redemptions and Excess Fees for Debt Service
3412, 3421, 3423 0.00
Property Taxes Levied, Tax Redemptions and Excess Fees for Capital Projects
3413, 3421, 3423 0.00
Local Sales Taxes 3418, 3419 0.00 Charges for Service - Food Service 345X 0.00 Impact Fees 3496 0.00 Other Local Revenue 0.00 Total Local Sources 3400 0.00 0.00 0.00 0.00
Total Revenues 0.00 0.00 0.00 0.00 EXPENDITURES Current:
Instruction 5000 0.00 Student Support Services 6100 0.00 Instructional Media Services 6200 0.00 Instruction and Curriculum Development Services 6300 0.00 Instructional Staff Training Services 6400 0.00 Instruction-Related Technology 6500 0.00 Board 7100 0.00 General Administration 7200 0.00 School Administration 7300 0.00 Facilities Acquisition and Construction 7410 0.00 Fiscal Services 7500 0.00 Food Services 7600 0.00 Central Services 7700 0.00 Student Transportation Services 7800 0.00 Operation of Plant 7900 0.00 Maintenance of Plant 8100 0.00 Administrative Technology Services 8200 0.00 Community Services 9100 0.00
Debt Service: (Function 9200) Redemption of Principal 710 0.00 Interest 720 0.00 Dues and Fees 730 0.00 Miscellaneous 790 0.00
Capital Outlay: Facilities Acquisition and Construction 7420 0.00 Other Capital Outlay 9300 0.00
Total Expenditures 0.00 0.00 0.00 0.00 Excess (Deficiency) of Revenues Over (Under) Expenditures 0.00 0.00 0.00 0.00 OTHER FINANCING SOURCES (USES) Issuance of Bonds 3710 0.00
Premium on Sale of Bonds 3791 0.00 Discount on Sale of Bonds 891 0.00
Proceeds of Lease-Purchase Agreements 3750 0.00 Premium on Lease-Purchase Agreements 3793 0.00 Discount on Lease-Purchase Agreements 893 0.00
Loans 3720 0.00 Sale of Capital Assets 3730 0.00 Loss Recoveries 3740 0.00 Proceeds of Forward Supply Contract 3760 0.00 Face Value of Refunding Bonds 3715 0.00
Premium on Refunding Bonds 3792 0.00 Discount on Refunding Bonds 892 0.00
Refunding Lease-Purchase Agreements 3755 0.00 Premium on Refunding Lease-Purchase Agreements 3794 0.00 Discount on Refunding Lease-Purchase Agreements 894 0.00
Payments to Refunding Escrow Agent (Function 9299) 760 0.00 Transfers In 3600 0.00 Transfers Out 9700 0.00 Total Other Financing Sources (Uses) 0.00 0.00 0.00 0.00 SPECIAL ITEMS __________________________________________ 0.00 EXTRAORDINARY ITEMS __________________________________________ 0.00 Net Change in Fund Balances 0.00 0.00 0.00 0.00 Fund Balances, July 1, 2015 2800 0.00 Adjustments to Fund Balances 2891 0.00 Fund Balances, June 30, 2016 2700 0.00 0.00 0.00 0.00
ESE 145

Exhibit H-1 Page 41
DISTRICT SCHOOL BOARD OF HERNANDO COUNTY COMBINING STATEMENT OF NET POSITION NONMAJOR ENTERPRISE FUNDS June 30, 2016
Account Number
Self-Insurance Consortium
911
Self-Insurance Consortium
912
Self-Insurance Consortium
913 ASSETS
Cash and Cash Equivalents 1110 0.00 0.00 0.00 Investments 1160 0.00 0.00 0.00 Accounts Receivable, Net 1131 0.00 0.00 0.00 Interest Receivable on Investments 1170 0.00 0.00 0.00 Due From Other Agencies 1220 0.00 0.00 0.00 Due From Insurer 1180 0.00 0.00 0.00 Due From Budgetary Funds 1141 0.00 0.00 0.00 Deposits Receivable 1210 0.00 0.00 0.00 Cash with Fiscal/Service Agents 1114 0.00 0.00 0.00 Section 1011.13, F.S., Loan Proceeds 1420 0.00 0.00 0.00 Inventory 1150 0.00 0.00 0.00 Prepaid Items 1230 0.00 0.00 0.00 Long-Term Investments 1460 0.00 0.00 0.00 Prepaid Insurance Costs 1430 0.00 0.00 0.00 Other Postemployment Benefits Asset 1410 0.00 0.00 0.00 Pension Asset 1415 0.00 0.00 0.00
Capital Assets: Land 1310 0.00 0.00 0.00 Land Improvements - Nondepreciable 1315 0.00 0.00 0.00 Construction in Progress 1360 0.00 0.00 0.00
Nondepreciable Capital Assets 0.00 0.00 0.00 Improvements Other Than Buildings 1320 0.00 0.00 0.00
Accumulated Depreciation 1329 0.00 0.00 0.00 Buildings and Fixed Equipment 1330 0.00 0.00 0.00
Accumulated Depreciation 1339 0.00 0.00 0.00 Furniture, Fixtures and Equipment 1340 0.00 0.00 0.00
Accumulated Depreciation 1349 0.00 0.00 0.00 Motor Vehicles 1350 0.00 0.00 0.00
Accumulated Depreciation 1359 0.00 0.00 0.00 Property Under Capital Leases 1370 0.00 0.00 0.00
Accumulated Depreciation 1379 0.00 0.00 0.00 Computer Software 1382 0.00 0.00 0.00
Accumulated Amortization 1389 0.00 0.00 0.00 Depreciable Capital Assets, Net 0.00 0.00 0.00
Total Capital Assets 0.00 0.00 0.00 Total Assets 0.00 0.00 0.00 DEFERRED OUTFLOWS OF RESOURCES Accumulated Decrease in Fair Value of Hedging Derivatives 1910 0.00 0.00 0.00 Net Carrying Amount of Debt Refunding 1920 0.00 0.00 0.00 Pension 1940 0.00 0.00 0.00 Other Postemployment Benefits 1950 0.00 0.00 0.00 Total Deferred Outflows of Resources 0.00 0.00 0.00 LIABILITIES
Cash Overdraft 2125 0.00 0.00 0.00 Accrued Salaries and Benefits 2110 0.00 0.00 0.00 Payroll Deductions and Withholdings 2170 0.00 0.00 0.00 Accounts Payable 2120 0.00 0.00 0.00 Sales Tax Payable 2260 0.00 0.00 0.00 Accrued Interest Payable 2210 0.00 0.00 0.00 Deposits Payable 2220 0.00 0.00 0.00 Due to Other Agencies 2230 0.00 0.00 0.00 Due to Budgetary Funds 2161 0.00 0.00 0.00 Pension Liability 2115 0.00 0.00 0.00 Other Postemployment Benefits Liability 2116 0.00 0.00 0.00 Judgments Payable 2130 0.00 0.00 0.00 Estimated Unpaid Claims - Self-Insurance Program 2271 0.00 0.00 0.00 Estimated Liability for Claims Adjustment 2272 0.00 0.00 0.00 Unearned Revenues 2410 0.00 0.00 0.00
Noncurrent Liabilities: Portion Due Within One Year:
Obligations Under Capital Leases 2315 0.00 0.00 0.00 Liability for Compensated Absences 2330 0.00 0.00 0.00 Estimated Liability for Long-Term Claims 2350 0.00 0.00 0.00 Net Other Postemployment Benefits Obligation 2360 0.00 0.00 0.00 Net Pension Liability 2365 0.00 0.00 0.00 Other Long-Term Liabilities 2380 0.00 0.00 0.00 Due Within One Year 0.00 0.00 0.00
Portion Due After One Year: Obligations Under Capital Leases 2315 0.00 0.00 0.00 Liability for Compensated Absences 2330 0.00 0.00 0.00 Estimated Liability for Long-Term Claims 2350 0.00 0.00 0.00 Net Other Postemployment Benefits Obligation 2360 0.00 0.00 0.00 Net Pension Liability 2365 0.00 0.00 0.00 Other Long-Term Liabilities 2380 0.00 0.00 0.00 Due In More Than One Year 0.00 0.00 0.00
Total Long-Term Liabilities 0.00 0.00 0.00 Total Liabilities 0.00 0.00 0.00 DEFERRED INFLOWS OF RESOURCES Accumulated Increase in Fair Value of Hedging Derivatives 2610 0.00 0.00 0.00 Deficit Net Carrying Amount of Debt Refunding 2620 0.00 0.00 0.00 Deferred Revenues 2630 0.00 0.00 0.00 Pension 2640 0.00 0.00 0.00 Other Postemployment Benefits 2650 0.00 0.00 0.00 Total Deferred Inflows of Resources 0.00 0.00 0.00 NET POSITION Net Investment in Capital Assets 2770 0.00 0.00 0.00 Restricted for ____________________ 2780 0.00 0.00 0.00 Unrestricted 2790 0.00 0.00 0.00 Total Net Position 0.00 0.00 0.00
The notes to financial statements are an integral part of this statement. ESE 145

Exhibit H-1 Page 41
Self-Insurance Consortium
914
ARRA Consortium
915
Other
921
Other
922 Total Nonmajor Enterprise Funds
0.00 0.00 0.00 0.00 0.00 0.00 0.00 0.00 0.00 0.00 0.00 0.00 0.00 0.00 0.00 0.00 0.00 0.00 0.00 0.00 0.00 0.00 0.00 0.00 0.00 0.00 0.00 0.00 0.00 0.00 0.00 0.00 0.00 0.00 0.00 0.00 0.00 0.00 0.00 0.00 0.00 0.00 0.00 0.00 0.00 0.00 0.00 0.00 0.00 0.00 0.00 0.00 0.00 0.00 0.00 0.00 0.00 0.00 0.00 0.00 0.00 0.00 0.00 0.00 0.00 0.00 0.00 0.00 0.00 0.00 0.00 0.00 0.00 0.00 0.00 0.00 0.00 0.00 0.00 0.00
0.00 0.00 0.00 0.00 0.00 0.00 0.00 0.00 0.00 0.00 0.00 0.00 0.00 0.00 0.00 0.00 0.00 0.00 0.00 0.00 0.00 0.00 0.00 0.00 0.00 0.00 0.00 0.00 0.00 0.00 0.00 0.00 0.00 0.00 0.00 0.00 0.00 0.00 0.00 0.00 0.00 0.00 0.00 0.00 0.00 0.00 0.00 0.00 0.00 0.00 0.00 0.00 0.00 0.00 0.00 0.00 0.00 0.00 0.00 0.00 0.00 0.00 0.00 0.00 0.00 0.00 0.00 0.00 0.00 0.00 0.00 0.00 0.00 0.00 0.00 0.00 0.00 0.00 0.00 0.00 0.00 0.00 0.00 0.00 0.00 0.00 0.00 0.00 0.00 0.00 0.00 0.00 0.00 0.00 0.00
0.00 0.00 0.00 0.00 0.00 0.00 0.00 0.00 0.00 0.00 0.00 0.00 0.00 0.00 0.00 0.00 0.00 0.00 0.00 0.00 0.00 0.00 0.00 0.00 0.00
0.00 0.00 0.00 0.00 0.00 0.00 0.00 0.00 0.00 0.00 0.00 0.00 0.00 0.00 0.00 0.00 0.00 0.00 0.00 0.00 0.00 0.00 0.00 0.00 0.00 0.00 0.00 0.00 0.00 0.00 0.00 0.00 0.00 0.00 0.00 0.00 0.00 0.00 0.00 0.00 0.00 0.00 0.00 0.00 0.00 0.00 0.00 0.00 0.00 0.00 0.00 0.00 0.00 0.00 0.00 0.00 0.00 0.00 0.00 0.00 0.00 0.00 0.00 0.00 0.00 0.00 0.00 0.00 0.00 0.00 0.00 0.00 0.00 0.00 0.00
0.00 0.00 0.00 0.00 0.00 0.00 0.00 0.00 0.00 0.00 0.00 0.00 0.00 0.00 0.00 0.00 0.00 0.00 0.00 0.00 0.00 0.00 0.00 0.00 0.00 0.00 0.00 0.00 0.00 0.00 0.00 0.00 0.00 0.00 0.00
0.00 0.00 0.00 0.00 0.00 0.00 0.00 0.00 0.00 0.00 0.00 0.00 0.00 0.00 0.00 0.00 0.00 0.00 0.00 0.00 0.00 0.00 0.00 0.00 0.00 0.00 0.00 0.00 0.00 0.00 0.00 0.00 0.00 0.00 0.00 0.00 0.00 0.00 0.00 0.00 0.00 0.00 0.00 0.00 0.00
0.00 0.00 0.00 0.00 0.00 0.00 0.00 0.00 0.00 0.00 0.00 0.00 0.00 0.00 0.00 0.00 0.00 0.00 0.00 0.00 0.00 0.00 0.00 0.00 0.00 0.00 0.00 0.00 0.00 0.00
0.00 0.00 0.00 0.00 0.00 0.00 0.00 0.00 0.00 0.00 0.00 0.00 0.00 0.00 0.00 0.00 0.00 0.00 0.00 0.00

Exhibit H-2 Page 42
DISTRICT SCHOOL BOARD OF HERNANDO COUNTY COMBINING STATEMENT OF REVENUES, EXPENSES AND CHANGES IN FUND NET POSITION NONMAJOR ENTERPRISE FUNDS For the Fiscal Year Ended June 30, 2016
Account Number
Self-Insurance Consortium
911
Self-Insurance Consortium
912
Self-Insurance Consortium
913 OPERATING REVENUES Charges for Services 3481 0.00 0.00 0.00 Charges for Sales 3482 0.00 0.00 0.00 Premium Revenue 3484 0.00 0.00 0.00 Other Operating Revenues 3489 0.00 0.00 0.00 Total Operating Revenues 0.00 0.00 0.00 OPERATING EXPENSES Salaries 100 0.00 0.00 0.00 Employee Benefits 200 0.00 0.00 0.00 Purchased Services 300 0.00 0.00 0.00 Energy Services 400 0.00 0.00 0.00 Materials and Supplies 500 0.00 0.00 0.00 Capital Outlay 600 0.00 0.00 0.00 Other 700 0.00 0.00 0.00 Depreciation and Amortization Expense 780 0.00 0.00 0.00 Total Operating Expenses 0.00 0.00 0.00 Operating Income (Loss) 0.00 0.00 0.00 NONOPERATING REVENUES (EXPENSES) Investment Income 3430 0.00 0.00 0.00 Gifts, Grants and Bequests 3440 0.00 0.00 0.00 Other Miscellaneous Local Sources 3495 0.00 0.00 0.00 Loss Recoveries 3740 0.00 0.00 0.00 Gain on Disposition of Assets 3780 0.00 0.00 0.00 Interest 720 0.00 0.00 0.00 Miscellaneous 790 0.00 0.00 0.00 Loss on Disposition of Assets 810 0.00 0.00 0.00 Total Nonoperating Revenues (Expenses) 0.00 0.00 0.00 Income (Loss) Before Operating Transfers 0.00 0.00 0.00 Transfers In 3600 0.00 0.00 0.00 Transfers Out 9700 0.00 0.00 0.00 SPECIAL ITEMS ___________________________________________ 0.00 0.00 0.00 EXTRAORDINARY ITEMS ___________________________________________ 0.00 0.00 0.00 Change In Net Position 0.00 0.00 0.00 Net Position, July 1, 2015 2880 0.00 0.00 0.00 Adjustments to Net Position 2896 0.00 0.00 0.00 Net Position, June 30, 2016 2780 0.00 0.00 0.00
The notes to financial statements are an integral part of this statement. ESE 145

Exhibit H-2 Page 42
Self-Insurance Consortium
914
ARRA Consortium
915
Other
921
Other
922 Total Nonmajor Enterprise Funds
0.00 0.00 0.00 0.00 0.00 0.00 0.00 0.00 0.00 0.00 0.00 0.00 0.00 0.00 0.00 0.00 0.00 0.00 0.00 0.00 0.00 0.00 0.00 0.00 0.00
0.00 0.00 0.00 0.00 0.00 0.00 0.00 0.00 0.00 0.00 0.00 0.00 0.00 0.00 0.00 0.00 0.00 0.00 0.00 0.00 0.00 0.00 0.00 0.00 0.00 0.00 0.00 0.00 0.00 0.00 0.00 0.00 0.00 0.00 0.00 0.00 0.00 0.00 0.00 0.00 0.00 0.00 0.00 0.00 0.00 0.00 0.00 0.00 0.00 0.00
0.00 0.00 0.00 0.00 0.00 0.00 0.00 0.00 0.00 0.00 0.00 0.00 0.00 0.00 0.00 0.00 0.00 0.00 0.00 0.00 0.00 0.00 0.00 0.00 0.00 0.00 0.00 0.00 0.00 0.00 0.00 0.00 0.00 0.00 0.00 0.00 0.00 0.00 0.00 0.00 0.00 0.00 0.00 0.00 0.00 0.00 0.00 0.00 0.00 0.00 0.00 0.00 0.00 0.00 0.00 0.00 0.00 0.00 0.00 0.00
0.00 0.00 0.00 0.00 0.00
0.00 0.00 0.00 0.00 0.00 0.00 0.00 0.00 0.00 0.00 0.00 0.00 0.00 0.00 0.00 0.00 0.00 0.00 0.00 0.00 0.00 0.00 0.00 0.00 0.00

Exhibit H-3 Page 43
DISTRICT SCHOOL BOARD OF HERNANDO COUNTY COMBINING STATEMENT OF CASH FLOWS NONMAJOR ENTERPRISE FUNDS For the Fiscal Year Ended June 30, 2016
Self-Insurance 911
Self-Insurance 912
Self-Insurance 913
CASH FLOWS FROM OPERATING ACTIVITIES Receipts from customers and users 0.00 0.00 0.00 Receipts from interfund services provided 0.00 0.00 0.00 Payments to suppliers 0.00 0.00 0.00 Payments to employees 0.00 0.00 0.00 Payments for interfund services used 0.00 0.00 0.00 Other receipts (payments) 0.00 0.00 0.00 Net cash provided (used) by operating activities 0.00 0.00 0.00 CASH FLOWS FROM NONCAPITAL FINANCING ACTIVITIES Subsidies from operating grants 0.00 0.00 0.00 Transfers from other funds 0.00 0.00 0.00 Transfers to other funds 0.00 0.00 0.00 Net cash provided (used) by noncapital financing activities 0.00 0.00 0.00 CASH FLOWS FROM CAPITAL AND RELATED FINANCING ACTIVITIES Proceeds from capital debt 0.00 0.00 0.00 Capital contributions 0.00 0.00 0.00 Proceeds from disposition of capital assets 0.00 0.00 0.00 Acquisition and construction of capital assets 0.00 0.00 0.00 Principal paid on capital debt 0.00 0.00 0.00 Interest paid on capital debt 0.00 0.00 0.00 Net cash provided (used) by capital and related financing activities 0.00 0.00 0.00 CASH FLOWS FROM INVESTING ACTIVITIES Proceeds from sales and maturities of investments 0.00 0.00 0.00 Interest and dividends received 0.00 0.00 0.00 Purchase of investments 0.00 0.00 0.00 Net cash provided (used) by investing activities 0.00 0.00 0.00 Net increase (decrease) in cash and cash equivalents 0.00 0.00 0.00 Cash and cash equivalents - July 1, 2015 0.00 0.00 0.00 Cash and cash equivalents - June 30, 2016 0.00 0.00 0.00 Reconciliation of operating income (loss) to net cash provided (used) by operating activities: Operating income (loss) 0.00 0.00 0.00 Adjustments to reconcile operating income (loss) to net cash provided (used) by operating activities:
Depreciation/Amortization expense 0.00 0.00 0.00 Commodities used from USDA program 0.00 0.00 0.00 Change in assets and liabilities:
(Increase) decrease in accounts receivable 0.00 0.00 0.00 (Increase) decrease in interest receivable 0.00 0.00 0.00 (Increase) decrease in due from insurer 0.00 0.00 0.00 (Increase) decrease in deposits receivable 0.00 0.00 0.00 (Increase) decrease in due from other funds 0.00 0.00 0.00 (Increase) decrease in due from other agencies 0.00 0.00 0.00 (Increase) decrease in inventory 0.00 0.00 0.00 (Increase) decrease in prepaid items 0.00 0.00 0.00 (Increase) decrease in pension 0.00 0.00 0.00 Increase (decrease) in salaries and benefits payable 0.00 0.00 0.00 Increase (decrease) in payroll tax liabilities 0.00 0.00 0.00 Increase (decrease) in accounts payable 0.00 0.00 0.00 Increase (decrease) in cash overdraft 0.00 0.00 0.00 Increase (decrease) in judgments payable 0.00 0.00 0.00 Increase (decrease) in sales tax payable 0.00 0.00 0.00 Increase (decrease) in accrued interest payable 0.00 0.00 0.00 Increase (decrease) in deposits payable 0.00 0.00 0.00 Increase (decrease) in due to other funds 0.00 0.00 0.00 Increase (decrease) in due to other agencies 0.00 0.00 0.00 Increase (decrease) in unearned revenues 0.00 0.00 0.00 Increase (decrease) in pension 0.00 0.00 0.00 Increase (decrease) in postemployment benefits 0.00 0.00 0.00 Increase (decrease) in estimated unpaid claims - Self-Insurance Program 0.00 0.00 0.00 Increase (decrease) in estimated liability for claims adjustment 0.00 0.00 0.00
Total adjustments 0.00 0.00 0.00 Net cash provided (used) by operating activities 0.00 0.00 0.00 Noncash investing, capital and financing activities: Borrowing under capital lease 0.00 0.00 0.00 Contributions of capital assets 0.00 0.00 0.00 Purchase of equipment on account 0.00 0.00 0.00 Capital asset trade-ins 0.00 0.00 0.00 Net Increase/(Decrease) in the fair value of investments 0.00 0.00 0.00 Commodities received through USDA program 0.00 0.00 0.00
The notes to financial statements are an integral part of this statement. ESE 145

Exhibit H-3 Page 43
Self-Insurance 914
ARRA - Consortium 915
Other 921
Other 922
Total Nonmajor Enterprise Funds
0.00 0.00 0.00 0.00 0.00 0.00 0.00 0.00 0.00 0.00 0.00 0.00 0.00 0.00 0.00 0.00 0.00 0.00 0.00 0.00 0.00 0.00 0.00 0.00 0.00 0.00 0.00 0.00 0.00 0.00 0.00 0.00 0.00 0.00 0.00
0.00 0.00 0.00 0.00 0.00 0.00 0.00 0.00 0.00 0.00 0.00 0.00 0.00 0.00 0.00 0.00 0.00 0.00 0.00 0.00
0.00 0.00 0.00 0.00 0.00 0.00 0.00 0.00 0.00 0.00 0.00 0.00 0.00 0.00 0.00 0.00 0.00 0.00 0.00 0.00 0.00 0.00 0.00 0.00 0.00 0.00 0.00 0.00 0.00 0.00 0.00 0.00 0.00 0.00 0.00
0.00 0.00 0.00 0.00 0.00 0.00 0.00 0.00 0.00 0.00 0.00 0.00 0.00 0.00 0.00 0.00 0.00 0.00 0.00 0.00 0.00 0.00 0.00 0.00 0.00 0.00 0.00 0.00 0.00 0.00 0.00 0.00 0.00 0.00 0.00
0.00 0.00 0.00 0.00 0.00
0.00 0.00 0.00 0.00 0.00 0.00 0.00 0.00 0.00 0.00
0.00 0.00 0.00 0.00 0.00 0.00 0.00 0.00 0.00 0.00 0.00 0.00 0.00 0.00 0.00 0.00 0.00 0.00 0.00 0.00 0.00 0.00 0.00 0.00 0.00 0.00 0.00 0.00 0.00 0.00 0.00 0.00 0.00 0.00 0.00 0.00 0.00 0.00 0.00 0.00 0.00 0.00 0.00 0.00 0.00 0.00 0.00 0.00 0.00 0.00 0.00 0.00 0.00 0.00 0.00 0.00 0.00 0.00 0.00 0.00 0.00 0.00 0.00 0.00 0.00 0.00 0.00 0.00 0.00 0.00 0.00 0.00 0.00 0.00 0.00 0.00 0.00 0.00 0.00 0.00 0.00 0.00 0.00 0.00 0.00 0.00 0.00 0.00 0.00 0.00 0.00 0.00 0.00 0.00 0.00 0.00 0.00 0.00 0.00 0.00 0.00 0.00 0.00 0.00 0.00 0.00 0.00 0.00 0.00 0.00 0.00 0.00 0.00 0.00 0.00 0.00 0.00 0.00 0.00 0.00 0.00 0.00 0.00 0.00 0.00 0.00 0.00 0.00 0.00 0.00
0.00 0.00 0.00 0.00 0.00 0.00 0.00 0.00 0.00 0.00 0.00 0.00 0.00 0.00 0.00 0.00 0.00 0.00 0.00 0.00 0.00 0.00 0.00 0.00 0.00 0.00 0.00 0.00 0.00 0.00

Exhibit H-4 Page 44
DISTRICT SCHOOL BOARD OF HERNANDO COUNTY COMBINING STATEMENT OF NET POSITION INTERNAL SERVICE FUNDS June 30, 2016
Account Number
Self-Insurance 711
Self-Insurance 712
Self-Insurance 713
ASSETS Cash and Cash Equivalents 1110 0.00 0.00 0.00 Investments 1160 0.00 0.00 0.00 Accounts Receivable, Net 1131 0.00 0.00 0.00 Interest Receivable on Investments 1170 0.00 0.00 0.00 Due From Other Agencies 1220 0.00 0.00 0.00 Due From Insurer 1180 0.00 0.00 0.00 Due From Budgetary Funds 1141 0.00 0.00 0.00 Deposits Receivable 1210 0.00 0.00 0.00 Cash with Fiscal/Service Agents 1114 0.00 0.00 0.00 Section 1011.13, F.S., Loan Proceeds 1420 0.00 0.00 0.00 Inventory 1150 0.00 0.00 0.00 Prepaid Items 1230 0.00 0.00 0.00 Long-Term Investments 1460 0.00 0.00 0.00 Prepaid Insurance Costs 1430 0.00 0.00 0.00 Other Postemployment Benefits Asset 1410 0.00 0.00 0.00 Pension Asset 1415 0.00 0.00 0.00
Capital Assets: Land 1310 0.00 0.00 0.00 Land Improvements - Nondepreciable 1315 0.00 0.00 0.00 Construction in Progress 1360 0.00 0.00 0.00
Nondepreciable Capital Assets 0.00 0.00 0.00 Improvements Other Than Buildings 1320 0.00 0.00 0.00
Accumulated Depreciation 1329 0.00 0.00 0.00 Buildings and Fixed Equipment 1330 0.00 0.00 0.00
Accumulated Depreciation 1339 0.00 0.00 0.00 Furniture, Fixtures and Equipment 1340 0.00 0.00 0.00
Accumulated Depreciation 1349 0.00 0.00 0.00 Motor Vehicles 1350 0.00 0.00 0.00
Accumulated Depreciation 1359 0.00 0.00 0.00 Property Under Capital Leases 1370 0.00 0.00 0.00
Accumulated Depreciation 1379 0.00 0.00 0.00 Computer Software 1382 0.00 0.00 0.00
Accumulated Amortization 1389 0.00 0.00 0.00 Depreciable Capital Assets, Net 0.00 0.00 0.00
Total Capital Assets 0.00 0.00 0.00 Total Assets 0.00 0.00 0.00 DEFERRED OUTFLOWS OF RESOURCES Accumulated Decrease in Fair Value of Hedging Derivatives 1910 0.00 0.00 0.00 Net Carrying Amount of Debt Refunding 1920 0.00 0.00 0.00 Pension 1940 0.00 0.00 0.00 Other Postemployment Benefits 1950 0.00 0.00 0.00 Total Deferred Outflows of Resources 0.00 0.00 0.00 LIABILITIES
Cash Overdraft 2125 0.00 0.00 0.00 Accrued Salaries and Benefits 2110 0.00 0.00 0.00 Payroll Deductions and Withholdings 2170 0.00 0.00 0.00 Accounts Payable 2120 0.00 0.00 0.00 Sales Tax Payable 2260 0.00 0.00 0.00 Accrued Interest Payable 2210 0.00 0.00 0.00 Deposits Payable 2220 0.00 0.00 0.00 Due to Other Agencies 2230 0.00 0.00 0.00 Due to Budgetary Funds 2161 0.00 0.00 0.00 Pension Liability 2115 0.00 0.00 0.00 Other Postemployment Benefits Liability 2116 0.00 0.00 0.00 Judgments Payable 2130 0.00 0.00 0.00 Estimated Unpaid Claims - Self-Insurance Program 2271 0.00 0.00 0.00 Estimated Liability for Claims Adjustment 2272 0.00 0.00 0.00 Unearned Revenues 2410 0.00 0.00 0.00
Noncurrent Liabilities: Portion Due Within One Year:
Obligations Under Capital Leases 2315 0.00 0.00 0.00 Liability for Compensated Absences 2330 0.00 0.00 0.00 Estimated Liability for Long-Term Claims 2350 0.00 0.00 0.00 Net Other Postemployment Benefits Obligation 2360 0.00 0.00 0.00 Net Pension Liability 2365 0.00 0.00 0.00 Oher Long-Term Liabilities 2380 0.00 0.00 0.00 Due Within One Year 0.00 0.00 0.00
Portion Due After One Year: Obligations Under Capital Leases 2315 0.00 0.00 0.00 Liability for Compensated Absences 2330 0.00 0.00 0.00 Estimated Liability for Long-Term Claims 2350 0.00 0.00 0.00 Net Other Postemployment Benefits Obligation 2360 0.00 0.00 0.00 Net Pension Liability 2365 0.00 0.00 0.00 Other Long-Term Liabilities 2380 0.00 0.00 0.00 Due In More Than One Year 0.00 0.00 0.00
Total Long-Term Liabilities 0.00 0.00 0.00 Total Liabilities 0.00 0.00 0.00 DEFERRED INFLOWS OF RESOURCES Accumulated Increase in Fair Value of Hedging Derivatives 2610 0.00 0.00 0.00 Deficit Net Carrying Amount of Debt Refunding 2620 0.00 0.00 0.00 Deferred Revenues 2630 0.00 0.00 0.00 Pension 2640 0.00 0.00 0.00 Other Postemployment Benefits 2650 0.00 0.00 0.00 Total Deferred Inflows of Resources 0.00 0.00 0.00 NET POSITION Net Investment in Capital Assets 2770 0.00 0.00 0.00 Restricted for ____________________ 2780 0.00 0.00 0.00 Unrestricted 2790 0.00 0.00 0.00 Total Net Position 0.00 0.00 0.00
The notes to financial statements are an integral part of this statement. ESE 145

ISSUED BY:

Exhibit H-5
Page 45
DISTRICT SCHOOL BOARD OF HERNANDO COUNTY
COMBINING STATEMENT OF REVENUES, EXPENSES AND CHANGES IN FUND NET POSITION
INTERNAL SERVICE FUNDS
For the Fiscal Year Ended June 30, 2016
Account
Number
Self-Insurance
711
Self-Insurance
712
Self-Insurance
713
OPERATING REVENUES
Charges for Services 3481 0.00 0.00 0.00
Charges for Sales 3482 0.00 0.00 0.00
Premium Revenue 3484 0.00 0.00 0.00
Other Operating Revenues 3489 0.00 0.00 0.00
Total Operating Revenues 0.00 0.00 0.00
OPERATING EXPENSES
Salaries 100 0.00 0.00 0.00
Employee Benefits 200 0.00 0.00 0.00
Purchased Services 300 0.00 0.00 0.00
Energy Services 400 0.00 0.00 0.00
Materials and Supplies 500 0.00 0.00 0.00
Capital Outlay 600 0.00 0.00 0.00
Other 700 0.00 0.00 0.00
Depreciation/Amortization Expense 780 0.00 0.00 0.00
Total Operating Expenses 0.00 0.00 0.00
Operating Income (Loss) 0.00 0.00 0.00
NONOPERATING REVENUES (EXPENSES)
Investment Income 3430 0.00 0.00 0.00
Gifts, Grants and Bequests 3440 0.00 0.00 0.00
Other Miscellaneous Local Sources 3495 0.00 0.00 0.00
Loss Recoveries 3740 0.00 0.00 0.00
Gain on Disposition of Assets 3780 0.00 0.00 0.00
Interest 720 0.00 0.00 0.00
Miscellaneous 790 0.00 0.00 0.00
Loss on Disposition of Assets 810 0.00 0.00 0.00
Total Nonoperating Revenues (Expenses) 0.00 0.00 0.00
Income (Loss) Before Operating Transfers 0.00 0.00 0.00
Transfers In 3600 0.00 0.00 0.00
Transfers Out 9700 0.00 0.00 0.00
SPECIAL ITEMS
___________________________________________ 0.00 0.00 0.00
EXTRAORDINARY ITEMS
___________________________________________ 0.00 0.00 0.00
Change In Net Position 0.00 0.00 0.00
Net Position, July 1, 2015 2880 0.00 0.00 0.00
Adjustments to Net Position 2896 0.00 0.00 0.00
Net Position, June 30, 2016 2780 0.00 0.00 0.00
The notes to financial statements are an integral part of this statement.
ESE 145

Exhibit H-5
Page 45
Self-Insurance
714
Self-Insurance
715
Consortium Programs
731
Other Internal Service
791
Total Internal
Service Funds
0.00 0.00 0.00 0.00 0.00
0.00 0.00 0.00 0.00 0.00
0.00 0.00 0.00 0.00 0.00
0.00 0.00 0.00 0.00 0.00
0.00 0.00 0.00 0.00 0.00
0.00 0.00 0.00 0.00 0.00
0.00 0.00 0.00 0.00 0.00
0.00 0.00 0.00 0.00 0.00
0.00 0.00 0.00 0.00 0.00
0.00 0.00 0.00 0.00 0.00
0.00 0.00 0.00 0.00 0.00
0.00 0.00 0.00 0.00 0.00
0.00 0.00 0.00 0.00 0.00
0.00 0.00 0.00 0.00 0.00
0.00 0.00 0.00 0.00 0.00
0.00 0.00 0.00 0.00 0.00
0.00 0.00 0.00 0.00 0.00
0.00 0.00 0.00 0.00 0.00
0.00 0.00 0.00 0.00 0.00
0.00 0.00 0.00 0.00 0.00
0.00 0.00 0.00 0.00 0.00
0.00 0.00 0.00 0.00 0.00
0.00 0.00 0.00 0.00 0.00
0.00 0.00 0.00 0.00 0.00
0.00 0.00 0.00 0.00 0.00
0.00 0.00 0.00 0.00 0.00
0.00 0.00 0.00 0.00 0.00
0.00 0.00 0.00 0.00 0.00
0.00 0.00 0.00 0.00 0.00
0.00 0.00 0.00 0.00 0.00
0.00 0.00 0.00 0.00 0.00
0.00 0.00 0.00 0.00 0.00
0.00 0.00 0.00 0.00 0.00

Exhibit H-6 Page 46
DISTRICT SCHOOL BOARD OF HERNANDO COUNTY COMBINING STATEMENT OF CASH FLOWS INTERNAL SERVICE FUNDS For the Fiscal Year Ended June 30, 2016
Self-Insurance 711
Self-Insurance 712
Self-Insurance 713
Self-Insurance 714
CASH FLOWS FROM OPERATING ACTIVITIES Receipts from customers and users 0.00 0.00 0.00 0.00 Receipts from interfund services provided 0.00 0.00 0.00 0.00 Payments to suppliers 0.00 0.00 0.00 0.00 Payments to employees 0.00 0.00 0.00 0.00 Payments for interfund services used 0.00 0.00 0.00 0.00 Other receipts (payments) 0.00 0.00 0.00 0.00 Net cash provided (used) by operating activities 0.00 0.00 0.00 0.00 CASH FLOWS FROM NONCAPITAL FINANCING ACTIVITIES Subsidies from operating grants 0.00 0.00 0.00 0.00 Transfers from other funds 0.00 0.00 0.00 0.00 Transfers to other funds 0.00 0.00 0.00 0.00 Net cash provided (used) by noncapital financing activities 0.00 0.00 0.00 0.00 CASH FLOWS FROM CAPITAL AND RELATED FINANCING ACTIVITIES Proceeds from capital debt 0.00 0.00 0.00 0.00 Capital contributions 0.00 0.00 0.00 0.00 Proceeds from disposition of capital assets 0.00 0.00 0.00 0.00 Acquisition and construction of capital assets 0.00 0.00 0.00 0.00 Principal paid on capital debt 0.00 0.00 0.00 0.00 Interest paid on capital debt 0.00 0.00 0.00 0.00 Net cash provided (used) by capital and related financing activities 0.00 0.00 0.00 0.00 CASH FLOWS FROM INVESTING ACTIVITIES Proceeds from sales and maturities of investments 0.00 0.00 0.00 0.00 Interest and dividends received 0.00 0.00 0.00 0.00 Purchase of investments 0.00 0.00 0.00 0.00 Net cash provided (used) by investing activities 0.00 0.00 0.00 0.00 Net increase (decrease) in cash and cash equivalents 0.00 0.00 0.00 0.00 Cash and cash equivalents - July 1, 2015 0.00 0.00 0.00 0.00 Cash and cash equivalents - June 30, 2016 0.00 0.00 0.00 0.00 Reconciliation of operating income (loss) to net cash provided (used) by operating activities: Operating income (loss) 0.00 0.00 0.00 0.00 Adjustments to reconcile operating income (loss) to net cash provided (used) by operating activities:
Depreciation/Amortization expense 0.00 0.00 0.00 0.00 Commodities used from USDA program 0.00 0.00 0.00 0.00 Change in assets and liabilities:
(Increase) decrease in accounts receivable 0.00 0.00 0.00 0.00 (Increase) decrease in interest receivable 0.00 0.00 0.00 0.00 (Increase) decrease in due from insurer 0.00 0.00 0.00 0.00 (Increase) decrease in deposits receivable 0.00 0.00 0.00 0.00 (Increase) decrease in due from other funds 0.00 0.00 0.00 0.00 (Increase) decrease in due from other agencies 0.00 0.00 0.00 0.00 (Increase) decrease in inventory 0.00 0.00 0.00 0.00 (Increase) decrease in prepaid items 0.00 0.00 0.00 0.00 (Increase) decrease in pension 0.00 0.00 0.00 0.00 Increase (decrease) in salaries and benefits payable 0.00 0.00 0.00 0.00 Increase (decrease) in payroll tax liabilities 0.00 0.00 0.00 0.00 Increase (decrease) in accounts payable 0.00 0.00 0.00 0.00 Increase (decrease) in cash overdraft 0.00 0.00 0.00 0.00 Increase (decrease) in judgments payable 0.00 0.00 0.00 0.00 Increase (decrease) in sales tax payable 0.00 0.00 0.00 0.00 Increase (decrease) in accrued interest payable 0.00 0.00 0.00 0.00 Increase (decrease) in deposits payable 0.00 0.00 0.00 0.00 Increase (decrease) in due to other funds 0.00 0.00 0.00 0.00 Increase (decrease) in due to other agencies 0.00 0.00 0.00 0.00 Increase (decrease) in unearned revenues 0.00 0.00 0.00 0.00 Increase (decrease) in pension 0.00 0.00 0.00 0.00 Increase (decrease) in postemployment benefits 0.00 0.00 0.00 0.00 Increase (decrease) in estimated unpaid claims - Self-Insurance Program 0.00 0.00 0.00 0.00 Increase (decrease) in estimated liability for claims adjustment 0.00 0.00 0.00 0.00
Total adjustments 0.00 0.00 0.00 0.00 Net cash provided (used) by operating activities 0.00 0.00 0.00 0.00 Noncash investing, capital and financing activities: Borrowing under capital lease 0.00 0.00 0.00 0.00 Contributions of capital assets 0.00 0.00 0.00 0.00 Purchase of equipment on account 0.00 0.00 0.00 0.00 Capital asset trade-ins 0.00 0.00 0.00 0.00 Net Increase/(Decrease) in the fair value of investments 0.00 0.00 0.00 0.00 Commodities received through USDA program 0.00 0.00 0.00 0.00
The notes to financial statements are an integral part of this statement. ESE 145

Exhibit H-6 Page 46
Self-Insurance 715
Consortium Programs 731
Other Internal Service 791
Total Internal Service Funds
0.00 0.00 0.00 0.00 0.00 0.00 0.00 0.00 0.00 0.00 0.00 0.00 0.00 0.00 0.00 0.00 0.00 0.00 0.00 0.00 0.00 0.00 0.00 0.00 0.00 0.00 0.00 0.00
0.00 0.00 0.00 0.00 0.00 0.00 0.00 0.00 0.00 0.00 0.00 0.00 0.00 0.00 0.00 0.00
0.00 0.00 0.00 0.00 0.00 0.00 0.00 0.00 0.00 0.00 0.00 0.00 0.00 0.00 0.00 0.00 0.00 0.00 0.00 0.00 0.00 0.00 0.00 0.00 0.00 0.00 0.00 0.00
0.00 0.00 0.00 0.00 0.00 0.00 0.00 0.00 0.00 0.00 0.00 0.00 0.00 0.00 0.00 0.00 0.00 0.00 0.00 0.00 0.00 0.00 0.00 0.00 0.00 0.00 0.00 0.00
0.00 0.00 0.00 0.00
0.00 0.00 0.00 0.00 0.00 0.00 0.00 0.00
0.00 0.00 0.00 0.00 0.00 0.00 0.00 0.00 0.00 0.00 0.00 0.00 0.00 0.00 0.00 0.00 0.00 0.00 0.00 0.00 0.00 0.00 0.00 0.00 0.00 0.00 0.00 0.00 0.00 0.00 0.00 0.00 0.00 0.00 0.00 0.00 0.00 0.00 0.00 0.00 0.00 0.00 0.00 0.00 0.00 0.00 0.00 0.00 0.00 0.00 0.00 0.00 0.00 0.00 0.00 0.00 0.00 0.00 0.00 0.00 0.00 0.00 0.00 0.00 0.00 0.00 0.00 0.00 0.00 0.00 0.00 0.00 0.00 0.00 0.00 0.00 0.00 0.00 0.00 0.00 0.00 0.00 0.00 0.00 0.00 0.00 0.00 0.00 0.00 0.00 0.00 0.00 0.00 0.00 0.00 0.00 0.00 0.00 0.00 0.00 0.00 0.00 0.00 0.00
0.00 0.00 0.00 0.00 0.00 0.00 0.00 0.00 0.00 0.00 0.00 0.00 0.00 0.00 0.00 0.00 0.00 0.00 0.00 0.00 0.00 0.00 0.00 0.00

Exhibit I-1 Page 47
DISTRICT SCHOOL BOARD OF HERNANDO COUNTY COMBINING STATEMENT OF FIDUCIARY NET POSITION INVESTMENT TRUST FUNDS June 30, 2016
Account Number
Investment Trust Fund Name 84X
Investment Trust Fund Name 84X
Investment Trust Fund Name 84X
Total Investment Trust Funds
ASSETS Cash and Cash Equivalents 1110 0.00 0.00 0.00 0.00 Investments 1160 0.00 0.00 0.00 0.00 Accounts Receivable, Net 1131 0.00 0.00 0.00 0.00 Pension Contributions Receivable 1132 Interest Receivable on Investments 1170 0.00 0.00 0.00 0.00 Due From Budgetary Funds 1141 0.00 0.00 0.00 0.00 Due From Other Agencies 1220 0.00 0.00 0.00 0.00 Inventory 1150 Total Assets 0.00 0.00 0.00 0.00 DEFERRED OUTFLOWS OF RESOURCES Accumulated Decrease in Fair Value of Hedging Derivatives 1910 0.00 0.00 0.00 0.00 Pension 1940 Other Postemployment Benefits 1950 0.00 0.00 0.00 0.00 Total Deferred Outflows of Resources 0.00 0.00 0.00 0.00 LIABILITIES Cash Overdraft 2125 0.00 0.00 0.00 0.00 Accrued Salaries and Benefits 2110 0.00 0.00 0.00 0.00 Payroll Deductions and Withholdings 2170 0.00 0.00 0.00 0.00 Accounts Payable 2120 0.00 0.00 0.00 0.00 Internal Accounts Payable 2290 0.00 0.00 0.00 0.00 Due to Other Agencies 2230 0.00 0.00 0.00 0.00 Due to Budgetary Funds 2161 0.00 0.00 0.00 0.00 Total Liabilities 0.00 0.00 0.00 0.00 DEFERRED INFLOWS OF RESOURCES Accumulated Increase in Fair Value of Hedging Derivatives 2610 0.00 0.00 0.00 0.00 Pension 2640 Other Postemployment Benefits 2650 0.00 0.00 0.00 0.00 Total Deferred Inflows of Resources 0.00 0.00 0.00 0.00 NET POSITION Held in Trust for Pension Benefits 2785 0.00 0.00 0.00 0.00 Held in Trust for Other Purposes 2785 0.00 0.00 0.00 0.00 Total Net Position 0.00 0.00 0.00 0.00
The notes to financial statements are an integral part of this statement. ESE 145

Exhibit I-2 Page 48
DISTRICT SCHOOL BOARD OF HERNANDO COUNTY COMBINING STATEMENT OF CHANGES IN NET POSITION INVESTMENT TRUST FUNDS For the Fiscal Year Ended June 30, 2016
Account Number
Investment Trust Fund Name 84X
Investment Trust Fund Name 84X
Investment Trust Fund Name 84X
Total Investment Trust Funds
ADDITIONS Contributions:
Employer 0.00 0.00 0.00 0.00 Plan Members 0.00 0.00 0.00 0.00 Gifts, Grants and Bequests 3440 0.00 0.00 0.00 0.00
Investment Income: Interest on Investments 3431 0.00 0.00 0.00 0.00 Gain on Sale of Investments 3432 0.00 0.00 0.00 0.00 Net Increase (Decrease) in the Fair Value of Investments 3433 0.00 0.00 0.00 0.00
Total Investment Income 0.00 0.00 0.00 0.00 Less Investment Expense 0.00 0.00 0.00 0.00
Net Investment Income 0.00 0.00 0.00 0.00 Total Additions 0.00 0.00 0.00 0.00 DEDUCTIONS Salaries 100 0.00 0.00 0.00 0.00 Employee Benefits 200 0.00 0.00 0.00 0.00 Purchased Services 300 0.00 0.00 0.00 0.00 Other 700 0.00 0.00 0.00 0.00 Refunds of Contributions 0.00 0.00 0.00 0.00 Administrative Expenses 0.00 0.00 0.00 0.00 Total Deductions 0.00 0.00 0.00 0.00 Change In Net Position 0.00 0.00 0.00 0.00 Net Position Held In Trust, July 1, 2015 2885 0.00 0.00 0.00 0.00 Adjustments to Net Position 2896 0.00 0.00 0.00 0.00 Net Position Held in Trust for Pension Benefits and Other Purposes, June 30, 2016 2785 0.00 0.00 0.00 0.00
The notes to financial statements are an integral part of this statement. ESE 145

Exhibit I-3 Page 49
DISTRICT SCHOOL BOARD OF HERNANDO COUNTY COMBINING STATEMENT OF FIDUCIARY NET POSITION PRIVATE-PURPOSE TRUST FUNDS June 30, 2016
Account Number
Private-Purpose Trust Fund Name 85X
Private-Purpose Trust Fund Name 85X
Private-Purpose Trust Fund Name 85X
Total Private-Purpose Trust Funds
ASSETS Cash and Cash Equivalents 1110 0.00 0.00 0.00 0.00 Investments 1160 0.00 0.00 0.00 0.00 Accounts Receivable, Net 1131 0.00 0.00 0.00 0.00 Pension Contributions Receivable 1132 Interest Receivable on Investments 1170 0.00 0.00 0.00 0.00 Due From Budgetary Funds 1141 0.00 0.00 0.00 0.00 Due From Other Agencies 1220 0.00 0.00 0.00 0.00 Inventory 1150 Total Assets 0.00 0.00 0.00 0.00 DEFERRED OUTFLOWS OF RESOURCES Accumulated Decrease in Fair Value of Hedging Derivatives 1910 0.00 0.00 0.00 0.00 Pension 1940 Other Postemployment Benefits 1950 0.00 0.00 0.00 0.00 Total Deferred Outflows of Resources 0.00 0.00 0.00 0.00 LIABILITIES Cash Overdraft 2125 0.00 0.00 0.00 0.00 Accrued Salaries and Benefits 2110 0.00 0.00 0.00 0.00 Payroll Deductions and Withholdings 2170 0.00 0.00 0.00 0.00 Accounts Payable 2120 0.00 0.00 0.00 0.00 Internal Accounts Payable 2290 0.00 0.00 0.00 0.00 Due to Other Agencies 2230 0.00 0.00 0.00 0.00 Due to Budgetary Funds 2161 0.00 0.00 0.00 0.00 Total Liabilities 0.00 0.00 0.00 0.00 DEFERRED INFLOWS OF RESOURCES Accumulated Increase in Fair Value of Hedging Derivatives 2610 0.00 0.00 0.00 0.00 Pension 2640 Other Postemployment Benefits 2650 0.00 0.00 0.00 0.00 Total Deferred Inflows of Resources 0.00 0.00 0.00 0.00 NET POSITION Held in Trust for Pension Benefits 2785 0.00 0.00 0.00 0.00 Held in Trust for Other Purposes 2785 0.00 0.00 0.00 0.00 Total Net Position 0.00 0.00 0.00 0.00
The notes to financial statements are an integral part of this statement. ESE 145

Exhibit I-4 Page 50
DISTRICT SCHOOL BOARD OF HERNANDO COUNTY COMBINING STATEMENT OF CHANGES IN NET POSITION PRIVATE-PURPOSE TRUST FUNDS For the Fiscal Year Ended June 30, 2016
Account Number
Private-Purpose Trust Fund Name 85X
Private-Purpose Trust Fund Name 85X
Private-Purpose Trust Fund Name 85X
Total Private-Purpose Trust Funds
ADDITIONS Contributions:
Employer 0.00 0.00 0.00 0.00 Plan Members 0.00 0.00 0.00 0.00 Gifts, Grants and Bequests 3440 0.00 0.00 0.00 0.00
Investment Income: Interest on Investments 3431 0.00 0.00 0.00 0.00 Gain on Sale of Investments 3432 0.00 0.00 0.00 0.00 Net Increase (Decrease) in the Fair Value of Investments 3433 0.00 0.00 0.00 0.00
Total Investment Income 0.00 0.00 0.00 0.00 Less Investment Expense 0.00 0.00 0.00 0.00
Net Investment Income 0.00 0.00 0.00 0.00 Total Additions 0.00 0.00 0.00 0.00 DEDUCTIONS Salaries 100 0.00 0.00 0.00 0.00 Employee Benefits 200 0.00 0.00 0.00 0.00 Purchased Services 300 0.00 0.00 0.00 0.00 Other 700 0.00 0.00 0.00 0.00 Refunds of Contributions 0.00 0.00 0.00 0.00 Administrative Expenses 0.00 0.00 0.00 0.00 Total Deductions 0.00 0.00 0.00 0.00 Change In Net Position 0.00 0.00 0.00 0.00 Net Position Held In Trust, July 1, 2015 2885 0.00 0.00 0.00 0.00 Adjustments to Net Position 2896 0.00 0.00 0.00 0.00 Net Position Held in Trust for Pension Benefits and Other Purposes, June 30, 2016 2785 0.00 0.00 0.00 0.00
The notes to financial statements are an integral part of this statement. ESE 145

Exhibit I-5 Page 51
DISTRICT SCHOOL BOARD OF HERNANDO COUNTY COMBINING STATEMENT OF FIDUCIARY NET POSITION PENSION TRUST FUNDS June 30, 2016
Account Number
Pension Trust Fund Name 87X
Pension Trust Fund Name 87X
Pension Trust Fund Name 87X Total Pension Trust Funds
ASSETS Cash and Cash Equivalents 1110 0.00 0.00 0.00 0.00 Investments 1160 0.00 0.00 0.00 0.00 Accounts Receivable, Net 1131 0.00 0.00 0.00 0.00 Pension Contributions Receivable 1132 0.00 0.00 0.00 0.00 Interest Receivable on Investments 1170 0.00 0.00 0.00 0.00 Due From Budgetary Funds 1141 0.00 0.00 0.00 0.00 Due From Other Agencies 1220 0.00 0.00 0.00 0.00 Inventory 1150 Total Assets 0.00 0.00 0.00 0.00 DEFERRED OUTFLOWS OF RESOURCES Accumulated Decrease in Fair Value of Hedging Derivatives 1910 0.00 0.00 0.00 0.00 Pension 1940 0.00 0.00 0.00 0.00 Other Postemployment Benefits 1950 0.00 0.00 0.00 0.00 Total Deferred Outflows of Resources 0.00 0.00 0.00 0.00 LIABILITIES Cash Overdraft 2125 0.00 0.00 0.00 0.00 Accrued Salaries and Benefits 2110 0.00 0.00 0.00 0.00 Payroll Deductions and Withholdings 2170 0.00 0.00 0.00 0.00 Accounts Payable 2120 0.00 0.00 0.00 0.00 Internal Accounts Payable 2290 0.00 0.00 0.00 0.00 Due to Other Agencies 2230 0.00 0.00 0.00 0.00 Due to Budgetary Funds 2161 0.00 0.00 0.00 0.00 Total Liabilities 0.00 0.00 0.00 0.00 DEFERRED INFLOWS OF RESOURCES Accumulated Increase in Fair Value of Hedging Derivatives 2610 0.00 0.00 0.00 0.00 Pension 2640 0.00 0.00 0.00 0.00 Other Postemployment Benefits 2650 0.00 0.00 0.00 0.00 Total Deferred Inflows of Resources 0.00 0.00 0.00 0.00 NET POSITION Held in Trust for Pension Benefits 2785 0.00 0.00 0.00 0.00 Held in Trust for Other Purposes 2785 0.00 0.00 0.00 0.00 Total Net Position 0.00 0.00 0.00 0.00
The notes to financial statements are an integral part of this statement. ESE 145

Exhibit I-6 Page 52
DISTRICT SCHOOL BOARD OF HERNANDO COUNTY COMBINING STATEMENT OF CHANGES IN NET POSITION PENSION TRUST FUNDS For the Fiscal Year Ended June 30, 2016
Account Number
Pension Trust Fund Name 87X
Pension Trust Fund Name 87X
Pension Trust Fund Name 87X Total Pension Trust Funds
ADDITIONS Contributions:
Employer 0.00 0.00 0.00 0.00 Plan Members 0.00 0.00 0.00 0.00 Gifts, Grants and Bequests 3440 0.00 0.00 0.00 0.00
Investment Income: Interest on Investments 3431 0.00 0.00 0.00 0.00 Gain on Sale of Investments 3432 0.00 0.00 0.00 0.00 Net Increase (Decrease) in the Fair Value of Investments 3433 0.00 0.00 0.00 0.00
Total Investment Income 0.00 0.00 0.00 0.00 Less Investment Expense 0.00 0.00 0.00 0.00
Net Investment Income 0.00 0.00 0.00 0.00 Total Additions 0.00 0.00 0.00 0.00 DEDUCTIONS Salaries 100 0.00 0.00 0.00 0.00 Employee Benefits 200 0.00 0.00 0.00 0.00 Purchased Services 300 0.00 0.00 0.00 0.00 Other 700 0.00 0.00 0.00 0.00 Refunds of Contributions 0.00 0.00 0.00 0.00 Administrative Expenses 0.00 0.00 0.00 0.00 Total Deductions 0.00 0.00 0.00 0.00 Change In Net Position 0.00 0.00 0.00 0.00 Net Position Held In Trust, July 1, 2015 2885 0.00 0.00 0.00 0.00 Adjustments to Net Position 2896 0.00 0.00 0.00 0.00 Net Position Held in Trust for Pension Benefits and Other Purposes, June 30, 2016 2785 0.00 0.00 0.00 0.00
The notes to financial statements are an integral part of this statement. ESE 145

Exhibit I-7 Page 53
DISTRICT SCHOOL BOARD OF HERNANDO COUNTY COMBINING STATEMENT OF FIDUCIARY ASSETS AND LIABILITIES AGENCY FUNDS June 30, 2016
Account Number
School Internal Funds 891
Agency Fund Name 89X Total Agency Funds
ASSETS Cash and Cash Equivalents 1110 1,680,893.00 0.00 1,680,893.00 Investments 1160 0.00 0.00 0.00 Accounts Receivable, Net 1131 13,043.00 0.00 13,043.00 Pension Contributions Receivable 1132 Interest Receivable on Investments 1170 0.00 0.00 0.00 Due From Budgetary Funds 1141 355.00 0.00 355.00 Due From Other Agencies 1220 0.00 0.00 0.00 Inventory 1150 0.00 0.00 0.00 Total Assets 1,694,291.00 0.00 1,694,291.00 DEFERRED OUTFLOWS OF RESOURCES Accumulated Decrease in Fair Value of Hedging Derivatives 1910 Pension 1940 Other Postemployment Benefits 1950 Total Deferred Outflows of Resources LIABILITIES Cash Overdraft 2125 0.00 0.00 0.00 Accrued Salaries and Benefits 2110 0.00 0.00 0.00 Payroll Deductions and Withholdings 2170 0.00 0.00 0.00 Accounts Payable 2120 0.00 0.00 0.00 Internal Accounts Payable 2290 1,694,291.00 0.00 1,694,291.00 Due to Other Agencies 2230 Due to Budgetary Funds 2161 0.00 0.00 0.00 Total Liabilities 1,694,291.00 0.00 1,694,291.00 DEFERRED INFLOWS OF RESOURCES Accumulated Increase in Fair Value of Hedging Derivatives 2610 Pension 2640 Other Postemployment Benefits 2650 Total Deferred Inflows of Resources
The notes to financial statements are an integral part of this statement. ESE 145

Exhibit I-8a Page 54
DISTRICT SCHOOL BOARD OF HERNANDO COUNTY COMBINING STATEMENT OF CHANGES IN ASSETS AND LIABILITIES SCHOOL INTERNAL FUNDS 891 June 30, 2016
Account Number
Balance July 1, 2015 Additions Deductions
Balance June 30, 2016
ASSETS Cash and Cash Equivalents 1110 1,538,653.00 4,852,995.00 4,710,755.00 1,680,893.00 Investments 1160 0.00 0.00 0.00 0.00 Accounts Receivable, Net 1131 8,679.00 4,364.00 0.00 13,043.00 Pension Contributions Receivable 1132 Interest Receivable on Investments 1170 0.00 0.00 0.00 0.00 Due From Budgetary Funds 1141 0.00 355.00 0.00 355.00 Due From Other Agencies 1220 0.00 0.00 0.00 0.00 Inventory 1150 0.00 0.00 0.00 0.00 Total Assets 1,547,332.00 4,857,714.00 4,710,755.00 1,694,291.00 DEFERRED OUTFLOWS OF RESOURCES Accumulated Decrease in Fair Value of Hedging Derivatives 1910 Pension 1940 Other Postemployment Benefits 1950 Total Deferred Outflows of Resources LIABILITIES Cash Overdraft 2125 0.00 0.00 0.00 0.00 Accrued Salaries and Benefits 2110 0.00 0.00 0.00 0.00 Payroll Deductions and Withholdings 2170 0.00 0.00 0.00 0.00 Accounts Payable 2120 0.00 0.00 0.00 0.00 Internal Accounts Payable 2290 1,547,332.00 4,857,714.00 4,710,755.00 1,694,291.00 Due to Other Agencies 2230 Due to Budgetary Funds 2161 0.00 0.00 0.00 0.00 Total Liabilities 1,547,332.00 4,857,714.00 4,710,755.00 1,694,291.00 DEFERRED INFLOWS OF RESOURCES Accumulated Increase in Fair Value of Hedging Derivatives 2610 Pension 2640 Other Postemployment Benefits 2650 Total Deferred Inflows of Resources
The notes to financial statements are an integral part of this statement. ESE 145

Exhibit I-8b Page 55
DISTRICT SCHOOL BOARD OF HERNANDO COUNTY COMBINING STATEMENT OF CHANGES IN ASSETS AND LIABILITIES (CONTINUED) Agency Fund Name June 30, 2016
Account Number
Balance July 1, 2015 Additions Deductions
Balance June 30, 2016
ASSETS Cash and Cash Equivalents 1110 0.00 0.00 0.00 0.00 Investments 1160 0.00 0.00 0.00 0.00 Accounts Receivable, Net 1131 0.00 0.00 0.00 0.00 Pension Contributions Receivable 1132 Interest Receivable on Investments 1170 0.00 0.00 0.00 0.00 Due From Budgetary Funds 1141 0.00 0.00 0.00 0.00 Due From Other Agencies 1220 0.00 0.00 0.00 0.00 Inventory 1150 0.00 0.00 0.00 0.00 Total Assets 0.00 0.00 0.00 0.00 DEFERRED OUTFLOWS OF RESOURCES Accumulated Decrease in Fair Value of Hedging Derivatives 1910 Pension 1940 Other Postemployment Benefits 1950 Total Deferred Outflows of Resources LIABILITIES Cash Overdraft 2125 0.00 0.00 0.00 0.00 Accrued Salaries and Benefits 2110 0.00 0.00 0.00 0.00 Payroll Deductions and Withholdings 2170 0.00 0.00 0.00 0.00 Accounts Payable 2120 0.00 0.00 0.00 0.00 Internal Accounts Payable 2290 0.00 0.00 0.00 0.00 Due to Other Agencies 2230 Due to Budgetary Funds 2161 0.00 0.00 0.00 0.00 Total Liabilities 0.00 0.00 0.00 0.00 DEFERRED INFLOWS OF RESOURCES Accumulated Increase in Fair Value of Hedging Derivatives 2610 Pension 2640 Other Postemployment Benefits 2650 Total Deferred Inflows of Resources
The notes to financial statements are an integral part of this statement. ESE 145

Exhibit I-8c Page 56
DISTRICT SCHOOL BOARD OF HERNANDO COUNTY COMBINING STATEMENT OF CHANGES IN ASSETS AND LIABILITIES (CONTINUED) Agency Fund Name June 30, 2016
Account Number
Balance July 1, 2015 Additions Deductions
Balance June 30, 2016
ASSETS Cash and Cash Equivalents 1110 0.00 0.00 0.00 0.00 Investments 1160 0.00 0.00 0.00 0.00 Accounts Receivable, Net 1131 0.00 0.00 0.00 0.00 Pension Contributions Receivable 1132 Interest Receivable on Investments 1170 0.00 0.00 0.00 0.00 Due From Budgetary Funds 1141 0.00 0.00 0.00 0.00 Due From Other Agencies 1220 0.00 0.00 0.00 0.00 Inventory 1150 0.00 0.00 0.00 0.00 Total Assets 0.00 0.00 0.00 0.00 DEFERRED OUTFLOWS OF RESOURCES Accumulated Decrease in Fair Value of Hedging Derivatives 1910 Pension 1940 Other Postemployment Benefits 1950 Total Deferred Outflows of Resources LIABILITIES Cash Overdraft 2125 0.00 0.00 0.00 0.00 Accrued Salaries and Benefits 2110 0.00 0.00 0.00 0.00 Payroll Deductions and Withholdings 2170 0.00 0.00 0.00 0.00 Accounts Payable 2120 0.00 0.00 0.00 0.00 Internal Accounts Payable 2290 0.00 0.00 0.00 0.00 Due to Other Agencies 2230 Due to Budgetary Funds 2161 0.00 0.00 0.00 0.00 Total Liabilities 0.00 0.00 0.00 0.00 DEFERRED INFLOWS OF RESOURCES Accumulated Increase in Fair Value of Hedging Derivatives 2610 Pension 2640 Other Postemployment Benefits 2650 Total Deferred Inflows of Resources
The notes to financial statements are an integral part of this statement. ESE 145

Exhibit I-8d Page 57
DISTRICT SCHOOL BOARD OF HERNANDO COUNTY COMBINING STATEMENT OF CHANGES IN ASSETS AND LIABILITIES (CONTINUED) TOTAL AGENCY FUNDS June 30, 2016
Account Number
Total Agency Funds Balances
July 1, 2015 Total Agency Funds
Additions Total Agency Funds
Deductions
Total Agency Funds Balances
June 30, 2016 ASSETS Cash and Cash Equivalents 1110 1,538,653.00 4,852,995.00 4,710,755.00 1,680,893.00 Investments 1160 0.00 0.00 0.00 0.00 Accounts Receivable, Net 1131 8,679.00 4,364.00 0.00 13,043.00 Pension Contributions Receivable 1132 Interest Receivable on Investments 1170 0.00 0.00 0.00 0.00 Due From Budgetary Funds 1141 0.00 355.00 0.00 355.00 Due From Other Agencies 1220 0.00 0.00 0.00 0.00 Inventory 1150 0.00 0.00 0.00 0.00 Total Assets 1,547,332.00 4,857,714.00 4,710,755.00 1,694,291.00 DEFERRED OUTFLOWS OF RESOURCES Accumulated Decrease in Fair Value of Hedging Derivatives 1910 Pension 1940 Other Postemployment Benefits 1950 Total Deferred Outflows of Resources LIABILITIES Cash Overdraft 2125 0.00 0.00 0.00 0.00 Accrued Salaries and Benefits 2110 0.00 0.00 0.00 0.00 Payroll Deductions and Withholdings 2170 0.00 0.00 0.00 0.00 Accounts Payable 2120 0.00 0.00 0.00 0.00 Internal Accounts Payable 2290 1,547,332.00 4,857,714.00 4,710,755.00 1,694,291.00 Due to Other Agencies 2230 Due to Budgetary Funds 2161 0.00 0.00 0.00 0.00 Total Liabilities 1,547,332.00 4,857,714.00 4,710,755.00 1,694,291.00 DEFERRED INFLOWS OF RESOURCES Accumulated Increase in Fair Value of Hedging Derivatives 2610 Pension 2640 Other Postemployment Benefits 2650 Total Deferred Inflows of Resources
The notes to financial statements are an integral part of this statement. ESE 145

(THIS PAGE LEFT INTENTIONALLY BLANK)

Exhibit J-1 Page 58
DISTRICT SCHOOL BOARD OF HERNANDO COUNTY COMBINING STATEMENT OF NET POSITION NONMAJOR COMPONENT UNITS June 30, 2016
Account Number
B.E.S.T Academy (Charter School)
ASSETS Cash and Cash Equivalents 1110 93,659.00 Investments 1160 0.00 Inventory 1150 0.00 Prepaid Items 1230 0.00
Capital Assets: Improvements Other Than Buildings 1320 0.00
Less Accumulated Depreciation 1329 0.00 Furniture, Fixtures and Equipment 1340 88,021.00
Less Accumulated Depreciation 1349 (32,262.00) Motor Vehicles 1350 96,381.00
Less Accumulated Depreciation 1359 (28,914.00) Depreciable Capital Assets, Net 123,226.00
Total Capital Assets 123,226.00 Total Assets 216,885.00 LIABILITIES
Accrued Salaries and Benefits 2110 23,341.00 Accounts Payable 2120 4,610.00
Noncurrent Liabilities: Portion Due Within One Year:
Notes Payable 2310 16,098.00 Due Within One Year 16,098.00
Portion Due After One Year: Notes Payable 2310 39,783.00 Due in More than One Year 39,783.00
Total Long-Term Liabilities 55,881.00 Total Liabilities 83,832.00 NET POSITION Net Investment in Capital Assets 2770 67,345.00 Restricted For:
Categorical Carryover Programs 2780 0.00 Food Service 2780 0.00 Debt Service 2780 0.00 Capital Projects 2780 0.00 Other Purposes 2780 0.00
Unrestricted 2790 65,708.00 Total Net Position 133,053.00
The notes to financial statements are an integral part of this statement. ESE 145
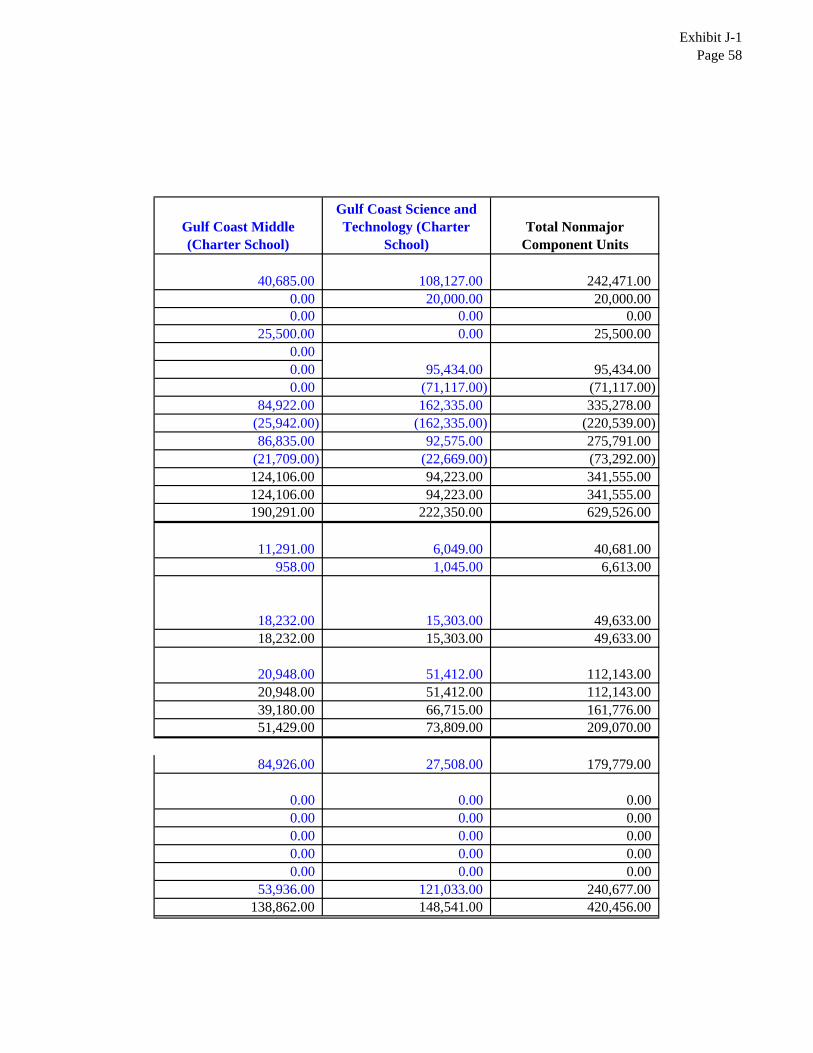
Exhibit J-1 Page 58
Gulf Coast Middle (Charter School)
Gulf Coast Science and Technology (Charter
School) Total Nonmajor
Component Units
40,685.00 108,127.00 242,471.00 0.00 20,000.00 20,000.00 0.00 0.00 0.00
25,500.00 0.00 25,500.00 0.00 0.00 95,434.00 95,434.00 0.00 (71,117.00) (71,117.00)
84,922.00 162,335.00 335,278.00 (25,942.00) (162,335.00) (220,539.00) 86,835.00 92,575.00 275,791.00
(21,709.00) (22,669.00) (73,292.00) 124,106.00 94,223.00 341,555.00 124,106.00 94,223.00 341,555.00 190,291.00 222,350.00 629,526.00
11,291.00 6,049.00 40,681.00 958.00 1,045.00 6,613.00
18,232.00 15,303.00 49,633.00 18,232.00 15,303.00 49,633.00
20,948.00 51,412.00 112,143.00 20,948.00 51,412.00 112,143.00 39,180.00 66,715.00 161,776.00 51,429.00 73,809.00 209,070.00
84,926.00 27,508.00 179,779.00
0.00 0.00 0.00 0.00 0.00 0.00 0.00 0.00 0.00 0.00 0.00 0.00 0.00 0.00 0.00
53,936.00 121,033.00 240,677.00 138,862.00 148,541.00 420,456.00

Exhibit J-2a Page 59
DISTRICT SCHOOL BOARD OF HERNANDO COUNTY COMBINING STATEMENT OF ACTIVITIES NONMAJOR COMPONENT UNITS B.E.S.T Academy (Charter School) For the Fiscal Year Ended June 30, 2016
FUNCTIONS Account Number Expenses
Program Revenues Net (Expense) Revenue and Changes
in Net Position Component Unit
Charges for Services
Operating Grants and
Contributions
Capital Grants and
Contributions Component Unit Activities:
Instruction 5000 439,583.00 30,476.00 0.00 0.00 (409,107.00) Student Support Services 6100 0.00 0.00 0.00 0.00 0.00 Instructional Media Services 6200 0.00 0.00 0.00 0.00 0.00 Instruction and Curriculum Development Services 6300 0.00 0.00 0.00 0.00 0.00 Instructional Staff Training Services 6400 0.00 0.00 0.00 0.00 0.00 Instruction-Related Technology 6500 0.00 0.00 0.00 0.00 0.00 Board 7100 13,767.00 0.00 0.00 0.00 (13,767.00) General Administration 7200 36,245.00 0.00 0.00 0.00 (36,245.00) School Administration 7300 200,968.00 0.00 0.00 0.00 (200,968.00) Facilities Acquisition and Construction 7400 42,150.00 0.00 0.00 0.00 (42,150.00) Fiscal Services 7500 15,396.00 0.00 0.00 0.00 (15,396.00) Food Services 7600 0.00 0.00 0.00 0.00 0.00 Central Services 7700 0.00 0.00 0.00 0.00 0.00 Student Transportation Services 7800 4,646.00 0.00 0.00 0.00 (4,646.00) Operation of Plant 7900 17,429.00 0.00 0.00 0.00 (17,429.00) Maintenance of Plant 8100 0.00 0.00 0.00 0.00 0.00 Administrative Technology Services 8200 0.00 0.00 0.00 0.00 0.00 Community Services 9100 0.00 0.00 0.00 0.00 0.00 Interest on Long-Term Debt 9200 3,690.00 0.00 0.00 0.00 (3,690.00) Unallocated Depreciation/Amortization Expense 37,245.00 (37,245.00)
Total Component Unit Activities 811,119.00 30,476.00 0.00 0.00 (780,643.00)
General Revenues: Taxes:
Property Taxes, Levied for Operational Purposes Property Taxes, Levied for Debt Service Property Taxes, Levied for Capital Projects Local Sales Taxes
Grants and Contributions Not Restricted to Specific Programs Investment Earnings Miscellaneous Special Items Extraordinary Items Transfers Total General Revenues, Special Items, Extraordinary Items and Transfers Change in Net Position Net Position, July 1, 2015 Adjustments to Net Position Net Position, June 30, 2016
The notes to financial statements are an integral part of this statement. ESE 145
0.00 0.00 0.00 0.00
25,130.00 0.00
760,549.00 0.00 0.00 0.00
785,679.00 5,036.00
128,017.00 0.00
133,053.00

Exhibit J-2b Page 60
DISTRICT SCHOOL BOARD OF HERNANDO COUNTY COMBINING STATEMENT OF ACTIVITIES (CONTINUED) NONMAJOR COMPONENT UNITS Gulf Coast Middle (Charter School) For the Fiscal Year Ended June 30, 2016
FUNCTIONS Account Number Expenses
Program Revenues Net (Expense) Revenue and Changes
in Net Position Component Unit
Charges for Services
Operating Grants and
Contributions
Capital Grants and
Contributions Component Unit Activities:
Instruction 5000 407,142.00 57,602.00 0.00 0.00 (349,540.00) Student Support Services 6100 0.00 0.00 0.00 0.00 0.00 Instructional Media Services 6200 0.00 0.00 0.00 0.00 0.00 Instruction and Curriculum Development Services 6300 0.00 0.00 0.00 0.00 0.00 Instructional Staff Training Services 6400 544.00 0.00 0.00 0.00 (544.00) Instruction-Related Technology 6500 0.00 0.00 0.00 0.00 0.00 Board 7100 26,468.00 0.00 0.00 0.00 (26,468.00) General Administration 7200 32,760.00 0.00 0.00 0.00 (32,760.00) School Administration 7300 152,545.00 0.00 0.00 0.00 (152,545.00) Facilities Acquisition and Construction 7400 102,000.00 0.00 0.00 0.00 (102,000.00) Fiscal Services 7500 9,307.00 0.00 0.00 0.00 (9,307.00) Food Services 7600 643.00 0.00 0.00 0.00 (643.00) Central Services 7700 5,096.00 0.00 0.00 0.00 (5,096.00) Student Transportation Services 7800 14,501.00 0.00 0.00 0.00 (14,501.00) Operation of Plant 7900 0.00 0.00 0.00 0.00 0.00 Maintenance of Plant 8100 0.00 0.00 0.00 0.00 0.00 Administrative Technology Services 8200 0.00 0.00 0.00 0.00 0.00 Community Services 9100 0.00 0.00 0.00 0.00 0.00 Interest on Long-Term Debt 9200 2,751.00 0.00 0.00 0.00 (2,751.00) Unallocated Depreciation/Amortization Expense 25,276.00 (25,276.00)
Total Component Unit Activities 779,033.00 57,602.00 0.00 0.00 (721,431.00)
General Revenues: Taxes:
Property Taxes, Levied for Operational Purposes Property Taxes, Levied for Debt Service Property Taxes, Levied for Capital Projects Local Sales Taxes
Grants and Contributions Not Restricted to Specific Programs Investment Earnings Miscellaneous Special Items Extraordinary Items Transfers Total General Revenues, Special Items, Extraordinary Items and Transfers Change in Net Position Net Position, July 1, 2015 Adjustments to Net Position Net Position, June 30, 2016
The notes to financial statements are an integral part of this statement. ESE 145
0.00 0.00 0.00 0.00
20,067.00 0.00
716,157.00 0.00 0.00 0.00
736,224.00 14,793.00
124,069.00 0.00
138,862.00

Exhibit J-2c Page 61
DISTRICT SCHOOL BOARD OF HERNANDO COUNTY COMBINING STATEMENT OF ACTIVITIES (CONTINUED) NONMAJOR COMPONENT UNITS Gulf Coast Science and Technology (Charter School) For the Fiscal Year Ended June 30, 2016
FUNCTIONS Account Number Expenses
Program Revenues Net (Expense) Revenue and Changes
in Net Position Component Unit
Charges for Services
Operating Grants and
Contributions
Capital Grants and
Contributions Component Unit Activities:
Instruction 5000 596,620.00 121,035.00 0.00 0.00 (475,585.00) Student Support Services 6100 0.00 0.00 0.00 0.00 0.00 Instructional Media Services 6200 0.00 0.00 0.00 0.00 0.00 Instruction and Curriculum Development Services 6300 0.00 0.00 0.00 0.00 0.00 Instructional Staff Training Services 6400 962.00 0.00 0.00 0.00 (962.00) Instruction-Related Technology 6500 0.00 0.00 0.00 0.00 0.00 Board 7100 16,303.00 0.00 0.00 0.00 (16,303.00) General Administration 7200 15,304.00 0.00 0.00 0.00 (15,304.00) School Administration 7300 175,960.00 0.00 0.00 0.00 (175,960.00) Facilities Acquisition and Construction 7400 84,000.00 0.00 0.00 19,687.00 (64,313.00) Fiscal Services 7500 11,438.00 0.00 0.00 0.00 (11,438.00) Food Services 7600 2,486.00 1,262.00 0.00 0.00 (1,224.00) Central Services 7700 0.00 0.00 0.00 0.00 0.00 Student Transportation Services 7800 46,577.00 0.00 0.00 0.00 (46,577.00) Operation of Plant 7900 23,864.00 0.00 0.00 0.00 (23,864.00) Maintenance of Plant 8100 0.00 0.00 0.00 0.00 0.00 Administrative Technology Services 8200 0.00 0.00 0.00 0.00 0.00 Community Services 9100 0.00 0.00 0.00 0.00 0.00 Interest on Long-Term Debt 9200 4,194.00 0.00 0.00 0.00 (4,194.00) Unallocated Depreciation/Amortization Expense 25,701.00 (25,701.00)
Total Component Unit Activities 1,003,409.00 122,297.00 0.00 19,687.00 (861,425.00)
General Revenues: Taxes:
Property Taxes, Levied for Operational Purposes Property Taxes, Levied for Debt Service Property Taxes, Levied for Capital Projects Local Sales Taxes
Grants and Contributions Not Restricted to Specific Programs Investment Earnings Miscellaneous Special Items Extraordinary Items Transfers Total General Revenues, Special Items, Extraordinary Items and Transfers Change in Net Position Net Position, July 1, 2015 Adjustments to Net Position Net Position, June 30, 2016
The notes to financial statements are an integral part of this statement. ESE 145
0.00 0.00 0.00 0.00
84,789.00 0.00
778,947.00 0.00 0.00 0.00
863,736.00 2,311.00
146,230.00 0.00
148,541.00

Exhibit J-2d Page 62
DISTRICT SCHOOL BOARD OF HERNANDO COUNTY COMBINING STATEMENT OF ACTIVITIES (CONTINUED) NONMAJOR COMPONENT UNITS Hernando County Education Foundation For the Fiscal Year Ended June 30, 2016
FUNCTIONS Account Number Expenses
Program Revenues Net (Expense) Revenue and Changes
in Net Position Component Unit
Charges for Services
Operating Grants and
Contributions
Capital Grants and
Contributions Component Unit Activities:
Instruction 5000 0.00 0.00 0.00 0.00 0.00 Student Support Services 6100 0.00 0.00 0.00 0.00 0.00 Instructional Media Services 6200 0.00 0.00 0.00 0.00 0.00 Instruction and Curriculum Development Services 6300 0.00 0.00 0.00 0.00 0.00 Instructional Staff Training Services 6400 0.00 0.00 0.00 0.00 0.00 Instruction-Related Technology 6500 0.00 0.00 0.00 0.00 0.00 Board 7100 0.00 0.00 0.00 0.00 0.00 General Administration 7200 0.00 0.00 0.00 0.00 0.00 School Administration 7300 0.00 0.00 0.00 0.00 0.00 Facilities Acquisition and Construction 7400 0.00 0.00 0.00 0.00 0.00 Fiscal Services 7500 0.00 0.00 0.00 0.00 0.00 Food Services 7600 0.00 0.00 0.00 0.00 0.00 Central Services 7700 0.00 0.00 0.00 0.00 0.00 Student Transportation Services 7800 0.00 0.00 0.00 0.00 0.00 Operation of Plant 7900 0.00 0.00 0.00 0.00 0.00 Maintenance of Plant 8100 0.00 0.00 0.00 0.00 0.00 Administrative Technology Services 8200 0.00 0.00 0.00 0.00 0.00 Community Services 9100 0.00 0.00 0.00 0.00 0.00 Interest on Long-Term Debt 9200 0.00 0.00 0.00 0.00 0.00 Unallocated Depreciation/Amortization Expense 0.00 0.00 0.00 0.00 0.00
Total Component Unit Activities 0.00 0.00 0.00 0.00 0.00
General Revenues: Taxes:
Property Taxes, Levied for Operational Purposes Property Taxes, Levied for Debt Service Property Taxes, Levied for Capital Projects Local Sales Taxes
Grants and Contributions Not Restricted to Specific Programs Investment Earnings Miscellaneous Special Items Extraordinary Items Transfers Total General Revenues, Special Items, Extraordinary Items and Transfers Change in Net Position Net Position, July 1, 2015 Adjustments to Net Position Net Position, June 30, 2016
The notes to financial statements are an integral part of this statement. ESE 145
0.00 0.00 0.00 0.00 0.00 0.00 0.00 0.00 0.00 0.00 0.00 0.00 0.00 0.00 0.00

Exhibit J-2e Page 63
DISTRICT SCHOOL BOARD OF HERNANDO COUNTY COMBINING STATEMENT OF ACTIVITIES (CONTINUED) NONMAJOR COMPONENT UNITS TOTAL NONMAJOR COMPONENT UNITS For the Fiscal Year Ended June 30, 2016
FUNCTIONS Account Number Expenses
Program Revenues Net (Expense) Revenue and Changes
in Net Position Component Unit
Charges for Services
Operating Grants and
Contributions
Capital Grants and
Contributions Component Unit Activities:
Instruction 5000 1,443,345.00 209,113.00 0.00 0.00 (1,234,232.00) Student Support Services 6100 0.00 0.00 0.00 0.00 Instructional Media Services 6200 0.00 0.00 0.00 0.00 0.00 Instruction and Curriculum Development Services 6300 0.00 0.00 0.00 0.00 0.00 Instructional Staff Training Services 6400 1,506.00 0.00 0.00 0.00 (1,506.00) Instruction-Related Technology 6500 0.00 0.00 0.00 0.00 0.00 Board 7100 56,538.00 0.00 0.00 0.00 (56,538.00) General Administration 7200 84,309.00 0.00 0.00 0.00 (84,309.00) School Administration 7300 529,473.00 0.00 0.00 0.00 (529,473.00) Facilities Acquisition and Construction 7400 228,150.00 0.00 0.00 19,687.00 (208,463.00) Fiscal Services 7500 36,141.00 0.00 0.00 0.00 (36,141.00) Food Services 7600 3,129.00 1,262.00 0.00 0.00 (1,867.00) Central Services 7700 5,096.00 0.00 0.00 0.00 (5,096.00) Student Transportation Services 7800 65,724.00 0.00 0.00 0.00 (65,724.00) Operation of Plant 7900 41,293.00 0.00 0.00 0.00 (41,293.00) Maintenance of Plant 8100 0.00 0.00 0.00 0.00 0.00 Administrative Technology Services 8200 0.00 0.00 0.00 0.00 0.00 Community Services 9100 0.00 0.00 0.00 0.00 0.00 Interest on Long-Term Debt 9200 10,635.00 0.00 0.00 0.00 (10,635.00) Unallocated Depreciation/Amortization Expense 88,222.00 (88,222.00)
Total Component Unit Activities 2,593,561.00 210,375.00 0.00 19,687.00 (2,363,499.00)
General Revenues: Taxes:
Property Taxes, Levied for Operational Purposes Property Taxes, Levied for Debt Service Property Taxes, Levied for Capital Projects Local Sales Taxes
Grants and Contributions Not Restricted to Specific Programs Investment Earnings Miscellaneous Special Items Extraordinary Items Transfers Total General Revenues, Special Items, Extraordinary Items and Transfers Change in Net Position Net Position, July 1, 2015 Adjustments to Net Position Net Position, June 30, 2016
The notes to financial statements are an integral part of this statement. ESE 145
0.00 0.00 0.00 0.00
129,986.00 0.00
2,255,653.00 0.00 0.00 0.00
2,385,639.00 22,140.00
398,316.00 0.00
420,456.00

THE DISTRICT SCHOOL BOARD OF HERNANDO COUNTY, FLORIDA
SUPERINTENDENT’S ANNUAL FINANCIAL REPORT
FOR THE FISCAL YEAR ENDED JUNE 30, 2016
ISSUED BY:
SECTION VI
OTHER SUPPLEMENTARY INFORMATION

ISSUED BY:

FLORIDA DEPARTMENT OF EDUCATION REPORT OF FINANCIAL DATA TO THE
COJVL'VIISSIONER OF EDUCATION (ESE 348) DISTRICT SCHOOL BOARD OF HERNANDO COlJNTY
For the Fiscal Year Ended June 30, 2016
Retum completed torm (0;
Florida Department of Education Office ofFunding and Financial Reporting 325 West Gaines SlTeet, Room 814 Talfahassec. Florida 32399·040f)
PAGE NllMBER
INDEX, FDOE
Exhibit K·l Statement of Rcvenues l Expenditures and Changes in Fund Balance- - Ge-neral Fund ~~~~~~~~--~~~~-~----~---~----- 1-3
Exhibit K-2 Statement of Revenues, Expenditures and Changes in Fund Ba1ance - SpeciaJ Revenue Funds Food Services 4-5
Exhibit K-3 Statement of Revenues, Expenditures and Changes in Fund Balance - Special Revenue Funds - Other Federal Progra lllS ~_~~~~~~~~~~~~~~~w~_~~_~~__ ¥ __~~_________ _______________________________~_~_N_~_&_____~~__~____---- 6-7
Exhibit K-4 Combining Statement of Revenues) Expenditnres and Changes in Fund Balance - Special Revenue funds Federal Economic Stimulus Programs •••••• - ••••••••• ---.-------.----------------------------------------- 8-11
Exhibit K-5 Statement of Revenues, Expenditnres and Changes in Fund Balance - Special Revenue Funds Miseellaneous .--.•-..••••• - •.•••...•••••••• -••.. --.....--.--------------------------.-.--.----..-.---••• 12
ExhibitK-6 Combining Statement of Revenues, Expenditures and Changes in Fund Balances - Debt Service Funds --------- 13
Exhibit K-7 Combining Statement of Revenues, Expenditnres and Changes in Fnnd Balances ~ Capital Projects Funds -----~ 14-15
Exhibit K-8 Statement of Revenues, Expenditnres and Changes in Fund Balance - Permanent Funds ----------------------- 16
Exhibit K-9 Combining Statement of Revenues, Expenses and Changes in Fund Net Position - Enterprise Funds ------------ 17
Exhibit K-l 0 Combining Statement of Revenue..;;, Expenses and Changes in Fund Net Position - Internal Service Funds ------\8
Exhibit K·ll Combining Statement of Changes in Assets and Liabilities - School Internal Funds .-.-..--.....-.-.-................. 19
Exhibit K·12 Schedule of Long· Term Liab iliti es •••••••••• -.-••• -••••• -•.• -•.•••• ------------------------------------------------------------- 20
Exhibit K-13 Schedule of Categorical Programs ... Report of Expenditul'es and Available Funds .-------.-------.---.-.---......--... 21
Exhibit K·14 Schedule of Selected Subobjcct Expenditures, Specific Academic Classroom Instruction and Other Data Collection ------------------------------------------------------------------------------------------------------------------ 22-24
Exhibit K· 15 Supplemental Schedule - Voluntary Prekindergarten (VPK) Program, General Fund Expenditures -------.------ 25
Exhibit K·16 SchedUle 3, School Program Cost Report, General Fund/Special Revenue Funds (Sample Form PC-3) --------- 26
Exhibit K-17 Schedule 4, District Aggregate Program Cost Report, General Fund/Special Revenue Funds (Sample Form PC-4) --------.-----.-------..-.--.--.--..- ...-..- •. -..- ..- ..-.-..-..- ..-..--------------------------------- 27
ExhibitK·18 Schedule 5. Supplementary Schedule ofFederal Financial Assistance Program Expenditure, ---.--------.- 28
The Report of Financial Data to the Commissioner of Education (ESE 348) for the fiscal year ended June 30, 2016, was submitted in aceordance with rule 6A·l.0071, Flotida Administrative Code (section lOOl.SI(12)(b), Florida Statutes). This report was approved by the school board on September 6, 2016.
~1' 7(ml.-LiJ,--:Signature of District School Superintendent
=-fl1 . --_
ESE 348

ISSUED BY:

DISTRICT SCHOOL BOARD OF HERNANDO COUNTY STATEMENT OF REVENUES, EXPENDITURES AND Exhibit K-1 CHANGES IN FUND BALANCE - GENERAL FUND FDOE Page 1 For the Fiscal Year Ended June 30, 2016 Fund 100
REVENUES Account Number
Federal Direct: Federal Impact, Current Operations 3121 Reserve Officers Training Corps (ROTC) 3191 212,975.00 Miscellaneous Federal Direct 3199 Total Federal Direct 3100 212,975.00
Federal Through State and Local: Medicaid 3202 663,611.00 National Forest Funds 3255 Federal Through Local 3280 Miscellaneous Federal Through State 3299 Total Federal Through State and Local 3200 663,611.00
State: Florida Education Finance Program (FEFP) 3310 82,146,741.00 Workforce Development 3315 565,514.00 Workforce Development Capitalization Incentive Grant 3316 Workforce Education Performance Incentive 3317 Adults with Disabilities 3318 CO&DS Withheld for Administrative Expenditure 3323 13,153.00 Diagnostic and Learning Resources Centers 3335 Sales Tax Distribution (s. 212.20(6)(d)6.a., F.S.) 3341 State Forest Funds 3342 State License Tax 3343 74,859.00 District Discretionary Lottery Funds 3344 23,405,339.00
Categorical Programs: Class Size Reduction Operating Funds 3355 1,251,270.00 Florida School Recognition Funds 3361 Voluntary Prekindergarten Program 3371 Preschool Projects 3372
Other State: Reading Programs 3373 Full-Service Schools Program 3378 State Through Local 3380 Other Miscellaneous State Revenues 3399 408,241.00
Total State 3300 107,865,117.00 Local:
District School Taxes 3411 46,299,805.00 Tax Redemptions 3421 135,613.00 Payment in Lieu of Taxes 3422 Excess Fees 3423 Tuition 3424 Rent 3425 116,289.00 Interest on Investments 3431 49,074.00 Gain on Sale of Investments 3432 Net Increase (Decrease) in Fair Value of Investments 3433 Gifts, Grants and Bequests 3440 430,663.00 Student Fees:
Adult General Education Course Fees 3461 16,570.00 Postsec Career Cert-Appl Tech Diploma Course Fees 3462 58,736.00 Continuing Workforce Education Course Fees 3463 Capital Improvement Fees 3464 Postsecondary Lab Fees 3465 Lifelong Learning Fees 3466 3,495.00 GED® Testing Fees 3467 5,711.00 Financial Aid Fees 3468 Other Student Fees 3469
Other Fees: Preschool Program Fees 3471 Prekindergarten Early Intervention Fees 3472 School-Age Child Care Fees 3473 Other Schools, Courses and Classes Fees 3479
Miscellaneous Local: Bus Fees 3491 73,783.00 Transportation Services Rendered for School Activities 3492 78,220.00 Sale of Junk 3493 20,980.00 Receipt of Federal Indirect Cost Rate 3494 536,692.00 Other Miscellaneous Local Sources 3495 2,166,733.00 Impact Fees 3496 Refunds of Prior Year's Expenditures 3497 401,555.00 Collections for Lost, Damaged and Sold Textbooks 3498 13,008.00 Receipt of Food Service Indirect Costs 3499 220,920.00
Total Local 3400 50,627,847.00 Total Revenues 3000 159,369,550.00
ESE 348

DISTRICT SCHOOL BOARD OF HERNANDO COUNTY Exhibit K-1 STATEMENT OF REVENUES, EXPENDITURES AND CHANGES IN FUND BALANCE - GENERAL FUND (Continued) FDOE Page 2 For the Fiscal Year Ended June 30, 2016 Fund 100
EXPENDITURES Account Number
100 200 300
Salaries Employee Benefits
Purchased Services
Current:
Instruction 5000 71,690,624.00 21,716,726.00 5,526,592.00
Student Support Services 6100 5,001,843.00 1,428,191.00 13,285.00
Instructional Media Services 6200 1,271,484.00 359,379.00 108,573.00
Instruction and Curriculum Development Services 6300 1,097,259.00 273,241.00 155,303.00
Instructional Staff Training Services 6400 478,163.00 137,602.00 29,178.00
Instruction-Related Technology 6500 153,592.00 63,226.00 557.00
Board 7100 201,285.00 126,398.00 177,291.00
General Administration 7200 603,574.00 172,635.00 79,994.00
School Administration 7300 8,482,212.00 2,506,816.00 59,074.00
Facilities Acquisition and Construction 7410 205,558.00 54,996.00 51,898.00
Fiscal Services 7500 491,488.00 161,352.00 87,690.00
Food Services 7600 518.00 39.00
Central Services 7700 886,274.00 293,516.00 131,060.00
Student Transportation Services 7800 3,771,013.00 1,536,209.00 284,686.00
Operation of Plant 7900 4,064,762.00 1,626,790.00 3,116,823.00
Maintenance of Plant 8100 2,695,205.00 919,218.00 735,678.00
Administrative Technology Services 8200 1,245,904.00 361,176.00 338,153.00
Community Services 9100 5,417.00 Capital Outlay:
Facilities Acquisition and Construction 7420
Other Capital Outlay 9300 Debt Service: (Function 9200)
Redemption of Principal 710
Interest 720
Total Expenditures 102,340,758.00 31,737,510.00 10,901,252.00
Excess (Deficiency) of Revenues Over Expenditures
ESE 348

Exhibit K-1 FDOE Page 2
Fund 100 400 500 600 700
TotalsEnergy Services
Materials and Supplies
Capital Outlay Other
2,536,094.00 1,022,821.00 617,684.00 103,110,541.00
4,266.00 30,870.00 366.00 25,805.00 6,504,626.00
96.00 10,278.00 97,275.00 1,645.00 1,848,730.00
169.00 26,810.00 6,960.00 1,710.00 1,561,452.00
17,781.00 22,344.00 7,914.00 692,982.00
217,375.00
545.00 65.00 505,584.00
5,899.00 381.00 11,010.00 873,493.00
56,875.00 17,510.00 144,190.00 11,266,677.00
3,271.00 1,023.00 469.00 317,215.00
5,513.00 1,424.00 37,587.00 785,054.00
557.00
52,947.00 12,784.00 16,421.00 1,393,002.00
783,015.00 560,494.00 39,660.00 28,539.00 7,003,616.00
5,320,753.00 359,747.00 61,433.00 56,695.00 14,607,003.00
98,819.00 863,977.00 60,982.00 6,036.00 5,379,915.00
30,481.00 625,905.00 1,230.00 2,602,849.00
742.00 6,159.00
126,925.00 126,925.00
400,858.00 400,858.00
0.00
0.00
6,207,118.00 4,562,324.00 2,498,651.00 957,000.00 159,204,613.00
164,937.00

DISTRICT SCHOOL BOARD OF HERNANDO COUNTY
STATEMENT OF REVENUES, EXPENDITURES AND Exhibit K-1
CHANGES IN FUND BALANCE - GENERAL FUND (Continued) FDOE Page 3
For the Fiscal Year Ended June 30, 2016 Fund 100
OTHER FINANCING SOURCES (USES)
and CHANGES IN FUND BALANCES
Account
Number
Loans 3720
Sale of Capital Assets 3730
Loss Recoveries 3740 59,145.00
Transfers In:
From General Funds 3610 0.00
From Debt Service Funds 3620
From Capital Projects Funds 3630 5,068,054.00
From Special Revenue Funds 3640
From Permanent Funds 3660
From Internal Service Funds 3670
From Enterprise Funds 3690
Total Transfers In 3600 5,068,054.00
Transfers Out: (Function 9700)
To Debt Service Funds 920 (1,347,189.00)
To Capital Projects Funds 930 (252,340.00)
To Special Revenue Funds 940 (55,888.00)
To Permanent Funds 960
To Internal Service Funds 970
To Enterprise Funds 990
Total Transfers Out 9700 (1,655,417.00)
Total Other Financing Sources (Uses) 3,471,782.00
Net Change In Fund Balance 3,636,719.00
Fund Balance, July 1, 2015 2800 6,402,667.00
Adjustments to Fund Balance 2891 (3,814.00)
Ending Fund Balance:
Nonspendable Fund Balance 2710 1,570,675.00
Restricted Fund Balance 2720 966,179.00
Committed Fund Balance 2730
Assigned Fund Balance 2740 923,563.00
Unassigned Fund Balance 2750 6,575,155.00
Total Fund Balances, June 30, 2016 2700 10,035,572.00
ESE 348

DISTRICT SCHOOL BOARD OF HERNANDO COUNTY STATEMENT OF REVENUES, EXPENDITURES AND CHANGES IN FUND BALANCE - SPECIAL REVENUE Exhibit K-2 FUNDS - FOOD SERVICES FDOE Page 4 For the Fiscal Year Ended June 30, 2016 Fund 410
REVENUES Account Number
Federal Through State and Local:
School Lunch Reimbursement 3261 6,226,729.00
School Breakfast Reimbursement 3262 1,769,445.00
Afterschool Snack Reimbursement 3263 141,075.00
Child Care Food Program 3264 374,303.00
USDA-Donated Commodities 3265
Cash in Lieu of Donated Foods 3266 780,408.00
Summer Food Service Program 3267 317,520.00
Fresh Fruit and Vegetable Program 3268 1,000.00
Other Food Services 3269 95,787.00
Federal Through Local 3280
Miscellaneous Federal Through State 3299
Total Federal Through State and Local 3200 9,706,267.00 State:
School Breakfast Supplement 3337 57,926.00
School Lunch Supplement 3338 78,708.00
State Through Local 3380
Other Miscellaneous State Revenues 3399
Total State 3300 136,634.00 Local:
Interest on Investments 3431 2,517.00
Gain on Sale of Investments 3432
Net Increase (Decrease) in Fair Value of Investments 3433
Gifts, Grants and Bequests 3440
Student Lunches 3451 863,223.00
Student Breakfasts 3452 89,375.00
Adult Breakfasts/Lunches 3453 50,525.00
Student and Adult á la Carte Fees 3454 809,430.00
Student Snacks 3455 11,245.00
Other Food Sales 3456 11,581.00
Other Miscellaneous Local Sources 3495 15,826.00
Refunds of Prior Year's Expenditures 3497
Total Local 3400 1,853,722.00
Total Revenues 3000 11,696,623.00
ESE 348

DISTRICT SCHOOL BOARD OF HERNANDO COUNTY STATEMENT OF REVENUES, EXPENDITURES AND CHANGES IN FUND BALANCE - SPECIAL REVENUE Exhibit K-2 FUNDS - FOOD SERVICES (Continued) FDOE Page 5 For the Fiscal Year Ended June 30, 2016 Fund 410
EXPENDITURES (Function 7600/9300) Account Number
Salaries 100 3,428,419.00
Employee Benefits 200 1,448,645.00
Purchased Services 300 102,544.00
Energy Services 400 329,450.00
Materials and Supplies 500 4,792,901.00
Capital Outlay 600 115,098.00
Other 700 260,843.00
Other Capital Outlay (Function 9300) 600 201,146.00
Total Expenditures 10,679,046.00
Excess (Deficiency) of Revenues Over Expenditures 1,017,577.00 OTHER FINANCING SOURCES (USES)
and CHANGES IN FUND BALANCES
Loans 3720
Sale of Capital Assets 3730
Loss Recoveries 3740 Transfers In:
From General Fund 3610 55,888.00
From Debt Service Funds 3620
From Capital Projects Funds 3630
Interfund 3650
From Permanent Funds 3660
From Internal Service Funds 3670
From Enterprise Funds 3690
Total Transfers In 3600 55,888.00 Transfers Out: (Function 9700)
To General Fund 910
To Debt Service Funds 920
To Capital Projects Funds 930
Interfund 950
To Permanent Funds 960
To Internal Service Funds 970
To Enterprise Funds 990
Total Transfers Out 9700 0.00
Total Other Financing Sources (Uses) 55,888.00
Net Change in Fund Balance 1,073,465.00
Fund Balance, July 1, 2015 2800 2,856,743.00
Adjustments to Fund Balance 2891 2,420.00 Ending Fund Balance:
Nonspendable Fund Balance 2710 132,059.00
Restricted Fund Balance 2720 3,800,569.00
Committed Fund Balance 2730
Assigned Fund Balance 2740
Unassigned Fund Balance 2750
Total Fund Balances, June 30, 2016 2700 3,932,628.00
ESE 348

DISTRICT SCHOOL BOARD OF HERNANDO COUNTY STATEMENT OF REVENUES, EXPENDITURES AND CHANGES IN FUND BALANCE - SPECIAL REVENUE Exhibit K-3 FUNDS - OTHER FEDERAL PROGRAMS FDOE Page 6 For the Fiscal Year Ended June 30, 2016 Fund 420
REVENUES Account Number
Federal Direct:
Head Start 3130
Workforce Innovation and Opportunity Act 3170
Community Action Programs 3180
Reserve Officers Training Corps (ROTC) 3191
Pell Grants 3192
Miscellaneous Federal Direct 3199
Total Federal Direct 3100 0.00 Federal Through State and Local:
Career and Technical Education 3201 251,953.00
Medicaid 3202
Individuals with Disabilities Education Act (IDEA) 3230 4,859,108.00 Workforce Innovation and Opportunity Act:
Adult General Education 3221 239,481.00
English Literacy and Civics Education 3222
Adult Migrant Education 3223
Other WIOA Programs 3224 NCLB - Elementary and Secondary Education Act:
Elementary and Secondary Education Act - Title I 3240 5,641,395.00
Teacher and Principal Training and Recruiting - Title II, Part A 3225
Math and Science Partnerships - Title II, Part B 3226 738,046.00
Language Instruction - Title III 3241
Twenty-First Century Schools - Title IV 3242
Federal Through Local 3280
Emergency Immigrant Education Program 3293
Miscellaneous Federal Through State 3299 103,624.00
Total Federal Through State and Local 3200 11,833,607.00 State:
State Through Local 3380
Other Miscellaneous State Revenues 3399
Total State 3300 0.00 Local:
Interest on Investments 3431
Gain on Sale of Investments 3432
Net Increase (Decrease) in Fair Value of Investments 3433
Gifts, Grants and Bequests 3440
Adult General Education Course Fees 3461
Sale of Junk 3493
Other Miscellaneous Local Sources 3495
Refunds of Prior Year's Expenditures 3497
Total Local 3400 0.00
Total Revenues 3000 11,833,607.00
ESE 348

DISTRICT SCHOOL BOARD OF HERNANDO COUNTY STATEMENT OF REVENUES, EXPENDITURES AND CHANGES IN FUND BALANCE - SPECIAL REVENUE FUNDS - OTHER FEDERAL PROGRAMS (Continued) For the Fiscal Year Ended June 30, 2016
Exhibit K-3
FDOE Page 7 Fund 420
EXPENDITURES Account Number
100 200 300
Salaries Employee Benefits
Purchased Services
Current:
Instruction 5000 1,826,687.00 661,275.00 248,018.00
Student Support Services 6100 1,577,203.00 452,179.00 38,209.00
Instructional Media Services 6200
Instruction and Curriculum Development Services 6300 2,101,998.00 582,985.00 62,613.00
Instructional Staff Training Services 6400 1,486,445.00 395,953.00 237,737.00
Instruction-Related Technology 6500 385,041.00 137,430.00
Board 7100
General Administration 7200
School Administration 7300
Facilities Acquisition and Construction 7410
Fiscal Services 7500
Food Services 7600
Central Services 7700
Student Transportation Services 7800 18,668.00 3,123.00
Operation of Plant 7900
Maintenance of Plant 8100
Administrative Technology Services 8200
Community Services 9100 Capital Outlay:
Facilities Acquisition and Construction 7420
Other Capital Outlay 9300
Total Expenditures 7,396,042.00 2,232,945.00 586,577.00
Excess (Deficiency) of Revenues over Expenditures OTHER FINANCING SOURCES (USES)
and CHANGES IN FUND BALANCES Account Number
Loans 3720
Sale of Capital Assets 3730
Loss Recoveries 3740 Transfers In:
From General Fund 3610
From Debt Service Funds 3620
From Capital Projects Funds 3630
Interfund 3650
From Permanent Funds 3660
From Internal Service Funds 3670
From Enterprise Funds 3690
Total Transfers In 3600 0.00 Transfers Out: (Function 9700)
To the General Fund 910
To Debt Service Funds 920
To Capital Projects Funds 930
Interfund 950
To Permanent Funds 960
To Internal Service Funds 970
To Enterprise Funds 990
Total Transfers Out 9700 0.00
Total Other Financing Sources (Uses) 0.00
Net Change in Fund Balance 0.00
Fund Balance, July 1, 2015 2800
Adjustments to Fund Balance 2891 Ending Fund Balance:
Nonspendable Fund Balance 2710
Restricted Fund Balance 2720
Committed Fund Balance 2730
Assigned Fund Balance 2740
Unassigned Fund Balance 2750
Total Fund Balances, June 30, 2016 2700 0.00
ESE 348

Exhibit K-3
FDOE Page 7 Fund 420
400 500 600 700 Totals Energy
Services Materials
and Supplies Capital Outlay Other
233,283.00 406,631.00 51,518.00 3,427,412.00
62,360.00 10,437.00 2,250.00 2,142,638.00
0.00
21,432.00 51,330.00 2,459.00 2,822,817.00
45,933.00 132,614.00 27,615.00 2,326,297.00
6,360.00 685.00 529,516.00
0.00
435,330.00 435,330.00
0.00
0.00
0.00
0.00
0.00
14,589.00 112.00 36,492.00
0.00
0.00
0.00
0.00
870.00 870.00
112,235.00 112,235.00
14,589.00 369,368.00 714,802.00 519,284.00 11,833,607.00
0.00

(THIS PAGE LEFT INTENTIONALLY BLANK)

DISTRICT SCHOOL BOARD OF HERNANDO COUNTY COMBINING STATEMENT OF REVENUES, EXPENDITURES AND CHANGES IN FUND BALANCE - SPECIAL REVENUE FUNDS FEDERAL ECONOMIC STIMULUS PROGRAMS For the Fiscal Year Ended June 30, 2016
Exhibit K-4 FDOE Page 8
Funds 430
REVENUES Account Number
Targeted ARRA Stimulus Funds
432
Other ARRA Stimulus Grants
433
ARRA Race to the Top
434 Totals
Federal Direct:
Workforce Innovation and Opportunity Act (WIOA) 3170 0.00
Community Action Programs 3180 0.00
Reserve Officers Training Corps (ROTC) 3191 0.00
Miscellaneous Federal Direct 3199 0.00
Total Federal Direct: 3100 0.00 0.00 0.00 0.00 Federal Through State and Local:
Career and Technical Education 3201 0.00
Race to the Top 3214 0.00
Individuals with Disabilities Education Act (IDEA) 3230 0.00
Elementary and Secondary Education Act - Title I 3240 0.00
Other Food Services 3269 0.00
Federal Through Local 3280 0.00
Miscellaneous Federal Through State 3299 0.00
Total Federal Through State and Local 3200 0.00 0.00 0.00 0.00 State:
State Through Local 3380 0.00
Other Miscellaneous State Revenues 3399 0.00
Total State 3300 0.00 0.00 0.00 0.00 Local:
Interest on Investments 3431 0.00
Gain on Sale of Investments 3432 0.00
Net Increase (Decrease) in Fair Value of Investments 3433 0.00
Gifts, Grants and Bequests 3440 0.00
Other Miscellaneous Local Sources 3495 0.00
Refunds of Prior Year's Expenditures 3497 0.00
Total Local 3400 0.00 0.00 0.00 0.00
Total Revenues 3000 0.00 0.00 0.00 0.00
ESE 348

DISTRICT SCHOOL BOARD OF HERNANDO COUNTY COMBINING STATEMENT OF REVENUES, EXPENDITURES AND CHANGES IN FUND BALANCE - SPECIAL REVENUE FUNDS - TARGETED ARRA STIMULUS FUNDS (Continued) For the Fiscal Year Ended June 30, 2016
Exhibit K-4
FDOE Page 9 Fund 432
EXPENDITURES Account Number
100 200 300
Salaries Employee Benefits
Purchased Services
Current:
Instruction 5000
Student Support Services 6100
Instructional Media Services 6200
Instruction and Curriculum Development Services 6300
Instructional Staff Training Services 6400
Instruction-Related Technology 6500
Board 7100
General Administration 7200
School Administration 7300
Facilities Acquisition and Construction 7410
Fiscal Services 7500
Food Services 7600
Central Services 7700
Student Transportation Services 7800
Operation of Plant 7900
Maintenance of Plant 8100
Administrative Technology Services 8200
Community Services 9100 Capital Outlay:
Facilities Acquisition and Construction 7420
Other Capital Outlay 9300
Total Expenditures 0.00 0.00 0.00
Excess (Deficiency) of Revenues over Expenditures OTHER FINANCING SOURCES (USES)
and CHANGES IN FUND BALANCES Account Number
Loans 3720
Sale of Capital Assets 3730
Loss Recoveries 3740 Transfers In:
From General Fund 3610
From Debt Service Funds 3620
From Capital Projects Funds 3630
Interfund 3650
From Permanent Funds 3660
From Internal Service Funds 3670
From Enterprise Funds 3690
Total Transfers In 3600 0.00 Transfers Out: (Function 9700)
To the General Fund 910
To Debt Service Funds 920
To Capital Projects Funds 930
Interfund 950
To Permanent Funds 960
To Internal Service Funds 970
To Enterprise Funds 990
Total Transfers Out 9700 0.00
Total Other Financing Sources (Uses) 0.00
Net Change in Fund Balance 0.00
Fund Balance, July 1, 2015 2800
Adjustments to Fund Balance 2891 Ending Fund Balance:
Nonspendable Fund Balance 2710
Restricted Fund Balance 2720
Committed Fund Balance 2730
Assigned Fund Balance 2740
Unassigned Fund Balance 2750
Total Fund Balances, June 30, 2016 2700 0.00
ESE 348

Exhibit K-4
FDOE Page 9 Fund 432
400 500 600 700 Totals Energy
Services Materials
and Supplies Capital Outlay Other
0.00
0.00
0.00
0.00
0.00
0.00
0.00
0.00
0.00
0.00
0.00
0.00
0.00
0.00
0.00
0.00
0.00
0.00
0.00
0.00
0.00 0.00 0.00 0.00 0.00
0.00

DISTRICT SCHOOL BOARD OF HERNANDO COUNTY Exhibit K-4 COMBINING STATEMENT OF REVENUES, EXPENDITURES AND CHANGES IN FUND BALANCE - SPECIAL REVENUE FUNDS - OTHER ARRA STIMULUS GRANTS (Continued) FDOE Page 10 For the Fiscal Year Ended June 30, 2016 Fund 433
EXPENDITURES Account Number
100 200 300
Salaries Employee Benefits
Purchased Services
Current:
Instruction 5000
Student Support Services 6100
Instructional Media Services 6200
Instruction and Curriculum Development Services 6300
Instructional Staff Training Services 6400
Instruction-Related Technology 6500
Board 7100
General Administration 7200
School Administration 7300
Facilities Acquisition and Construction 7410
Fiscal Services 7500
Food Services 7600
Central Services 7700
Student Transportation Services 7800
Operation of Plant 7900
Maintenance of Plant 8100
Administrative Technology Services 8200
Community Services 9100 Capital Outlay:
Facilities Acquisition and Construction 7420
Other Capital Outlay 9300
Total Expenditures 0.00 0.00 0.00
Excess (Deficiency) of Revenues over Expenditures OTHER FINANCING SOURCES (USES)
and CHANGES IN FUND BALANCES Account Number
Loans 3720
Sale of Capital Assets 3730
Loss Recoveries 3740 Transfers In:
From General Fund 3610
From Debt Service Funds 3620
From Capital Projects Funds 3630
Interfund 3650
From Permanent Funds 3660
From Internal Service Funds 3670
From Enterprise Funds 3690
Total Transfers In 3600 0.00 Transfers Out: (Function 9700)
To the General Fund 910
To Debt Service Funds 920
To Capital Projects Funds 930
Interfund 950
To Permanent Funds 960
To Internal Service Funds 970
To Enterprise Funds 990
Total Transfers Out 9700 0.00
Total Other Financing Sources (Uses) 0.00
Net Change in Fund Balance 0.00
Fund Balance, July 1, 2015 2800
Adjustments to Fund Balance 2891 Ending Fund Balance:
Nonspendable Fund Balance 2710
Restricted Fund Balance 2720
Committed Fund Balance 2730
Assigned Fund Balance 2740
Unassigned Fund Balance 2750
Total Fund Balances, June 30, 2016 2700 0.00
ESE 348

Exhibit K-4
FDOE Page 10 Fund 433
400 500 600 700 Totals Energy
Services Materials
and Supplies Capital Outlay Other
0.00
0.00
0.00
0.00
0.00
0.00
0.00
0.00
0.00
0.00
0.00
0.00
0.00
0.00
0.00
0.00
0.00
0.00
0.00
0.00
0.00 0.00 0.00 0.00 0.00
0.00

DISTRICT SCHOOL BOARD OF HERNANDO COUNTY Exhibit K-4 COMBINING STATEMENT OF REVENUES, EXPENDITURES AND CHANGES IN FUND BALANCE - SPECIAL REVENUE FUNDS - ARRA RACE TO THE TOP (Continued) FDOE Page 11 For the Fiscal Year Ended June 30, 2016 Fund 434
EXPENDITURES Account Number
100 200 300
Salaries Employee Benefits
Purchased Services
Current:
Instruction 5000
Student Support Services 6100
Instructional Media Services 6200
Instruction and Curriculum Development Services 6300
Instructional Staff Training Services 6400
Instruction-Related Technology 6500
Board 7100
General Administration 7200
School Administration 7300
Facilities Acquisition and Construction 7410
Fiscal Services 7500
Food Services 7600
Central Services 7700
Student Transportation Services 7800
Operation of Plant 7900
Maintenance of Plant 8100
Administrative Technology Services 8200
Community Services 9100 Capital Outlay:
Facilities Acquisition and Construction 7420
Other Capital Outlay 9300
Total Expenditures 0.00 0.00 0.00
Excess (Deficiency) of Revenues over Expenditures OTHER FINANCING SOURCES (USES)
and CHANGES IN FUND BALANCES Account Number
Loans 3720
Sale of Capital Assets 3730
Loss Recoveries 3740 Transfers In:
From General Fund 3610
From Debt Service Funds 3620
From Capital Projects Funds 3630
Interfund 3650
From Permanent Funds 3660
From Internal Service Funds 3670
From Enterprise Funds 3690
Total Transfers In 3600 0.00 Transfers Out: (Function 9700)
To the General Fund 910
To Debt Service Funds 920
To Capital Projects Funds 930
Interfund 950
To Permanent Funds 960
To Internal Service Funds 970
To Enterprise Funds 990
Total Transfers Out 9700 0.00
Total Other Financing Sources (Uses) 0.00
Net Change in Fund Balance 0.00
Fund Balance, July 1, 2015 2800
Adjustments to Fund Balance 2891 Ending Fund Balance:
Nonspendable Fund Balance 2710
Restricted Fund Balance 2720
Committed Fund Balance 2730
Assigned Fund Balance 2740
Unassigned Fund Balance 2750
Total Fund Balances, June 30, 2016 2700 0.00
ESE 348

Exhibit K-4
FDOE Page 11 Fund 434
400 500 600 700 Totals Energy
Services Materials
and Supplies Capital Outlay Other
0.00
0.00
0.00
0.00
0.00
0.00
0.00
0.00
0.00
0.00
0.00
0.00
0.00
0.00
0.00
0.00
0.00
0.00
0.00
0.00
0.00 0.00 0.00 0.00 0.00
0.00

DISTRICT SCHOOL BOARD OF HERNANDO COUNTY Exhibit K-5 STATEMENT OF REVENUES, EXPENDITURES AND CHANGES IN FUND BALANCE - SPECIAL REVENUE FUNDS - MISCELLANEOUS FDOE Page 12 For the Fiscal Year Ended June 30, 2016 Fund 490
REVENUES Account Number
Federal Through State and Local:
Federal Through Local 3280
Total Federal Through State and Local 3200 0.00 Local:
Interest on Investments 3431
Gain on Sale of Investments 3432
Net Increase (Decrease) in Fair Value of Investments 3433
Gifts, Grants and Bequests 3440
Other Miscellaneous Local Sources 3495
Total Local 3400 0.00
Total Revenues 3000 0.00
EXPENDITURES Account Number Totals
Current:
Instruction 5000 0.00
Student Support Services 6100 0.00
Instructional Media Services 6200 0.00
Instruction and Curriculum Development Services 6300 0.00
Instructional Staff Training Services 6400 0.00
Instruction-Related Technology 6500 0.00
Board 7100 0.00
General Administration 7200 0.00
School Administration 7300 0.00
Facilities Acquisition and Construction 7410 0.00
Fiscal Services 7500 0.00
Central Services 7700 0.00
Student Transportation Services 7800 0.00
Operation of Plant 7900 0.00
Maintenance of Plant 8100 0.00
Administrative Technology Services 8200 0.00
Community Services 9100 0.00 Capital Outlay:
Facilities Acquisition and Construction 7420 0.00
Other Capital Outlay 9300 0.00
Total Expenditures 0.00
Excess (Deficiency) of Revenues over Expenditures 0.00 OTHER FINANCING SOURCES (USES)
and CHANGES IN FUND BALANCES Account Number
Loss Recoveries 3740 Transfers In:
From General Fund 3610
From Debt Service Funds 3620
From Capital Projects Funds 3630
Interfund 3650
From Permanent Funds 3660
From Internal Service Funds 3670
From Enterprise Funds 3690
Total Transfers In 3600 0.00 Transfers Out: (Function 9700)
To General Fund 910
To Debt Service Funds 920
To Capital Projects Funds 930
Interfund 950
To Permanent Funds 960
To Internal Service Funds 970
To Enterprise Funds 990
Total Transfers Out 9700 0.00
Total Other Financing Sources (Uses) 0.00
Net Change in Fund Balance 0.00
Fund Balance, July 1, 2015 2800
Adjustments to Fund Balance 2891 Ending Fund Balance:
Nonspendable Fund Balance 2710
Restricted Fund Balance 2720
Committed Fund Balance 2730
Assigned Fund Balance 2740
Unassigned Fund Balance 2750
Total Fund Balances, June 30, 2016 2700 0.00
ESE 348

(THIS PAGE LEFT INTENTIONALLY BLANK)

DISTRICT SCHOOL BOARD OF HERNANDO COUNTY COMBINING STATEMENT OF REVENUES, EXPENDITURES AND CHANGES IN FUND BALANCES - DEBT SERVICE FUNDS For the Fiscal Year Ended June 30, 2016
Exhibit K-6
FDOE Page 13 Funds 200
REVENUES Account Number
SBE/COBI Bonds
210
Special Act Bonds
220
Sections 1011.14 & 1011.15, F.S., Loans
230 Federal:
Miscellaneous Federal Direct 3199
Miscellaneous Federal Through State 3299
State: CO&DS Withheld for SBE/COBI Bonds 3322 672,080.00 SBE/COBI Bond Interest 3326 128.00 Sales Tax Distribution (s. 212.20(6)(d)6.a., F.S.) 3341 209,750.00 Other Miscellaneous State Revenues 3399 Total State Sources 3300 672,208.00 209,750.00 0.00
Local:
Interest on Investments 3431 349.00 Net Increase (Decrease) in Fair Value of Investments 3433 Total Local Sources 3400 0.00 349.00 0.00
Total Revenues 3000 672,208.00 210,099.00 0.00 EXPENDITURES
Debt Service (Function 9200) Redemption of Principal 710 527,000.00 90,000.00 Interest 720 163,329.00 114,825.00 Dues and Fees 730 209.00 575.00 Miscellaneous 790
Total Expenditures 690,538.00 205,400.00 0.00 Excess (Deficiency) of Revenues Over Expenditures (18,330.00) 4,699.00 0.00
OTHER FINANCING SOURCES (USES) and CHANGES IN FUND BALANCE
Account Number
SBE/COBI Bonds
210
Special Act Bonds
220
Sections 1011.14 & 1011.15, F.S., Loans
230 Face Value of Refunding Bonds Face Value of Refunding Bonds 37153715 Transfers In:
From General Fund 3610 From Capital Projects Funds 3630 Interfund 3650 Total Transfers In 3600 0.00 0.00 0.00
Transfers Out: (Function 9700)
Interfund 950 Total Transfers Out 9700 0.00 0.00 0.00
Total Other Financing Sources (Uses) 0.00 0.00 0.00 Net Change in Fund Balances (18,330.00) 4,699.00 0.00
Fund Balance, July 1, 2015 2800 84,949.00 299,932.00
Adjustments to Fund Balances 2891
Ending Fund Balance:
Nonspendable Fund Balance 2710
Restricted Fund Balance 2720 66,619.00 304,631.00
Total Fund Balances, June 30, 2016 2700 66,619.00 304,631.00 0.00
ESE 348

Exhibit K-6
FDOE Page 13 Funds 200
Motor Vehicle Revenue Bonds
240
District Bonds
250
Other Debt Service
290
ARRA Economic Stimulus Debt Service
299 Totals
0.00
0.00
672,080.00
128.00
209,750.00
0.00
0.00 0.00 0.00 0.00 881,958.00
2,072.00 2,421.00
(2,113.00) (2,113.00)
0.00 0.00 (41.00) 0.00 308.00
0.00 0.00 (41.00) 0.00 882,266.00
3,974,318.00 4,591,318.00
3,263,742.00 3,541,896.00
785,696.00 786,480.00
101,664,652.00 101,664,652.00
0.00 0.00 109,688,408.00 0.00 110,584,346.00
0.00 0.00 (109,688,449.00) 0.00 (109,702,080.00) Motor Vehicle Revenue Bonds
240
District Bonds
250
Other Debt Service
290
ARRA Economic Stimulus Debt Service
299 Totals
102 198 598 00 102,198,598.00 102 198 598 00 102,198,598.00
1,347,189.00 1,347,189.00
17,833,563.00 17,833,563.00
364,141.00 364,141.00
0.00 0.00 19,544,893.00 0.00 19,544,893.00
(364,141.00) (364,141.00)
0.00 0.00 (364,141.00) 0.00 (364,141.00)
0.00 0.00 121,379,350.00 0.00 121,379,350.00
0.00 0.00 11,690,901.00 0.00 11,677,270.00
2,213,152.00 2,598,033.00
0.00
0.00
13,904,053.00 14,275,303.00
0.00 0.00 13,904,053.00 0.00 14,275,303.00

DISTRICT SCHOOL BOARD OF HERNANDO COUNTY Exhibit K-7
COMBINING STATEMENT OF REVENUES, EXPENDITURES AND CHANGES IN FUND BALANCES - CAPITAL PROJECTS FUNDS FDOE Page 14
For the Fiscal Year Ended June 30, 2016 Funds 300
REVENUES Account Number
Capital Outlay Bond Issues (COBI)
310
Special Act Bonds
320
Public Education Capital Outlay (PECO)
340
Federal:
Miscellaneous Federal Direct 3199
Miscellaneous Federal Through State 3299
State:
CO&DS Distributed 3321
Interest on Undistributed CO&DS 3325
Public Education Capital Outlay (PECO) 3391 678,746.00
Charter School Capital Outlay Funding 3397 19,687.00
Other Miscellaneous State Revenues 3399
Total State Sources 3300 0.00 0.00 698,433.00
Local:
District Local Capital Improvement Tax 3413
School District Local Sales Tax 3419
Tax Redemptions 3421
Interest on Investments 3431
Net Increase (Decrease) in Fair Value of Investments 3433
Impact Fees 3496
Total Local Sources 3400 0.00 0.00 0.00
Total Revenues 3000 0.00 0.00 698,433.00 EXPENDITURES
Capital Outlay: (Function 7400)
Buildings and Fixed Equipment 630
Furniture, Fixtures and Equipment 640
Improvements Other Than Buildings 670 440.00
Remodeling and Renovations 680 692,090.00
Computer Software 690
Debt Service: (Function 9200)
Dues and Fees 730
Total Expenditures 0.00 0.00 692,530.00
Excess (Deficiency) of Revenues Over Expenditures 0.00 0.00 5,903.00
ESE 348

Exhibit K-7
FDOE Page 14
Funds 300
Capital Outlay and Debt Service Program (CO&DS)
360
Nonvoted Cap. Improvement Section 1011.71(2), F.S.
370
Other Capital Projects
390
Totals
0.00
0.00
183,049.00 183,049.00
2,621.00 2,621.00
678,746.00
19,687.00
61,819.00 61,819.00
185,670.00 0.00 61,819.00 945,922.00
12,193,142.00 12,193,142.00
3,845,976.00 3,845,976.00
35,860.00 35,860.00
38,965.00 310,649.00 349,614.00
(24.00) (124,947.00) (124,971.00)
160,673.00 160,673.00
0.00 12,267,943.00 4,192,351.00 16,460,294.00
185,670.00 12,267,943.00 4,254,170.00 17,406,216.00
19,565.00 17,200.00 36,765.00
525,650.00 525,650.00
141,787.00 87,328.00 229,555.00
5,384,965.00 650,243.00 6,727,298.00
148,244.00 148,244.00
632.00 632.00
632.00 6,220,211.00 754,771.00 7,668,144.00
185,038.00 6,047,732.00 3,499,399.00 9,738,072.00

DISTRICT SCHOOL BOARD OF HERNANDO COUNTY COMBINING STATEMENT OF REVENUES, EXPENDITURES AND CHANGES IN FUND BALANCES - CAPITAL PROJECTS FUNDS (Continued) For the Fiscal Year Ended June 30, 2016
Exhibit K-7
FDOE Page 15 Funds 300
OTHER FINANCING SOURCES (USES) and CHANGES IN FUND BALANCE
Account Number
Capital Outlay Bond Issues (COBI)
310
Special Act Bonds
320
Public Education Capital Outlay (PECO)
340 Transfers In:
From General Fund 3610
Total Transfers In 3600 0.00 0.00 0.00 Transfers Out: (Function 9700)
To General Fund 910
To Debt Service Funds 920
Total Transfers Out 9700 0.00 0.00 0.00
Total Other Financing Sources (Uses) 0.00 0.00 0.00
Net Change in Fund Balances 0.00 0.00 5,903.00
Fund Balance, July 1, 2015 2800 1,245.00 40,017.00
Adjustments to Fund Balances 2891 Ending Fund Balance:
Nonspendable Fund Balance 2710
Restricted Fund Balance 2720 1,245.00 45,920.00
Committed Fund Balance 2730
Assigned Fund Balance 2740 0.00 0.00
Unassigned Fund Balance 2750
Total Fund Balances, June 30, 2016 2700 1,245.00 0.00 45,920.00
ESE 348

Exhibit K-7
FDOE Page 15 Funds 300
Capital Outlay and Debt Service Program (CO&DS)
360
Nonvoted Cap. Improvement Section 1011.71(2), F.S.
370
Other Capital Projects
390
Totals
252,340.00 252,340.00
0.00 252,340.00 0.00 252,340.00
(5,068,054.00) (5,068,054.00)
(17,833,563.00) (17,833,563.00)
0.00 (5,068,054.00) (17,833,563.00) (22,901,617.00)
0.00 (4,815,714.00) (17,833,563.00) (22,649,277.00)
185,038.00 1,232,018.00 (14,334,164.00) (12,911,205.00)
235,496.00 10,843,262.00 18,799,425.00 29,919,445.00
(40,246.00) (40,246.00)
0.00
420,534.00 12,075,280.00 4,505,507.00 17,048,486.00
0.00
0.00 0.00 0.00 0.00
0.00
420,534.00 12,075,280.00 4,505,507.00 17,048,486.00

DISTRICT SCHOOL BOARD OF HERNANDO COUNTY Exhibit K-8 STATEMENT OF REVENUES, EXPENDITURES AND CHANGES IN FUND BALANCE - PERMANENT FUNDS FDOE Page 16 For the Fiscal Year Ended June 30, 2016 Fund 000
REVENUES Account Number
Federal Direct 3100
Federal Through State and Local 3200
State Sources 3300
Local Sources 3400
Total Revenues 3000 0.00
EXPENDITURES Account Number
Current:
Instruction 5000
Student Support Services 6100
Instructional Media Services 6200
Instruction and Curriculum Development Services 6300
Instructional Staff Training Services 6400
Instruction-Related Technology 6500
Board 7100
General Administration 7200
School Administration 7300
Facilities Acquisition and Construction 7410
Fiscal Services 7500
Central Services 7700
Student Transportation Services 7800
Operation of Plant 7900
Maintenance of Plant 8100
Administrative Technology Services 8200
Community Services 9100 Capital Outlay:
Facilities Acquisition and Construction 7420
Other Capital Outlay 9300 Debt Service: (Function 9200)
Redemption of Principal 710
Interest 720
Total Expenditures 0.00
Excess (Deficiency) of Revenues Over Expenditures OTHER FINANCING SOURCES (USES)
and CHANGES IN FUND BALANCES Account Number
Sale of Capital Assets 3730
Loss Recoveries 3740 Transfers In:
From General Fund 3610
From Debt Service Funds 3620
From Capital Projects Funds 3630
From Special Revenue Funds 3640
From Internal Service Funds 3670
From Enterprise Funds 3690
Total Transfers In 3600 0.00 Transfers Out: (Function 9700)
To General Fund 910
To Debt Service Funds 920
To Capital Projects Funds 930
To Special Revenue Funds 940
To Internal Service Funds 970
To Enterprise Funds 990
Total Transfers Out 9700 0.00
Total Other Financing Sources (Uses) 0.00
Net Change in Fund Balance 0.00
Fund Balance, July 1, 2015 2800
Adjustments to Fund Balance 2891 Ending Fund Balance:
Nonspendable Fund Balance 2710
Restricted Fund Balance 2720
Committed Fund Balance 2730
Assigned Fund Balance 2740
Unassigned Fund Balance 2750
Total Fund Balances, June 30, 2016 2700 0.00
ESE 348

(THIS PAGE LEFT INTENTIONALLY BLANK)

DISTRICT SCHOOL BOARD OF HERNANDO COUNTY Exhibit K-9 COMBINING STATEMENT OF REVENUES, EXPENSES AND CHANGES IN FUND NET POSITION - ENTERPRISE FUNDS FDOE Page 17 For the Fiscal Year Ended June 30, 2016 Funds 900
INCOME OR (LOSS) Account Number
Self-Insurance - Consortium
911
Self-Insurance - Consortium
912
Self-Insurance - Consortium
913 OPERATING REVENUES
Charges for Services 3481 Charges for Sales 3482 Premium Revenue 3484 Other Operating Revenues 3489 Total Operating Revenues 0.00 0.00 0.00
OPERATING EXPENSES (Function 9900) Salaries 100 Employee Benefits 200 Purchased Services 300 Energy Services 400 Materials and Supplies 500 Capital Outlay 600 Other 700 Depreciation and Amortization Expense 780 Total Operating Expenses 0.00 0.00 0.00 Operating Income (Loss) 0.00 0.00 0.00
NONOPERATING REVENUES (EXPENSES) Interest on Investments 3431 Gain on Sale of Investments 3432 Net Increase (Decrease) in Fair Value of Investments 3433 Gifts, Grants and Bequests 3440 Other Miscellaneous Local Sources 3495 Loss Recoveries 3740 Gain on Disposition of Assets 3780 Interest (Function 9900) 720 Miscellaneous (Function 9900) 790 Loss on Disposition of Assets (Function 9900) 810 Total Nonoperating Revenues (Expenses) 0.00 0.00 0.00
Net Income (Loss) Before Operating Transfers 0.00 0.00 0.00 TRANSFERS and
CHANGES IN NET POSITION Transfers In:
From General Fund 3610 From Debt Service Funds 3620 From Capital Projects Funds 3630 From Special Revenue Funds 3640 Interfund 3650 From Permanent Funds 3660 From Internal Service Funds 3670 Total Transfers In 3600 0.00 0.00 0.00
Transfers Out: (Function 9700) To General Fund 910 To Debt Service Funds 920 To Capital Projects Funds 930 To Special Revenue Funds 940 Interfund 950 To Permanent Funds 960 To Internal Service Funds 970 Total Transfers Out 9700 0.00 0.00 0.00
Change in Net Position 0.00 0.00 0.00 Net Position, July 1, 2015 2880 Adjustments to Net Position 2896
Net Position, June 30, 2016 2780
ESE 348

Exhibit K-9 FDOE Page 17
Funds 900 Self-Insurance - Consortium
914
ARRA - Consortium
915
Other Enterprise Programs
921
Other Enterprise Programs
922 Totals
0.00 0.00 0.00 0.00
0.00 0.00 0.00 0.00 0.00
0.00 0.00 0.00 0.00 0.00 0.00 0.00 0.00
0.00 0.00 0.00 0.00 0.00 0.00 0.00 0.00 0.00 0.00
0.00 0.00 0.00 0.00 0.00 0.00 0.00 0.00 0.00 0.00
0.00 0.00 0.00 0.00 0.00
0.00 0.00 0.00 0.00 0.00
0.00 0.00 0.00 0.00 0.00 0.00 0.00
0.00 0.00 0.00 0.00 0.00
0.00 0.00 0.00 0.00 0.00 0.00 0.00
0.00 0.00 0.00 0.00 0.00 0.00 0.00 0.00 0.00 0.00
0.00 0.00
0.00
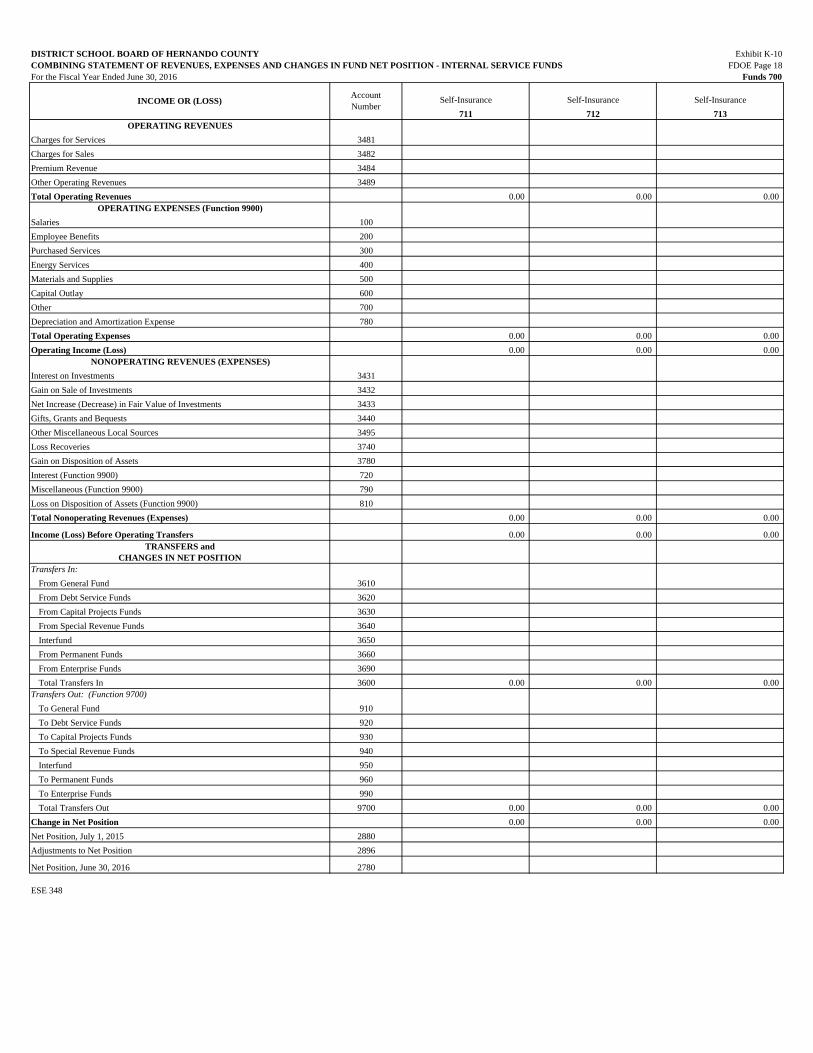
DISTRICT SCHOOL BOARD OF HERNANDO COUNTY Exhibit K-10 COMBINING STATEMENT OF REVENUES, EXPENSES AND CHANGES IN FUND NET POSITION - INTERNAL SERVICE FUNDS FDOE Page 18 For the Fiscal Year Ended June 30, 2016 Funds 700
INCOME OR (LOSS) Account Number
Self-Insurance 711
Self-Insurance 712
Self-Insurance 713
OPERATING REVENUES Charges for Services 3481 Charges for Sales 3482 Premium Revenue 3484 Other Operating Revenues 3489 Total Operating Revenues 0.00 0.00 0.00
OPERATING EXPENSES (Function 9900) Salaries 100 Employee Benefits 200 Purchased Services 300 Energy Services 400 Materials and Supplies 500 Capital Outlay 600 Other 700 Depreciation and Amortization Expense 780 Total Operating Expenses 0.00 0.00 0.00 Operating Income (Loss) 0.00 0.00 0.00
NONOPERATING REVENUES (EXPENSES) Interest on Investments 3431 Gain on Sale of Investments 3432 Net Increase (Decrease) in Fair Value of Investments 3433 Gifts, Grants and Bequests 3440 Other Miscellaneous Local Sources 3495 Loss Recoveries 3740 Gain on Disposition of Assets 3780 Interest (Function 9900) 720 Miscellaneous (Function 9900) 790 Loss on Disposition of Assets (Function 9900) 810 Total Nonoperating Revenues (Expenses) 0.00 0.00 0.00
Income (Loss) Before Operating Transfers 0.00 0.00 0.00 TRANSFERS and
CHANGES IN NET POSITION Transfers In:
From General Fund 3610 From Debt Service Funds 3620 From Capital Projects Funds 3630 From Special Revenue Funds 3640 Interfund 3650 From Permanent Funds 3660 From Enterprise Funds 3690 Total Transfers In 3600 0.00 0.00 0.00
Transfers Out: (Function 9700) To General Fund 910 To Debt Service Funds 920 To Capital Projects Funds 930 To Special Revenue Funds 940 Interfund 950 To Permanent Funds 960 To Enterprise Funds 990 Total Transfers Out 9700 0.00 0.00 0.00
Change in Net Position 0.00 0.00 0.00 Net Position, July 1, 2015 2880 Adjustments to Net Position 2896
Net Position, June 30, 2016 2780
ESE 348

Exhibit K-10 FDOE Page 18
Funds 700
Self-Insurance 714
Self-Insurance 715
Consortium Programs
731
Other Internal Service
791 Totals
0.00 0.00 0.00 0.00
0.00 0.00 0.00 0.00 0.00
0.00 0.00 0.00 0.00 0.00 0.00 0.00 0.00
0.00 0.00 0.00 0.00 0.00 0.00 0.00 0.00 0.00 0.00
0.00 0.00 0.00 0.00 0.00 0.00 0.00 0.00 0.00 0.00
0.00 0.00 0.00 0.00 0.00
0.00 0.00 0.00 0.00 0.00
0.00 0.00 0.00 0.00 0.00 0.00 0.00
0.00 0.00 0.00 0.00 0.00
0.00 0.00 0.00 0.00 0.00 0.00 0.00
0.00 0.00 0.00 0.00 0.00 0.00 0.00 0.00 0.00 0.00
0.00 0.00
0.00

DISTRICT SCHOOL BOARD OF HERNANDO COUNTY
COMBINING STATEMENT OF CHANGES IN ASSETS AND LIABILITIES
SCHOOL INTERNAL FUNDS
June 30, 2016
ASSETS Account
Number
Beginning Balance
July 1, 2015
Cash 1110 1,538,653.00
Investments 1160
Accounts Receivable, Net 1131 8,679.00
Interest Receivable on Investments 1170
Due From Budgetary Funds 1141
Due From Other Agencies 1220
Inventory 1150
Total Assets 1,547,332.00
LIABILITIES
Cash Overdraft 2125
Accrued Salaries and Benefits 2110
Payroll Deductions and Withholdings 2170
Accounts Payable 2120
Internal Accounts Payable 2290 1,547,332.00
Due to Budgetary Funds 2161
Total Liabilities 1,547,332.00
ESE 348

Exhibit K-11
FDOE Page 19
Fund 891
Additions Deductions Ending Balance
June 30, 2016
4,852,995.00 4,710,755.00 1,680,893.00
0.00
4,364.00 13,043.00
0.00
355.00 355.00
0.00
0.00
4,857,714.00 4,710,755.00 1,694,291.00
0.00
0.00
0.00
0.00
4,857,714.00 4,710,755.00 1,694,291.00
0.00
4,857,714.00 4,710,755.00 1,694,291.00

DISTRICT SCHOOL BOARD OF HERNANDO COUNTY Exhibit K-12
SCHEDULE OF LONG-TERM LIABILITIES FDOE Page 20
June 30, 2016 Fund 601
Account
Number
Governmental Activities Total
Balance [1]
June 30, 2016
Business-Type Activities Total
Balance [1]
June 30, 2016
Total
Notes Payable 2310 4,860,255.00 4,860,255.00
Obligations Under Capital Leases 2315 0.00
Bonds Payable
SBE/COBI Bonds Payable 2321 2,920,000.00 2,920,000.00
District Bonds Payable 2322 0.00
Special Act Bonds Payable 2323 2,235,000.00 2,235,000.00
Motor Vehicle License Revenue Bonds Payable 2324 0.00
Sales Surtax Bonds Payable 2326 0.00
Total Bonds Payable 2320 5,155,000.00 0.00 5,155,000.00
Liability for Compensated Absences 2330 13,489,203.00 13,489,203.00
Lease-Purchase Agreements Payable
Certificates of Participation (COPS) Payable 2341 111,464,668.00 111,464,668.00
Qualified Zone Academy Bonds (QZAB) Payable 2342 0.00
Qualified School Construction Bonds (QSCB) Payable 2343 0.00
Build America Bonds (BAB) Payable 2344 0.00
Other Lease-Purchase Agreements Payable 2349 0.00
Total Lease-Purchase Agreements Payable 2340 111,464,668.00 0.00 111,464,668.00
Estimated Liability for Long-Term Claims 2350 0.00
Net Other Postemployment Benefits Obligation 2360 9,883,288.00 9,883,288.00
Net Pension Liability 2365 73,668,890.00 73,668,890.00
Estimated PECO Advance Payable 2370 0.00
Other Long-Term Liabilities 2380 0.00
Derivative Instrument 2390 0.00
Total Long-term Liabilities 218,521,304.00 0.00 218,521,304.00
[1] Report carrying amount of total liability due within one year and due after one year on June 30, 2016, including discounts and premiums.
ESE 348

Exhibit K-12
FDOE Page 20
Fund 601
Governmental Activities - Debt
Principal Payments
2015-16
Governmental Activities -
Principal Due Within One Year
2016-17
Governmental Activities - Debt
Interest Payments
2015-16
Governmental Activities - Interest
Due Within One Year
2016-17
1,237,296.00 109,893.00 109,893.00 85,588.00
527,000.00 563,000.00 163,329.00 10,640.00
90,000.00 95,000.00 114,825.00 110,372.00
617,000.00 658,000.00 278,154.00 121,012.00
101,817,022.00 2,792,152.00 3,153,850.00 4,351,686.00
101,817,022.00 2,792,152.00 3,153,850.00 4,351,686.00
103,671,318.00 3,560,045.00 3,541,897.00 4,558,286.00

DISTRICT SCHOOL BOARD OF HERNANDO COUNTY SCHEDULE OF CATEGORICAL PROGRAMS REPORT OF EXPENDITURES AND AVAILABLE FUNDS Exhibit K-13 For the Fiscal Year Ended June 30, 2016 FDOE Page 21
CATEGORICAL PROGRAMS (Revenue Number) [Footnote]
Grant Number
Unexpended June 30, 2015
Returned To FDOE
Class Size Reduction Operating Funds (3355) 94740
Excellent Teaching Program (3363) 90570
Florida Digital Classrooms (FEFP Earmark) 98250 80,796.00
Florida School Recognition Funds (3361) 92040 82,650.00
Instructional Materials (FEFP Earmark) [3] 90880 8,072.00
Library Media (FEFP Earmark) [3] 90881 6,154.00
Preschool Projects (3372) 97950
Public School Technology 90320
Research-Based Reading Instruction (FEFP Earmark) [4] 90800
Safe Schools (FEFP Earmark) [5] 90803
Salary Bonus Outstanding Teachers in D and F Schools 94030
Student Transportation (FEFP Earmark) 90830
Supplemental Academic Instruction (FEFP Earmark) [4] 91280
Teacher Training 91290
Teachers Classroom Supply Assistance (FEFP Earmark) 97580
Voluntary Prekindergarten - School Year Program (3371) 96440
Voluntary Prekindergarten - Summer Program (3371) 96441
[1] Include both state and local revenue sources. [2] Report the amount of funds transferred from each program to maintain board-specified academic classroom instruction. [3] Report the Library Media portion of the Instructional Materials allocation on the line "Library Media." [4] Expenditures for designated low-performing elementary schools should be included in expenditures. [5] Combine all programs funded from the Safe Schools allocation on one line, "Safe Schools."
ESE 348

Exhibit K-13 FDOE Page 21
Revenues [1] 2015-16
Expenditures 2015-16
Flexibility [2] 2015-16
Unexpended June 30, 2016
0.00
0.00
585,681.00 661,781.00 4,696.00
1,251,270.00 1,216,565.00 117,355.00
1,882,365.00 1,398,950.00 489,904.00 1,583.00
94,541.00 81,027.00 19,668.00
0.00
0.00
1,041,450.00 824,624.00 216,826.00
0.00
0.00
0.00
0.00
0.00
0.00
0.00
0.00

DISTRICT SCHOOL BOARD OF HERNANDO COUNTY
SCHEDULE OF SELECTED SUBOBJECT EXPENDITURES
For the Fiscal Year Ended June 30, 2016
Subobject
General Fund
100
ENERGY EXPENDITURES:
Natural Gas 411 13,514.00
Bottled Gas 421 7,912.00
Electricity 430 5,295,391.00
Heating Oil 440
Total 5,316,817.00
ENERGY EXPENDITURES FOR STUDENT
TRANSPORTATION:
Compressed Natural Gas 412
Liquefied Petroleum Gas 422
Gasoline 450 3,398.00
Diesel Fuel 460 779,617.00
Oil and Grease 540 22,347.00
Total 805,362.00
Subobject
General Fund
100
EXPENDITURES FOR SCHOOL BUSES
AND SCHOOL BUS REPLACEMENTS:
Buses 651
Subobject
General Fund
100
SUBAWARDS FOR INDIRECT COST RATE:
Professional and Technical Services:
Subawards Under Subagreements - First $25,000 311
Subawards Under Subagreements - In Excess of $25,000 312
Other Purchased Services:
Subawards Under Subagreements - First $25,000 391
Subawards Under Subagreements - In Excess of $25,000 392
Subobject
Special Revenue
Food Services
410
FOOD SERVICE SUPPLIES SUBOBJECT
Supplies 510 337,101.00
Food 570 4,199,586.00
Donated Foods 580
ESE 348

Exhibit K-14
FDOE Page 22
Special Revenue
Food Services
410
Special Revenue Other Federal
Programs
420
Special Revenue Federal
Economic Stimulus Programs
430 Total
2,490.00 16,004.00
14,799.00 22,711.00
310,026.00 5,605,417.00
0.00
327,315.00 0.00 0.00 5,644,132.00
0.00
0.00
3,398.00
14,589.00 794,206.00
22,347.00
14,589.00 0.00 819,951.00
Special Revenue Other Federal
Programs
420
Special Revenue Federal
Economic Stimulus Programs
430
Capital Projects Funds
3XX Total
0.00
Special Revenue
Food Services
410
Special Revenue Other Federal
Programs
420
Special Revenue Federal
Economic Stimulus Programs
430 Total
25,000.00 25,000.00
25,412.00 25,412.00
0.00
0.00

DISTRICT SCHOOL BOARD OF HERNANDO COUNTY
SCHEDULE OF SELECTED SUBOBJECT EXPENDITURES
For the Fiscal Year Ended June 30, 2016
Subobject
General Fund
100
TEACHER SALARIES
Basic Programs 101, 102 and 103 (Function 5100) 120 45,270,940.00
Basic Programs 101, 102 and 103 (Function 5100) 140 881.00
Basic Programs 101, 102 and 103 (Function 5100) 750 0.00
Total Basic Program Salaries 45,271,821.00
Other Programs 130 (ESOL) (Function 5100) 120 1,122,991.00
Other Programs 130 (ESOL) (Function 5100) 140 0.00
Other Programs 130 (ESOL) (Function 5100) 750 0.00
Total Other Program Salaries 1,122,991.00
ESE Programs 111, 112, 113, 254 and 255 (Function 5200) 120 14,900,320.00
ESE Programs 111, 112, 113, 254 and 255 (Function 5200) 140 0.00
ESE Programs 111, 112, 113, 254 and 255 (Function 5200) 750 0.00
Total ESE Program Salaries 14,900,320.00
Career Program 300 (Function 5300) 120 1,374,579.00
Career Program 300 (Function 5300) 140 0.00
Career Program 300 (Function 5300) 750 0.00
Total Career Program Salaries 1,374,579.00
Total 62,669,711.00
TEXTBOOKS (used for classroom instruction) Subobject
General Fund
100
Textbooks (Function 5000) 520 1,235,800.00
ESE 348

Exhibit K-14
FDOE Page 23
Special Revenue Other Federal
Programs
420
Special Revenue Federal
Economic Stimulus Programs
430 Total
0.00 0.00 45,270,940.00
881.00
0.00 0.00
0.00 0.00 45,271,821.00
0.00 0.00 1,122,991.00
0.00
0.00
0.00 0.00 1,122,991.00
349,806.00 0.00 15,250,126.00
0.00 0.00
0.00 0.00
349,806.00 0.00 15,250,126.00
0.00 1,374,579.00
0.00
0.00
0.00 0.00 1,374,579.00
349,806.00 0.00 63,019,517.00
Special Revenue Other Federal
Programs
420
Special Revenue Federal
Economic Stimulus Programs
430 Total
298.00 1,236,098.00

DISTRICT SCHOOL BOARD OF HERNANDO COUNTY
SPECIFIC ACADEMIC CLASSROOM INSTRUCTION AND OTHER DATA COLLECTION
For the Fiscal Year Ended June 30, 2016
CATEGORICAL FLEXIBLE SPENDING -
GENERAL FUND EXPENDITURES
Account
Number
Safe
Schools
Student
Transportation
Instruction:
Basic 5100
Exceptional 5200
Career Education 5300
Adult General 5400
Prekindergarten 5500
Other Instruction 5900
Total Flexible Spending Instructional Expenditures 5000 0.00 0.00
DISTRIBUTIONS TO CHARTER SCHOOLS
(Charter school information is used in federal reporting)
Fund
Number
Direct Payment
(Object 393)
Amount Withheld for
Administration
Expenditures:
General Fund 100 2,180,982.00
Food Service Special Revenue Fund 410
Other Federal Programs Special Revenue Fund 420
Federal Economic Stimulus Special Revenue Funds 430
Capital Projects Funds 3XX 19,687.00
Total Charter School Distributions 2,200,669.00 0.00
LIFELONG LEARNING
(Lifelong Learning expenditures are used in federal reporting) Account Number Amount
Expenditures:
General Fund 5900 6,395.00
Other Federal Programs Special Revenue Fund 5900
Federal Economic Stimulus Special Revenue Funds 5900
Total 5900 6,395.00
MEDICAID EXPENDITURE REPORT
(Medicaid expenditures are used in federal reporting)
Unexpended
June 30, 2015
Earnings
2015-16
Earnings, Expenditures and Carryforward Amounts: 663,611.00
Expenditure Program or Activity:
Exceptional Student Education
School Nurses and Health Care Services
Occupational Therapy, Physical Therapy and Other Therapy Services
ESE Professional and Technical Services
Gifted Student Education
Staff Training and Curriculum Development
Medicaid Administration and Billing Services
Student Services
Consultants
Other
Total Expenditures
General Fund Balance Sheet Information
(This information is used in state reporting)
Fund
Number Amount
Balance Sheet Amount, June 30, 2016:
Total Assets and Deferred Outflows of Resources 100 11,230,838.00
Total Liabilities and Deferred Inflows of Resources 100 11,230,838.00
ESE 348

Exhibit K-14
FDOE Page 24
Supplemental
Academic
Instruction
Research-Based Reading
Instruction
Instructional
Materials
Instructional
Materials /
Library Media
Totals
489,904.00 489,904.00
0.00
0.00
0.00
0.00
0.00
0.00 0.00 489,904.00 0.00 489,904.00
Payments and Services on Behalf
of Charter Schools Total Amount
2,180,982.00
0.00
0.00
0.00
19,687.00
0.00 2,200,669.00
Expenditures Unexpended
2015-16 June 30, 2016
663,611.00
663,611.00
663,611.00

DISTRICT SCHOOL BOARD OF HERNANDO COUNTY Exhibit K-15 VOLUNTARY PREKINDERGARTEN (VPK) PROGRAM FDOE Page 25 For the Fiscal Year Ended June 30, 2016 Supplemental Schedule - Fund 100
VOLUNTARY PREKINDERGARTEN PROGRAM [1] GENERAL FUND EXPENDITURES Account Number
100 200 300
Salaries Employee Benefits
Purchased Services
Current:
Prekindergarten 5500
Student Support Services 6100
Instructional Media Services 6200
Instruction and Curriculum Development Services 6300
Instructional Staff Training Services 6400
Instruction-Related Technology 6500
Board 7100
General Administration 7200
School Administration 7300
Facilities Acquisition and Construction 7410
Fiscal Services 7500
Food Services 7600
Central Services 7700
Student Transportation Services 7800
Operation of Plant 7900
Maintenance of Plant 8100
Administrative Technology Services 8200
Community Services 9100 Capital Outlay:
Facilities Acquisition and Construction 7420
Other Capital Outlay 9300 Debt Service: (Function 9200)
Redemption of Principal 710
Interest 720
Total Expenditures 0.00 0.00 0.00
[1] Include expenditures for the summer program (section 1002.61, F.S.) and the school-year program (section 1002.63, F.S.).
ESE 348

Exhibit K-15 FDOE Page 25
Supplemental Schedule - Fund 100 400 500 600 700
Energy Services
Materials and Supplies
Capital Outlay Other Totals
0.00
0.00
0.00
0.00
0.00
0.00
0.00
0.00
0.00
0.00
0.00
0.00
0.00
0.00
0.00
0.00
0.00
0.00
0.00
0.00
0.00
0.00
0.00 0.00 0.00 0.00 0.00

DISTRICT SCHOOL BOARD OF HERNANDO COUNTY SCHEDULE 3 Form PC-3 SCHOOL PROGRAM COST REPORT Exhibit K-16 For the Fiscal Year Ended June 30, 2015 DOE Page 26
(THIS PAGE INTENTIONALLY LEFT BLANK)
District Cost Report information is available in the District Finance Department
ESE 348

DISTRICT SCHOOL BOARD OF HERNANDO COUNTY SCHEDULE 4 Form PC-4 DISTRICT AGGREGATE PROGRAM COST REPORT Exhibit K-17 For the Fiscal Year Ended June 30, 2015 DOE Page 27
(THIS PAGE INTENTIONALLY LEFT BLANK)
District Cost Report information is available in the District Finance Department
ESE 348

DISTRICT SCHOOL BOARD OF HERNANDO COUNTY Exhibit K-18
SCHEDULE 5 DOE Page 28
SUPPLEMENTARY SCHEDULE OF FEDERAL FINANCIAL
ASSISTANCE PROGRAM EXPENDITURES
For the Fiscal Year Ended June 30, 2016
Pass-Through Amount
CFDA Grantor Amount of Provided to
Federal Grantor/Pass-Through Grantor/Program Title Number Number Expenditures (1) Subrecipients
United States Department of Agriculture:
Indirect:
Child Nutrition Cluster:
Florida Department of Agriculture and Consumer Services:
School Breakfast Program 10.553 14002 $ 1,769,445
National School Lunch Program 10.555 14001, 14003 7,148,211
Summer Food Service Program for Children 10.559 14006, 14007 413,307
Fresh Fruit and Vegetable Program 10.582 14006 1,000
Total Child Nutrition Cluster 9,331,964
Florida Department of Health:
Child and Adult Care Food Program 10.558 A-4575 374,303
Total United States Department of Agriculture 9,706,267
United States Department of Education:
Indirect:
Special Education Cluster:
Florida Department of Education:
Special Education - Grants to States 84.027 262,263 4,774,691
Special Education - Preschool Grants 84.173 267 84,417
Total Special Education Cluster 4,859,108
Florida Department of Education:
Adult Education - Basic Grants to States 84.002 191,193 239,481
Title I Grants to Local Educational Agencies 84.010 212,226 5,641,395
Career and Technical Education - Basic Grants to States 84.048 161 251,953
Education for Homeless 84.196 127 42,685
English Language Acquisition Grants 84.365 102 60,939
Improving Teacher Quality State Grants 84.367 224 738,046
Total Indirect 11,833,607 -
Total United States Department of Education 11,833,607 -
United States Department of Defense:
Direct:
Air Force Junior Reserve Officers Training Corps None N/A 112,864
Navy Junior Reserve Officers Training Corps None N/A 100,111
Total United States Department of Defense 212,975
Total Expenditures of Federal Awards $ 21,752,849 $ -
Notes: (1) Basis of Presentation - The Schedule of Expenditures of Federal Awards represents amounts expended from Federal
Programs during the 2015-2016 fiscal year as determined based on the modified accrual basis of accounting. The amounts
reported on the Schedule have been reconciled to and are in material agreement with amounts recorded in the District's
accounting records from which the basic financial statements have been reported.
(2) Noncash Assistance - Food Donation - Represents the amount of donated food received during the 2015-2016 fiscal year totaling
$0 and for cash-in-lieu of foods totaling $780,408. Donated food is valued at fair value as determined at the time of donation by the
Florida Department of Agriculture and Consumer Services, Bureau of Food Distribution.

BOARD MISSION
The Hernando County School District collaborates with parents and other community stakeholders to effectively prepare all students for a successful transition into a diverse and changing world.