
Session VII: Simulating the Distributional Impacts of the 1999 devaluation of the Brazilian Real.

FINANCE AND INEQUALITY: THE DISTRIBUTIONAL IMPACTS OFBANK CREDIT RATIONING.
M. ALI CHOUDHARY∗ AND ANIL JAIN†
Abstract. We analyze reductions in bank credit using a natural experiment whereunprecedented flooding differentially affected banks that were more exposed to floodedregions in Pakistan. Using a unique dataset that covers the universe of consumer loansin Pakistan and this exogenous shock to bank funding, we find two key results. First,banks disproportionately reduce credit to new and less-educated borrowers, followingan increase in their funding costs. Second, the credit reduction is not compensated byrelatively more lending by less-affected banks. The empirical evidence suggests thatadverse selection is the primary cause for banks disproportionately reducing credit tonew borrowers.
Keywords: Credit markets, capital, liquidity, financial stability, inequality, adverseselection, relationships
JEL Codes: G21, G28, 016
Date: May 2017.∗State Bank of Pakistan. Email: [email protected] and Board of Governors of the Fed-eral Reserve System†. Email: [email protected]. This paper benefited significantlyfrom the in-depth discussion with Abhijit Banerjee, Bastian von Beschwitz, Mark Carey,Stijn Claessens, Nicholas Coleman, Benjamin Golub, Raj Iyer, Logan Lewis, Conrad Miller,Rodney Ramachandran, Riaz Riazuddin, and Ashish Shenoy. We would like to thank seminarand conference participants at the Annual Economic Association meeting, Darden School ofBusiness, European Financial Association meeting, Federal Reserve Bank of San Francisco,and Financial Management Association Annual Meeting. The findings and conclusions inthis paper are solely the responsibility of the authors and should not be interpretedas reflecting the views of the Board of Governors of the Federal Reserve System, theviews of any other person associated with the Federal Reserve System, or the State Bankof Pakistan.
1

THE DISTRIBUTIONAL IMPACTS OF BANK CREDIT RATIONING. 2
1. Introduction
There is substantial evidence that credit access can improve consumer welfare. For in-stance, greater access to credit can increase income (Karlan and Zinman [2009b]), reduceinequality (Solis [2017]), increase insurance (Udry [1994]), smooth consumption (Grossand Souleles [2002]), and increase entrepreneurship (Banerjee et al. [2015]). Banks areconsumers’ largest source of credit, and, as such, a small reduction in bank credit canmaterially reduce consumer’s welfare.
Given the important role of banks in intermediating and disbersing credit, there is sur-prising little evidence for whom banks reduce credit to following a credit shock. In thispaper, we fill this gap in the banking and household finance literature by answering thefollowing question: Who are banks’ marginal borrowers?
Moreover, banks may reduce credit disproportionately to certain consumers for manyreasons. For instance, banks may favor pre-existing customers, or favor loans in sectorsfor which they have a large market share or are product specialists. Understanding whybanks reduce credit to certain borrowers may have important implications for consumerwelfare, and in turn, for designing policy. Therefore, we also answer the following question:Why are certain borrowers banks’ marginal borrowers?
There are two key empirical challenges to answering these questions. First, variation inbank lending is unlikely to be exogenous. For example, recessions will simultaneouslycause banks to reduce credit supply and cause households and firms to change creditdemand. Second, there are significant data constraints. To determine the marginal bor-rowers, we need to combine comprehensive loan data with detailed demographic data. Toovercome these challenges, we exploit both a natural experiment that exogenously raisedbanks’ funding costs to different extents and detailed loan data that include borrowercharacteristics.1
We have three main results. First, the banks more affected by the funding cost shockdisproportionately reduced credit to borrowers with little education and little credit historyrelative to less-affected banks. Second, the evidence suggests that adverse selection isdriving the large relative decreases in lending to these borrowers. Finally, the less-affectedbanks did not increase lending to compensate for the reduction in credit by the more-affected banks. Therefore, the general equilibrium effects did not mitigate the reductionin credit by the more-affected banks.
The natural experiment comes from Pakistan’s 2010 catastrophic floods, which causedexogenous increases in funding costs that differed across banks. The floods affected more1For simplicity of terminology, we refer to any credit disbursing financial institution as a “bank”. Henceour “bank” definition includes banks, leasing companies, credit card companies, and non-bank financialinstitutions.

THE DISTRIBUTIONAL IMPACTS OF BANK CREDIT RATIONING. 3
than 20 million people, destroyed 1.6 million homes and “were the largest in modern historyof Pakistan by several orders of magnitude” (Food and Agriculture Organization [2011],Dartmouth Flood Observatory (DFO) [2015], Fair et al. [2013]). To create a measureof the increase in a bank’s funding cost, we exploit variation in banks’ exposures to theflooded area, which caused banks’ deposits to fall (as depositors dissaved to rebuild homesand businesses) and banks’ loan portfolios to deteriorate (as loans became more likely todefault).
Our identification strategy relies on examining how a shock to banks in one locality(flooded Pakistan) affects bank lending in another locality (non-flooded Pakistan). Theidentification strategy is inspired by the seminal work of Peek and Rosengren [2000], whoexamined how falls in Japanese stock prices affected Japanese bank branches in the UnitedStates, and subsequently U.S. credit markets. Using a difference-in-difference methodol-ogy, we compare loan amounts for individuals between different banks, which had differentfunding shocks, before and after the flood, in the non-flooded area.
We focus on lending in the non-flooded parts of Pakistan to overcome the direct effects ofthe flood shock on borrower demand for loans. Further, to overcome potential county-leveldemand changes in the non-flooded area, we include county-specific dummies interactedwith time fixed effects in all of our specifications.
The first of three datasets we use is supplied by the Space and Upper Atmosphere ResearchCommission (SUPARCO, Pakistan’s space agency) to estimate the flood damage in eachtehsil.2 Then we combine the flood damage data with a bank’s loan portfolio in eachtehsil to estimate the relative effect of the floods on each bank. Finally, we use detailedloan data and demographic data from the State Bank of Pakistan’s credit registry, theElectronic Credit Information Bureau (eCIB) to identify the consumers most affected bythe credit reduction and why banks reduce credit disproportionately. The credit registryis a unique dataset that comprises the universe of formal consumer lending in Pakistanand contains information on loan origination dates, maturity dates, product types, anddemographic data such as the borrower’s education level.
Our empirical strategy follows in five steps. First we show that the floods caused increasesin banks’ funding costs. Second, we demonstrate that the more-affected banks reducedlending in the non-flooded area relatively more than the less-affected banks. Third, weshow that this fall in lending is greater for borrowers with less education and credit history.Fourth, we explore why banks disproportionately reduced lending for these consumers.Finally, we analyze the general equilibrium effects of the bank funding shock. We show
2A tehsil is a geographic administrative unit in Pakistan. The average size of a tehsil is 300,000 individuals,and tehsils are similar in size (and variance in size) to counties in the United States.

THE DISTRIBUTIONAL IMPACTS OF BANK CREDIT RATIONING. 4
that less-affected banks did not compensate for the fall in lending by the more-affectedbanks.
The first step of our empirical methodology is to show that the floods affected somebanks more than others. To do so, we show that the floods had two effects on banks:one, preexisting loans in the flooded area were more likely to default relative to loans inthe non-flooded area (a capital shock) and, two, banks that had greater exposure to theflooded area were more likely to have deterioration in deposits as firms and consumersdissaved (liquidity shock).
The second step is to show that more-affected banks reduced lending in the non-floodedareas relatively more than the less-affected banks. To do so, we use the fraction of abank’s portfolio in the flooded area as a measure for the bank’s exposure to the floodsand, consequently, the size of a bank’s funding cost shock. We then use a difference-in-difference methodology to regress this measure of banks’ funding cost shocks on a paneldataset of consumer loans, before and after the flood, in the non-flooded area.
The third step is to show that, following the flood, those banks that had larger funding costshocks, reduced lending in the non-flooded area more for consumers with little educationand consumers with no credit history. To do so, we use a triple difference-in-differencemethodology and interact the borrower’s education level with the size of the bank’s fundingshock.
The fourth step explores the reasons why banks reduced lending more for certain groups.The evidence suggests that adverse selection was the main driver for the greater reductionin lending for consumers with low education. Adverse selection can cause a disproportion-ate reduction in credit across consumer groups if the extent of adverse selection is differentacross such groups. For instance, banks may pass higher funding costs on to consumersthrough higher interest rates. However, this transmission may cause the pool of borrowerswho are willing to take loans at these higher interest rates to be riskier—adverse selec-tion—which causes higher expected rates of default. To cover the higher expected defaultcosts, banks may charge even higher interest rates and subsequently cause even greaterreductions in credit (Stiglitz and Weiss [1981]). Therefore, in those consumer groups forwhich the extent of adverse selection is larger we would expect larger reductions in creditand higher default rates.
To show that adverse selection was driving the disproportionate reduction in credit, weexploit the origination dates of new loans. We look at loans originated just before thefloods (120 days before the flood) and loans originated just after the floods (120 days afterthe flood) in the non-flooded area. We show that, following the flood, the more-affectedbanks originated loans that were relatively more likely to become overdue than less-affectedbanks, in the non-flooded area. Furthermore, we show that the relative increase in overdue

THE DISTRIBUTIONAL IMPACTS OF BANK CREDIT RATIONING. 5
rates for the more-affected banks was greater for those consumer groups that had thegreatest reductions in credit.
We consider alternative reasons for why banks may disproportionately reduce credit tolow education groups. We show that the evidence is not consistent with moral hazard.The evidence is also not consistent with bank preferences for pre-existing consumers.Moreover, the evidence is not consistent with bank regulatory restrictions. Nor, is theevidence consistent with a market share or bank specialization motive.
The fifth step of our empirical methodology analyzes the general equilibrium effects of thebank reduction in credit. The previous steps analyzed only the relative changes in lendingbetween more and less-affected banks. It is conceivable that even though relative lendingby the more-affected banks fell, aggregate lending was unchanged. From a consumerwelfare perspective, we are more interested in aggregate changes in lending.
To analyze the general equilibrium effects, we exploit the variation in bank concentrationin non-flooded tehsils. If the more-affected banks equally reduced lending across eachtehsil, those tehsils with a larger concentration of more-affected banks would have largeraggregate reductions in credit. If the less-affected banks compensated for reductions incredit by more-affected banks, we would observe that the less-affected banks relativelyincreased lending in tehsils with a higher concentration of more-affected banks. To test thispossibility, we use a triple difference-in-difference methodology. We find that less-affectedbanks did not increase lending in the more affected tehsils relative to the less-affectedtehsils. This finding suggests that the general equilibrium effects did not mitigate theeffects of the bank funding cost shock. We conjecture that this lack of general equilibriumeffects is due to the funding cost shock affecting all banks and the difficulty of expandingbank lending to consumers with no credit history.
Our paper is related to a number of strands of literature. A large literature in economicsand finance has shown that exogenous shocks to banks can cause changes in lending tofirms. These shocks vary from liquidity shocks (Khwaja and Mian [2008], Schnabl [2012],Iyer et al. [2014]), information shocks (Hertzberg et al. [2011], Choudhary and Jain [2015]),capital shocks (Gambacorta and Mistrulli [2004], Aiyar et al. [2014]), and financial crises(Popov and Udell [2012], Cetorelli and Goldberg [2012], De Haas and Van Horen [2012]) tonatural disasters (Chavaz [2014], Cortes and Strahan [2014]). In this paper, we add to thisliterature in three key ways. First, we identify who is most affected by changes in bankcredit. Second, we explore the reasons why banks may disproportionately reduce credit tocertain consumers. Third, we concentrate on bank credit to consumers, a hitherto, mostlyoverlooked credit channel in the banking literature.
Our paper complements the literature analyzing the effect of bank credit expansions oncredit card usage. Using credit card data, Gross and Souleles [2002] show that consumers

THE DISTRIBUTIONAL IMPACTS OF BANK CREDIT RATIONING. 6
with low credit scores are the most credit constrained. Agarwal et al. [2015] demonstratethat during credit expansions, low credit score households increased credit usage the most.We show similar results—during a credit recession, those individuals with the least credithistory were most likely to be credit rationed. Furthermore, we extend this work byshowing this result also holds in a more general setting using all bank consumer credit,which allows us to draw more complete conclusions about credit access. For instance, itis possible that even though certain borrowers had lower credit card limits, these smallercredit lines were supplemented by larger personal loans or overdrafts. Finally, since ourunique dataset allows us to match a borrower’s credit data with his or her demographicdata, we are able to show that the least educated borrowers were the most affected.
Section (2) details the floods and our dataset. Section (3) describes the econometric spec-ifications. Section (4) presents the results and section (5) provides additional robustnesstests. Section (6) concludes.
2. Empirical setting
2.1. Pakistan’s 2010 floods. “The 2010 floods in Pakistan were one of the most dev-astating natural disasters of our times” (Food and Agriculture Organization [2011]). Thefloods covered almost 20 percent of Pakistan’s land mass, affected more than 20 millionpeople (11.5 percent of Pakistan’s population) displaced 10 million people, and destroyed1.6 million homes (Food and Agriculture Organization [2011], Dartmouth Flood Observa-tory (DFO) [2015]). Figure (1) describes the timeline and maps the extent of the floodsas of September 2010. Although flooding regularly occurs in Pakistan, “in terms of thenumber affected and the number displaced, the 2010 floods were the largest in the modernhistory of Pakistan by several orders of magnitude” (Fair et al. [2013]). A total of 191tehsils—out of 591 tehsils in all of Pakistan—were affected by the floods.
2.2. The effect of the floods on banks. The effect of the floods on banks came throughtwo different channels: (i) a rise in nonperforming loans (NPLs) (a capital shock) and (ii)a deterioration in deposits (a liquidity shock).
First, banks’ existing loan portfolios in the flooded area became riskier. The large dev-astation affected individuals’ and firms’ incomes causing existing loans to become morelikely to default. Evidence from banks’ annual reports makes this fact clear:
“The year 2010 saw a continuous rising trend in the industry nonperforming loans (NPLs)in the domestic banking sector. The mid-year floods further devastated this situationas the exposure of agriculture and SME brought a sharp hit to lenders” (MCB Limited[2010]).

THE DISTRIBUTIONAL IMPACTS OF BANK CREDIT RATIONING. 7
Figure 1. Map and timeline of the 2010 Pakistan floods
Source: United Nations [2011].
Similarly, “the bank disbursed an amount of Rs. 69,561 million during 2010 (calendaryear) as against Rs. 77,680 million in 2009 showing a decline of 10.5 percent mainly asa result of unprecedented rains/floods due to which agricultural activities in the countrywere badly affected” Zarai Taraqiati Bank Limited [2010].
The deterioration in banks’ loan portfolios was also evidenced by the banks’ credit ratings.On September 2, 2010, Moody’s changed the financial strength of Pakistan’s five biggestbanks from stable to negative, noting that “the country’s main banks face the threat ofa wave of nonperforming loans as the natural disaster undermines Pakistan’s financialfundamentals” (Financial Times [2010]).
To provide empirical evidence for the deterioration in loan portfolios, in section (4.1), weshow that loans in the flooded area were significantly more likely to default than loans inthe non-flooded area following the flood.
Second, like banks in other emerging market economies, Pakistani banks are predominantlydeposit financed (with an aggregate loan-to-deposit ratio of 0.7 in 2009 (IMF [2009])).Therefore, those banks that were primarily based in the flooded area had to contendwith decreasing access to retail deposits as individuals and firms dissaved. To provideempirical evidence for the deterioration in bank liquidity, in section (4.1) we show that

THE DISTRIBUTIONAL IMPACTS OF BANK CREDIT RATIONING. 8
banks’ deposits fell relatively more for those banks that were more exposed to the floodedarea.
Overall, banks’ funding costs increased following the flood. In particular, those banks thatwere more exposed to the flooded area, were more affected.
2.3. Data. We use two main sources for our empirical investigation: (i) the credit datacomes from the SBP and (ii) the extent of the damage to each tehsil comes from theUnited Nations and Pakistan’s SUPARCO.
The credit and individual data comes from the SBP eCIB, which legally requires allbanks and lending institutions to submit data on all borrowers. Some of these datahave been used before by Khwaja and Mian [2005, 2008], Mian [2006], Khwaja et al.[2011], Choudhary and Jain [2015]. However, previous economists had access only to apartial list of corporate borrowers, whereas we have access to every consumer loan by72 different financial institutions.3 Our dataset includes every credit card loan, mortgageloan, car loan, personal loan, small-or-medium enterprise loan, and agricultural loan inPakistan—averaging 3 million different borrowers and 5 million different loans in any onemonth.
The credit data include information on origination dates, maturation dates, and perfor-mance levels of the loans. Unfortunately, the data do not include interest rates.
The dataset stretches from August 2008 to November 2012. For data management pur-poses we randomly use 10 percent of the consumer borrowers (we randomize at theborrower-level, to ensure we retain a balanced panel). We retain all borrowers whoseunique identification number ends in a certain sequence.
Table (1) shows the loan, lender, and borrower characteristics for loans in August 2008(the start of our dataset). To examine how the borrowers differed across lenders thatwere less or more affected by the floods, we split our dataset by the median bank fundingshock. Column 1 has the less-affected banks and column 2 has the more-affected banks.The institutions that were most affected by the floods were relatively more likely to benon-bank financial institutions.
Since the floods affected rural areas more than urban areas, those banks that lent pro-portionally more in cities were less-affected than those that lent more in rural areas.Therefore, since most foreign banks lent mainly in large cities, they were barely affectedby the floods. Additionally, since rural populations are generally less educated, the banksthat were more affected by the floods lent relatively more to less educated borrowers.
3These institutions include public, private, and foreign commercial banks; Islamic banks; developmentfinance institutions; leasing companies; modarabas; micro finance banks; non-bank finance companies; andhousing finance companies.

THE DISTRIBUTIONAL IMPACTS OF BANK CREDIT RATIONING. 9
Some of the information collected by the SBP is passed back to the banks to facilitatelending as part of the SBP’s role as a credit registry. The information is provided through“credit worthiness reports.” The consumer’s creditworthiness report details various at-tributes of the loan: the type of loan, the size of the loan, the amount outstanding, andwhether the loan was secured. Additionally, the credit report provides information on theconsumer’s credit history: how many times the account had been overdue in the last 12months, and how many payments were late during that period.
3. The effect of the funding shock on bank loans.
3.1. Econometric specification. The paper’s main question is, what is the effect of abank funding shock on bank lending? We answer this question using a natural experimentthat exogenously increased banks’ NPLs and reduced banks’ deposits in a way that variedacross banks. We argue that this exogenous and unexpected surge in NPLs and reductionin deposits raised a bank’s funding cost. We investigate whether banks’ compensated forthis increase in costs by decreasing leverage and subsequently decreasing lending. If banksdid so, to whom did they reduce lending, and by how much?
The main source of identification in the paper will be to compare loan amounts for in-dividuals between different banks who had different funding shocks, before and after thefloods. To construct our measure of a bank’s funding shock, we use a bank’s exposure tothe flooded area in Pakistan.
We estimate equations of the following form:
Ybpit = abpi +act +β1 ×Timet×Funding Shockb+β2×Post Timet×Funding Shockb + εbpit
The unit of observation is at the bank-product-individual-date level, so Ybpit is the variableof interest for bank b, credit-product p and individual i in quarter t. For example, it couldbe the size of the credit card amount outstanding by individual i at bank b, in quartert. Funding Shockb is a continuous variable between 0 and 1, and measures the bank’sexposure to the flooded area. “Time” is the number of quarters since August 2008, and“Post Time” is the number of quarters since the start of the floods (September 2010) and0 for all quarters before the flood.
All of the main regressions contain a tehsil interacted with a date fixed effect, αct. Thisfixed effect ensures that we are estimating the effect of the funding shock using only banksthat were differentially affected by funding shocks while controlling for any differences intehsils over time. For instance, any aggregate demand shifts over time across tehsils wouldbe accounted for using these fixed effects. The inclusion of a bank dummy interacted witha product dummy interacted with an individual dummy fixed effect, abpi, ensures we are

THE DISTRIBUTIONAL IMPACTS OF BANK CREDIT RATIONING. 10
controlling for any individual-bank-product specificity (it also ensures we are including afixed effect for each observation in the panel’s cross-section).
In contrast to a standard difference-in-difference specification, we add a linear time trendfor the funding shock (Timet × Funding Shockb). We introduce this extra variable toensure we do not conflate a pre-existing linear trend in bank lending with the effect of thefunding shock on a bank’s lending. Further, you would expect the effect of a funding shockto appear in the data over time (as the rate of new loans issued and the rate of existingloans renewed decreases). This expectation suggests that the optimal specification wouldbe to estimate a trend break (β2) in the volume of active loans (as opposed to a levelchange in the number of existing loans following the funding shock). The coefficient ofinterest, β2, should be interpreted as the causal effect of a 1 percent change in fundingshock on a bank’s willingness to lend per quarter.
We create a measure for the “Funding Shockb” for bank b by multiplying the damage ineach tehsil, c, by the fraction of bank b’s loan portfolio in tehsil c and summing over allflooded tehsils.
Definition 1. The ‘‘Funding Shockb” for bank b is defined as the fraction of the bank’sloan portfolio that was exposed to the flooding4:(1)
Funding Shockb=∑
c
(Bank b’s loans outstanding in tehsil c) × (fraction of tehsil c flooded)Bank b’s total loans outstanding
The standard errors εbpit are clustered at the bank level.
3.1.1. Outcomes of interest. There are two main outcomes of interest in the paper:
• Active loanbpit
• Log loan sizebpit
“Active loanbpit” is a dummy variable equal to 1 if individual i at bank b in date t has anoutstanding loan in credit product p.
“Log loan sizebpit” is defined as the log of loan size outstanding in date t at bank b forproduct p by individual i. If there is no active loan, this variable is coded as missing.Given the endogeneity that a positive loan size is conditional on being granted a loan, ourresults mainly concentrate on the extensive margin—whether consumers get loans or not.
4All loan amounts are as of August 2008—24 months before the start of the flood.

THE DISTRIBUTIONAL IMPACTS OF BANK CREDIT RATIONING. 11
4. Results
As a precursor to our main results, we first demonstrate that immediately after the floods,loans in the flooded area were more likely to default (capital shock) and, for those banksthat were more exposed to the flooded area, their deposits relatively decreased (liquidityshock). These two effects suggest that the floods caused a funding shock to banks. Secondwe show that immediately following the flood, those banks with larger funding shocksrelatively decreased lending more in the non-flooded area. Third, using these initial results,we show that banks with larger funding shocks reduced credit more to consumers withlittle education or credit history. Fourth, we show that the evidence suggests banksdisproportionately reduced credit across consumer groups because of differing degrees ofadverse selection within consumer groups. Finally, we show that the reduction in creditis not compensated by more aggregate lending by the less-affected banks suggesting bothpartial and general equilibrium effects.
4.1. Both capital and liquidity shocks for banks caused an increase in banks’funding costs. In figure (5), we show that loans in the flooded area were more likelyto default immediately after the floods (capital shock). To construct figure (5) we regresswhether a loan defaults on the fraction of area in a tehsil that was flooded interacted witha set of time dummies, and additional fixed effects.5 The figure clearly shows that defaultrates in the flooded area rapidly climbed following the flood. This result corroborates theinformation in banks’ annual reports and suggests that those banks that were exposed tothe flooded area suffered a capital shock.
In figure (6), we show a dramatic, sudden, and sustained relative decrease in liquidityfor banks with greater exposure to the floods (liquidity shock).6 To do so, we show that,following the flood, average deposits for more-affected banks (defined as those banks withan above median funding shock) declined relative to such deposits for less-affected banks.This evidence is consistent with individuals dissaving and reducing deposits at banks.
Overall, a rise in NPLs and fall in deposits would cause banks’ funding costs to rise.
4.2. Those banks with a larger funding shock relatively reduced credit morethan those banks with smaller funding shocks. Those banks that suffered a largerfunding shock, immediately following the floods, reduced lending in the non-flooded area.Figure (7) shows the difference in lending, pre- and post- floods between banks withdifferent funding shocks. We plot figure (7) by regressing whether a loan is active on the5Following Hertzberg et al. [2011], we code a loan to be overdue in only the first quarter it is observed asoverdue. To ensure we do not double count our overdue observations we code the loan as missing for allloan observations after this quarter.6Since some non-bank financial institutions do not collect deposits, we show only the change in depositsfor those banks that report data on deposits to the SBP.

THE DISTRIBUTIONAL IMPACTS OF BANK CREDIT RATIONING. 12
magnitude of the bank’s funding shock interacted with a full set of time dummies—whilecontrolling for (i) a bank dummy interacted with a borrower dummy interacted with acredit product dummy fixed effect (αbip) and (ii) a tehsil dummy interacted with a timedummy fixed effect (αct). These fixed effects ensure that we control for (i) any bank-borrower specificity and (ii) any aggregate credit changes within the tehsil over time.
In figure (7), we show that prior to the floods, the more-affected banks were expandingthe most (as seen by an upward sloping trend line prior to the floods). But immediatelyafter the floods, the more-affected banks reduced lending and stopped expanding relativeto the less-affected banks (as seen by an almost flat trend line following the flood). Thisfinding is the primary evidence that the funding shock relatively reduced lending.
The estimates in table (2) demonstrate that a 1 percentage point increase in the fundingshock led to a 0.7 percentage point decrease in the likelihood a bank will offer a loan to agiven borrower a year after the flood. The median funding shock (weighted by bank size)to a bank was just under 1 percent, suggesting that the funding shock caused 14,000 fewerloans in the non-flooded area, one year after the flood.7
4.3. To whom did banks reduce credit? The more-affected banks, immediately fol-lowing the floods relatively reduced lending to borrowers with little credit history andlittle education in the non-flooded area.
In table (3) we do regressions similar to those in table (2), except we separate our resultsby the consumer’s educational attainment. The more-affected banks relatively reducedlending for those consumers with the lowest educational attainment. Yet there was nostatistically significant effect on those consumers with a graduate or post-graduate degree.
In table (4), column 1, we analyze only whether new borrowers (those who did not havea loan in August 2008) were less likely to get a loan at more-affected banks following theflood. When we analyze only the new borrowers, we see that the more-affected banks wererelatively less likely, to a statistically significant extent, to offer new loans to new borrowersfollowing the flood. In contrast, in column 2, where we analyze only those borrowers whohad an active loan in August 2008, banks were not statistically significantly less willingto offer these individuals new loans.
Overall, the largest effects of the banks’ reduction in credit following their funding shockis on those consumers with little credit history and little education.
4.4. Why did banks reduce lending disproportionately to some consumers?
7A total of 2 million borrowers resided in the non-flooded area prior to the flood. Therefore, multiplying0.7 (causal effect of the flood shock) by 1 percent (median magnitude of the funding shock) by 2 million(number of borrowers) gives 14,000 fewer borrowers.

THE DISTRIBUTIONAL IMPACTS OF BANK CREDIT RATIONING. 13
4.4.1. Did adverse selection or moral hazard cause banks to reduce lending disproportion-ately to some groups? Rises in banks’ funding costs could be passed onto consumersthrough higher interest rates. However, this transmission may cause a different set ofborrowers. For instance, the higher interest rates may cause a riskier pool of borrowers totake loans (adverse selection) or the same borrowers to take riskier actions (moral hazard).In turn, these developments may lead banks to charge even higher interest rates and causeeven greater reductions in credit. Consistent with this mechanism, those banks with thelargest funding shock would also have the largest rises in default rates following the flood.
We first test whether adverse selection was driving the disproportionate reduction in creditacross groups. To do so, we test whether loans originated after the floods by the more-affected banks were relatively more likely to default. As before, we examine only loansoriginated in the non-flooded area. Furthermore, to isolate the change in banks’ lend-ing practices, we examine only loans originated within a narrow window around thefloods—120 days before, and 120 days after the flood. We follow each loan up to 600days from origination (or until it ends, whichever is earlier).
Specifically, we run regressions of the following form:
Overdue Everbpi = β1 × Originated Post Floodbpi + β2 × Originated Post Floodbpi × Funding Shockb
+ Controls + εbpi,
where “Overdue Everbpi” is a dummy variable equal to 1 if the loan for bank b, in productp, for borrower i, goes overdue within the first 600 days of being originated or beforematuring, whichever is sooner, and 0 otherwise.8 “Originated Post Floodbpi” is a dummyvariable equal to 1 if the loan was originated within the 120 days following the flood, and0 if the loan was originated within the 120 days before the flood.
The results in table (5) columns 1 and 2 show that default rates relatively rose for thoseloans originated after the floods by the more-affected banks in the non-flooded area. Thisoutcome is the primary evidence that more-affected banks’ pool of borrowers becameriskier following the flood.
To provide further causal evidence for banks changing whom they lend to following theirfunding shock, we do a placebo test. In columns 3 and 4, we do the same specifications asin columns 1 and 2, except we use those loans originated just before and after September2009— exactly one year before the flood. In the placebo test, there is no difference indefault rates between the more and less-affected banks, which provides further evidence
8In contrast to the regressions in the previous section, we collapse our data by date to exploit the loanorigination dates.

THE DISTRIBUTIONAL IMPACTS OF BANK CREDIT RATIONING. 14
that it was the banks’ funding shock (caused by the floods) that caused the more-affectedbanks to take a riskier portfolio of borrowers.
Finally, if adverse selection is the key reason for the disproportionate reduction in lending,then the larger the relative fall in lending for a consumer group, the larger the relativeincrease in default rates for that consumer group. To test this prediction, in table (6),we include dummies for an individual’s education level interacted with when the loanwas originated and the bank’s funding shock. This triple difference-in-difference specifi-cation tests whether, following the flood, those loans originated to individuals with littleeducation by the more-affected banks were relatively more likely to default.
In figure (8), we show how the relative reduction in credit across education groups and therelative rise in overdue rates are related for the more-affected banks in the non-floodedarea. Less educated individuals were less likely to receive a loan from more-affected banksand were more likely to default on their loans following the flood. This result is compellingevidence that adverse selection is driving the disproportionate large reduction in credit tocertain consumers.
Is the evidence consistent with moral hazard causing a disproportionate reduction in lend-ing? If banks raise interest rates, this action will cause a borrower’s return to fall, which,may in turn lead borrowers to take riskier actions causing higher default rates.
To explore this possibility, we exploit the intertemporal differences in maturity dates.We showed that the more-affected banks were less likely to offer loans following the flood.Subsequently borrowers’ dynamic repayment incentive—the incentive to repay the currentloan to ensure they get new loans—will also fall (Karlan and Zinman [2009a]). If moralhazard was driving the reduction in credit to certain borrowers, due to the dynamicrepayment incentive, we would expect that the loans at the more-affected banks thatmatured just after the floods, would be relatively more likely to default.
We test the moral hazard prediction by comparing loans that matured 120 days beforeand 120 days after the flood.
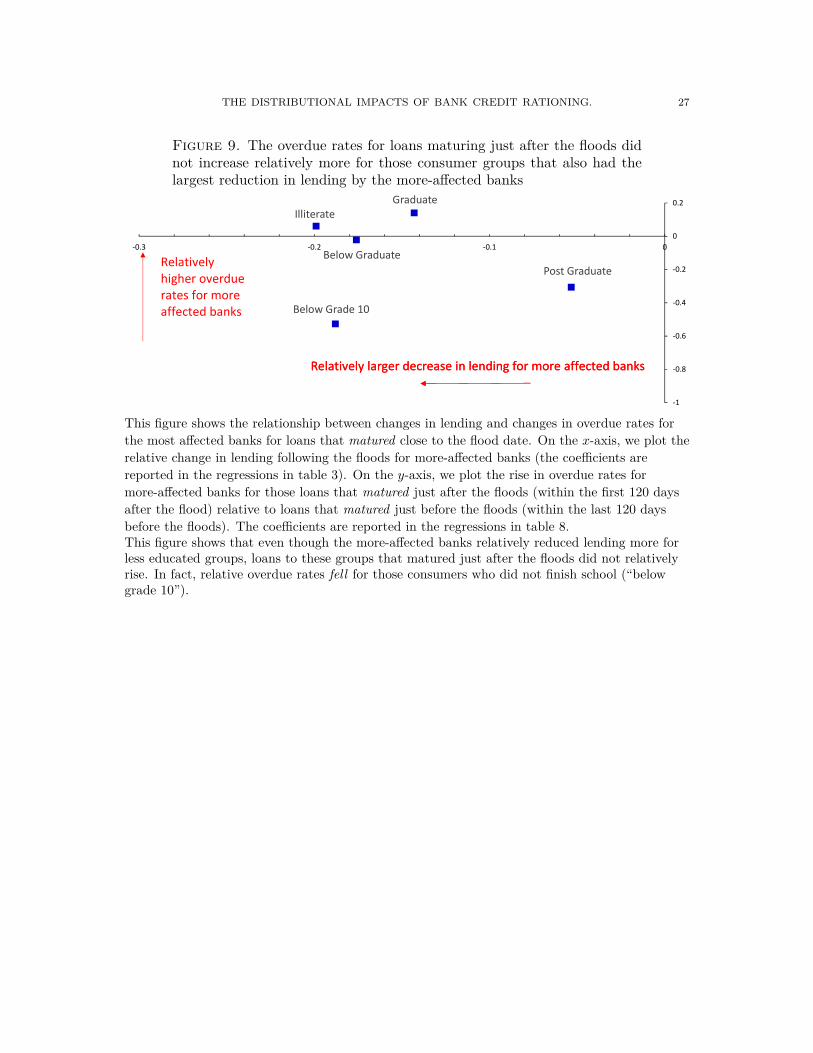
We present our results in tables (7) and (8). Table (7) shows that default rates did notrelatively rise for those loans that matured just after the floods for the more-affected banksin the non-flooded area. Table (8) shows that relative default rates for the more-affectedbanks did not rise systematically for borrowers with low education. Furthermore, in figure(9), we show that default rates did not relatively rise in any pattern that is related to thegroups that had the largest reductions in credit.
Overall, our results are suggestive that adverse selection—and not moral hazard—drovethe disproportionate reduction in credit.
THE DISTRIBUTIONAL IMPACTS OF BANK CREDIT RATIONING. 15
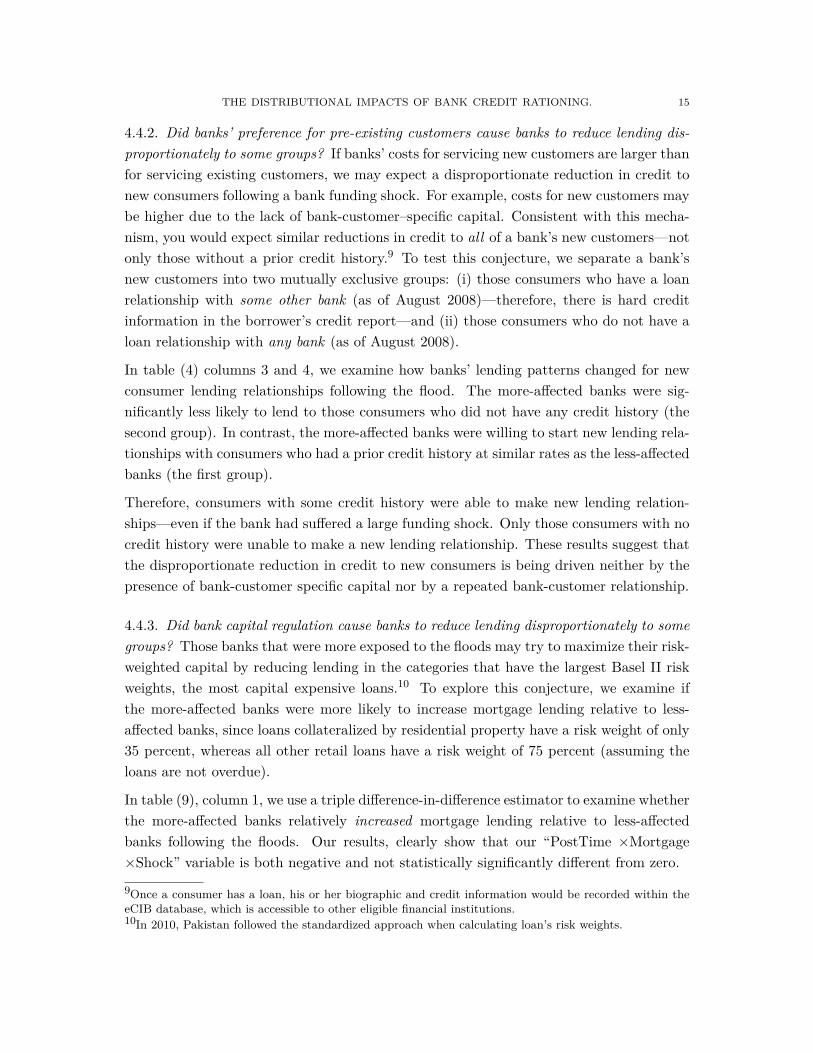
4.4.2. Did banks’ preference for pre-existing customers cause banks to reduce lending dis-proportionately to some groups? If banks’ costs for servicing new customers are larger thanfor servicing existing customers, we may expect a disproportionate reduction in credit tonew consumers following a bank funding shock. For example, costs for new customers maybe higher due to the lack of bank-customer–specific capital. Consistent with this mecha-nism, you would expect similar reductions in credit to all of a bank’s new customers—notonly those without a prior credit history.9 To test this conjecture, we separate a bank’snew customers into two mutually exclusive groups: (i) those consumers who have a loanrelationship with some other bank (as of August 2008)—therefore, there is hard creditinformation in the borrower’s credit report—and (ii) those consumers who do not have aloan relationship with any bank (as of August 2008).
In table (4) columns 3 and 4, we examine how banks’ lending patterns changed for newconsumer lending relationships following the flood. The more-affected banks were sig-nificantly less likely to lend to those consumers who did not have any credit history (thesecond group). In contrast, the more-affected banks were willing to start new lending rela-tionships with consumers who had a prior credit history at similar rates as the less-affectedbanks (the first group).
Therefore, consumers with some credit history were able to make new lending relation-ships—even if the bank had suffered a large funding shock. Only those consumers with nocredit history were unable to make a new lending relationship. These results suggest thatthe disproportionate reduction in credit to new consumers is being driven neither by thepresence of bank-customer specific capital nor by a repeated bank-customer relationship.
4.4.3. Did bank capital regulation cause banks to reduce lending disproportionately to somegroups? Those banks that were more exposed to the floods may try to maximize their risk-weighted capital by reducing lending in the categories that have the largest Basel II riskweights, the most capital expensive loans.10 To explore this conjecture, we examine ifthe more-affected banks were more likely to increase mortgage lending relative to less-affected banks, since loans collateralized by residential property have a risk weight of only35 percent, whereas all other retail loans have a risk weight of 75 percent (assuming theloans are not overdue).
In table (9), column 1, we use a triple difference-in-difference estimator to examine whetherthe more-affected banks relatively increased mortgage lending relative to less-affectedbanks following the floods. Our results, clearly show that our “PostTime ×Mortgage×Shock” variable is both negative and not statistically significantly different from zero.
9Once a consumer has a loan, his or her biographic and credit information would be recorded within theeCIB database, which is accessible to other eligible financial institutions.10In 2010, Pakistan followed the standardized approach when calculating loan’s risk weights.

THE DISTRIBUTIONAL IMPACTS OF BANK CREDIT RATIONING. 16
Our results suggest that the disproportionate reduction in credit to borrowers with littleeducation or credit history is not being driven by differing risk-weights on bank loans. Ifthe more exposed banks relatively preferred lending with lower risk weights, we shouldobserve higher relative mortgage lending for these banks. Not only do we find a non-statistically significant effect, but we also find that the point estimate is negative.
4.4.4. Did banks’ preference for specialization or maintaining market share cause them toreduce lending disproportionately to some groups? The more-affected banks may prefer toreallocate credit to those loan products in which they are heavily specialized or to thoseproducts in which they have a large market share (De Jonghe et al. [2016]). To explorethis conjecture, we construct the following measures for a bank’s product specialization,and a bank’s product market share. As previously, we construct the measures using loanbalances as of August 2008.
Bank Product Specializationbp = Total lending in product p by bank bTotal lending by bank b
Bank Product Market Sharebp = Total lending in product p by bank bTotal lending in product p by all banks
We interact our measures of bank product specialization, and bank product market sharewith our time variables and our funding shock variables to examine if specialization orproduct shares may be driving the disproportionate reduction in lending to some groups.
In table (10), column 1, we examine if the more-affected banks reallocated credit towardthose loan categories in which they were more specialized. The small, negative, andnot statistically significant coefficient for “PostTime*Bank Product Specialization*Shock”,suggests that product specialization was not driving the disproportionate reduction incredit for some consumer groups.
In column 2, we examine if the more-affected banks reallocated credit toward those loanproducts in which they have a larger market share. Similar to our results in column 1,we see a small and not statistically significant coefficient for “PostTime*Bank ProductMarket Share*Shock”. This result suggests that more-affected banks were not prioritizingthose products for which they have a large market share.
Overall, the results suggest that the more-affected banks did not prioritize credit towardthose loan products in which they either are heavily specialized or have a large marketshare.
4.5. Did less-affected banks compensate for the fall in lending by the more-affected banks? To explore the general equilibrium effects to total lending from banks’funding shocks, we consider how lending changed in different tehsils depending on the

THE DISTRIBUTIONAL IMPACTS OF BANK CREDIT RATIONING. 17
original banking structure in that tehsil. In particular, we create a measure of the tehsil’sshock by noticing that some banks lent more in some tehsils than others. Therefore, thosetehsils that were dominated by the more-affected banks should also be more affected—sincethese tehsils will have the largest reduction in credit.
If there was no aggregate credit shock to the non-flooded tehsils following the flood, theabsense of an aggregate credit shock would require the less-affected banks to lend relativelymore in those tehsils that were more affected. To explore this possibility in more detail,we define a “tehsil shock” in the following way:
Definition 2. The “tehsil shockc” to tehsil c is defined as the fraction of the tehsil’slending (as of August 2008) which was exposed to the funding shock11.
(2)
Tehsil Shockc=∑
b
(Funding cost shockb) × (fraction of lending in tehsil c by bank b)Tehsil c’s total loans outstanding
The tehsil shock corresponds to the mean bank funding shock (weighted by bank lending)in that tehsil. Figure (2) shows the distribution of tehsil shocks across all non-floodedtehsils.
Understanding the general equilibrium effects are crucial for the welfare and policy impli-cations. If a single bank is (or many banks are) unable to distribute credit, one importantmechanism to mitigate the reduction in credit would be for other banks to increase theirsupply of credit—in such a way that total credit in the tehsil does not fall.
In table (11), we interact banks’ funding shock with the tehsil’s shock. The results suggestthere was no substitution of credit from the more-affected banks to the less-affected banksin those tehsils that were affected the most. The coefficient on “PostTime × Funding Shock×Tehsil Shock” is positive and not statistically significant. If the less-affected banks lentrelatively more in the more affected tehsils, this coefficient would be negative.
Our results demonstrate that following banks’ funding shock there was no aggregate sub-stitution of credit to the less-affected banks. This suggests that shocks to individualbanks can have large distributional impacts, which are not offset by greater lending byless-affected banks. We conjecture that the lack of additional lending by less-affectedbanks is due to the funding cost shock affecting all banks and the difficulty of expandingbank lending to consumers with no credit history.
11All loan amounts are as of August 2008 – 24 months before the start of the floods.

THE DISTRIBUTIONAL IMPACTS OF BANK CREDIT RATIONING. 18
5. Robustness
In this section, we examine alternative predictions for how the floods could affect lendingin both the flooded and non-flooded areas.
5.1. Alternative reasons why the most affected banks may have reduced creditthe most in the non-flooded area.
5.1.1. Is this a credit demand story? Specifically, did credit fall in the non-flooded area bythe most affected banks because of greater credit demand in the flooded area? The largedestruction in the flooded region could spur large credit demand in that area—consumersand firms, after all, need to rebuild homes, factories, and inventory. We might expect thatbanks that had a larger initial exposure to the flooded area would also have a comparativeadvantage in lending more in the flooded area following the flood—better institutional andborrower knowledge, and a larger branch network (this result would be consistent withChavaz [2014]). Then the large relative decreases in the non-flooded area by the mostaffected banks could be a consequence of increased credit demand in the flooded area.However, the empirical results in table (12) in Appendix (A) refute this explanation.
The more-affected banks relatively reduced lending more in the flooded area following theflood. A 1 percent increase in the funding shock was correlated with a bank being 0.05percentage point less likely to lend to a borrower relative to other banks in the floodedarea one year after the flood.
5.1.2. Are the results distorted by different bank types? Our dataset has 72 financial insti-tutions that lend to consumers. One potential concern is that our results are driven by asole bank type. For instance, non-bank financial institutions—such as credit card compa-nies and development agencies—may react differently than banks since they are generallysmaller and do not take deposits. Furthermore, public sector banks may react differentlyto private banks because of different objectives and different governance structures. Toexplore this possibility, we restrict our dataset by omitting a single bank type (non-bankfinancial institutions, public banks, domestic private banks, and foreign banks) and repli-cate the regressions in table (2). Table (13) in Appendix (A) shows that the results arevery similar, regardless of whether we exclude any particular bank type. These resultssuggest that the funding shock affected all financial institutions in similar ways.
5.1.3. Did banks reduce credit in a single loan category? Our dataset contains 64 differentloan products. To ensure that one loan type is not driving our results we estimate thecredit reduction by the more affected banks for each loan category.12 In table (14), we12For clarity of the results we only include products which have a minimum number of loans as of August2008. The top eight loan products represent 94 percent of total loans as of August 2008.

THE DISTRIBUTIONAL IMPACTS OF BANK CREDIT RATIONING. 19
regress whether a loan was active on loan product dummies interacted with the bankfunding shock and the “PostTime” variable, and other controls. Table (14) shows that,following the floods, the more-affected banks relatively reduced lending in multiple loanproducts, in the non-flooded area. The largest reductions in credit were for agriculturalloans (for capital investments), car loans, and overdraft facilities.
6. Conclusion
Well functioning credit markets are crucial for the effective allocation of resources, andin turn, economic growth. However, shocks to financial intermediaries can hinder theireffectiveness. These shocks may take many different forms, such as a surge in mortgagedefaults (e.g., global financial crisis), large “hot-money” outflows (e.g., Asian financialcrisis), international sanctions (e.g., Pakistan’s nuclear testing), or U.S. monetary policychanges (e.g., “taper tantrum” in emerging markets following the end of the United States’quantitative easing program). Analyzing how these potential shocks affect financial in-termediation is often complicated by other contemporaneous changes in the economy. Toovercome this complication, this paper uses a bank’s exposure to unprecedented largefloods in Pakistan to explore how a change in a bank’s funding cost, affects how much itlends, to whom it lends, and why its lending decisions change.
We have three key empirical results: First, banks rationed credit following a funding shock:those banks that suffered a 1 percent funding shock were 0.7 percentage point less likelyto lend to an individual one year after the floods in the non-flooded area. Second, banksdisproportionately reduced credit to certain borrowers: consumers with little educationand no credit history were rationed the most. Third, the reduction in credit was notcompensated by more aggregate lending by the less-affected banks.
Our empirical results find that adverse selection is the most likely cause for the dispropor-tionate fall in lending to new borrowers and individuals with low education. First, loansoriginated immediately in the non-flooded area, by the relatively more-affected banks im-mediately after the floods were more likely to default than less-affected banks. Second,relative loan defaults rose the most for the more-affected banks in those sectors in whichthose banks reduced lending the most. These findings are the primary evidence thatadverse selection is the key cause of the disproportionate reduction in credit to certainconsumer groups.
Our paper demonstrates that individuals who have the least capacity to signal their credit-worthiness—either through a public credit history or through education—were most likelyto be the banks’ marginal borrowers. Further, these individuals are marginal due to finan-cial frictions (adverse selection) as opposed to more elastic demand for loans. Therefore,the rise in intermediation costs amplified pre-existing market failures.

THE DISTRIBUTIONAL IMPACTS OF BANK CREDIT RATIONING. 20
References
S. Agarwal, S. Chomsisengphet, N. Mahoney, and J. Stroebel. Do banks pass throughcredit expansions? the marginal profitability of consumer lending during the greatrecession. Working paper, 2015.
S. Aiyar, C. W. Calomiris, J. Hooley, Y. Korniyenko, and T. Wieladek. The internationaltransmission of bank capital requirements: Evidence from the uk. Journal of FinancialEconomics, 113(3):368–382, 2014.
A. Banerjee, E. Breza, E. Duflo, and C. Kinnan. Do credit constraints limit entrepreneur-ship? heterogeneity in the returns to microfinance. Working paper, 2015.
N. Cetorelli and L. S. Goldberg. Follow the money: Quantifying domestic effects of foreignbank shocks in the great recession. The American Economic Review, 102(3):213, 2012.
M. Chavaz. Riders of the storm: Economic shock & bank lending in a natural experiment.Working Paper, 2014.
M. A. Choudhary and A. K. Jain. How public information affects asymmetrically informedlenders: Evidence from a credit registry reform. Working Paper, 2015.
K. R. Cortes and P. E. Strahan. Tracing out capital flows: How financially integratedbanks respond to natural disasters. Working paper, 2014.
Dartmouth Flood Observatory (DFO). Global active archive of large flood events. Elec-tronic Resource, 2015.
R. De Haas and N. Van Horen. Running for the exit? international bank lending duringa financial crisis. Review of Financial Studies, 2012.
O. De Jonghe, H. Dewachter, K. Mulier, S. Ongena, and G. Schepens. Some borrowers aremore equal than others: Bank funding shocks and credit reallocation. Working Paper,2016.
C. C. Fair, P. M. Kuhn, N. Malhotra, and J. N. Shapiro. How natural disasters affectpolitical attitudes and behavior: Evidence from the 2010-11 pakistani floods. WorkingPaper, 2013.
Financial Times. Pakistan banks at risk from flood impact. September 3rd, 2010.Food and Agriculture Organization. Pakistan floods one year on. 2011.L. Gambacorta and P. E. Mistrulli. Does bank capital affect lending behavior? Journalof Financial intermediation, 13(4):436–457, 2004.
D. B. Gross and N. S. Souleles. An empirical analysis of personal bankruptcy and delin-quency. Review of financial studies, 15(1):319–347, 2002.
A. Hertzberg, J. Liberti, and D. Paravisini. Public information and coordination: Evidencefrom a credit registry expansion. The Journal of Finance, 66(2):379–412, 2011.
IMF. Global financial stability report 2009. 2009.R. Iyer, J.-L. Peydró, S. da Rocha-Lopes, and A. Schoar. Interbank liquidity crunch andthe firm credit crunch: Evidence from the 2007–2009 crisis. Review of Financial studies,

THE DISTRIBUTIONAL IMPACTS OF BANK CREDIT RATIONING. 21
27(1):347–372, 2014.D. Karlan and J. Zinman. Observing unobservables: Identifying information asymmetrieswith a consumer credit field experiment. Econometrica, 77(6):1993–2008, 2009a. URLhttp://onlinelibrary.wiley.com/doi/10.3982/ECTA5781/abstract.
D. Karlan and J. Zinman. Expanding credit access: Using randomized supply decisionsto estimate the impacts. Review of Financial studies, page hhp092, 2009b.
A. Khwaja, A. Mian, and A. Qamar. Bank credit and business networks. Working Paper,2011.
A. I. Khwaja and A. Mian. Do lenders favor politically connected firms? rent provision inan emerging financial market. The Quarterly Journal of Economics, 120(4):1371–1411,2005.
A. I. Khwaja and A. Mian. Tracing the impact of bank liquidity shocks: Evidence froman emerging market. The American Economic Review, pages 1413–1442, 2008.
MCB Limited. Annual report. page 67, 2010.A. Mian. Distance constraints: The limits of foreign lending in poor economies. TheJournal of Finance, 61(3):1465–1505, 2006.
J. Peek and E. S. Rosengren. Collateral damage: Effects of the japanese bank crisis onreal activity in the united states. American Economic Review, pages 30–45, 2000.
A. Popov and G. F. Udell. Cross-border banking, credit access, and the financial crisis.Journal of International Economics, 87(1):147–161, 2012.
P. Schnabl. The international transmission of bank liquidity shocks: Evidence from anemerging market. The Journal of Finance, 67(3):897–932, 2012.
A. Solis. Credit access and college enrollment. Journal of Political Economy, 125(2):000–000, 2017.
J. E. Stiglitz and A. Weiss. Credit rationing in markets with imperfect information. TheAmerican economic review, 71(3):393–410, 1981.
C. Udry. Risk and insurance in a rural credit market: An empirical investigation innorthern nigeria. The Review of Economic Studies, 61(3):495–526, 1994.
United Nations. Pakistan floods: One year on. 2011.Zarai Taraqiati Bank Limited. Annual report. page 9, 2010.

THE DISTRIBUTIONAL IMPACTS OF BANK CREDIT RATIONING. 22
7. Figures and Tables
Figure 2. Effect of the floods by tehsil
Damage Intensity
Natural Waterways
Floods
Tehsils
%age Affected Area (sq km)
0.00 - 0.05
0.05 - 0.15
0.15 - 0.25
0.25 - 0.35
0.36 - 0.95
Pakistan maps before and after the rains and floods 2010
BEFORE
AFTER (as of 24 August 2010)
Disputed Areas
Disputed Areas
Source: UNOSAT and SUPARCO
Source:United Nations [2011].

THE DISTRIBUTIONAL IMPACTS OF BANK CREDIT RATIONING. 23
Figure 3. The distribution of the funding shock by bank0
2040
6080
Den
sity
0 .05 .1 .15Value of loan portfolio affected by the floods
010
2030
40D
ensi
ty
0 .05 .1 .15Value of loan portfolio affected by the floods
The left panel shows the distribution for the size of the flood shock for each bank. The rightpanel shows the distribution for the size of the flood shock for each bank, normalized by thenumber of loans each bank extends. The least affected institutions were the smallest financialinstitutions since many had a small geographic focus. In our robustness results, we demonstratethat excluding the non-banking financial institutions (the smallest financial institutions) from ourregressions do not affect our results (table (13) in Appendix A).
Figure 4. The distribution of the tehsil shock in the non-flooded area
010
2030
40D
ensi
ty
0 .02 .04 .06 .08 .1Distribution of the tehsil shocks in the non−flooded tehsils
This graph shows the distribution of the “tehsil shock” (see definition (2)) across tehsils in thenon-flooded area. The “tehsil shock” is the proportion of total lending in that tehsil affected bythe funding shock.

THE DISTRIBUTIONAL IMPACTS OF BANK CREDIT RATIONING. 24
Figure 5. The effect of the floods on overdue rates between flooded andnon-flooded areas
‐0.05
0
0.05
0.1
Mar‐08 Mar‐09 Mar‐10 Mar‐11 Mar‐12
The effect of the floods on banks' asset qualityPoint‐wise coefficient estimate with confidence interval for the regression of 'overdue loan' on 'percent of tehsil flooded' interacted with a 'date' fixed effect, and additional controls.
Start of the floods
Difference in overdue rates
We regress whether a loan is overdue on the percentage of a tehsil that is flooded. The solid blueline is the quarterly coefficient for the increase in overdue rates for a 1 percent rise in the area ofa tehsil that was flooded. The regression includes “bank × product × individual” and “bank ×date” fixed effects and the standard errors are clustered at the tehsil level. The light blue dottedlines are point-wise 95 percent confidence intervals. The full regression is as follows:ybict = abpi + abt + β × TimeDummiest × Fraction of tehsil floodedc + εbpit.The graph shows a dramatic, sudden, and sustained increase in the overdue rate for loans in theflooded area immediately following the floods. Following the flood, in a tehsil that was flooded by1 percent, the loans were 0.15 - 0.25 percentage point more likely to be overdue every quarter.This increase in the percentage of nonperforming loans in the flooded area is the primaryevidence for a sustained increase in a bank’s funding costs following the floods in 2010.
Figure 6. The effect of the floods on banks’ total deposits
60
80
100
120
140
160
Jan‐08 Jan‐09 Jan‐10 Jan‐11 Jan‐12 Jan‐13
The effect of the flood on banks' depositsAverage deposits. June 2010 = 100
Less affected banks
More affected banks
Start of the floods
We split banks that take deposits into two groups—those banks that had an above-medianexposure to the floods (more-affected banks), and those banks that had a below-median exposureto the floods (less-affected banks). We normalize banks’ average deposits in June 2010 to be 100and show that deposits grew significantly more slowly for the more-affected banks than for theless-affected banks following the flood.

THE DISTRIBUTIONAL IMPACTS OF BANK CREDIT RATIONING. 25
Figure 7. The effect of the floods on a bank’s likelihood to lend in thenon-flooded areas
‐2
‐1
0
1
Mar‐08 Mar‐09 Mar‐10 Mar‐11 Mar‐12
The effect of the floods on banks' likelihood to lend in the non‐flooded areas. Point‐wise coefficient estimate with confidence interval for the regression of 'active loan' on 'bank funding shock' interacted with a 'date' fixed effect, and additiona
Start of the floods
Pre‐flood trend line
Post‐flood trend line
Difference in active loans
The blue squares are the quarterly coefficients for the effect of the funding shockb on banks’likelihood to lend in the non-flooded areas over time. The funding shock is defined as the fractionof a bank’s loan portfolio that was in the flood-affected region as of August 2008. The regressionincludes “bank×product × individual” and “tehsil×time” fixed effects. The black bars arepoint-wise 95% confidence intervals. The full regression is as follows:ybict = abpi + abt + β × TimeDummiest × Funding shockb + εbpit.The graph shows a dramatic and sudden decrease in the trend of active loan growth by thosebanks that were most affected by the floods immediately following the floods in June 2010. Thisfigure is the visual analogue of column 1 in table 2, where we are plotting the estimatedcoefficient and the standard errors from a regression of active loans on the funding shockinteracted with quarter dummies and various controls.

THE DISTRIBUTIONAL IMPACTS OF BANK CREDIT RATIONING. 26
Figure 8. The most affected banks relatively reduced lending the mostfor those groups that also had the largest rise in relative overdue ratesfollowing the flood
Illiterate Below Grade 10
Below Graduate
Graduate Post Graduate
‐0.08
‐0.04
0
0.04
0.08
0.12
‐0.3 ‐0.2 ‐0.1 0
The relatively largest increase in overdue rates and the relatively largest decrease in lending was for the least educated borrowers by the most affected banks
Relativelyhigher overdue rates for more affected banks
Relatively larger decrease in lending for more affected banks
This figure shows the relationship between changes in lending and changes in overdue rates forthe most affected banks for loans originated close to the flood date. On the x-axis, we plot therelative change in lending following the floods for more-affected banks (the coefficients arereported in the regressions in table 3). On the y-axis, we plot the rise in overdue rates formore-affected banks for those loans originated just after the floods (within the first 120 days afterthe floods) relative to loans originated just before the floods (within the last 120 days before thefloods). The coefficients are reported in the regressions in table 6.This figure shows that the more-affected banks reduced lending more for the least educatedborrowers, and that the more-affected banks also had a greater relative rise in overdue rates forthese borrowers.
THE DISTRIBUTIONAL IMPACTS OF BANK CREDIT RATIONING. 27
Figure 9. The overdue rates for loans maturing just after the floods didnot increase relatively more for those consumer groups that also had thelargest reduction in lending by the more-affected banks
Illiterate
Below Grade 10
Below Graduate
Graduate
Post Graduate
‐1
‐0.8
‐0.6
‐0.4
‐0.2
0
0.2
‐0.3 ‐0.2 ‐0.1 0
There is no relationship between changes in lending and changes in overdue rates across education groups for the most affected banks
Relativelyhigher overdue rates for more affected banks
Relatively larger decrease in lending for more affected banksRelatively larger decrease in lending for more affected banks
This figure shows the relationship between changes in lending and changes in overdue rates forthe most affected banks for loans that matured close to the flood date. On the x-axis, we plot therelative change in lending following the floods for more-affected banks (the coefficients arereported in the regressions in table 3). On the y-axis, we plot the rise in overdue rates formore-affected banks for those loans that matured just after the floods (within the first 120 daysafter the flood) relative to loans that matured just before the floods (within the last 120 daysbefore the floods). The coefficients are reported in the regressions in table 8.This figure shows that even though the more-affected banks relatively reduced lending more forless educated groups, loans to these groups that matured just after the floods did not relativelyrise. In fact, relative overdue rates fell for those consumers who did not finish school (“belowgrade 10”).

THE DISTRIBUTIONAL IMPACTS OF BANK CREDIT RATIONING. 28
Table 1. Loan, lender, and borrower characteristics
Loans in the non-flooded tehsils
Less affected banks More affected banksLoan Characteristics
Log Loan Size Outstanding 10.9 10.5Overdue 19.4% 30.0%
Lender CharacteristicsPublic Bank 13.7% 4.1%Domestic Private Bank 65.9% 73.5%Foreign Bank 18.0% 0%Islamic Bank 0.99% 0%Non-bank Financial Institution 1.4% 22.3%
Borrower CharacteristicsIlliterate 11.4% 9.7%Below Grade 10 10.0% 41.8%Below Graduate 31.2% 19.8%Graduate 32.3% 19.6%Postgraduate 15.1% 9.0%
Total Observations 194296
This table shows the loan, lender, amd borrower characteristics for loans in August 2008 (thestart of our dataset). To examine how the borrowers differed across lenders that were less ormore affected by the floods, we split our dataset by the median bank funding shock. Column 1has the less-affected banks, and column 2 has the more-affected banks.Those banks that were most affected by the floods were relatively more likely to be non-bankfinancial institutions. Since the floods affected rural areas more than urban areas, those banksthat lent more in cities were less-affected than those that lent more in rural areas. Therefore,foreign banks were barely affected by the floods. Additionally, since rural populations aregenerally less educated, the banks that were more affected by the floods lent relatively more toless educated borrowers.

THE DISTRIBUTIONAL IMPACTS OF BANK CREDIT RATIONING. 29
Table 2. The effect of the funding shock on a bank’s likelihood to lend innon-flooded areas.
Active Loan Log Loan SizePostTime*Shock -0.133∗∗∗ -0.341∗∗
(0.0320) (0.148)
Time*Shock 0.136∗∗∗ 0.204(0.0268) (0.133)
Observations 8080643 3436498Number of Borrowers 219785 219785Tehsil*Date FE Yes YesBank*Borrower*Product FE Yes YesStandard errors in parentheses∗ p < 0.10, ∗∗ p < 0.05, ∗∗∗ p < 0.01
Each regression shows that banks that incurred a larger funding shock were significantly lesslikely to lend in the non-flooded area immediately following the flood. For a 1 percent increase inthe funding shock, banks were 0.15 percentage point per quarter less likely to lend to particular aconsumer.The number of observations in column 2 is fewer than in column 1 since we omit all observationsin months where there are no loans. As a robustness check, we have also used the invertedhyperbolic sine function (an exponential function that can handle observations with a zerorealization), and the results are similar.The full regression is as follows: Ybpit =abpi + act + β1 × Timet × Funding Cost Shockb+β2×Post Timet × Funding Cost Shockb + εbpit.All standard errors are clustered at the bank level.

THE DISTRIBUTIONAL IMPACTS OF BANK CREDIT RATIONING. 30
Table 3. The effect of the funding shock on a bank’s likelihood to lend toborrowers with different education levels in the non-flooded area
Active LoanPostTime*Illiterate*Shock -0.199∗∗∗
(0.0238)
PostTime*Below Grade 10*Shock -0.188∗∗∗
(0.0637)
PostTime*Below Graduate*Shock -0.176∗∗∗
(0.0290)
PostTime*Graduate*Shock -0.143(0.137)
PostTime*Postgraduate*Shock -0.0534(0.153)
Time*Illiterate*Shock 0.195∗∗∗
(0.0224)
Time*Below Grade 10*Shock 0.166∗∗∗
(0.0524)
Time*Below Graduate*Shock 0.154∗∗∗
(0.0253)
Time*Graduate*Shock 0.166(0.135)
Time*Postgraduate*Shock 0.178(0.166)
Observations 6977123Number of Borrowers 174124Tehsil*Date FE YesBank*Borrower*Product FE YesStandard errors in parentheses∗ p < 0.10, ∗∗ p < 0.05, ∗∗∗ p < 0.01
The banks report information on each borrower’s education level. In this table, we separate oureffect by the education level of the borrower. Those individuals with the least education(illiterate, below high school, and high school graduates) were the least able to get loans from themost affected banks following the flood. The results for graduates is much noisier, but the pointestimates suggest they were more able to get loans from all banks. We omit all individuals forwhom education information is not reported. Standard errors are clustered at the level of thebank.

THE DISTRIBUTIONAL IMPACTS OF BANK CREDIT RATIONING. 31
Table 4. The effect of the funding shock on a bank’s likelihood to lend tonew and existing borrowers in the non-flooded area
Active Loan Active Loan Active Loan Active LoanPostTime*New Borr*Shock -0.0807∗ -0.378∗∗∗
(0.0420) (0.102)
PostTime*Shock -0.0444 0.232∗∗ -0.0253(0.0718) (0.0940) (0.0914)
Time*New Borr*Shock 0.0876∗∗ 0.211∗∗∗
(0.0408) (0.0790)
Time*Shock 0.0512 -0.0843 0.0575(0.0491) (0.0882) (0.108)
Observations 4281460 2596844 3798917 1201750Number of Borrowers 118168 100802 137990 37188New Borrowers X XExisting Borrowers X X XNew Relationships X X XExisting Relationships XTehsil*Date FE Yes Yes Yes YesBank*Borrower*Product FE Yes Yes Yes YesStandard errors in parentheses∗ p < 0.10, ∗∗ p < 0.05, ∗∗∗ p < 0.01
This table analyzes how lending changed to new and existing borrowers, at more and less-affectedbanks, before and after the flood. In column 1, we separately analyze whether new borrowers(those with no credit history) procured more loans following the floods at more-affected banks.In column 2, we analyze whether existing borrower-bank relationships procured more loansfollowing the floods at more-affected banks. Column 1 shows that new consumers were relativelyless likely, to a statistically significant extent, to get loans at more-affected banks following theflood. In contrast, column 2 shows that existing borrowers were not statistically significantly lessable to get loans at more-affected banks following the flood.In columns 3 and 4, we analyze whether the more-affected banks also rationed all new customersto that bank. To do so, we exclude the set of preexisting consumer-bank lending relationships (asof August 2008) and separate consumer-bank relationships into two groups: (i) thoseconsumer-bank relationships that did not have a loan relationship in August 2008 but had a loanrelationship with some other bank (as of August 2008) and (ii) those consumers that did have aloan relationship with any bank (as of August 2008). Column 3 demonstrates that the newconsumers—those with no credit history—were significantly less likely to be able to get new loansat those banks that suffered the largest funding shock. In constrast, those consumers with somecredit history equally likely to get new loans at less or more-affected banks following the flood.All standard errors are clustered at the bank level.

THE DISTRIBUTIONAL IMPACTS OF BANK CREDIT RATIONING. 32
Table 5. The effect of the funding shock on loan origination standards inthe non-flooded area: Loans originated just before and after the flood
Overdue Rate Overdue Rate Overdue Rate Overdue RateOriginated Post Flood*Bank Shock 0.0544 0.0787∗ -0.00562 0.0124
(0.0369) (0.0435) (0.0309) (0.0186)
Originated Post Flood -0.00674 0.00245(0.00539) (0.00375)
Observations 28227 28227 33840 33840Number of Borrowers 28227 28227 33840 33840Tehsil FE Yes N/A Yes N/ABank FE Yes N/A Yes N/ABank*Tehsil FE No Yes No YesTehsil*Preloan FE No Yes No YesPlacebo X XStandard errors in parentheses∗ p < 0.10, ∗∗ p < 0.05, ∗∗∗ p < 0.01
To explore why banks disproportionately reduced credit across groups, we restrict our sample toloans originated just before the floods (120 days before), and just after the floods (120 days after)in the non-flooded area. We regress whether the loan defaulted within two years of beingoriginated at more or less-affected banks before and after the flood. We include bank and tehsilfixed effects in columns 1 and 3. We include bank interacted with tehsil fixed effects and tehsilinteracted with origination period in columns 2 and 4.The full regression in column 1 is as follows:Overdue Everbpi =ab + at + β1 × Originated Post Floodbpi + β2 × Originated Post Floodbpi × Funding Shockb + εbpi.
The regression in column 2 is similar except we include more fixed effects.Columns 1 and 2 provide compelling evidence that those banks that suffered the largest fundingshock had the largest increase in default rates from the those loans originated after the flood. Weestimate that a 1 percent increase in a bank’s exposure to the flooded area caused the bank tooriginate loans that were 0.08 percentage point more likely to default in the non-flooded area.Columns 3 and 4 do the same experiment as columns 1 and 2, except we analyze loans originatedjust before and after September 2009 – exactly one year before the flood. These results show nodifference in overdue rates between less and more exposed banks following this placebo flood date.This table provides the most compelling evidence that adverse selection drove the largedisproportionate reductions in credit following the flood.All standard errors are clustered at the bank level.
THE DISTRIBUTIONAL IMPACTS OF BANK CREDIT RATIONING. 33
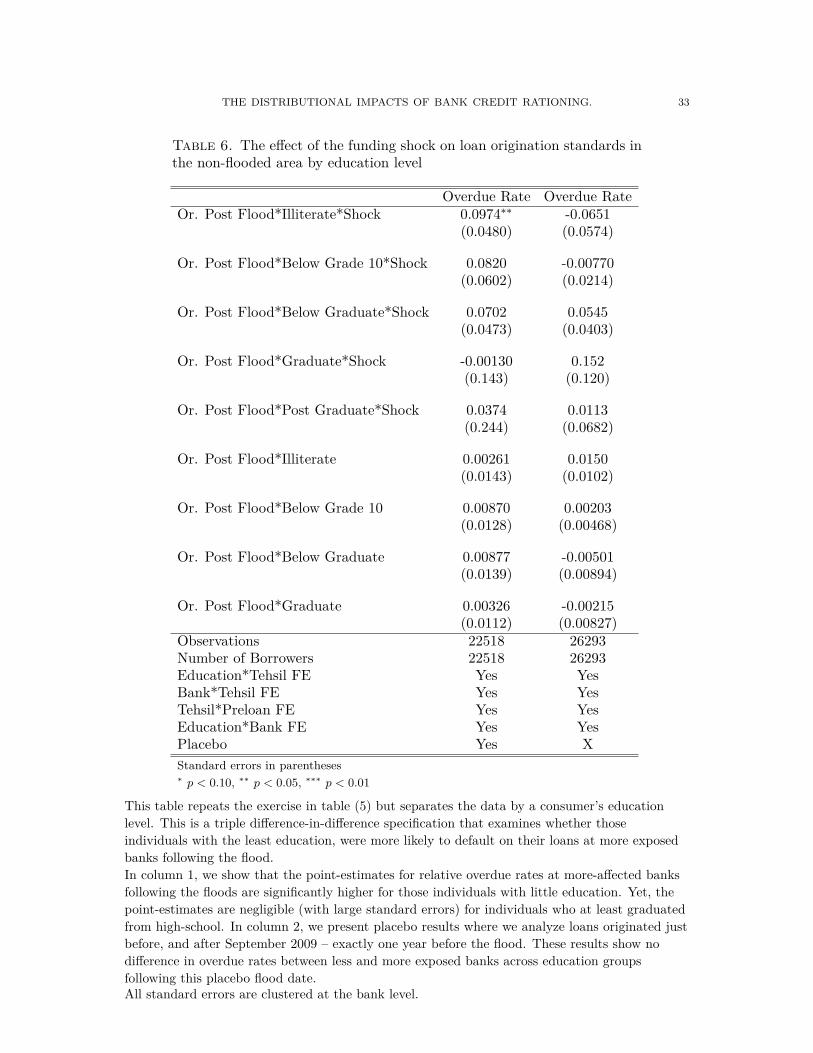
Table 6. The effect of the funding shock on loan origination standards inthe non-flooded area by education level
Overdue Rate Overdue RateOr. Post Flood*Illiterate*Shock 0.0974∗∗ -0.0651
(0.0480) (0.0574)
Or. Post Flood*Below Grade 10*Shock 0.0820 -0.00770(0.0602) (0.0214)
Or. Post Flood*Below Graduate*Shock 0.0702 0.0545(0.0473) (0.0403)
Or. Post Flood*Graduate*Shock -0.00130 0.152(0.143) (0.120)
Or. Post Flood*Post Graduate*Shock 0.0374 0.0113(0.244) (0.0682)
Or. Post Flood*Illiterate 0.00261 0.0150(0.0143) (0.0102)
Or. Post Flood*Below Grade 10 0.00870 0.00203(0.0128) (0.00468)
Or. Post Flood*Below Graduate 0.00877 -0.00501(0.0139) (0.00894)
Or. Post Flood*Graduate 0.00326 -0.00215(0.0112) (0.00827)
Observations 22518 26293Number of Borrowers 22518 26293Education*Tehsil FE Yes YesBank*Tehsil FE Yes YesTehsil*Preloan FE Yes YesEducation*Bank FE Yes YesPlacebo Yes XStandard errors in parentheses∗ p < 0.10, ∗∗ p < 0.05, ∗∗∗ p < 0.01
This table repeats the exercise in table (5) but separates the data by a consumer’s educationlevel. This is a triple difference-in-difference specification that examines whether thoseindividuals with the least education, were more likely to default on their loans at more exposedbanks following the flood.In column 1, we show that the point-estimates for relative overdue rates at more-affected banksfollowing the floods are significantly higher for those individuals with little education. Yet, thepoint-estimates are negligible (with large standard errors) for individuals who at least graduatedfrom high-school. In column 2, we present placebo results where we analyze loans originated justbefore, and after September 2009 – exactly one year before the flood. These results show nodifference in overdue rates between less and more exposed banks across education groupsfollowing this placebo flood date.All standard errors are clustered at the bank level.

THE DISTRIBUTIONAL IMPACTS OF BANK CREDIT RATIONING. 34
Table 7. The effect of the funding shock on loan default in the non-floodedarea: Loans that matured just before and after the flood
Overdue Rate Overdue Rate Overdue Rate Overdue RateMatured Post Flood*Shock -0.200 -0.0568 -0.137 0.104
(0.229) (0.104) (0.248) (0.127)
Matured Post Flood 0.000656 -0.00913(0.00731) (0.0176)
Observations 70886 70886 78909 78909Number of Borrowers 70886 70886 78909 78909Tehsil FE Yes N/A Yes N/ABank FE Yes N/A Yes N/ABank*Tehsil FE No Yes No YesTehsil*Preloan FE No Yes No YesPlacebo X XStandard errors in parentheses∗ p < 0.10, ∗∗ p < 0.05, ∗∗∗ p < 0.01
To explore if moral hazard may be driving the reduction in credit to individuals with littleeducation we exploit the maturity structure of different loans. We restrict our sample to loansthat matured just before the floods (120 days before) and just after the floods (120 days after) inthe non-flooded area. We then analyze whether those loans that matured after the floods by themore-affected banks were relatively more likely to default.We include bank and tehsil fixed effects in columns 1 and 3. We include bank interacted withtehsil fixed effects and tehsil interacted with origination period in columns 2 and 4. The fullregression in column 1 is as follows:Overdue Everbpi =ab + at + β1 × Matured Post Floodbpi + β2 × Matured Post Floodbpi × Funding Shockb + εbpi.
The regression in column 2 is similar except we include more fixed effects.Columns 1 and 2 provide compelling evidence that loans that matured just after the floods werenot more likely to default at the more-affected banks following the flood.Columns 3 and 4 do the same experiment as columns 1 and 2, except we analyze loans thatmatured just before and after September 2009 – exactly one year before the flood. These placeboresults show no difference in overdue rates between less and more-affected banks after September2009.This table provides compelling evidence that moral hazard did not drive the disproportionatereductions in credit following the flood.All standard errors are clustered at the bank level.

THE DISTRIBUTIONAL IMPACTS OF BANK CREDIT RATIONING. 35
Table 8. The effect of the funding shock on loan default rates in thenon-flooded area by education level
Overdue Rate Overdue RateMat. Post Flood*Illiterate*Shock 0.0607 0.264∗
(0.0888) (0.157)
Mat. Post Flood*Below Grade 10*Shock -0.526∗∗∗ -0.260(0.123) (0.273)
Mat. Post Flood*Below Graduate*Shock -0.0218 0.158(0.0691) (0.108)
Mat. Post Flood*Graduate*Shock 0.141 -0.224(0.315) (0.578)
Mat. Post Flood*Post Graduate*Shock -0.306 -0.468(0.265) (0.702)
Mat. Post Flood*Illiterate -0.00541 -0.0411∗∗∗
(0.0135) (0.0145)
Mat. Post Flood*Below Grade 10 -0.00184 -0.0195(0.00750) (0.0168)
Mat. Post Flood*Below Graduate 0.000363 -0.0269∗∗∗
(0.00839) (0.00725)
Mat. Post Flood*Graduate -0.00305 -0.00879(0.00584) (0.00710)
Observations 60989 70272Number of Borrowers 60989 70272Education*Tehsil FE Yes YesBank*Tehsil FE Yes YesTehsil*Preloan FE Yes YesEducation*Bank FE Yes YesPlacebo XStandard errors in parentheses∗ p < 0.10, ∗∗ p < 0.05, ∗∗∗ p < 0.01
This table repeats the exercise in the previous table but separates the data by a consumer’seducation level. This is a triple difference-in-difference specification that examines whether thoseindividuals with the least education with loans at the more affected banks that mature just afterthe floods (120 days after the flood) were relatively more likely to default on their loans.The estimates for the relative overdue rates are significantly higher for those individuals withlittle education.All standard errors are clustered at the bank level.
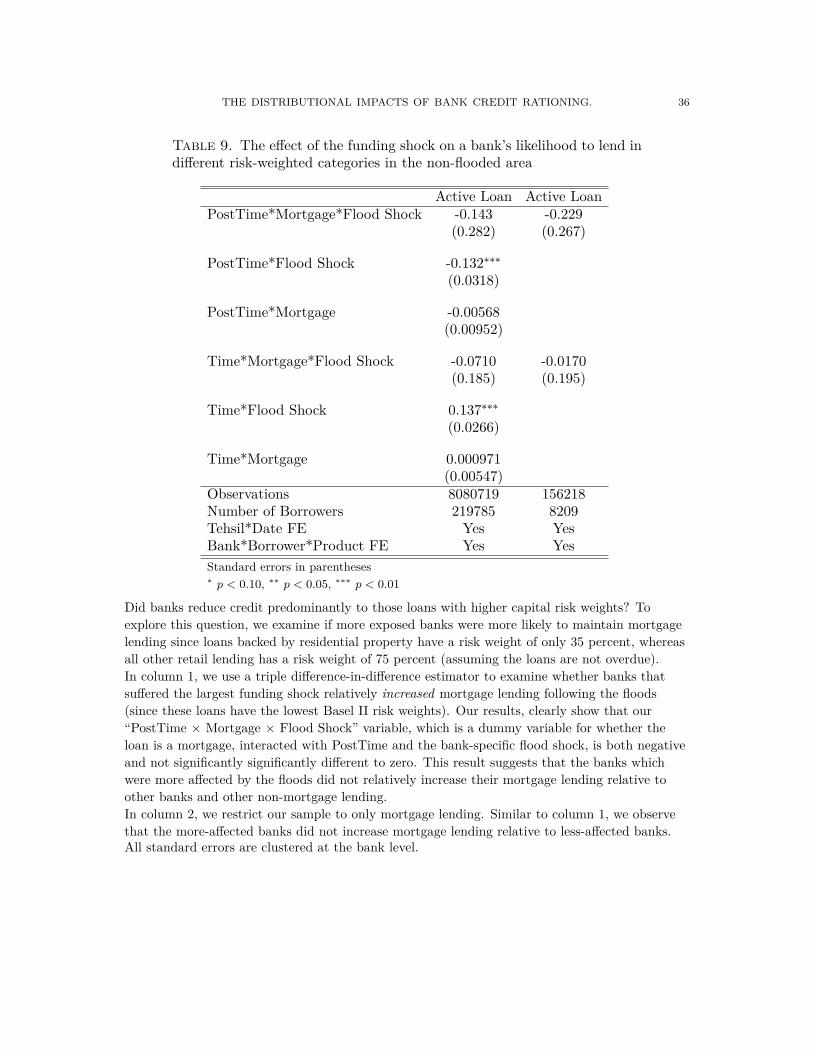
THE DISTRIBUTIONAL IMPACTS OF BANK CREDIT RATIONING. 36
Table 9. The effect of the funding shock on a bank’s likelihood to lend indifferent risk-weighted categories in the non-flooded area
Active Loan Active LoanPostTime*Mortgage*Flood Shock -0.143 -0.229
(0.282) (0.267)
PostTime*Flood Shock -0.132∗∗∗
(0.0318)
PostTime*Mortgage -0.00568(0.00952)
Time*Mortgage*Flood Shock -0.0710 -0.0170(0.185) (0.195)
Time*Flood Shock 0.137∗∗∗
(0.0266)
Time*Mortgage 0.000971(0.00547)
Observations 8080719 156218Number of Borrowers 219785 8209Tehsil*Date FE Yes YesBank*Borrower*Product FE Yes YesStandard errors in parentheses∗ p < 0.10, ∗∗ p < 0.05, ∗∗∗ p < 0.01
Did banks reduce credit predominantly to those loans with higher capital risk weights? Toexplore this question, we examine if more exposed banks were more likely to maintain mortgagelending since loans backed by residential property have a risk weight of only 35 percent, whereasall other retail lending has a risk weight of 75 percent (assuming the loans are not overdue).In column 1, we use a triple difference-in-difference estimator to examine whether banks thatsuffered the largest funding shock relatively increased mortgage lending following the floods(since these loans have the lowest Basel II risk weights). Our results, clearly show that our“PostTime × Mortgage × Flood Shock” variable, which is a dummy variable for whether theloan is a mortgage, interacted with PostTime and the bank-specific flood shock, is both negativeand not significantly significantly different to zero. This result suggests that the banks whichwere more affected by the floods did not relatively increase their mortgage lending relative toother banks and other non-mortgage lending.In column 2, we restrict our sample to only mortgage lending. Similar to column 1, we observethat the more-affected banks did not increase mortgage lending relative to less-affected banks.All standard errors are clustered at the bank level.
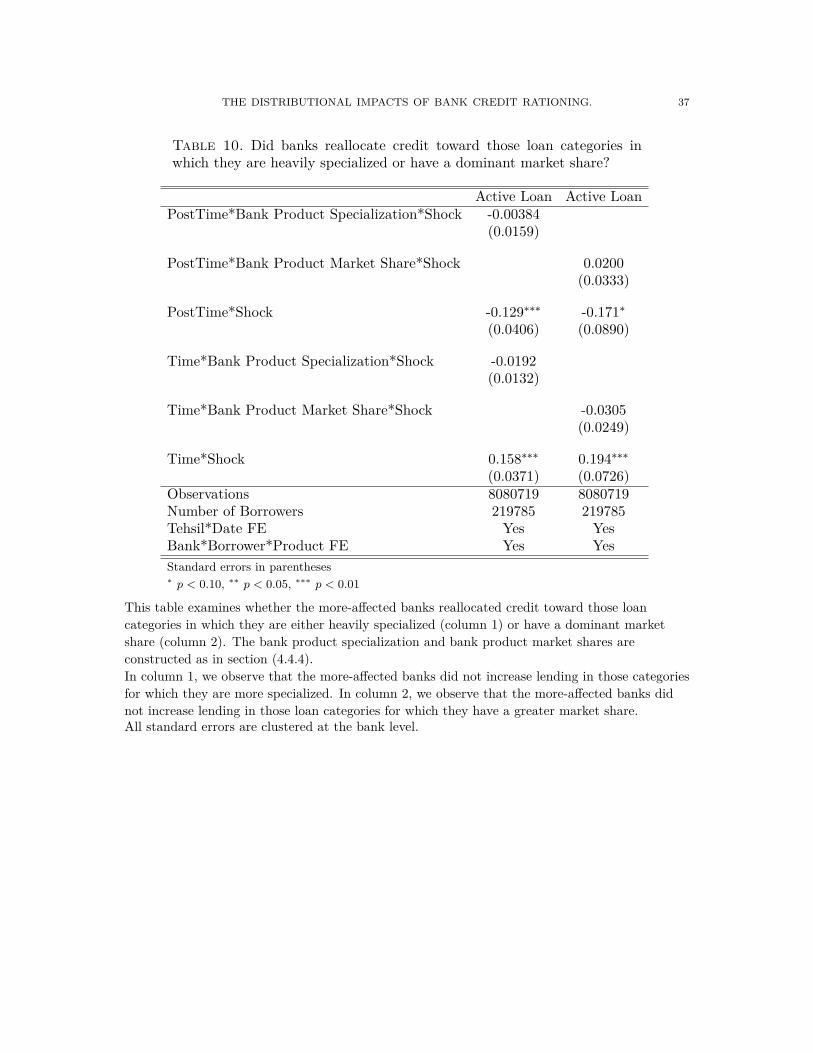
THE DISTRIBUTIONAL IMPACTS OF BANK CREDIT RATIONING. 37
Table 10. Did banks reallocate credit toward those loan categories inwhich they are heavily specialized or have a dominant market share?
Active Loan Active LoanPostTime*Bank Product Specialization*Shock -0.00384
(0.0159)
PostTime*Bank Product Market Share*Shock 0.0200(0.0333)
PostTime*Shock -0.129∗∗∗ -0.171∗
(0.0406) (0.0890)
Time*Bank Product Specialization*Shock -0.0192(0.0132)
Time*Bank Product Market Share*Shock -0.0305(0.0249)
Time*Shock 0.158∗∗∗ 0.194∗∗∗
(0.0371) (0.0726)Observations 8080719 8080719Number of Borrowers 219785 219785Tehsil*Date FE Yes YesBank*Borrower*Product FE Yes YesStandard errors in parentheses∗ p < 0.10, ∗∗ p < 0.05, ∗∗∗ p < 0.01
This table examines whether the more-affected banks reallocated credit toward those loancategories in which they are either heavily specialized (column 1) or have a dominant marketshare (column 2). The bank product specialization and bank product market shares areconstructed as in section (4.4.4).In column 1, we observe that the more-affected banks did not increase lending in those categoriesfor which they are more specialized. In column 2, we observe that the more-affected banks didnot increase lending in those loan categories for which they have a greater market share.All standard errors are clustered at the bank level.

THE DISTRIBUTIONAL IMPACTS OF BANK CREDIT RATIONING. 38
Table 11. The effect of the funding shock on a bank’s likelihood to lendin differentially affected tehsils
Active Loan Log Loan SizePostTime*Flood Shock*Tehsil Shock 0.885 -1.080
(1.425) (3.180)
PostTime*Shock -0.156∗∗∗ -0.309(0.0421) (0.197)
Time*Flood Shock*Tehsil Shock -0.382 2.313(0.935) (4.040)
Time*Shock 0.146∗∗∗ 0.142(0.0343) (0.187)
Observations 8080643 3436498Number of Borrowers 219785 219785Tehsil*Date FE Yes YesBank*Borrower*Product FE Yes YesStandard errors in parentheses∗ p < 0.10, ∗∗ p < 0.05, ∗∗∗ p < 0.01
If a single bank is (or many banks are) unable to distribute credit, one important mechanism tomitigate the reduction in credit would be other banks to increase their supply of credit – in sucha way that total credit in the tehsil does not fall. The results suggest there was no substitution ofcredit from the more-affected banks to the less-affected banks in those tehsils that were affectedthe most.In this table, we interact banks’ funding shock with the tehsil’s shock. The coefficient on“PostTime × Funding Shock × Tehsil Shock” is positive and not statistically significant. If theless-affected banks lent relatively more in the more affected tehsils, this coefficient would benegative.All standard errors are clustered at the bank level.

THE DISTRIBUTIONAL IMPACTS OF BANK CREDIT RATIONING. 39
Appendix A. Extra tables
Table 12. The effect of the floods on a bank’s likelihood to lend in flooded areas
Active Loan Log Loan SizePostTime*Shock -0.0531 -0.183
(0.0578) (0.124)
Time*Shock 0.0838∗ 0.115(0.0418) (0.103)
Observations 3892530 1757219Number of Borrowers 140188 140188Tehsil*Date FE Yes YesBank*Borrower*Product FE Yes YesStandard errors in parentheses∗ p < 0.10, ∗∗ p < 0.05, ∗∗∗ p < 0.01
These regressions consider the hypothesis that those banks that were more exposed to theflooded area increased lending in the flooded area. For instance, following the flood, you mayexpect demand for credit to increase in the flooded area due to the floods destroying homes,businesses, and livestock.These regressions show that the banks that were exposed most to the flooded area reducedlending the most in the flooded area, suggesting those banks that were more affected did notreallocate credit to the flooded area. For a 1 percent increase in the funding shock, banks were0.05 percentage point per quarter less likely to lend to particular a consumer.All standard errors are clustered at the bank level.
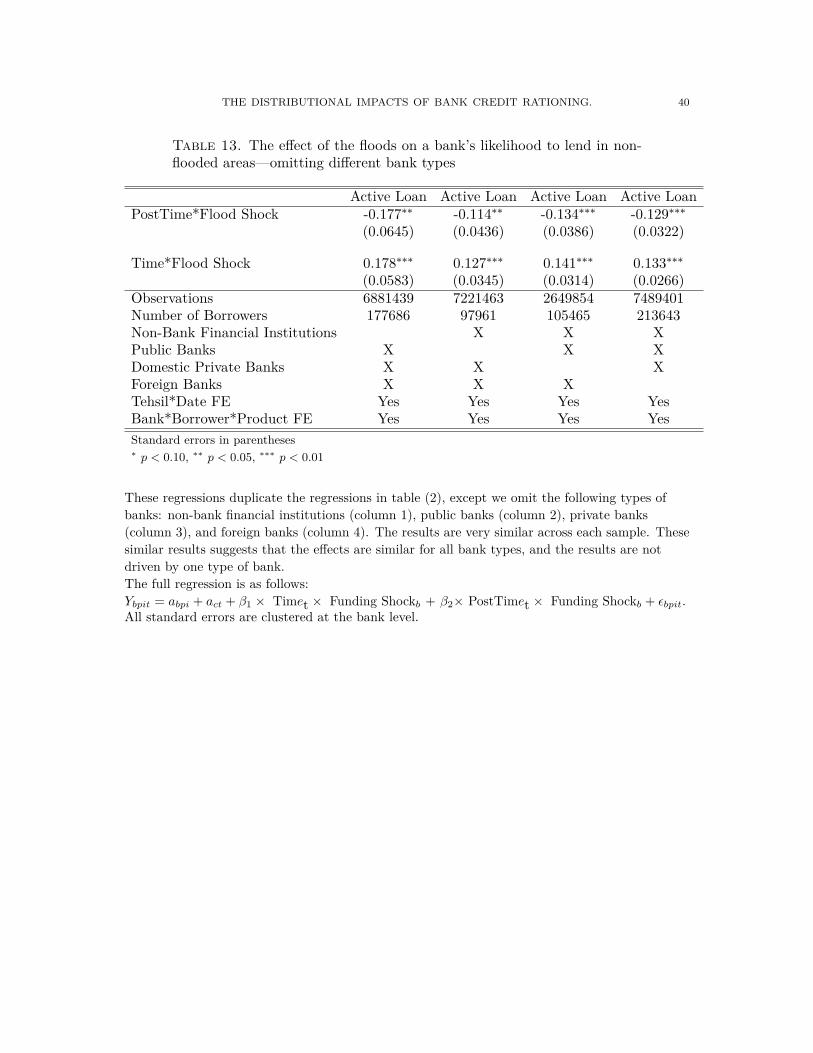
THE DISTRIBUTIONAL IMPACTS OF BANK CREDIT RATIONING. 40
Table 13. The effect of the floods on a bank’s likelihood to lend in non-flooded areas—omitting different bank types
Active Loan Active Loan Active Loan Active LoanPostTime*Flood Shock -0.177∗∗ -0.114∗∗ -0.134∗∗∗ -0.129∗∗∗
(0.0645) (0.0436) (0.0386) (0.0322)
Time*Flood Shock 0.178∗∗∗ 0.127∗∗∗ 0.141∗∗∗ 0.133∗∗∗
(0.0583) (0.0345) (0.0314) (0.0266)Observations 6881439 7221463 2649854 7489401Number of Borrowers 177686 97961 105465 213643Non-Bank Financial Institutions X X XPublic Banks X X XDomestic Private Banks X X XForeign Banks X X XTehsil*Date FE Yes Yes Yes YesBank*Borrower*Product FE Yes Yes Yes YesStandard errors in parentheses∗ p < 0.10, ∗∗ p < 0.05, ∗∗∗ p < 0.01
These regressions duplicate the regressions in table (2), except we omit the following types ofbanks: non-bank financial institutions (column 1), public banks (column 2), private banks(column 3), and foreign banks (column 4). The results are very similar across each sample. Thesesimilar results suggests that the effects are similar for all bank types, and the results are notdriven by one type of bank.The full regression is as follows:Ybpit = abpi + act + β1 × Timet × Funding Shockb + β2× PostTimet × Funding Shockb + εbpit.All standard errors are clustered at the bank level.

THE DISTRIBUTIONAL IMPACTS OF BANK CREDIT RATIONING. 41
Table 14. The effect of the funding shock on a bank’s loan products inthe non-flooded areas
Active Loan Active LoanPostTime*Agricultural Production Loan*Shock 0.0124 0.00958
(0.0718) (0.0713)
PostTime*Agricultural Development Loan*Shock -0.293∗∗∗ -0.299∗∗∗
(0.0864) (0.0860)
PostTime*Car Loan*Shock -10.32∗∗ -10.33∗∗
(4.201) (4.202)
PostTime*Credit Card Loan*Shock -0.600 -0.604(1.172) (1.174)
PostTime*Microcredit Loan*Shock -0.100 -0.105(0.0780) (0.0784)
PostTime*Mortgage Loan*Shock -0.298(0.295)
PostTime*Personal Loan*Shock -1.111 -1.125(0.798) (0.794)
PostTime*Overdraft Cash Facility*Shock -1.790∗∗∗ -1.810∗∗∗
(0.464) (0.467)Observations 7446005 7289806Number of borrowers 212489 207860Time*Product Yes YesTime*Product*Shock Yes YesPostTime*Product Yes YesTehsil*Date FE Yes YesBank*Borrower*Product FE Yes YesMinimum number of loans in August 2008 50,000 100,000Standard errors in parentheses∗ p < 0.10, ∗∗ p < 0.05, ∗∗∗ p < 0.01
This table shows that the more-affected banks reduced lending in multiple different products.The largest decreases in lending occured in agricultural lending (for capital investments), carloans, and overdraft facility. To ensure we have sufficient product observations, we restrict oursample to loan products for which there were at least 50,000 loans (column 1) or 100,000 loans(column 2) in August 2008.Each regression includes a (i) product dummy interacted with time, (ii) a product dummyinteracted with the bank shock variable and interacted with the time variable, (iii) a productdummy interacted with the PostTime variable, (iv) a tehsil dummy interacted with a datedummy, (v) a bank dummy interacted with a borrower dummy amd interacted with a productdummy.All standard errors are clustered at the bank level.