
The distribution of renewable energy policy cost amongst households in Germany – and the role of...
12
www.oeko.de The distribution of renewable energy policy cost amongst households in Germany – and the role of energy efficiency policies • Johanna Cludius, Hannah Förster, Katja Hünecke, Charlotte Loreck, Katja Schumacher, Tanja Kenkmann (Oeko-Institut) • Martin Beznoska (FU Berlin) • Barbara Schlomann (ISI Fraunhofer) ECEEE, Panel 2 Hyères, 04/06/2015
-
Upload
oeko-institut -
Category
Science
-
view
57 -
download
1
Transcript of The distribution of renewable energy policy cost amongst households in Germany – and the role of...
ww
w.o
ek
o.d
e
The distribution of renewable energy policy cost
amongst households in Germany – and the role
of energy efficiency policies
• Johanna Cludius, Hannah Förster, Katja Hünecke, Charlotte Loreck, Katja Schumacher, Tanja Kenkmann (Oeko-Institut)
• Martin Beznoska (FU Berlin)
• Barbara Schlomann (ISI Fraunhofer)
ECEEE, Panel 2
Hyères, 04/06/2015
Hinweis zum Bildtausch:
Bild mit der Maus markieren, dann
rechte Maustaste drücken und „Bild
ändern“ wählen. Neues Bild auf dem
Laufwerk auswählen und einfügen.
Es wird nun an der Stelle des
vorhandenen Bildes eingefügt und
kann/muss dann noch etwas in der
Größe verändert werden.

2
ww
w.o
ek
o.d
e
The distribution of renewable energy policy cost amongst households in Germany –
and the role of energy efficiency policies│Johanna Cludius | ECEEE | Hyères,
04/06/2015

3
ww
w.o
ek
o.d
e
Short summary
• Key idea
• Investigate / confirm regressive effect of electricity price rises (e.g.
through the EEG)
• Compare it to other policies that are also part of the Energiewende
in particular expected effects of the energy efficiency portfolio
• Key insights
• Higher electricity prices indeed regressive, but efficiency policies
have the potential to compensate
• Highly depedent on who carries them out
• Challenges related to quantifying monetary costs and benefits of
policies
The distribution of renewable energy policy cost amongst households in Germany –
and the role of energy efficiency policies│Johanna Cludius | ECEEE | Hyères,
04/06/2015
4
ww
w.o
ek
o.d
e
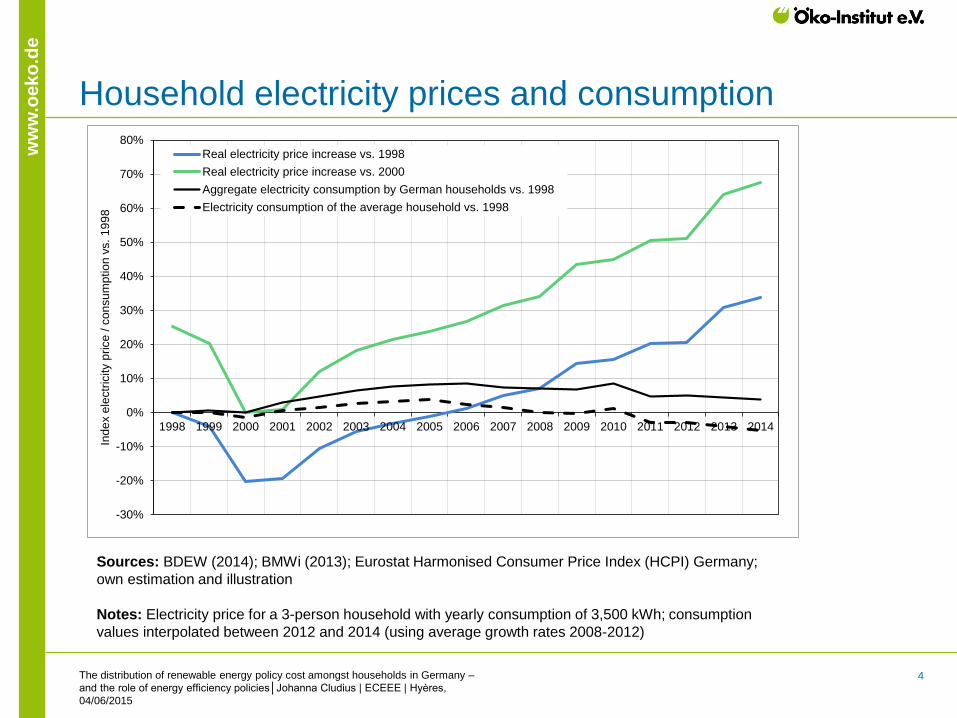
Household electricity prices and consumption
The distribution of renewable energy policy cost amongst households in Germany –
and the role of energy efficiency policies│Johanna Cludius | ECEEE | Hyères,
04/06/2015
Hinweis zu Einzügen und
Bulletpoints:
Um auf einer neuen Folie die richtig
formatierten Bulletpoints zu erhalten,
bitte auf die Schaltfläche Einzüge
rechts/links klicken (nicht auf die
Schaltfläche Bullets!). So kann auf
die Mastereinstellungen zugegriffen
werden.
Im Notfall (wenn z.B. manuelle
Einzüge benutzt wurden oder
Fremdtext in die Folie mit falschen
Formaten kopiert wurde) die Folie
zurücksetzen und das Folienlayout
„Titel + Inhalt“ zuweisen.
Sources: BDEW (2014); BMWi (2013); Eurostat Harmonised Consumer Price Index (HCPI) Germany;
own estimation and illustration
Notes: Electricity price for a 3-person household with yearly consumption of 3,500 kWh; consumption
values interpolated between 2012 and 2014 (using average growth rates 2008-2012)
-30%
-20%
-10%
0%
10%
20%
30%
40%
50%
60%
70%
80%
1998 1999 2000 2001 2002 2003 2004 2005 2006 2007 2008 2009 2010 2011 2012 2013 2014
Ind
ex e
lectr
icity p
rice
/ c
on
su
mp
tio
n v
s.
19
98
Real electricity price increase vs. 1998
Real electricity price increase vs. 2000
Aggregate electricity consumption by German households vs. 1998
Electricity consumption of the average household vs. 1998

5
ww
w.o
ek
o.d
e
Household electricity price components
The distribution of renewable energy policy cost amongst households in Germany –
and the role of energy efficiency policies│Johanna Cludius | ECEEE | Hyères,
04/06/2015
Hinweis zu Einzügen und
Bulletpoints:
Um auf einer neuen Folie die richtig
formatierten Bulletpoints zu erhalten,
bitte auf die Schaltfläche Einzüge
rechts/links klicken (nicht auf die
Schaltfläche Bullets!). So kann auf
die Mastereinstellungen zugegriffen
werden.
Im Notfall (wenn z.B. manuelle
Einzüge benutzt wurden oder
Fremdtext in die Folie mit falschen
Formaten kopiert wurde) die Folie
zurücksetzen und das Folienlayout
„Titel + Inhalt“ zuweisen.
Sources: Öko-Institut (2012); BDEW (2014); own illustration
Notes: Electricity price for a 3-person household with yearly consumption of 3,500 kWh
0
5
10
15
20
25
30
35
1998 1999 2000 2001 2002 2003 2004 2005 2006 2007 2008 2009 2010 2011 2012 2013 2014
ct
/ k
Wh
Other charges and taxes
EEG surcharge
Generation, transmission, distribution
Sum in constant 1998 prices

6
ww
w.o
ek
o.d
e
Impact of the EEG surcharge on German households
by income group (new OECD equivalence scale)
The distribution of renewable energy policy cost amongst households in Germany –
and the role of energy efficiency policies│Johanna Cludius | ECEEE | Hyères,
04/06/2015
Hinweis zu Einzügen und
Bulletpoints:
Um auf einer neuen Folie die richtig
formatierten Bulletpoints zu erhalten,
bitte auf die Schaltfläche Einzüge
rechts/links klicken (nicht auf die
Schaltfläche Bullets!). So kann auf
die Mastereinstellungen zugegriffen
werden.
Im Notfall (wenn z.B. manuelle
Einzüge benutzt wurden oder
Fremdtext in die Folie mit falschen
Formaten kopiert wurde) die Folie
zurücksetzen und das Folienlayout
„Titel + Inhalt“ zuweisen.
Source: Research Data Centre (FDZ) of the Federal Statistical Office Germany and the Statistical
Offices of the Laender: German Income and Expenditure Survey (EVS) 2008 (80 % scientific use file)
extrapolated to 2014; own estimation and illustration
21
1415
1718
2021
2122
2425
27
0
5
10
15
20
25
30
0.0%
0.2%
0.4%
0.6%
0.8%
1.0%
1.2%
1.4%
Average lowest5%
1 2 3 4 5 6 7 8 9 10
% H
ou
se
ho
ld n
et in
co
me
Equivalent income deciles
€/month % of household net income

7
ww
w.o
ek
o.d
e
The other side of the coin: Energy saving and
efficiency policies (in 2020)
The distribution of renewable energy policy cost amongst households in Germany –
and the role of energy efficiency policies│Johanna Cludius | ECEEE | Hyères,
04/06/2015
Category Policy instrument
Energy saving
potential
(TWh)
Annualised
investment
cost (M€)
Energy saving legislation (EnEV 2013)
KfW Energy-efficient renovations
KfW Energy-efficient construction -37.2 4 144
EU Ecodesign
EU Labelling
Smart Meter -19.2 1 044
Existing check
Extension -0.2 4
Further development of Energy saving legislation
Tax incentives for energy-efficient renovations
Quality assurance and optimising of energy consulting
Heating check
National energy-efficiency label for old heating installations -14.4 2 110
Further development of national Top Runner Initiative
Competitive tenders (electricity) -6.1 314
Existing policies
buildings
Existing policies
electricity /
appliances
Electricity Saving
Check (low-income
households)
NAPE policies
buildings
NAPE policies
electricity /
appliances
Sources: BMWi 2014; Fraunhofer ISI/IFAM, Ifeu, Prognos & Ringel 2014; Fraunhofer ISI, Öko-Institut,
Ecofys, IREES (2015, ongoing project)

8
ww
w.o
ek
o.d
e
Assumptions for analysis of annualised investment
costs and saved energy expenditures
• Building measures
• affect owner-occupiers and renters equally, i.e. annualised costs fully
passed forward to tenants
• Energy saving acc. to actual consumption; investment costs acc. to sqm
of dwelling
• Appliances
• Same relative reduction for all households
• Investment costs are distributed acc. to the electricity saved (i.e. each
kWh saved requires the same amount of investment)
• Electricity Saving Check
• Households that receive social transfers above a threshold value of 100
€/month for general transfers (“Grundsicherung”) and 50 €/month for
transfers relating to living costs (“Wohngeld”)
The distribution of renewable energy policy cost amongst households in Germany –
and the role of energy efficiency policies│Johanna Cludius | ECEEE | Hyères,
04/06/2015

9
ww
w.o
ek
o.d
e
Net effect of efficiency policies in 2020 for households
of different income groups (% of household income)
The distribution of renewable energy policy cost amongst households in Germany –
and the role of energy efficiency policies│Johanna Cludius | ECEEE | Hyères,
04/06/2015
Source: Research Data Centre (FDZ) of the Federal Statistical Office Germany and the Statistical
Offices of the Laender: German Income and Expenditure Survey (EVS) 2008 (80 % scientific use file)
extrapolated to 2014; own estimation
Note: Negative values indicate net savings
Lowest 5 % 686 855 0.03 -0.73 -0.05 0.12 -0.24 -0.87
1st decile 812 1 043 0.02 -0.60 -0.04 0.10 -0.20 -0.72
2nd decile 1 193 1 329 0.00 -0.45 -0.01 0.07 -0.14 -0.53
3rd decile 1 441 1 552 -0.01 -0.39 0.00 0.06 -0.13 -0.47
4th decile 1 659 1 771 -0.01 -0.34 0.00 0.05 -0.11 -0.41
5th decile 1 883 1 994 -0.01 -0.31 0.00 0.05 -0.10 -0.37
6th decile 2 116 2 244 -0.01 -0.30 0.00 0.04 -0.10 -0.36
7th decile 2 396 2 564 0.00 -0.27 0.00 0.04 -0.09 -0.31
8th decile 2 773 3 021 -0.01 -0.24 0.00 0.04 -0.08 -0.28
9th decile 3 386 3 854 0.00 -0.20 0.00 0.03 -0.07 -0.24
10th decile 5 385 . 0.00 -0.14 0.00 0.02 -0.05 -0.17
Average 2 252 . 0.00 -0.27 0.00 0.04 -0.09 -0.32
Deciles of
household net
equivalent
income
Household net
equivalent incomeTotal effect (investment - savings)
TotalDecile
average
Highest
income in
decile
Existing
policies
buildings
Existing
policies
elec. / appl.
Electricity
Saving
Check
New policies
buildings
New policies
elec. / appl.
€/month % of household net income

10
ww
w.o
ek
o.d
e
Effect of the EEG surcharge vs. efficiency policies
The distribution of renewable energy policy cost amongst households in Germany –
and the role of energy efficiency policies│Johanna Cludius | ECEEE | Hyères,
04/06/2015
Source: Research Data Centre (FDZ) of the Federal Statistical Office Germany and the Statistical
Offices of the Laender: German Income and Expenditure Survey (EVS) 2008 (80 % scientific use file)
extrapolated to 2014; own estimation and illustration
Note: Negative values indicate net savings
-1.0%
-0.5%
0.0%
0.5%
1.0%
1.5%
Average lowest5%
1 2 3 4 5 6 7 8 9 10
% H
ou
se
ho
ld n
et
inc
om
e
Equivalent income deciles
Burden EEG Relief EE policies Net effect
11
ww
w.o
ek
o.d
e
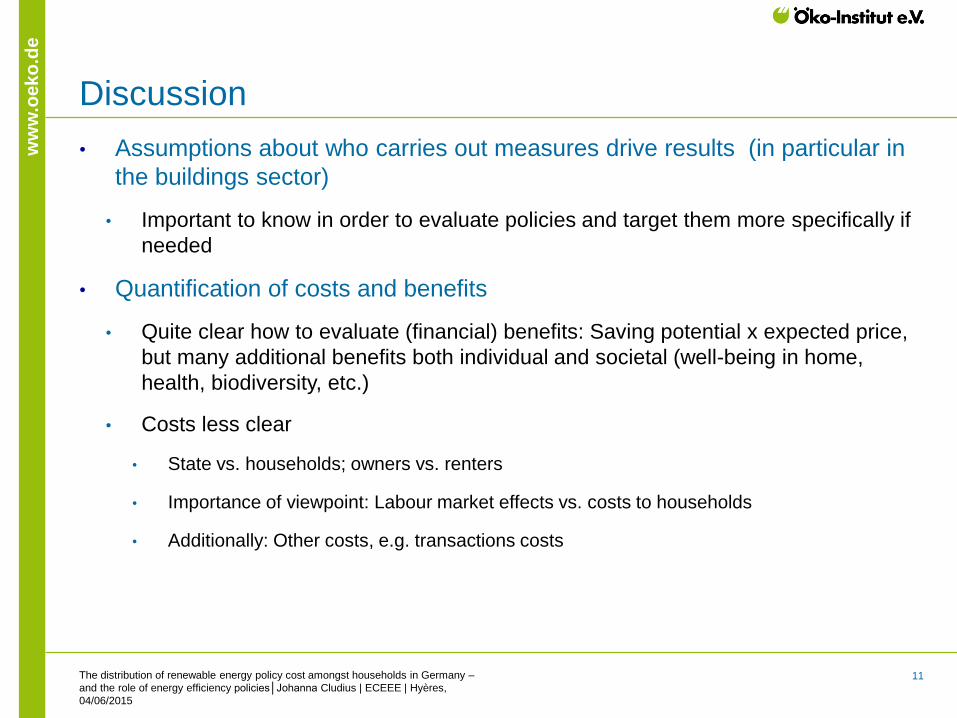
Discussion
• Assumptions about who carries out measures drive results (in particular in
the buildings sector)
• Important to know in order to evaluate policies and target them more specifically if
needed
• Quantification of costs and benefits
• Quite clear how to evaluate (financial) benefits: Saving potential x expected price,
but many additional benefits both individual and societal (well-being in home,
health, biodiversity, etc.)
• Costs less clear
• State vs. households; owners vs. renters
• Importance of viewpoint: Labour market effects vs. costs to households
• Additionally: Other costs, e.g. transactions costs
The distribution of renewable energy policy cost amongst households in Germany –
and the role of energy efficiency policies│Johanna Cludius | ECEEE | Hyères,
04/06/2015
ww
w.o
ek
o.d
e
Thank you for your attention!
Johanna Cludius
Researcher, Energy and Climate Division
Öko-Institut e.V.
Schicklerstr. 5-7
DE - 10179 Berlin
Email: [email protected]
Phone: +49-(0)30 - 40 50 85 – 375
Facsimile: +49-(0)30 - 40 50 85 – 388
www.oeko.de


![Energy Saving Potential From Indian Households From Appliance Efficiency 108A01[1]](https://static.fdocuments.us/doc/165x107/54e6c3b74a795981528b4706/energy-saving-potential-from-indian-households-from-appliance-efficiency-108a011.jpg)
