
The Disruptive Automotive Landscapekyautoindustry.com/AutoVision/docs/presentations/Jose… · ·...
44
AutoVision Conference – August 2017 The Disruptive Automotive Landscape Production Outlook, Analysis, & Factors Shaping the Industry Kentucky Automotive Industry Association AutoVision 2017 August 2017 Joseph McCabe, President 855.734.4590 ext. 1001
Transcript of The Disruptive Automotive Landscapekyautoindustry.com/AutoVision/docs/presentations/Jose… · ·...

AutoVision Conference – August 2017
The Disruptive Automotive LandscapeProduction Outlook, Analysis, & Factors Shaping the Industry
Kentucky Automotive Industry AssociationAutoVision 2017
August 2017
Joseph McCabe, President855.734.4590 ext. 1001

AutoVision Conference – August 2017
Competing in a Disruptive Global Market• The automotive community is focused on improving competitiveness by
balancing consumer needs with regulations, safety, performance, economic conditions, and affordability.
• The VMs are placing more reliance on the supply chain to bring innovative solutions to the market in order to fit these needs and stay ahead of the curve.
• The changing automotive landscape is creating new customers and new competitors, adding a level of urgency for innovation.
• Innovation combines an understanding of the market needs while investing in the right products, processes, and technologies.
• AutoForecast Solutions understands not only the need for innovation, but the volatility of the marketplace and takes the key drivers, enablers, and constraints into consideration when generating the market outlook.
2
Market Outlook
Economic Recovery
Financial Markets
Gov’t Investment
Auto Supply Chain
Technology Price Effects
Ownership & Operating
Cost
Market Drivers, Enablers & Constraints
Minimize risk while maximizing opportunity by 1) Defending core operations and 2) identifying areas of growth
AutoVision Conference – August 2017
Elements of Disruption
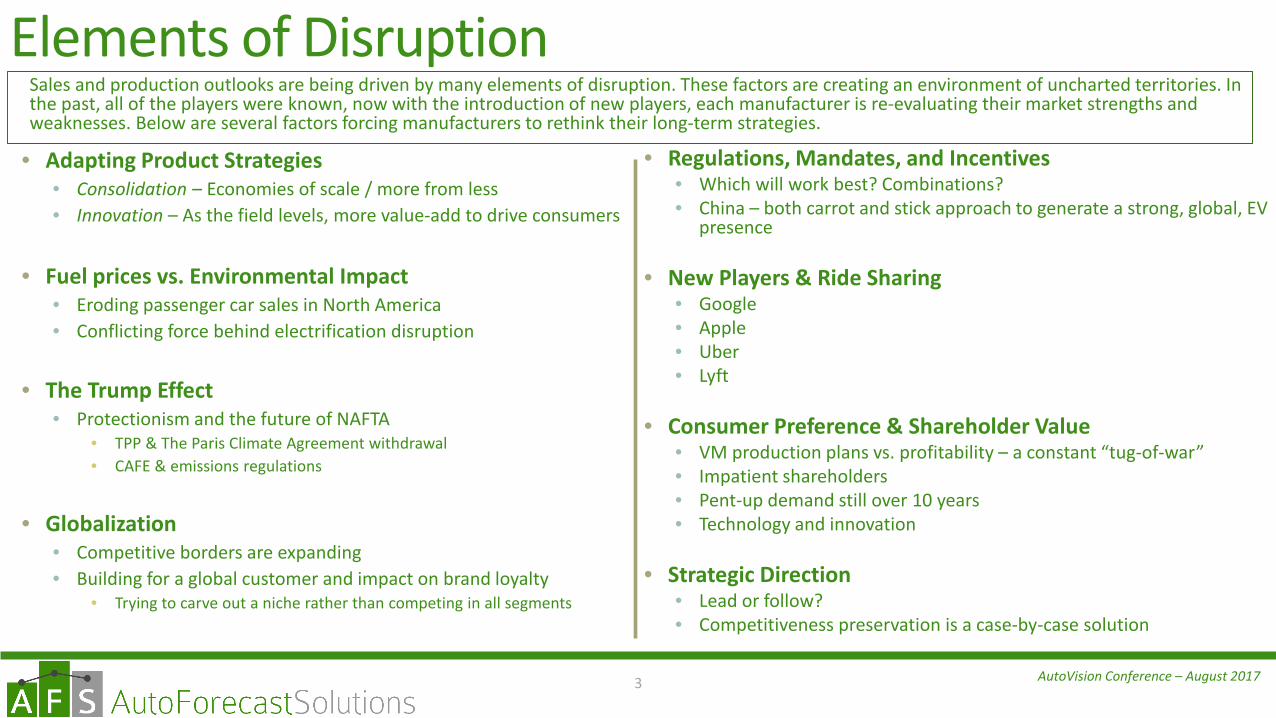
• Adapting Product Strategies• Consolidation – Economies of scale / more from less• Innovation – As the field levels, more value-add to drive consumers
• Fuel prices vs. Environmental Impact• Eroding passenger car sales in North America• Conflicting force behind electrification disruption
• The Trump Effect• Protectionism and the future of NAFTA
• TPP & The Paris Climate Agreement withdrawal• CAFE & emissions regulations
• Globalization• Competitive borders are expanding• Building for a global customer and impact on brand loyalty
• Trying to carve out a niche rather than competing in all segments
3
• Regulations, Mandates, and Incentives• Which will work best? Combinations?• China – both carrot and stick approach to generate a strong, global, EV
presence
• New Players & Ride Sharing• Google• Apple• Uber• Lyft
• Consumer Preference & Shareholder Value• VM production plans vs. profitability – a constant “tug-of-war”• Impatient shareholders• Pent-up demand still over 10 years• Technology and innovation
• Strategic Direction• Lead or follow?• Competitiveness preservation is a case-by-case solution
Sales and production outlooks are being driven by many elements of disruption. These factors are creating an environment of uncharted territories. In the past, all of the players were known, now with the introduction of new players, each manufacturer is re-evaluating their market strengths and weaknesses. Below are several factors forcing manufacturers to rethink their long-term strategies.
AutoVision Conference – August 2017
Disruptive Consumer Views: Brand & Domestic Production Loyalty
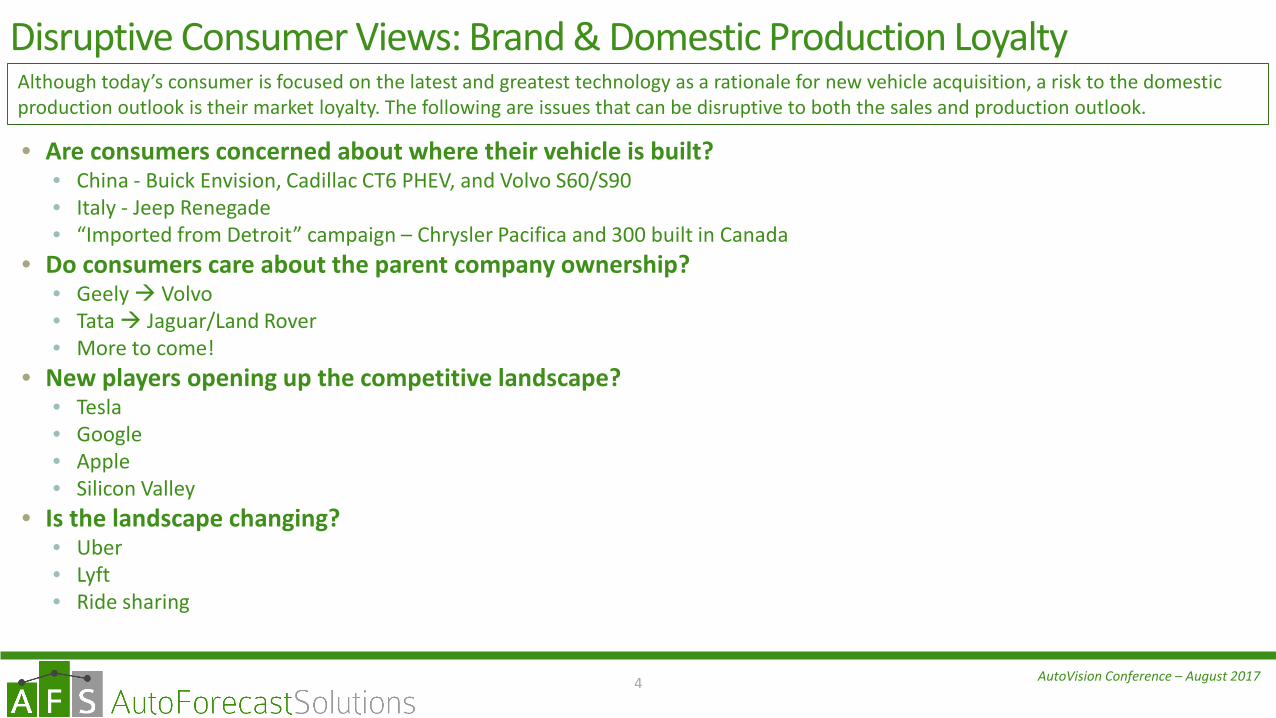
• Are consumers concerned about where their vehicle is built?• China - Buick Envision, Cadillac CT6 PHEV, and Volvo S60/S90• Italy - Jeep Renegade• “Imported from Detroit” campaign – Chrysler Pacifica and 300 built in Canada
• Do consumers care about the parent company ownership?• Geely Volvo• Tata Jaguar/Land Rover• More to come!
• New players opening up the competitive landscape?• Tesla• Google• Apple• Silicon Valley
• Is the landscape changing?• Uber• Lyft• Ride sharing
4
Although today’s consumer is focused on the latest and greatest technology as a rationale for new vehicle acquisition, a risk to the domestic production outlook is their market loyalty. The following are issues that can be disruptive to both the sales and production outlook.

AutoVision Conference – August 20175

AutoVision Conference – August 2017
-2 2 6 10 14 18 22 26
ASIA-PACIFIC
EASTERN EUROPE
WESTERN EUROPE
NORTH AMERICA
SOUTH AMERICA
MIDDLE-EAST/AFRICA
22.02.2
1.46.7
-0.51.2
Regional Volume Growth (2010 – 2024)Millions
Global Light Vehicle Production Outlook
70.059.9
97.3107.6
0
20
40
60
80
100
Mill
ions
GLOBAL LIGHT VEHICLE PRODUCTION
Region 2017 Fct (Mil) 2024 Fct (Mil) 2024 VS. 2016 Growth 2024 vs. 2010 CAGR 2024 vs. 2016 CAGR
AP 51.47 59.00 19.65% 3.40% 2.27%
EE 7.49 8.20 19.75% 2.26% 2.28%
WE 15.14 14.75 0.10% 0.71% 0.01%
NA 17.57 18.60 4.58% 3.22% 0.56%
SA 3.10 3.65 33.26% -0.93% 3.65%
ME/A 2.58 3.40 36.62% 3.33% 3.98%
TOTAL 97.33 107.60 14.58% 2.66% 1.72%
6
Source: AutoForecast Solutions – August 2017

AutoVision Conference – August 2017
Global Segment Growth Analysis
7
0 3 6 9 12
CARPickup
CUVSUVVan
Minivan
Millions
2010 - 201619.3 Million Units Volume Growth
0%20%40%60%80%
100%
0 3 6 9 12
CAR
Pickup
CUV
SUV
Van
Millions
0%20%40%60%
2016 - 202413.7 Million Units Volume Growth
Source: AutoForecast Solutions – August 2017

AutoVision Conference – August 2017
0 2 4 6 8 10 12
Renault/NissanVolkswagen
Toyota MotorHyundai Motor
General MotorsFord Motor
FCAHonda Motor
Groupe PSADaimler
BMWGeely Group
SAIC-GM-WulingChangan AutoMazda MotorMaruti Suzuki
TataSuzuki Motor
Beijing Automotive GroupGreat Wall Automobile
Dongfeng MotorsSubaru
MILLION UNITS OF GLOBAL PRODUCTIONRANKING BASED ON 2024 POSITION
2016 2024
22 Brand Owners in 2024 over 1 Million units of Annual Production• 90% of total global output
Top 10 brand owners maintain 71% of the global automotive production volumes• Renault/Nissan moves from 3rd (2016) to the lead by
2024 as a result of the Mitsubishi acquisition
Recent Inductees as of 2016• Beijing Automotive Group• Great Wall Automobile• Geely Group (Leveraging Volvo purchase)
New Players in “Club” by 2024• Tata• Dongfeng Motors• Subaru
8
“1 Million Unit Club” Brand Owner Analysis (2016 vs. 2024)
Source: AutoForecast Solutions – August 2017

AutoVision Conference – August 2017
0
200,000
400,000
600,000
800,000
1,000,000
1,200,000
1,400,000
Volume Growth (2016 v. 2024)
> 200K units/yr.
9
Growth Markets
0%
20%
40%
60%
80%
100%
120%
% Growth Exceeding Global Growth Rate*Global production volume growth 14.6% from 2016 to 2024
*100K unit minimum volume growth (2016 vs. 2024)
Source: AutoForecast Solutions – August 2017
0
1
2
3
4
5
6
7
8
CHINA
Mill
ions
Volume Growth (2016 v. 2024)
CHINA

AutoVision Conference – August 2017
China
19%
14%
5%9%15%
7%
9%
10%
8%4%
23%
11%
6%
9%10%
10%
9%
8%
6%
8%
Volkswagen22%
Changan11%
Geely9%
Hyundai9%
Wuling9%
Buick9%
Honda9%
Toyota8%
Dongfeng7%
Ford7%
TOP 10 PRODUCTION BY BRAND IN CHINA
10
2010
2016
2024
16.8 17.218.2
20.922.7
24.0
27.128.3
30.332.1
33.3 33.9 34.1 34.3 34.4
0
5
10
15
20
25
30
35
Mill
ions
China Vehicle Production
Source: AutoForecast Solutions – August 2017
105% GROWTH

AutoVision Conference – August 201711

AutoVision Conference – August 2017
Summary• AFS is forecasting the North America production footprint to stabilize and soften in the short term, with room to improve post 2018.
• Fuel Prices & Consumer Preferences will continue to push the vehicle segment mix towards trucks, SUVs, and CUVs, at the expense of passenger cars. The desire for the latest innovations will support high turnover cadence activity in leasing and new vehicle acquisitions
• More Foreign Investment for import substitution, more investment as an Export Hub, and New Energy Players entering the market will offset softening domestic sales
• Low interest rates and easy access to funding, will supports an increase in leasing activity. This trend will continue, with new vehicle replacement on a faster pace supporting consistent sales and production
It is time for suppliers to understand the disruptive forces shaping the industry and double-down on investment in these areas with all of the stakeholders
12
15.10 12.61
8.6
11.93 13.1315.43 16.16 17.00 17.48 17.79
17.57 17.6517.99 18.21 18.30 18.43 18.58 18.60
0
10
20
Mill
ions
NORTH AMERICA VEHICLE PRODUCTION
Source: AutoForecast Solutions – August 2017
AutoVision Conference – August 2017
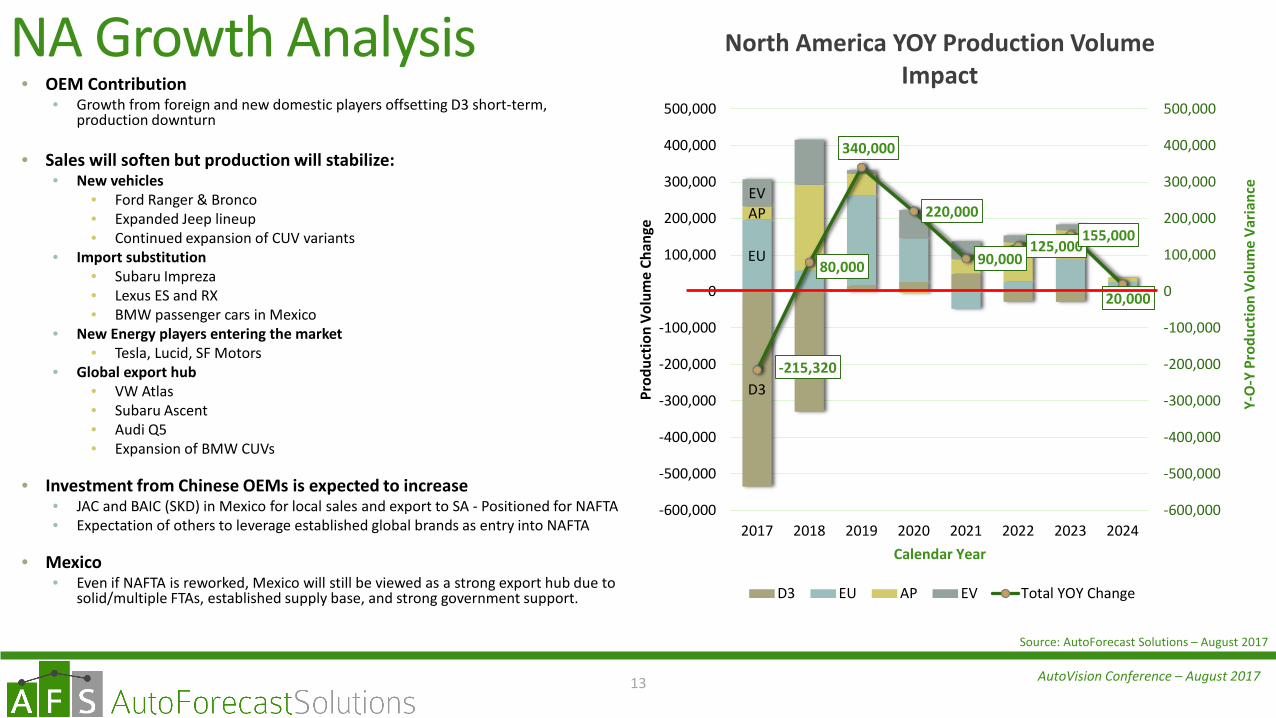
NA Growth Analysis• OEM Contribution
• Growth from foreign and new domestic players offsetting D3 short-term, production downturn
• Sales will soften but production will stabilize:• New vehicles
• Ford Ranger & Bronco• Expanded Jeep lineup• Continued expansion of CUV variants
• Import substitution• Subaru Impreza• Lexus ES and RX• BMW passenger cars in Mexico
• New Energy players entering the market• Tesla, Lucid, SF Motors
• Global export hub• VW Atlas• Subaru Ascent• Audi Q5• Expansion of BMW CUVs
• Investment from Chinese OEMs is expected to increase• JAC and BAIC (SKD) in Mexico for local sales and export to SA - Positioned for NAFTA• Expectation of others to leverage established global brands as entry into NAFTA
• Mexico• Even if NAFTA is reworked, Mexico will still be viewed as a strong export hub due to
solid/multiple FTAs, established supply base, and strong government support.
13
D3
EU
APEV
-215,320
80,000
340,000
220,000
90,000125,000
155,000
20,000
-600,000
-500,000
-400,000
-300,000
-200,000
-100,000
0
100,000
200,000
300,000
400,000
500,000
-600,000
-500,000
-400,000
-300,000
-200,000
-100,000
0
100,000
200,000
300,000
400,000
500,000
2017 2018 2019 2020 2021 2022 2023 2024
Y-O
-Y P
rodu
ctio
n Vo
lum
e Va
rianc
e
Prod
uctio
n Vo
lum
e Ch
ange
Calendar Year
North America YOY Production Volume Impact
D3 EU AP EV Total YOY Change
Source: AutoForecast Solutions – August 2017

AutoVision Conference – August 2017
43%
5%24%
8%
20% 39%
3%31%
6%
21% 33%
2%
38%
6%
21%
NORTH AMERICA SEGMENT MIX Factors Driving Investment & Assembly Decisions• Fuel Prices vs. Fuel Economy• Funding Access• Consumer Confidence• Technology / Safety• Market Stability• Employment• Pent-Up Demand• Regulation• Government Involvement
14
North America – The Changing Product Mix
2010
2016
2024
Cars
Minivan
Trucks/Vans
SUV
CUV
Source: AutoForecast Solutions – August 2017

AutoVision Conference – August 2017
Short-Term Production Outlook (2017)• Year-over-year (YOY) production actuals through June 2017
are nearly flat
• AFS is projecting a softening in the second half of 2017 for most VMs, especially in the passenger car segments as a result of low fuel prices, high inventory adjustment, and YTD sales decline corrections
• General Motors is predicted to have the largest decline with scheduled plant shutdowns and reductions in passenger car output. The first half (H1) increase is a result of loading inventory in anticipation of second half reductions• NOTE: AM General production ends in Q4 2017
• For FCA, the Jeep Cherokee plant move and Jeep Compass changeover resulted in a first half (H1) reduction with an anticipation of an improved second half (H2)
• Tesla has the largest percentage increase as a result of the Model 3 introduction, even with the conservative production view of AFS
• A new Jetta (April 2017) and the Audi Q5 (late 2016) global source introduction in Mexico vaults VW to the lead of 2017 production increases.
15
Production Comparison (% Change over time)2017 over 2016
VM H1 YOY ChangeActuals
H2 YOY ChangeForecast
Forecast 2017 vs. 2016
AM General 6.22% -57.85% -26.60%BMW -1.16% -1.70% -1.42%Daimler -7.56% 1.65% -3.19%FCA -11.54% -3.62% -7.69%Ford Motor -2.18% -4.59% -3.27%General Motors 1.53% -16.88% -8.19%Honda Motor -6.44% -3.09% -4.85%Hyundai Motor 17.06% 14.65% 15.76%Mazda Motor -0.33% -13.18% -6.61%Renault/Nissan -1.81% -8.50% -5.09%Subaru 22.86% 14.60% 18.69%Tesla 44.63% 119.97% 88.58%Toyota Motor -0.05% 5.53% 2.68%Volkswagen 36.52% 44.65% 40.66%
TOTAL -0.42% -2.51% -1.45%Source: AutoForecast Solutions – August 2017
AutoVision Conference – August 2017
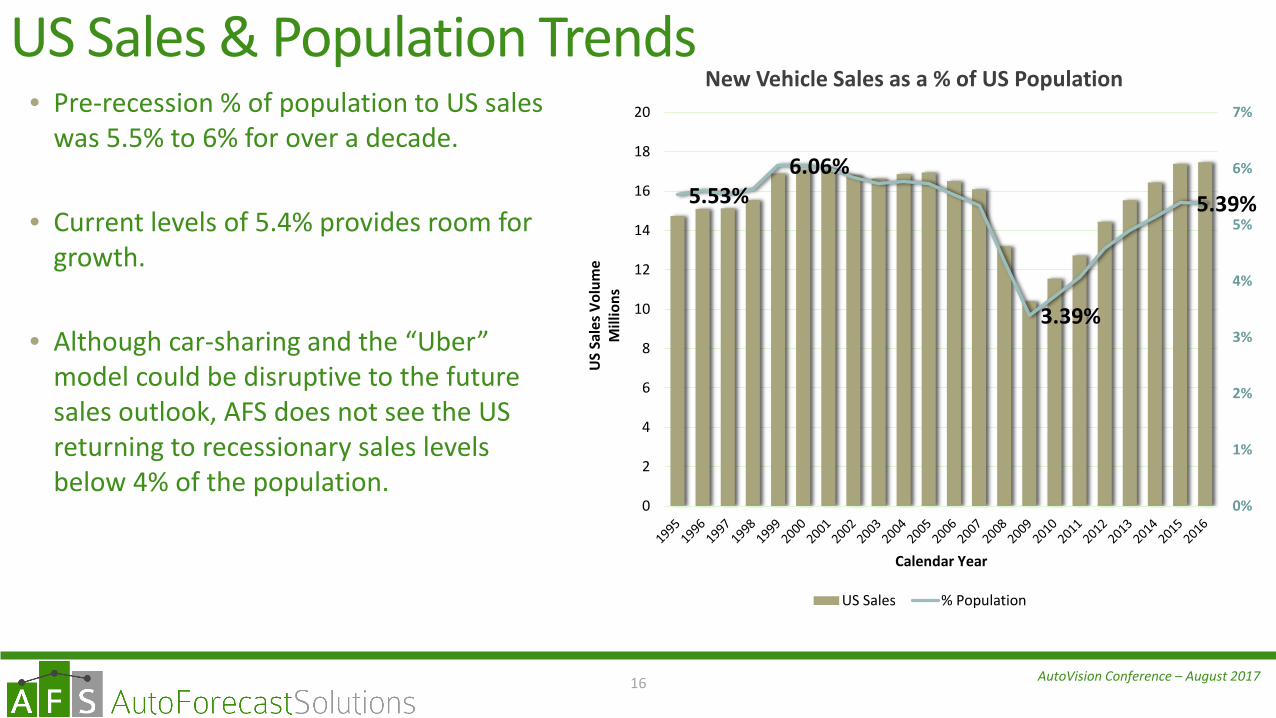
US Sales & Population Trends• Pre-recession % of population to US sales
was 5.5% to 6% for over a decade.
• Current levels of 5.4% provides room for growth.
• Although car-sharing and the “Uber” model could be disruptive to the future sales outlook, AFS does not see the US returning to recessionary sales levels below 4% of the population.
16
5.53%6.06%
3.39%
5.39%
0%
1%
2%
3%
4%
5%
6%
7%
0
2
4
6
8
10
12
14
16
18
20
US
Sale
s Vol
ume
Mill
ions
Calendar Year
New Vehicle Sales as a % of US Population
US Sales % Population

AutoVision Conference – August 2017
North America: Light Vehicle VM Group Production Review
17
0
1
2
2010 2016 2024
Mill
ions
European-Based VMsRenault
Volkswagen
Daimler
BMW
0
2
4
6
8
10
2010 2016 2024
Mill
ions
Detroit 3 VMs
Fiat Chrysler
Ford Motor
General Motors
0
2
4
6
8
2010 2016 2024
Mill
ions
Asian-Based VMsGeely Group
Nissan
Subaru
Toyota Motor
Mazda Motor
Hyundai Motor
Honda Motor
0
100
200
300
400
2010 2016 2024
Thou
sand
s
Other VMsGiant Motors
Lucid Motors
Tesla Motors
Karma Automotive
Source: AutoForecast Solutions – August 2017

AutoVision Conference – August 2017
North America Vehicle Production: D3 VM Highlights
18
0
1
2
3
4
2016 2017 2018 2019 2020 2021 2022 2023 2024
Mill
ions
NA-Based VMs
General Motors Ford Motor Fiat Chrysler
FCA• New Chrysler Pacifica• Elimination of Dodge Dart/Chrysler 200• More investment in Jeep/Ram product
• Ram Diesel issue• Available capacity in outer years
• Brampton secure through 2020 – expect new platform/CUV production for 2020 UNIFOR negotiations
• future Jeep/Ram product assignments
Ford• Ranger @ Michigan Assembly (2018)• Bronco @ Michigan Assembly (2020)• Focus move to China in late 2018
• eliminating NA production
GM• VSS Platform Architecture• Heavy investment into Cadillac lineup
• CT4, CT5, CT6• XT3, XT5, XT7
• Buick product line pullback in favor current China imports• No additional “Buick” models from China seen in near future
Source: AutoForecast Solutions – August 2017
Detroit 3 production will soften due to a current high exposure in passenger cars with high inventories with low fuel prices and consumer preference shift to larger vehicles

AutoVision Conference – August 2017
North America Vehicle Production: EU-Based VM Highlights
19
0
100
200
300
400
500
600
700
800
900
2016 2017 2018 2019 2020 2021 2022 2023 2024
Thou
sand
s
European-Based VMs
BMW Daimler Volkswagen Renault
BMW• New Plant - SLP, Mexico (2019)
• 2-Series, 3-Series, 4-Series• X7 at Spartanburg (late 2018)
Daimler• New Assembler - COMPAS
• New JV in Mexico with RNNS (2019)• Infiniti QX50/ MB GLB, A-Class, ELB
• New Plant - North Charleston, SC Plant• Sprinters (2018)• Current SKD in Gaffney
VW• VW Atlas LCU at Chattanooga (late 2016)• VW Tiguan LWB SCU at Puebla (2017)
• Replacing Beetle volume• Audi Q5 – San Jose Chiapa, Mexico (2016)
• Global source plant• VW ID Buzz (EV) MVN at Puebla (2021)• Tharu Small CUV Replacing Golf which is set to return to
GermanySource: AutoForecast Solutions – August 2017
European brands will leverage the success of their larger vehicles in North America with more localized production. In addition, Germany will put more investment into Mexico to leverage their strong/multiple Free Trade Agreements and NAFTA access.

AutoVision Conference – August 2017
North America Vehicle Production: AP-Based VM Highlights
20
0
5
10
15
20
25
2016 2017 2018 2019 2020 2021 2022 2023 2024
x 10
0000
Asian-Based VMs
Honda Motor Hyundai Motor Mazda Motor Toyota Motor
Subaru of Indiana Nissan Geely Group
Honda• Redesigned Ridgeline• Increased CR-V capacity
Hyundai• New Plant – Monterrey, Mexico
• Kia Forte, Pride, Rio• Hyundai Accent
• Potential for expansion at Hope Hull• Maximizing capacity in North America
Toyota• Lexus ES @ Georgetown• RX Hybrid in Canada• New JV plant with Mazda (2021) – Blue Springs projected
• Corolla move - Canada to new plant (2021) providing added capacity for RAV4
• Room for Mazda CX-5?• New Guanajuato, Mexico plant for Tacoma (2019)
• Addition of 4Runner import substitution?
Nissan• New Assembler - COMPAS
• New JV in Mexico with Daimler (2019)• Infiniti QX50/ MB GLB, A-Class, ELB
Geely• Leveraging Volvo ownership for global positioning• S60/XC90 Coupe production (2018/2023)• Provides gateway for Chinese parents• New Lynk & Co. brand supports Geely global growth focus
Source: AutoForecast Solutions – August 2017
Asian-based OEMs will leverage their strong North America supply base for more localized production. Although fuel prices are slowing passenger car sales, there are still buyers for these vehicles and the Asian brands are viewed as the ones to beat in this segment group.

AutoVision Conference – August 2017
North America Vehicle Production: Other VM Highlights
21
0
50
100
150
200
250
300
2016 2017 2018 2019 2020 2021 2022 2023 2024
Thou
sand
s
Other VMs
Karma Automotive Rivian Automotive Lucid Motors Giant Motors Tesla
Tesla• Aggressive EV plans• Model 3 (late 2017)• Model Y CUV(2020)• China investment?
Faraday Futures• Heavy investment announcements – future in NA uncertain• Recent financial hurdles• Chinese-ownership
Lucid Motors• Formerly Atieva• Sedan (2019) / Mid-Sized CUV (2020)
Rivian Automotive• Purchased Mitsubishi plant in Normal, Illinois• Mid-sized pickup (2020)/ Midsized CUV (2021) / Sedan (2022)
Giant Motors• Jianghuai (JAC) brand owner• Small crossover for Mexico and South America
SF Motors• Acquisition of Hummer plant for EV production• No production planned yet
Source: AutoForecast Solutions – August 2017
This group includes Tesla and future EV players. This is the key market disruption, with the expectation of other players trying to match the success of Tesla. The AFS forecast for this group is very conservative, with this list having the most volatility in the outlook.
AutoVision Conference – August 2017
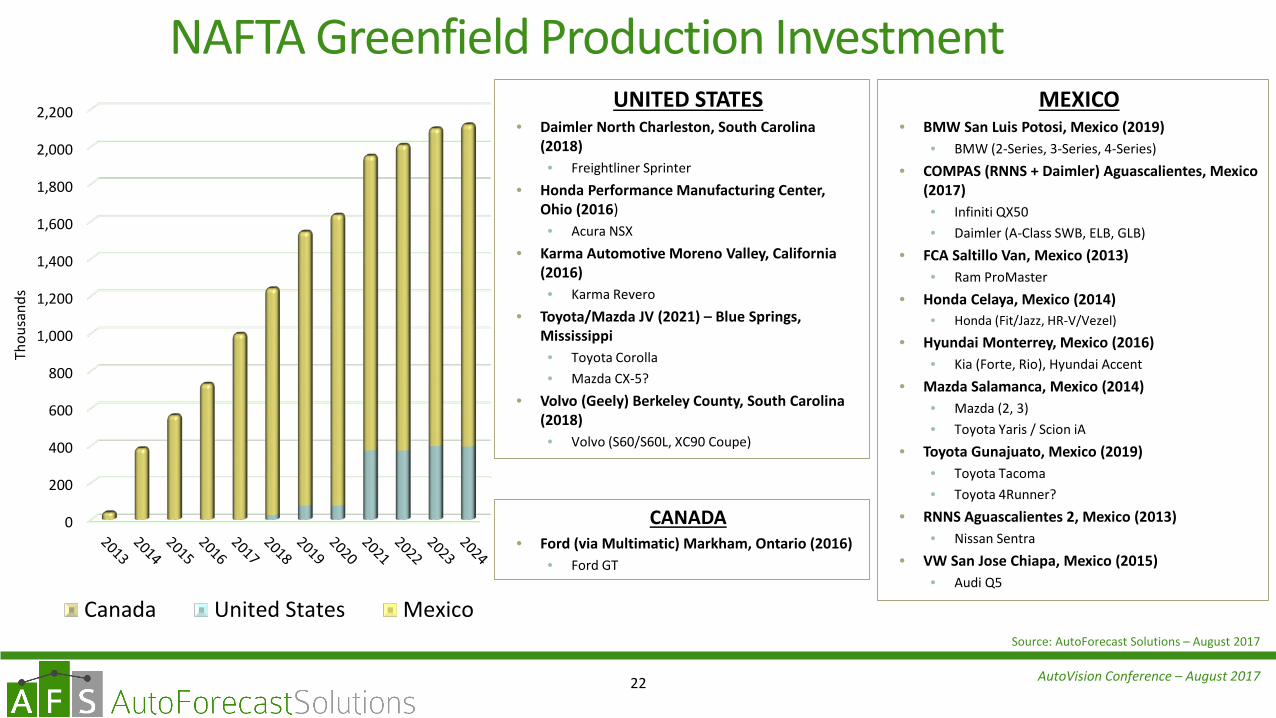
NAFTA Greenfield Production Investment
0
200
400
600
800
1,000
1,200
1,400
1,600
1,800
2,000
2,200
Thou
sand
s
Canada United States Mexico
UNITED STATES• Daimler North Charleston, South Carolina
(2018)• Freightliner Sprinter
• Honda Performance Manufacturing Center, Ohio (2016)• Acura NSX
• Karma Automotive Moreno Valley, California (2016)• Karma Revero
• Toyota/Mazda JV (2021) – Blue Springs, Mississippi• Toyota Corolla• Mazda CX-5?
• Volvo (Geely) Berkeley County, South Carolina (2018)• Volvo (S60/S60L, XC90 Coupe)
22
Source: AutoForecast Solutions – August 2017
MEXICO• BMW San Luis Potosi, Mexico (2019)
• BMW (2-Series, 3-Series, 4-Series)• COMPAS (RNNS + Daimler) Aguascalientes, Mexico
(2017)• Infiniti QX50• Daimler (A-Class SWB, ELB, GLB)
• FCA Saltillo Van, Mexico (2013)• Ram ProMaster
• Honda Celaya, Mexico (2014)• Honda (Fit/Jazz, HR-V/Vezel)
• Hyundai Monterrey, Mexico (2016)• Kia (Forte, Rio), Hyundai Accent
• Mazda Salamanca, Mexico (2014)• Mazda (2, 3)• Toyota Yaris / Scion iA
• Toyota Gunajuato, Mexico (2019)• Toyota Tacoma• Toyota 4Runner?
• RNNS Aguascalientes 2, Mexico (2013)• Nissan Sentra
• VW San Jose Chiapa, Mexico (2015)• Audi Q5
CANADA• Ford (via Multimatic) Markham, Ontario (2016)
• Ford GT

AutoVision Conference – August 2017
NAFTA Trade Balance
Total Goods & Services (2015)
23
$337.3 B $325.4 B
$267.2 B $316.4 B
Source: United States Trade Representative - 2015
$48 B $55 B
$22 B $74 B
Vehicles(2015)

AutoVision Conference – August 201724

AutoVision Conference – August 2017
Global Powertrain Application Trends
35%
7%3%
55%33%
13%9%
45% 28%
16%15%
41%
TRANSMISSION TYPE
2010
2016
2024
CVTDCT
Manual
Automatic
25
Source: AutoForecast Solutions – August 2017
8%
75% 12%4%1%
9%
77%
10%
3%1%
11%
77%
9%
3%0%
ENGINE CYLINDER COUNT
2010
2016
2024
4 cyl
3 cyl
6 cyl
8 cylOther4 5 6 7 8 9 10Variable
-30 20 70 120
2010
2016
2024
MILLIONS
TRANSMISSION BY # OF GEARS
3X 2016
20X 2010
• DCTs, CVTs, and increased number of gears• Engine downsizing continues

AutoVision Conference – August 2017
Global Light Vehicle Production by Fuel Type
IC - Gas79.55%
IC - Diesel18.84%
Hybrid - Gas1.11%
Hybrid - Diesel0.02%
BEV0.03%
EREV0.00%
Fuel Cell0.00%
Other Fuel Types0.45%
2010
26
IC - Gas77.72%
IC - Diesel18.44%
Hybrid - Gas2.68%
Hybrid - Diesel0.22%
BEV0.53%
EREV0.02%
Fuel Cell0.00%
Other Fuel Types0.39%2016
IC - Gas77.64%
IC - Diesel16.79%
Hybrid - Gas3.53%
Hybrid - Diesel0.26%
BEV1.30%
EREV0.08%
Fuel Cell0.02%
Other Fuel Types0.38%
2020
IC - Gas76.77%
IC - Diesel16.36%
Hybrid - Gas4.23%
Hybrid - Diesel0.33%
BEV1.77%
EREV0.09%
Fuel Cell0.02%
Other Fuel Types0.43%
2024
Source: AutoForecast Solutions – August 2017

AutoVision Conference – August 2017
BEV Market Sizing • Breakout by legacy OEMs and new players• Does not include LSEV
• Massive gap paints an unclear future
• Industry estimates ranging from 3% to 30% EVs on the road in the next 15 years
• Regulation or incentives – what will be the tipping point?
27
0
500,000
1,000,000
1,500,000
2,000,000
2,500,000
3,000,000
3,500,000
4,000,000
BEV Market OutlookAFS Forecast vs. VM Announced Plans
AFS Legacy VMs Legacy VM Plan Variance
AFS Start Ups Start Up VM Plan Variance
Start Up VMs
Legacy VMs
Source: AutoForecast Solutions – August 2017
Tesla30%
Volkswagen29%
Daimler20%
Renault/Nissan
11%
Geely Group10%
TOP 5 EV BRAND OWNERS - 2024
51% of Total EV Production
2024 BEV MarketAFS = 2.0 Million
Announced Plans = 3.8 Million
AutoVision Conference – August 2017
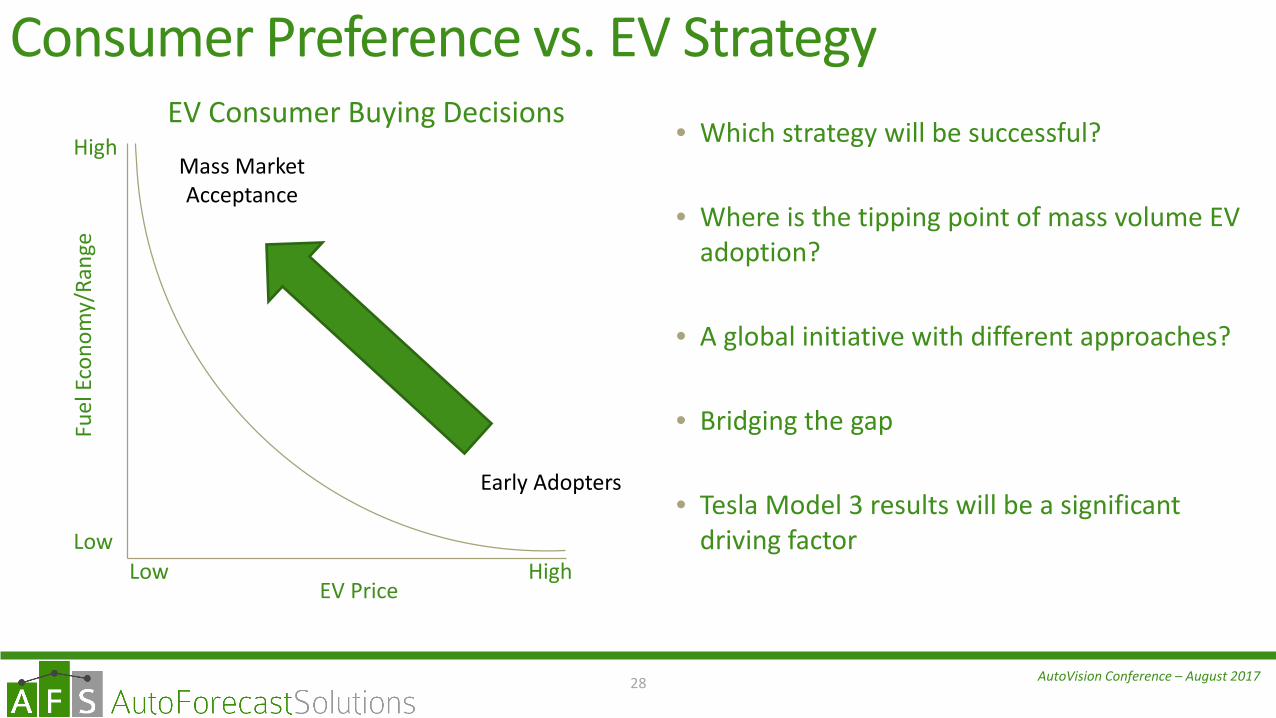
• Which strategy will be successful?
• Where is the tipping point of mass volume EV adoption?
• A global initiative with different approaches?
• Bridging the gap
• Tesla Model 3 results will be a significant driving factor
28
Consumer Preference vs. EV Strategy
Low
High
Low HighEV Price
Fuel
Eco
nom
y/Ra
nge
EV Consumer Buying Decisions
Mass Market Acceptance
Early Adopters

AutoVision Conference – August 2017
AutoVision Conference – August 2017
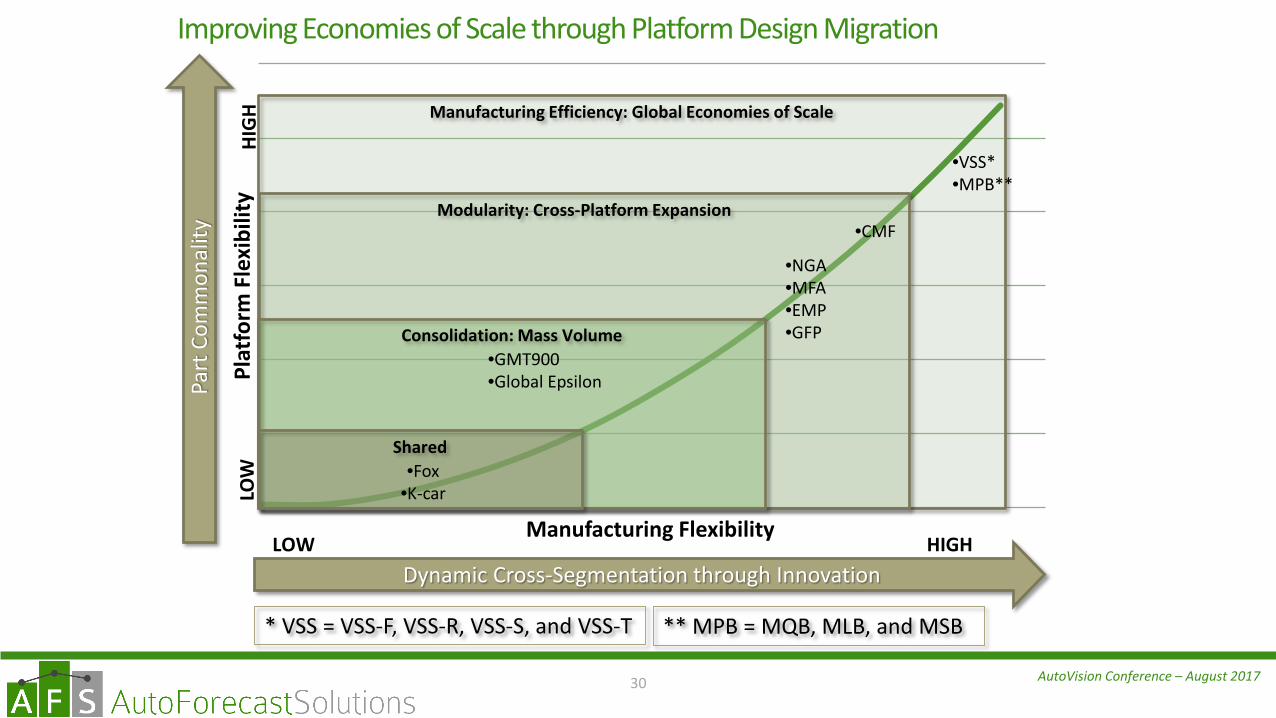
Plat
form
Fle
xibi
lity
Manufacturing Flexibility
Manufacturing Efficiency: Global Economies of Scale
Modularity: Cross-Platform Expansion
Consolidation: Mass Volume
Shared•Fox
•K-car
HIGHLOW
30
Improving Economies of Scale through Platform Design Migration
•GMT900•Global Epsilon
•NGA•MFA•EMP•GFP
•VSS*•MPB**
Dynamic Cross-Segmentation through Innovation
Part
Com
mon
ality
HIG
HLO
W•CMF
* VSS = VSS-F, VSS-R, VSS-S, and VSS-T ** MPB = MQB, MLB, and MSB

AutoVision Conference – August 2017
Lead Jurisdiction: Light Vehicle Platform Introduction
0
5
10
15
20
25
30
2010 2011 2012 2013 2014 2015 2016 2017 2018 2019 2020 2021 2022 2023 2024
5
4 5 45 9
9
1212
5 2
Middle-East/Africa Rest of AP China Western Europe
Eastern Europe South America North America
31
New Light Vehicle Platform Introductions by Country (2010 thru 2024)Top 5
China 72 Platforms 31.4% of total introductions
Germany 31 Platforms 13.5%
United States 22 Platforms 9.6%
Japan 21 Platforms 9.2%
India 17 Platforms 7.4%
Top 5 Countries
60%
Rest of World40%
LIGHT VEHICLE PLATFORM INTRODUCTIONS (2010 - 2024)
• China growth: averaging 5 platform introductions/year
• Platform introduction cadence slows as a result of larger, global platforms• More variants through program changes• Risk/opportunity equation magnified
Source: AutoForecast Solutions – August 2017

AutoVision Conference – August 2017
397 Platforms Produced Globally
64 NAFTA+ Platforms• 16% of total
NAFTA+ (2024)
86% of North America assembled vehicle volumes are part of the NAFTA+ group• 16.3 Million vehicles
NAFTA+16%
Global
GLOBAL PLATFORMS
NAFTA+86%
NAFTA Only
NA VOLUME
32
Light Vehicle Platforms containing NAFTA production and at least one other country in ROW
Source: AutoForecast Solutions – August 2017

AutoVision Conference – August 2017
Over 43% of vehicles assembled OUTSIDE NAFTA are part of the NAFTA+ Group• 38.3 Million vehicles
NAFTA+ Opportunity/Risk (2024)
55 Million NAFTA+ vehicles• Nearly 70% Produced OUTSIDE of NAFTA
NAFTA+43%
ROW
GLOBAL LESS NA PRODUCTION
NAFTA
ROW70%
GLOBAL NAFTA + PRODUCTION
33
Source: AutoForecast Solutions – August 2017

AutoVision Conference – August 201734
AutoVision Conference – August 2017
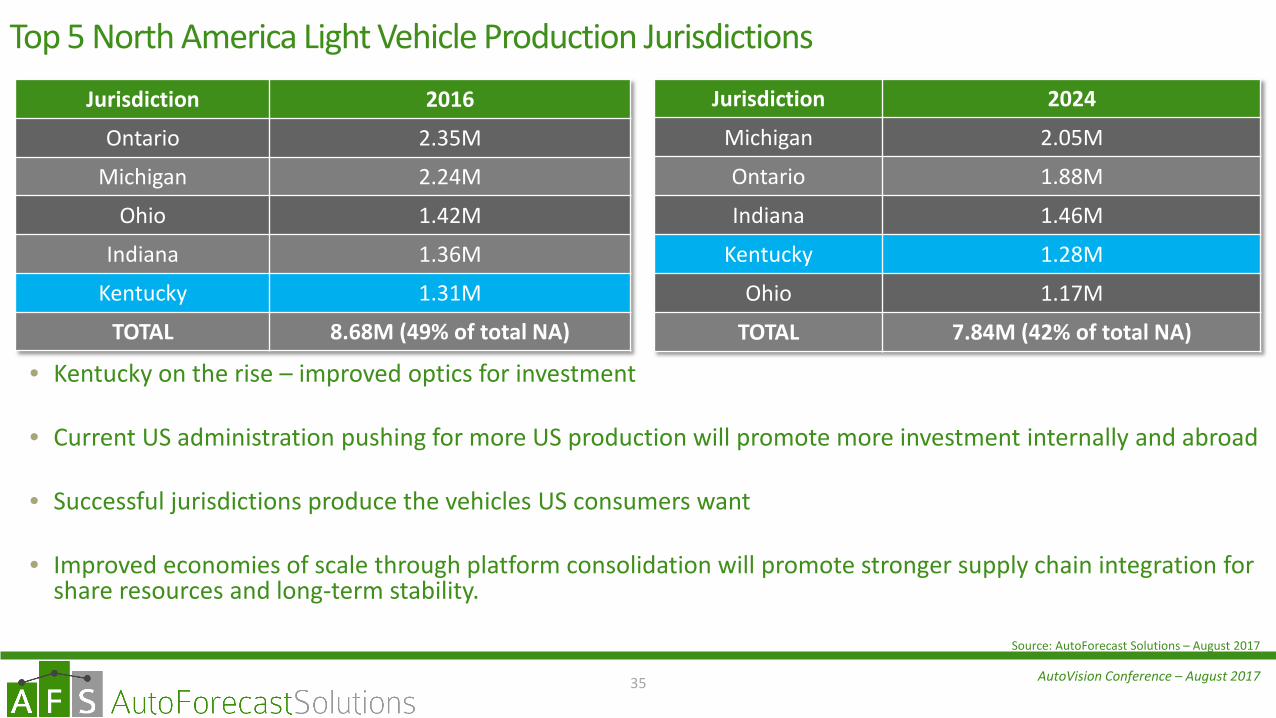
Top 5 North America Light Vehicle Production JurisdictionsJurisdiction 2016
Ontario 2.35M
Michigan 2.24M
Ohio 1.42M
Indiana 1.36M
Kentucky 1.31M
TOTAL 8.68M (49% of total NA)
35
Jurisdiction 2024
Michigan 2.05M
Ontario 1.88M
Indiana 1.46M
Kentucky 1.28M
Ohio 1.17M
TOTAL 7.84M (42% of total NA)
• Kentucky on the rise – improved optics for investment
• Current US administration pushing for more US production will promote more investment internally and abroad
• Successful jurisdictions produce the vehicles US consumers want
• Improved economies of scale through platform consolidation will promote stronger supply chain integration for share resources and long-term stability.
Source: AutoForecast Solutions – August 2017
AutoVision Conference – August 2017
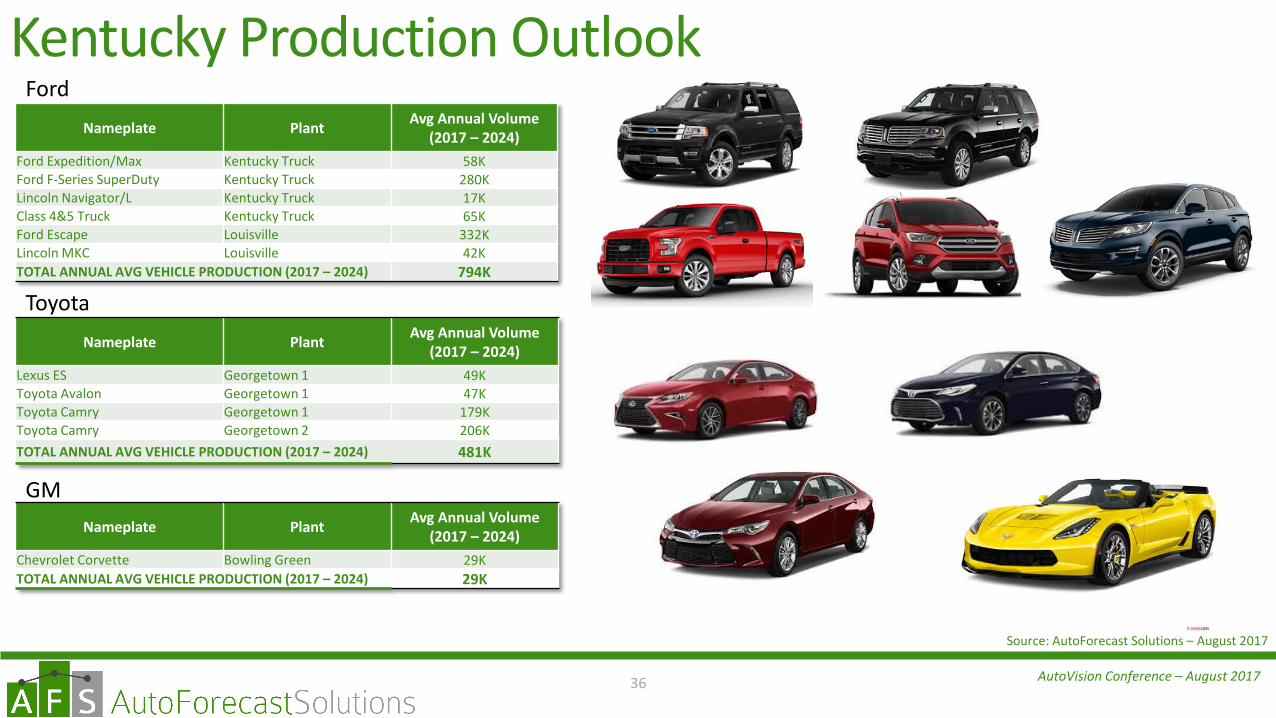
Kentucky Production Outlook
36
Nameplate Plant Avg Annual Volume (2017 – 2024)
Ford Expedition/Max Kentucky Truck 58KFord F-Series SuperDuty Kentucky Truck 280KLincoln Navigator/L Kentucky Truck 17KClass 4&5 Truck Kentucky Truck 65KFord Escape Louisville 332KLincoln MKC Louisville 42KTOTAL ANNUAL AVG VEHICLE PRODUCTION (2017 – 2024) 794K
Source: AutoForecast Solutions – August 2017
Nameplate Plant Avg Annual Volume (2017 – 2024)
Chevrolet Corvette Bowling Green 29KTOTAL ANNUAL AVG VEHICLE PRODUCTION (2017 – 2024) 29K
Nameplate Plant Avg Annual Volume (2017 – 2024)
Lexus ES Georgetown 1 49KToyota Avalon Georgetown 1 47KToyota Camry Georgetown 1 179KToyota Camry Georgetown 2 206KTOTAL ANNUAL AVG VEHICLE PRODUCTION (2017 – 2024) 481K
Ford
Toyota
GM

AutoVision Conference – August 2017
The Importance of NAFTA: Kentucky-Canada Trade
Total Goods(2016)
37
Sources: Statistic Canada, US Census Bureau Foreign, Trade Division
$2.47 B $0.57 B
Vehicles & Parts(2016)
$7.48 B $3.47 B
• Canada is Kentucky’s #1 customer• Selling more goods to Canada than it’s next three largest foreign markets combined (The UK, Mexico, and China)
• Nearly 113,000 Kentucky jobs depend on trade and investment with Canada• Kentucky is home to some of the largest Canadian-based automotive suppliers• Over 120 Canadian-owned companies maintain operations in Kentucky
• 9,000 automotive-related jobs created

AutoVision Conference – August 2017
Kentucky and Ontario
38
HIGHLIGHTS• All of the VMs in Kentucky maintain a footprint in Ontario• Kentucky and Ontario both produce the Toyota MC and NGA (New Global Architecture) vehicle platforms• Both jurisdictions build the vehicles North American consumers want: Pickups, CUVs, and SUVs
0
200
400
600
800
1,000
1,200
1,400
Thou
sand
s
Kentucky Light Vehicle Production
Ford GM Toyota
0
500
1,000
1,500
2,000
2,500
Thou
sand
s
Ontario Light Vehicle Production
FCA Ford GM Toyota Honda
Source: AutoForecast Solutions – August 2017

AutoVision Conference – August 2017
Car19%
CUV70%
MVN11%
Production by Segment - 2024Ontario
39
Product Mix
Car40%
CUV32%
SUV7%
Pickup21%
Production by Segment - 2024Kentucky
Building the right products for our marketSource: AutoForecast Solutions – August 2017
AutoVision Conference – August 2017
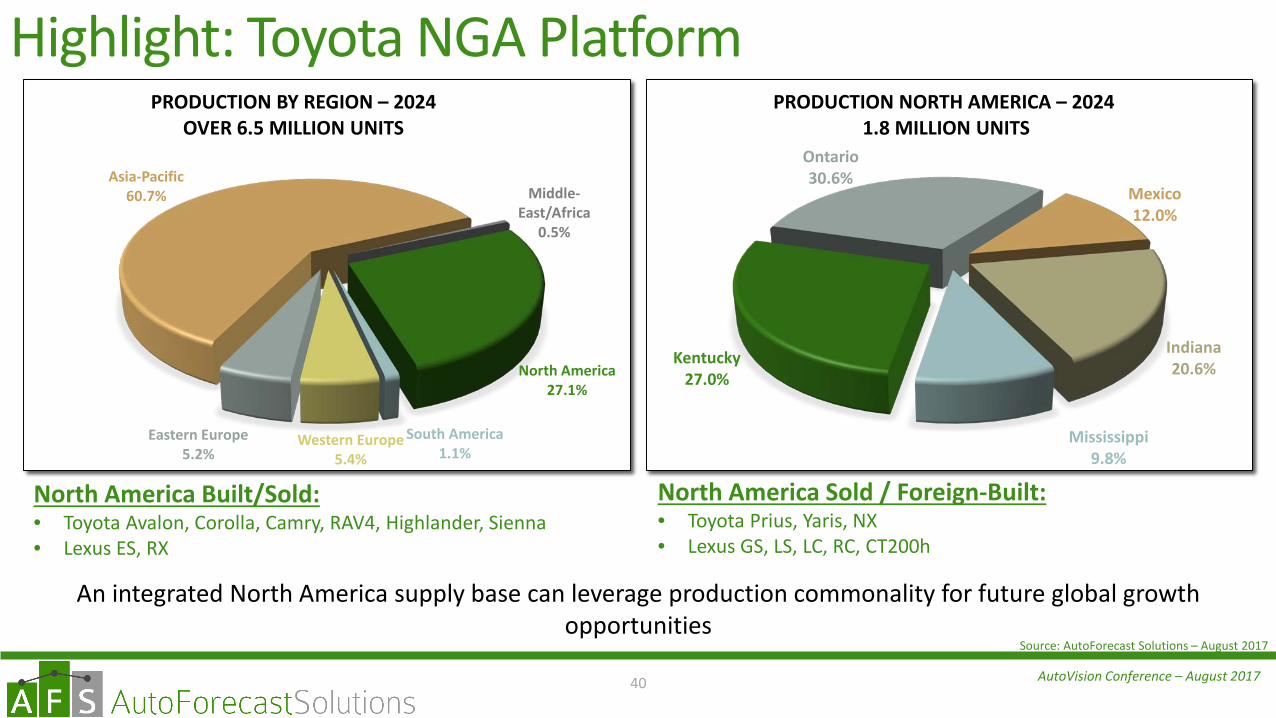
North America27.1%
South America1.1%
Western Europe5.4%
Eastern Europe5.2%
Asia-Pacific60.7% Middle-
East/Africa0.5%
PRODUCTION BY REGION – 2024OVER 6.5 MILLION UNITS
40
Highlight: Toyota NGA Platform
North America Built/Sold:• Toyota Avalon, Corolla, Camry, RAV4, Highlander, Sienna• Lexus ES, RX
Indiana20.6%
Mississippi9.8%
Kentucky27.0%
Ontario30.6%
Mexico12.0%
PRODUCTION NORTH AMERICA – 20241.8 MILLION UNITS
North America Sold / Foreign-Built:• Toyota Prius, Yaris, NX• Lexus GS, LS, LC, RC, CT200h
An integrated North America supply base can leverage production commonality for future global growth opportunities
Source: AutoForecast Solutions – August 2017

AutoVision Conference – August 201741

AutoVision Conference – August 2017
Disruption: The Fine Line Between Risk and Opportunity• After seven years of increased vehicles sales in North America, the market is due for a market softening. In
addition to weakening sales, the current industry climate is dealing with disruption in many forms. Examples include:• Electrification• Autonomy• Long-term view of low fuel prices• Car sharing• A new, protectionist-focused, US Administration• ‘Dieselgate” and Takata airbags• The impact on globalization in vehicle design• The China influence• Introduction of new players• Vehicle mix vs. a new type of fickle consumer focused on the latest technology
and willingness to reinvest as updates are available• Impatient shareholders
Disruption is creating an environment where all stakeholders are jockeying for position in a race with no clear finish line.
42
Significant unknown
disruptive factors

AutoVision Conference – August 2017
The Solution: Be Proactive, Not Reactive• Stakeholder Investment
• A team-based effort: suppliers, vehicle manufacturers, local jurisdictions, government• Supply Chain Transformation
• Strengthen both the External and Internal communication chains through transparency/support/partnerships• Shareholder Issues
• Understanding the misbalanced view of real vs. potential value• Education & Development of the Labor Pool
• A new way of thinking is needed to promote progress• Innovation
• The new basis of expectation in products, processes, and technologies to maintain core strengths while identifying areas for revenue growth
• Globalization• Constant border erosion in customers, opportunities, and competitive pressures
• The Long View• Balancing out short-term actions with long-term consequences
43

AutoVision Conference – August 2017
The Disruptive Automotive LandscapeProduction Outlook, Analysis, & Factors Shaping the Industry
Kentucky Automotive Industry AssociationAutoVision 2017
August 2017
Joseph McCabe, President855.734.4590 ext. 1001