Platform Intermediaries in the Sharing Economy: Questions ...
i
The Digital Platform Economy Index 2020
Zoltan J. Acs, George Mason University
László Szerb, University of Pécs, Faculty of Business and Economics
Abraham K. Song, George Mason University
Éva Komlósi, MTA-PTE Innovation and Economic Growth Research Group, University of Pécs
Esteban Lafuente, Department of Management, UPC Barcelona Tech
ii
Table of Contents
About The Global Entrepreneurship and Development Institute iv
Preface v
Introduction 1
The concept of platform-based ecosystem: The digital platform economy 3
From concept to measurement - The twelve pillars and their measurement 6
Measurement – Calculating of the DPE index and the components scores 10
Basic analysis – Country rankings and clustering 13
Further analysis – pillar based investigations 17
Basic DPE Index policy suggestions – DPE Index trend line and Digital Ecosystem-Entrepreneurship Ecosystem
difference analysis 19
Summary and conclusion 23
References 24
Appendix: The applied indicators in the Digital Entrepreneurship Index 26

iii
Tables and Figures
Figure 1: The platform-based ecosystem 4
Table 1: Keys to Building a Sustainable Digital Platform Economy 5
Figure 2: The structure of DPE index 7
Table 2: The DPE index ranking of the countries, 2020 14
Figure 3: The connection between development and the DPE Index scores (third-degree polynomial
adjustment) 15
Table 3: The four sub-index scores and ranking of the first 25 countries 16
Table 4: The four groups of the countries and average pillar scores based on the twelve pillars 17
Figure 4: Selected European countries by pillar 18
Figure 5: The four groups of countries based on the difference between DE and EE scores and the deviation
from development implied trend-line. 19
Table 5: Suggested policy recommendation with respect to DPE Index trend-line deviation, and Digital
Ecosystem/Entrepreneurship Ecosystem mix 21
Figure 6: The top 100 platform companies all around the world (June 2020) 22

iv
About The Global Entrepreneurship and Development Institute
Zoltán J. Ács
Founder and President, The GEDI Institute
The Global Entrepreneurship and Development Institute (The GEDI Institute) is the leading research organization advancing knowledge on the relationship between entrepreneurship, economic development, and prosperity. The Institute, headquartered in Washington D.C., was founded by leading entrepreneurship scholars from George Mason University, the University of Pécs, Imperial College London and the London School of Economics. For a long time, the Institute’s flagship project was the Global Entrepreneurship Index (GEI), a breakthrough advance in measuring the quality and dynamics of entrepreneurship ecosystems at a national and regional level. The GEI project was finished in 2019 and a new index developed. Incorporating changes caused by the information technology revolution and globalization, the institute has turned its focus to examine the connection between digitalization and entrepreneurship. This newly developed measure called the Digital Platform Economy Index (DPE Index) is a country level composite indicator of the global digital ecosystem. We hope that this new index will be as helpful as the previous GEI was.
v
Preface In April 2020, The GEDI launched a preliminary report about measuring the digital entrepreneurship ecosystem. Over time, the concept has gone through several iterations and is now ready to be published. Like the Global Entrepreneurship Index products, we are planning to continue this research and publish new reports on a yearly basis. The application of big data, new algorithms and cloud computing is creating a global digital platform economy built around platform companies. The Digital Platform Economy Index (DPE Index) integrates two separate but related literatures on ecosystems, namely, digital ecosystem and entrepreneurial ecosystem. This new framework situates digital entrepreneurship in the broader context of users, platforms, and institutions, such that two biotic entities (users and agents) actuate individual agency, and two abiotic components (digital infrastructure and digital platforms) form the external environment. If a country builds out its digital ecosystem there is no guarantee it will be exploited by existing firms. The adoption of new technologies by startups because of an entrepreneurial ecosystem is also uncertain. For technology to be successfully introduced both the digital ecosystem and the entrepreneurial ecosystem need to be developed simultaneously. The DPE Index framework includes 12 pillars to integrate these two ecosystems, and this report measures the DPE Index for 116 countries. Developed Anglo-Saxon and Nordic countries lead the DPE index ranking followed by other European, Asian as well as two Oceania prosperous nations (New Zealand and Australia). Many middle-developed European, Asian and Latin American countries, together with a group of oil rich countries (i.e., Bahrain, Oman, Qatar, Saudi Arabia, and United Arab Emirates) report below average DPE index scores, while developing economies from Africa, Asia, Europe and Latin America are included in the group of poor performing countries. Among EU member states, the DPE results reveal that most countries (22 out of 27) are on or above the trend-line; however, they are far from the top DPE performers (i.e., US and UK), except the Netherlands. The report offers plain policy recommendations on how to enhance both the digital and entrepreneurial ecosystem.
1
Introduction In one of the most interesting articles on the Information-technology Revolution (ITR), Hobijn and Jovanovic (2001) argued that the arrival of the ITR in the 1970s created the need for new firms to emerge.1 Technology breakthroughs favor new firm formation for three reasons: awareness and skills; vintage capital; and vested interests. The stock market incumbents of the day were not ready to implement the new digital technologies and it took new firms to bring the technology to market after the mid-1980s. Stock prices of incumbents fell immediately. New capital flowed via venture capital to startups in the United States that built the new industries but not in Europe (Gompers and Lerner, 2001). Between 1980 and 2020 the U.S. stock market raised thirty-fold. The five most valuable public companies in the United States in 2020—i.e., Apple, Amazon, Microsoft, Facebook and Google—are valued at or near $1 trillion each.2 Many of them are Matchmaker businesses whose core competency is the ability to match one group of users with another by reducing transaction costs. The ITR is about digital technology and the representation of information in bits (Shannon, 1948). Information in bits reduces the cost of storage, computation and transmission of data. Digital economics examines whether and how digital technology changes economic activity (Goldfarb and Tucker, 2019). Digital technologies reduce five types of distinct costs that affect economic activities; search, replication, transportation, tracking and verification. The reduction of search costs leads to more matching and peer to peer platforms that increase the efficiency of trade. Most of the major technology firms can be seen as platform-based businesses. There are two main reasons why digital markets give rise to platforms (Jullien, 2012). First, platforms facilitate matching because they provide a structure that can take advantage of low search costs to create efficient matches. Second, platforms increase the efficiency of trade. They do this through lower search costs, lower reproduction costs and lower verification costs (Goldfarb and Tucker, 2019, p. 13). While the literature on digital economics has examined how digital technology changes economic activity less has been written about how it affects the platform economy. The purpose of this paper is to create a framework to better understand the platform economy, multisided platforms and the platform-based ecosystems. The term ‘Digital Platform Economy’ was coined by Kenney and Zysman (2016, p.62) as, “(…) a more neutral term that encompasses a growing number of digitally enabled activities in business, politics, and social interaction.3 If the industrial revolution was organized around the factory, today’s changes are organized around these digital platforms, loosely defined.” The advancements in information and communication technologies (ICT) opened a pathway for these businesses. More specifically, platforms are enabled by technological openness (architectural interface specification) and organizational openness (governance) both of which are mediated by the platform owner. This rise of digital multi-sided platforms as avenues for value creation, appropriation, and innovation is commonly known as platformization. While Kenny and Zysman (2016) focused on the nature of work this study focuses on the changing structure of the economy. In the platform economy costs are reduced not by management but via digital platforms—technology. Therefore, one of the hallmarks of the platform economy is the creation of markets where they did not exist through increased matching and the spread of platform-based businesses (Cusumano, Gawer and Yoffie, 2019). A question that has received less attention is how the ITR has affected the organization of the firm. In other words, “How do lower search costs affect firm organization? The reduction in search costs and verification costs has also led to a new form of organization—the platform-based ecosystem. The paper makes two contributions to the literature. First, we provide a concept-based measure of the DPE consisting of twelve pillars and four quadrants: Digital Multisided Platforms, Digital User Citizenship, Digital
1 Also see Greenwood and Jovanovic (1999) 2https://www.androidcentral.com/alphabet-becomes-fourth-trillion-dollar-company Accessed 2/14/2020. 3 Also see Peitz and Waldfoge, The Digital Economy, 2012.
2
Technology Entrepreneurship and Digital Technology Infrastructure. These four quadrants include the key economic, business, social and policy issues: competition, privacy, innovation and security, respectively (Sussan and Acs 2017, Song 2019). Building on the National Systems of Entrepreneurship methodology (Acs, Autio and Szerb, 2014) we calculate the DPE index for 116 countries. A major advantage of our index is that it allows us to make international comparisons about digital efficiency across countries and over time. Second, we examine the European Union’s platform economy dilemma using the new measure of the DPE index. The EU platformization lag stems from the fact that incumbent firms in Europe have not introduced new technologies in sufficient volume and startups have remained small and not scalable (Naude, 2016).
3
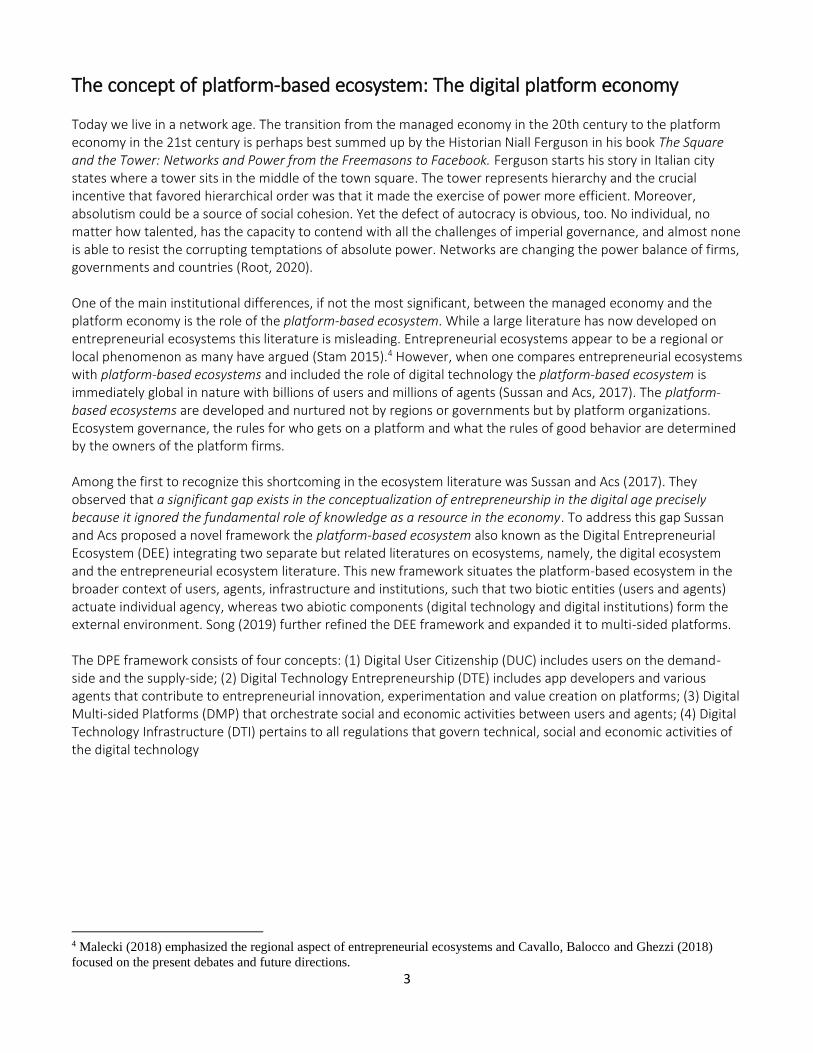
The concept of platform-based ecosystem: The digital platform economy Today we live in a network age. The transition from the managed economy in the 20th century to the platform economy in the 21st century is perhaps best summed up by the Historian Niall Ferguson in his book The Square and the Tower: Networks and Power from the Freemasons to Facebook. Ferguson starts his story in Italian city states where a tower sits in the middle of the town square. The tower represents hierarchy and the crucial incentive that favored hierarchical order was that it made the exercise of power more efficient. Moreover, absolutism could be a source of social cohesion. Yet the defect of autocracy is obvious, too. No individual, no matter how talented, has the capacity to contend with all the challenges of imperial governance, and almost none is able to resist the corrupting temptations of absolute power. Networks are changing the power balance of firms, governments and countries (Root, 2020). One of the main institutional differences, if not the most significant, between the managed economy and the platform economy is the role of the platform-based ecosystem. While a large literature has now developed on entrepreneurial ecosystems this literature is misleading. Entrepreneurial ecosystems appear to be a regional or local phenomenon as many have argued (Stam 2015).4 However, when one compares entrepreneurial ecosystems with platform-based ecosystems and included the role of digital technology the platform-based ecosystem is immediately global in nature with billions of users and millions of agents (Sussan and Acs, 2017). The platform-based ecosystems are developed and nurtured not by regions or governments but by platform organizations. Ecosystem governance, the rules for who gets on a platform and what the rules of good behavior are determined by the owners of the platform firms. Among the first to recognize this shortcoming in the ecosystem literature was Sussan and Acs (2017). They observed that a significant gap exists in the conceptualization of entrepreneurship in the digital age precisely because it ignored the fundamental role of knowledge as a resource in the economy. To address this gap Sussan and Acs proposed a novel framework the platform-based ecosystem also known as the Digital Entrepreneurial Ecosystem (DEE) integrating two separate but related literatures on ecosystems, namely, the digital ecosystem and the entrepreneurial ecosystem literature. This new framework situates the platform-based ecosystem in the broader context of users, agents, infrastructure and institutions, such that two biotic entities (users and agents) actuate individual agency, whereas two abiotic components (digital technology and digital institutions) form the external environment. Song (2019) further refined the DEE framework and expanded it to multi-sided platforms. The DPE framework consists of four concepts: (1) Digital User Citizenship (DUC) includes users on the demand-side and the supply-side; (2) Digital Technology Entrepreneurship (DTE) includes app developers and various agents that contribute to entrepreneurial innovation, experimentation and value creation on platforms; (3) Digital Multi-sided Platforms (DMP) that orchestrate social and economic activities between users and agents; (4) Digital Technology Infrastructure (DTI) pertains to all regulations that govern technical, social and economic activities of the digital technology
4 Malecki (2018) emphasized the regional aspect of entrepreneurial ecosystems and Cavallo, Balocco and Ghezzi (2018)
focused on the present debates and future directions.

4
Figure 1: The platform-based ecosystem
Source: Song, 2019 p. 576
First, users’ privacy protection is critical for a healthy and active Digital User Citizenship. If the public trust becomes eroded, the sustainability of the DEE suffers. Erosion of trust in platforms can lead to a decline in user activities or membership. For example, Facebook’s scandal involving Cambridge Analytica exposed millions of users and served as a watershed moment that prompted more government regulation of the internet to protect consumer privacy. Since then, Facebook has experienced a steady decline of daily active users in Europe. Second, Digital Technology Entrepreneurship brings forth entrepreneurial innovation and thereby increases platform efficiency. The larger the user base, the larger the market segments and niches. A good platform sponsor provides boundary resources ease the entrepreneurial innovation process and offers a fair profit-share plan. Over the years, some critics have complained that Apple’s high developer commissions and fierce control over its App store can limit experimentation, entrepreneurial innovation, and value creation. Third, Digital Multi-sided platforms are the key organizational innovation of the ITR (Rochet and Tirole, 2003, 2006; Gawer 2009; Evans and Schmalensee, 2007, 2016). Saadatmand, Lindgren and Shultze (2019) describe, “digital platforms as an emergent organizational form characterized by technology and social processes. The monopolistic behavior of Digital Multi-sided Platform will stifle competition, innovation, and entrepreneurial activities, which results in a welfare loss for consumers and the society as a whole. For example, European regulators have penalized Google for antitrust violations three times: for unfairly pushing its apps on smartphone users and blocking rivals; for using its search engine to steer consumers to its own shopping platforms; and for blocking its rivals from placing advertisements on third party websites. Fourth, digital technology infrastructure enables the platform economy to operate. Digital infrastructure represents the technology of the digital age along with the rules and regulations that govern its use. This technological infrastructure is crucial to the smooth working of the DPE that is also responsible for keeping the digital economy open and secure. Huawei has been accused of being controlled by the Chinese government, and
5
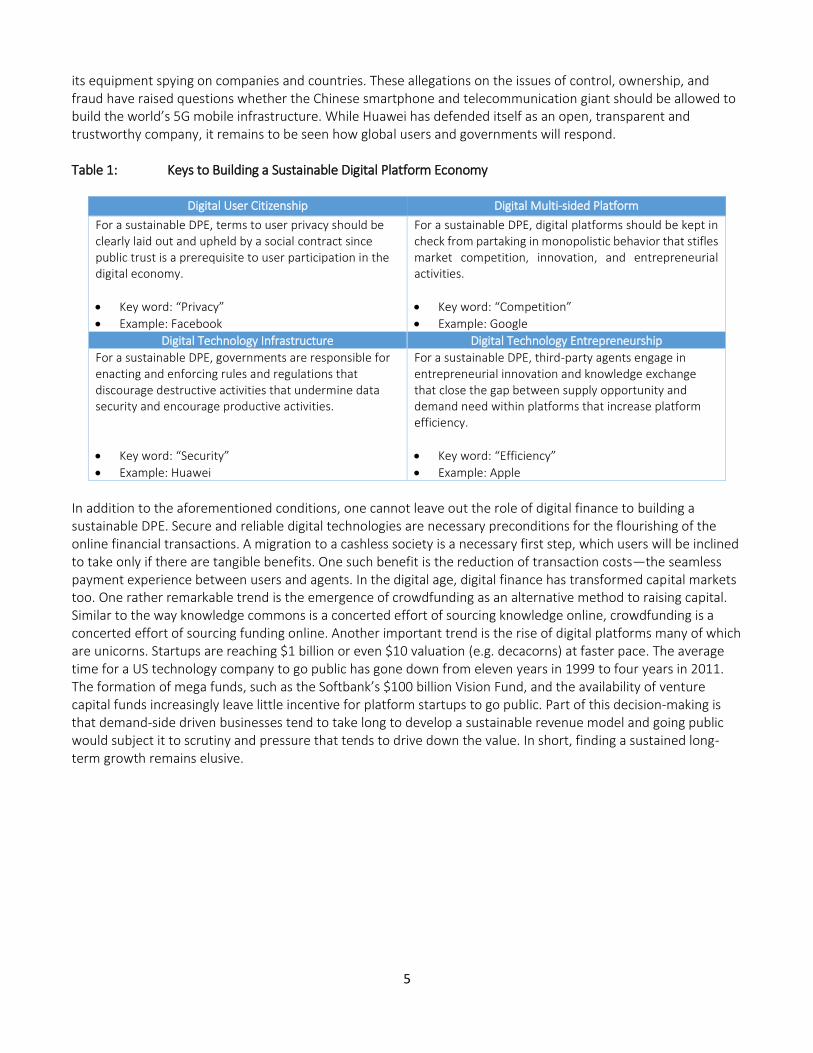
its equipment spying on companies and countries. These allegations on the issues of control, ownership, and fraud have raised questions whether the Chinese smartphone and telecommunication giant should be allowed to build the world’s 5G mobile infrastructure. While Huawei has defended itself as an open, transparent and trustworthy company, it remains to be seen how global users and governments will respond. Table 1: Keys to Building a Sustainable Digital Platform Economy
Digital User Citizenship Digital Multi-sided Platform
For a sustainable DPE, terms to user privacy should be clearly laid out and upheld by a social contract since public trust is a prerequisite to user participation in the digital economy.
Key word: “Privacy”
Example: Facebook
For a sustainable DPE, digital platforms should be kept in check from partaking in monopolistic behavior that stifles market competition, innovation, and entrepreneurial activities.
Key word: “Competition”
Example: Google
Digital Technology Infrastructure Digital Technology Entrepreneurship
For a sustainable DPE, governments are responsible for enacting and enforcing rules and regulations that discourage destructive activities that undermine data security and encourage productive activities.
Key word: “Security”
Example: Huawei
For a sustainable DPE, third-party agents engage in entrepreneurial innovation and knowledge exchange that close the gap between supply opportunity and demand need within platforms that increase platform efficiency.
Key word: “Efficiency”
Example: Apple
In addition to the aforementioned conditions, one cannot leave out the role of digital finance to building a sustainable DPE. Secure and reliable digital technologies are necessary preconditions for the flourishing of the online financial transactions. A migration to a cashless society is a necessary first step, which users will be inclined to take only if there are tangible benefits. One such benefit is the reduction of transaction costs—the seamless payment experience between users and agents. In the digital age, digital finance has transformed capital markets too. One rather remarkable trend is the emergence of crowdfunding as an alternative method to raising capital. Similar to the way knowledge commons is a concerted effort of sourcing knowledge online, crowdfunding is a concerted effort of sourcing funding online. Another important trend is the rise of digital platforms many of which are unicorns. Startups are reaching $1 billion or even $10 valuation (e.g. decacorns) at faster pace. The average time for a US technology company to go public has gone down from eleven years in 1999 to four years in 2011. The formation of mega funds, such as the Softbank’s $100 billion Vision Fund, and the availability of venture capital funds increasingly leave little incentive for platform startups to go public. Part of this decision-making is that demand-side driven businesses tend to take long to develop a sustainable revenue model and going public would subject it to scrutiny and pressure that tends to drive down the value. In short, finding a sustained long-term growth remains elusive.

6
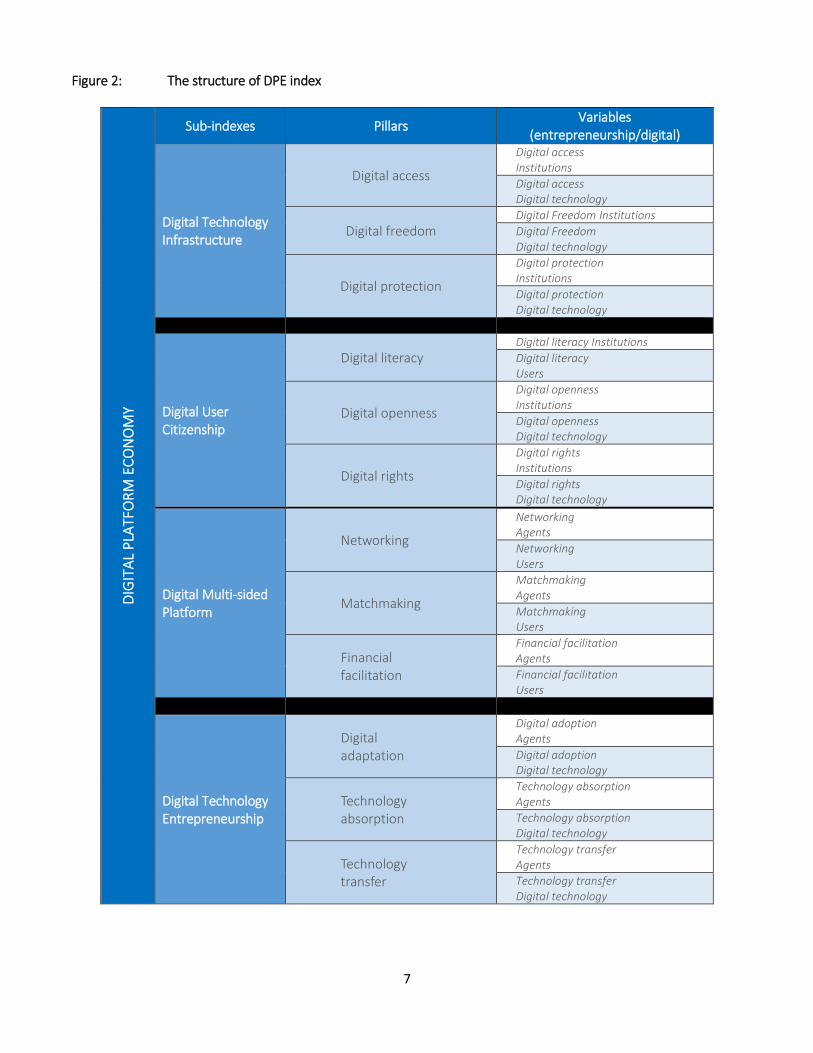
From concept to measurement - The twelve pillars and their measurement While ecosystem theories and concepts have a relatively long history for both entrepreneurial ecosystems (Acs, Stam, Audretsch and O’Connor, 2017) and digital ecosystems (Li, Badr and Biennier 2012, Weill and Woerner 2015), the concepts of digital entrepreneurship ecosystem and platform-based economy has been emerging only recently (Elia, Margherita, and Passiante, 2020, Nambisan 2017, Sahut, Iandoli, and Teulon 2019). However, measurements have been lagging behind conceptual developments. Some argue that all ecosystems are exclusive having their unique component structure, own strengths and weaknesses. Consequently, case studies rather than simple or composite indicators are more appropriate to describe the ecosystem phenomenon (Isenberg 2010, Spigel 2017). While we can agree that the specifics of each ecosystem can be viewed via a microscope, looking from certain, bird-eye distance, one can recognize the common structures and features (Szerb et al 2019). Accurate measurement is vital because of three reasons. First, one can recognize the relative development of a particular unit by comparing to other units based on rankings and index scores. Second, ecosystem strengths and weaknesses can be identified from a benchmarking perspective. Third, solid policy recommendations should base on appropriate measures. While digital ecosystem and entrepreneurship ecosystem measures have been available for a longer time there is only one, country level digital entrepreneurship ecosystem index, the European Index of Digital Entrepreneurship Systems (EIDES), exists (Autio et al 2018, 2019). EIDES has its theoretical roots in the entrepreneurship ecosystem concept, where entrepreneurship ecosystem pillars are contextualized by their digital counterpart. This notion reflects to the general-purpose use of digitalization, in particular of digital technologies. Our suggested DPE index is different from this because EIDES conceptualizes entrepreneurship ecosystem based on the three business development stages (stand-up, start-up, and scale-up), while DPE index is designed to focus on the context of users, agents, digital technology, and institutions to capture fully the systemic developments as identified by Jovanovic (1982, 2001). Second, our DPE Index is centered around platformization and not solely on the use or the application of digital technologies. Moreover, EIDES is only for the EU member countries while DPE makes possible to compare EU countries to other nations.5 The new DPE index proposed in this study attempts to measure the Digital Platform Economy at the country-level. Figure 1 pictures the structure of DPE index showing the four frameworks, called sub-indices. All four frameworks include three constituents reflecting the most important aspects of Digital Technology Infrastructure, Digital User Citizenship, Digital Multi-sided Platforms, and Digital Technology Entrepreneurship. All pillars have two types of components, called variables (Figure 2). For example, Digital rights pillar have an Institutions and a User’s component; and Digital adoption pillar consists of a Digital technology and an Agent variable.
5 For other entrepreneurship ecosystem measures see the Global Entrepreneurship Index, its regional counterpart the regional
Entrepreneurship and Development index, Kauffmann’s entrepreneurship ecosystem and the Startup Genome’s Global
Startup Ecosystem model based measures. Digital measures can be divided into maturity/readiness, transformation, and
complex indices. The most well-known composite digital index is the European Union’s Digital Economy and
Transformation Index (DESI). Beside it, there are the Mastercard and the Fletcher School at Tufts University’s Digital
Evolution Index, and the Economic Intelligence Unit’ Inclusive Internet Index.
7
Figure 2: The structure of DPE index
DIG
ITA
L P
LATF
OR
M E
CO
NO
MY
Sub-indexes Pillars Variables
(entrepreneurship/digital)
Digital Technology Infrastructure
Digital access
Digital access Institutions
Digital access Digital technology
Digital freedom Digital Freedom Institutions
Digital Freedom Digital technology
Digital protection
Digital protection Institutions
Digital protection Digital technology
Digital User Citizenship
Digital literacy Digital literacy Institutions
Digital literacy Users
Digital openness
Digital openness Institutions
Digital openness Digital technology
Digital rights
Digital rights Institutions
Digital rights Digital technology
Digital Multi-sided Platform
Networking
Networking Agents
Networking Users
Matchmaking
Matchmaking Agents
Matchmaking Users
Financial facilitation
Financial facilitation Agents
Financial facilitation Users
Digital Technology Entrepreneurship
Digital adaptation
Digital adoption Agents
Digital adoption Digital technology
Technology absorption
Technology absorption Agents
Technology absorption Digital technology
Technology transfer
Technology transfer Agents
Technology transfer Digital technology
8
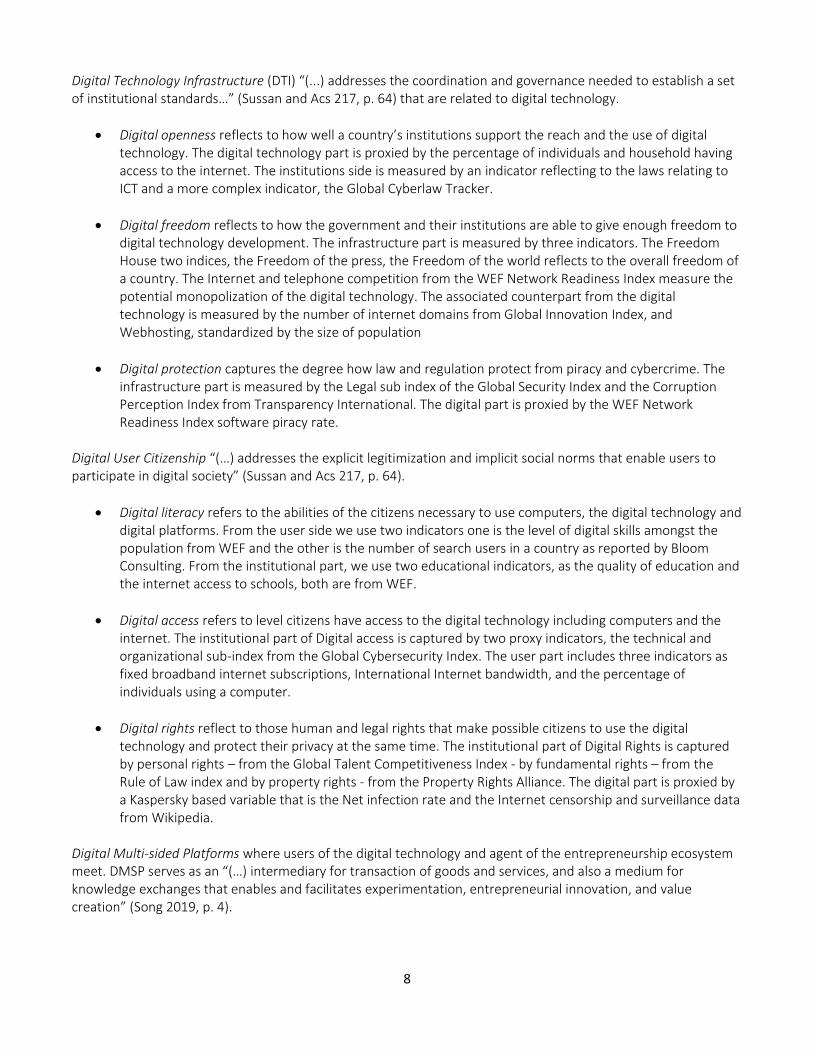
Digital Technology Infrastructure (DTI) “(...) addresses the coordination and governance needed to establish a set of institutional standards…” (Sussan and Acs 217, p. 64) that are related to digital technology.
Digital openness reflects to how well a country’s institutions support the reach and the use of digital technology. The digital technology part is proxied by the percentage of individuals and household having access to the internet. The institutions side is measured by an indicator reflecting to the laws relating to ICT and a more complex indicator, the Global Cyberlaw Tracker.
Digital freedom reflects to how the government and their institutions are able to give enough freedom to digital technology development. The infrastructure part is measured by three indicators. The Freedom House two indices, the Freedom of the press, the Freedom of the world reflects to the overall freedom of a country. The Internet and telephone competition from the WEF Network Readiness Index measure the potential monopolization of the digital technology. The associated counterpart from the digital technology is measured by the number of internet domains from Global Innovation Index, and Webhosting, standardized by the size of population
Digital protection captures the degree how law and regulation protect from piracy and cybercrime. The infrastructure part is measured by the Legal sub index of the Global Security Index and the Corruption Perception Index from Transparency International. The digital part is proxied by the WEF Network Readiness Index software piracy rate.
Digital User Citizenship “(…) addresses the explicit legitimization and implicit social norms that enable users to participate in digital society” (Sussan and Acs 217, p. 64).
Digital literacy refers to the abilities of the citizens necessary to use computers, the digital technology and digital platforms. From the user side we use two indicators one is the level of digital skills amongst the population from WEF and the other is the number of search users in a country as reported by Bloom Consulting. From the institutional part, we use two educational indicators, as the quality of education and the internet access to schools, both are from WEF.
Digital access refers to level citizens have access to the digital technology including computers and the internet. The institutional part of Digital access is captured by two proxy indicators, the technical and organizational sub-index from the Global Cybersecurity Index. The user part includes three indicators as fixed broadband internet subscriptions, International Internet bandwidth, and the percentage of individuals using a computer.
Digital rights reflect to those human and legal rights that make possible citizens to use the digital technology and protect their privacy at the same time. The institutional part of Digital Rights is captured by personal rights – from the Global Talent Competitiveness Index - by fundamental rights – from the Rule of Law index and by property rights - from the Property Rights Alliance. The digital part is proxied by a Kaspersky based variable that is the Net infection rate and the Internet censorship and surveillance data from Wikipedia.
Digital Multi-sided Platforms where users of the digital technology and agent of the entrepreneurship ecosystem meet. DMSP serves as an “(…) intermediary for transaction of goods and services, and also a medium for knowledge exchanges that enables and facilitates experimentation, entrepreneurial innovation, and value creation” (Song 2019, p. 4).
9
The Networking pillar aims to grasp the network and other externality effect of MSP. We apply three, partially overlapping, indicators from the users’ side: the use of virtual social networks (ITU), social media penetration (Hootsuite), and the use of virtual professional networks (WEF). From the agent side, we apply two WEF related indicators that are the ICT use of Business-to-business transactions and the business-to-costumer internet use.
Matchmaking component aims to capture the multisided platform model effect. From the user side the active participation effect captured by two indicators from INSEAD that are the Wikipedia yearly edits, and the Video uploads on YouTube. From the agent side we use the number of professional developers as a percentage of population and as a logarithmic of the country share. This later indicator is supposed to grasp the size effect.
Financial facilitation reflects to various aspect of finance that fuels matchmaking startups, makes possible financial transactions via the internet as well as providing platforms for financial source providers and users. From the user side, we apply four World Bank related indicators as Debit/credit card average, Used the internet to pay bills or to buy something online, used a mobile phone or the internet to access a financial institution account, Made or received digital payments. For the agent side we rely on three indicators, the Depth of Capital Market Sub-Index Score from The Venture Capital and Private Equity Country Attractiveness Index, the standardized number of Fintech companies based on Deal room data, and Venture capital availability from WEF.
Digital Technology Entrepreneurship “(…) is comprised of various third-party agents that partake in experimentation, entrepreneurial innovation, and value creation using hardware/software to build products that connect to platforms” (Song 2019, p.9).
Digital adaptation aims to detect the basic capabilities of entrepreneurial agents to use digital technologies. From the agent side, we use two proxies, one for measuring the level of digitalization by computer software spending and another for the quantifying the basic talents in the country (skills of the workforce)
The Digital absorption pillar involves the advanced capabilities of the agents to be able to build new business models and/or digital products/services based on the opportunities provided by the digital technology. The digital technology component is captured by two indicators: The number of data centers from Data Centers catalog and the Availability of latest technology from WEF. The agent component is measured by a complex variable that is the knowledge absorption capacity sub-index and by two indicators reflecting to the effect of ICT on new business and organizational models. All data are from the Global Innovation Index.
The Technology transfer pillar includes the knowledge spillover effect when agents are working on the discovery, evaluation, and exploitation of new opportunities brought about by evolving technologies. From the agent side, the tech transfer capability is proxied by a Startupranking based indicator that is the number of startups. The skill component is measured by the High-level skills which is a complex sub-index from the Global Talent Competitiveness Report. From the digital technology part, we use two components one is from the Global Innovation index that is the Knowledge and technology output and a similar component from the Global Competitiveness Index that is the Innovation capacity.
The full description of the applied 61 indicators and their sources can be found in the Appendix.
10
Measurement – Calculating of the DPE index and the components scores According to the model pictured in Figure 1, and detailed out in Figure 2, we suggest a five-level composite indicator building following as (1) indicators (2) variables, (3) pillars, (4) sub-indices, and (5) the super-index. The super index is called the Digital Platform Economy index and its sub-indices are the four frameworks. The twelve components are called pillars. Pillars are the most important constituents of the model. Pillars are comprised from 24 variables, representing digital ecosystem (12) and entrepreneurship ecosystem (12). Variables are built from 61 indicators that are the elementary building blocks of DPE index. Indicator selection was based on three criteria:
1. Relevance of the indicator for the phenomenon we aim to measure 2. Specificity of the variable to the phenomenon it represents 3. Potentially flawless and clear interpretation of the indicator
We also aimed to have the indicator available for at least 90% of the countries, but in five cases, we could not reach this goal. For 85 countries more than 95.1%, for 23 countries 90.1-95.0%, and for 8 countries 80.1-90.0% of the indicators are available. The results for these eight countries – Benin, Burundi, Hong Kong, Jamaica, Macedonia, Madagascar, Namibia, Taiwan – should be viewed with precaution. Variables were calculated from normalized indicator scores. Following the Global Entrepreneurship Index building methodology we provide the most important steps of calculation (Acs et al 2014). All pillars contain two types of variables: One is representing the Digital Ecosystem (Digital technology and Users) and the other representing the Entrepreneurship Ecosystem (Institutions and Agents). The overall influence of these two types of variables is captured by multiplying the two components:
𝐷𝑃𝐸_𝑝𝑖𝑙𝑙𝑎𝑟𝑖,𝑗 = 𝐷𝐸_𝑣𝑎𝑟𝑖𝑎𝑏𝑙𝑒𝑖,𝑗 ∗ 𝐸𝐸_𝑣𝑎𝑟𝑖𝑎𝑏𝑙𝑒𝑖,𝑗 (1)
where i=1……n, the number of countries
DPE_pillari,j represents the digital entrepreneurship ecosystem pillars, j= 1,…..12 DE_pillari,j represents the digital ecosystem pillars, j= 1,…..12 EE_pillari,j represents the entrepreneurship ecosystem pillars, j= 1,…..12
After the calculation of the raw pillar scores we normalized them using the distance methodology:
𝐷𝑃𝐸_𝑝𝑖𝑙𝑙𝑎𝑟(𝑛𝑜𝑟𝑚)𝑖,𝑗 =𝐷𝑃𝐸_𝑝𝑖𝑙𝑙𝑎𝑟𝑖,𝑗
max 𝐷𝑃𝐸_𝑝𝑖𝑙𝑙𝑎𝑟𝑖,𝑗 (2)
for all j= 1 ... 12, the number of pillars
where 𝐷𝑃𝐸_𝑝𝑖𝑙𝑙𝑎𝑟(𝑛𝑜𝑟𝑚)𝑖,𝑘 is the normalized score value for country i and pillar j
𝑚𝑎𝑥 DPE_pillar 𝑝𝑖,𝑗 is the maximum value for pillar j
When we calculate the normalized averages of the twelve pillars for the 116 countries, it ranges from 0.153 (Matchmaking) to 0.525 (Digital rights) with 0.361 overall average value. The different averages of the normalized values of the pillars imply that reaching the same pillar values requires different efforts and resources. Consequently, the effect of additional resources to achieve the same marginal improvement of the pillar values is different and it is problematic for using the pillar values to public policy purposes. The Average pillar adjustment methodology developed by Acs, Autio and Szerb (2014) reduces but not fully eliminates this problem.

11
The following equations (3a-3c) show the calculation steps. First, we calculate the average value of the j=12 pillar:
𝐷𝑃𝐸_𝑝𝑖𝑙𝑙𝑎𝑟(𝑛𝑜𝑟𝑚)̅̅ ̅̅ ̅̅ ̅̅ ̅̅ ̅̅ ̅̅ ̅̅ ̅̅ ̅̅ ̅̅ ̅̅ ̅j =
∑ DPE_pillar(norm)ni=1 i,j
n for all j (3a)
where DPE_pillar(norm)̅̅ ̅̅ ̅̅ ̅̅ ̅̅ ̅̅ ̅̅ ̅̅ ̅̅ ̅̅ ̅̅ ̅j is the average value of all j=12 normalized pillars
We want to transform the DPE_pillar(norm)i,j values such that the potential values to be in the [0,1] range.
𝐷𝑃𝐸_𝑝𝑖𝑙𝑙𝑎𝑟(𝑒𝑞𝑢𝑎𝑙)i,j = DPE_pillar(norm)i,jt (3b)
where t is the “strength of adjustment”, the t-th moment of DEE_pillar(norm)j is exactly the needed average,
DPE_pillar(equal̅̅ ̅̅ ̅̅ ̅̅ ̅̅ ̅̅ ̅̅ ̅̅ ̅̅ ̅̅ ̅̅ )j
We have to find the root of the following equation for t:
∑ DPE_pillar(norm)I,jt − nDPE_pillar(equal)̅̅ ̅̅ ̅̅ ̅̅ ̅̅ ̅̅ ̅̅ ̅̅ ̅̅ ̅̅ ̅̅ ̅
j = 0ni=1 (3c)
For solution, the Newton-Raphson method is used with an initial guess of 0. After obtaining t, the computations are straightforward. After these transformations, the penalty for bottleneck methodology was used to create pillar-adjusted PFB values. A bottleneck is defined as the worst performing pillar or a limiting constraint in a particular country’s digital entrepreneurship system. Here, bottleneck is defined as the lowest level of a particular pillar, relative to other pillars in a particular country. This notion of a bottleneck is important for policy purposes considering the systemic nature of DEE. The system perspective means that that pillars have an effect to one another. This interaction should be included in the calculation of the pillar, the sub-index and the DPE index scores. We consider the system being optimal if all the average adjusted pillar scores are the same for the particular country. Differences imply non-optimal use of the resources. Practically it means that after equalizing the pillar averages, the value of each pillar of a country is penalized by linking it to the score of the pillar with the weakest scores in that country. This simulates the notion of a bottleneck; if the weakest pillar were improved, the whole DPE Index would show a significant improvement. We define our penalty function following as:
DPE_penalized(i),j = 100 ∗ min DPE_pillar(equal)(i),j + (1 − e−(y(i)j−min DPE_pillar(equal)(i),j)) (4)
where DPE_penalizedi,j is the modified, post-penalty value of pillar j in country i
DPE_pillar(equal)i,j is the normalized value of index component j in country i
DPE_pillar(equal)min is the lowest value of yi,j for country i.
i = 1, 2,……116 = the number of countries j= 1, 2,.……12= the number of pillars
Note, that the multiplication by 100 is purely practical to get a 0–100-point scale instead of the 0–1 range. Sub-index calculation is simple, just taking the arithmetic average of its PFB-adjusted pillars for that sub-index.
12
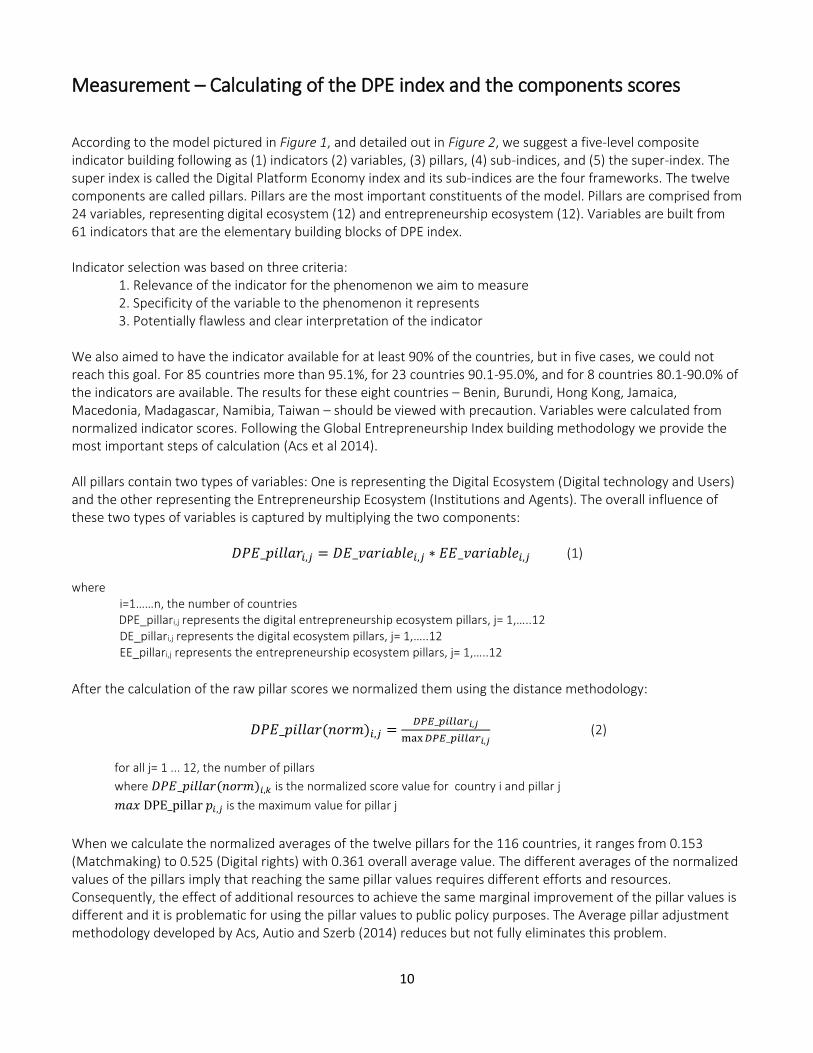
𝐷𝐼𝐺𝑖 = ∑ 𝐷𝑃𝐸_𝑝𝑒𝑛𝑎𝑙𝑖𝑧𝑒𝑑𝑗
33𝑗=1 (5a)
𝐷𝑈𝐶𝑖 = ∑ 𝐷𝑃𝐸_𝑝𝑒𝑛𝑎𝑙𝑖𝑧𝑒𝑑𝑗
36𝑗=4 (5b)
𝐷𝑀𝑆𝑃𝑖 = ∑ 𝐷𝑃𝐸_𝑝𝑒𝑛𝑎𝑙𝑖𝑧𝑒𝑑𝑗
39𝑗=7 (5c)
𝐷𝑇𝐸𝑖 = ∑ 𝐷𝑃𝐸_𝑝𝑒𝑛𝑎𝑙𝑖𝑧𝑒𝑑𝑗
312𝑗=10 (5d)
where 𝐷𝐼𝐺𝑖 = Digital Technology Infrastructure score for country i 𝐷𝑈𝐶𝑖 = Digital User Citizenship score for country i 𝐷𝑀𝑆𝑃𝑖 = Digital Multi-sided Platform score for country i, and 𝐷𝑇𝐸𝑖 = Digital Technology Entrepreneurship score for country i
Finally, the Digital Platform Economy index (DPE) score is calculated as the simple arithmetic average of the four sub-indices.
𝐷𝑃𝐸𝑖 =1
4(𝐷𝐼𝐺𝑖 + 𝐷𝑈𝐶𝑖 + 𝐷𝑀𝑆𝑃𝑖 + 𝐷𝑇𝐸𝑖) (6)
Where DPEi is the Digital Platform Economy index score for country i.
We have done the basic tests for consistency of the composite indicator components. The Cronbach alpha values for the four sub-indices are in an acceptable range: for DUC=0.93, for DIG=0.84, for DMSP=0.92 and for DTE=0.93.
13
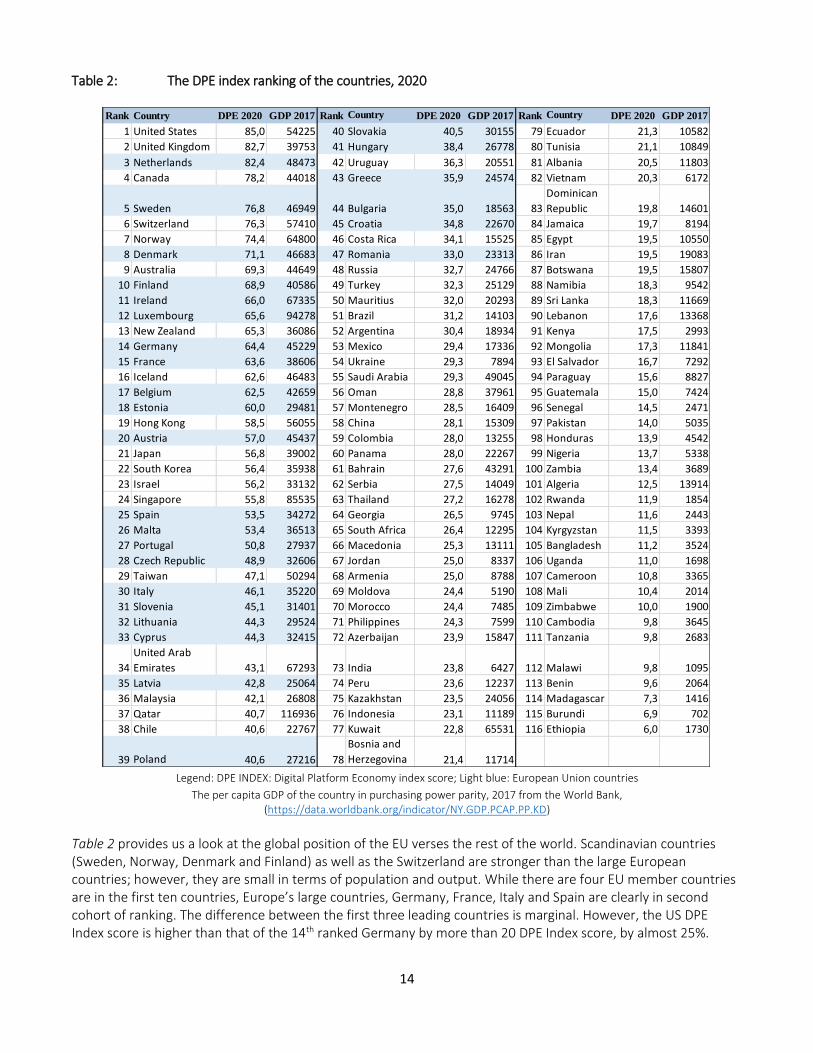
Basic analysis – Country rankings and clustering In this section, we provide a basic analysis of digital entrepreneurship called index for 116 countries from all continents and all development stages. First, we present the DPE Index scores ranking of the 116 country in Table 2. According to Table 2, the United States leads the DPE Index 2020 ranking with 85.0 score followed by the United Kingdom (82.7), and the Netherlands (82.4). In the first ten countries there are two from North America (US and Canada), seven from Europe (UK, Netherland, Sweden, Switzerland, Norway, Denmark and Finland) and there is only one Asian country, the ninths ranked Australia. The second ten countries, ranked at the 11-20 places, show a similar regional distribution: Besides eight European countries – Ireland, Luxemburg, Germany, France, Iceland, Belgium, Estonia, and Austria there are New Zealand and Hong Kong. All of these countries are highly developed, innovation driven economies. In contrast, the last ten places (107-116) there are low developed, resource driven countries mainly from the African continent with the exception of Cambodia.
14
Table 2: The DPE index ranking of the countries, 2020
Legend: DPE INDEX: Digital Platform Economy index score; Light blue: European Union countries
The per capita GDP of the country in purchasing power parity, 2017 from the World Bank, (https://data.worldbank.org/indicator/NY.GDP.PCAP.PP.KD)
Table 2 provides us a look at the global position of the EU verses the rest of the world. Scandinavian countries (Sweden, Norway, Denmark and Finland) as well as the Switzerland are stronger than the large European countries; however, they are small in terms of population and output. While there are four EU member countries are in the first ten countries, Europe’s large countries, Germany, France, Italy and Spain are clearly in second cohort of ranking. The difference between the first three leading countries is marginal. However, the US DPE Index score is higher than that of the 14th ranked Germany by more than 20 DPE Index score, by almost 25%.
Rank Country DPE 2020 GDP 2017 Rank Country DPE 2020 GDP 2017 Rank Country DPE 2020 GDP 2017
1 United States 85,0 54225 40 Slovakia 40,5 30155 79 Ecuador 21,3 10582
2 United Kingdom 82,7 39753 41 Hungary 38,4 26778 80 Tunisia 21,1 10849
3 Netherlands 82,4 48473 42 Uruguay 36,3 20551 81 Albania 20,5 11803
4 Canada 78,2 44018 43 Greece 35,9 24574 82 Vietnam 20,3 6172
5 Sweden 76,8 46949 44 Bulgaria 35,0 18563 83
Dominican
Republic 19,8 14601
6 Switzerland 76,3 57410 45 Croatia 34,8 22670 84 Jamaica 19,7 8194
7 Norway 74,4 64800 46 Costa Rica 34,1 15525 85 Egypt 19,5 10550
8 Denmark 71,1 46683 47 Romania 33,0 23313 86 Iran 19,5 19083
9 Australia 69,3 44649 48 Russia 32,7 24766 87 Botswana 19,5 15807
10 Finland 68,9 40586 49 Turkey 32,3 25129 88 Namibia 18,3 9542
11 Ireland 66,0 67335 50 Mauritius 32,0 20293 89 Sri Lanka 18,3 11669
12 Luxembourg 65,6 94278 51 Brazil 31,2 14103 90 Lebanon 17,6 13368
13 New Zealand 65,3 36086 52 Argentina 30,4 18934 91 Kenya 17,5 2993
14 Germany 64,4 45229 53 Mexico 29,4 17336 92 Mongolia 17,3 11841
15 France 63,6 38606 54 Ukraine 29,3 7894 93 El Salvador 16,7 7292
16 Iceland 62,6 46483 55 Saudi Arabia 29,3 49045 94 Paraguay 15,6 8827
17 Belgium 62,5 42659 56 Oman 28,8 37961 95 Guatemala 15,0 7424
18 Estonia 60,0 29481 57 Montenegro 28,5 16409 96 Senegal 14,5 2471
19 Hong Kong 58,5 56055 58 China 28,1 15309 97 Pakistan 14,0 5035
20 Austria 57,0 45437 59 Colombia 28,0 13255 98 Honduras 13,9 4542
21 Japan 56,8 39002 60 Panama 28,0 22267 99 Nigeria 13,7 5338
22 South Korea 56,4 35938 61 Bahrain 27,6 43291 100 Zambia 13,4 3689
23 Israel 56,2 33132 62 Serbia 27,5 14049 101 Algeria 12,5 13914
24 Singapore 55,8 85535 63 Thailand 27,2 16278 102 Rwanda 11,9 1854
25 Spain 53,5 34272 64 Georgia 26,5 9745 103 Nepal 11,6 2443
26 Malta 53,4 36513 65 South Africa 26,4 12295 104 Kyrgyzstan 11,5 3393
27 Portugal 50,8 27937 66 Macedonia 25,3 13111 105 Bangladesh 11,2 3524
28 Czech Republic 48,9 32606 67 Jordan 25,0 8337 106 Uganda 11,0 1698
29 Taiwan 47,1 50294 68 Armenia 25,0 8788 107 Cameroon 10,8 3365
30 Italy 46,1 35220 69 Moldova 24,4 5190 108 Mali 10,4 2014
31 Slovenia 45,1 31401 70 Morocco 24,4 7485 109 Zimbabwe 10,0 1900
32 Lithuania 44,3 29524 71 Philippines 24,3 7599 110 Cambodia 9,8 3645
33 Cyprus 44,3 32415 72 Azerbaijan 23,9 15847 111 Tanzania 9,8 2683
34
United Arab
Emirates 43,1 67293 73 India 23,8 6427 112 Malawi 9,8 1095
35 Latvia 42,8 25064 74 Peru 23,6 12237 113 Benin 9,6 2064
36 Malaysia 42,1 26808 75 Kazakhstan 23,5 24056 114 Madagascar 7,3 1416
37 Qatar 40,7 116936 76 Indonesia 23,1 11189 115 Burundi 6,9 702
38 Chile 40,6 22767 77 Kuwait 22,8 65531 116 Ethiopia 6,0 1730
39 Poland 40,6 27216 78
Bosnia and
Herzegovina 21,4 11714
15
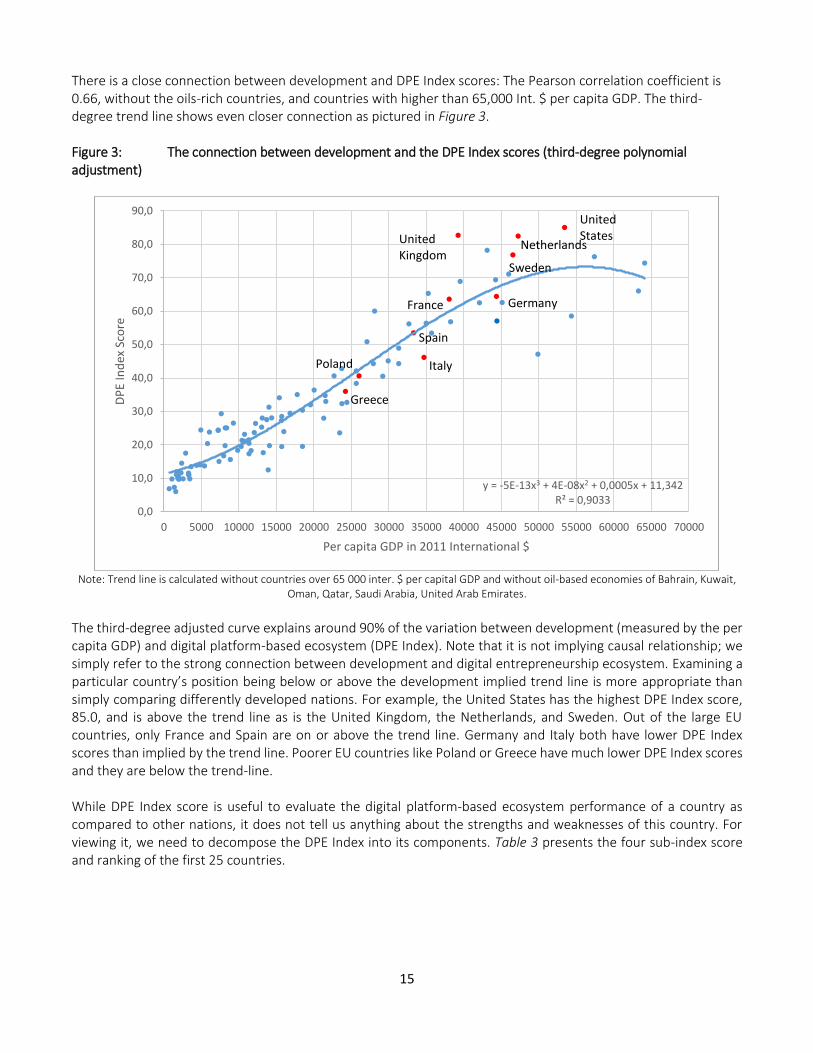
There is a close connection between development and DPE Index scores: The Pearson correlation coefficient is 0.66, without the oils-rich countries, and countries with higher than 65,000 Int. $ per capita GDP. The third-degree trend line shows even closer connection as pictured in Figure 3. Figure 3: The connection between development and the DPE Index scores (third-degree polynomial adjustment)
Note: Trend line is calculated without countries over 65 000 inter. $ per capital GDP and without oil-based economies of Bahrain, Kuwait,
Oman, Qatar, Saudi Arabia, United Arab Emirates.
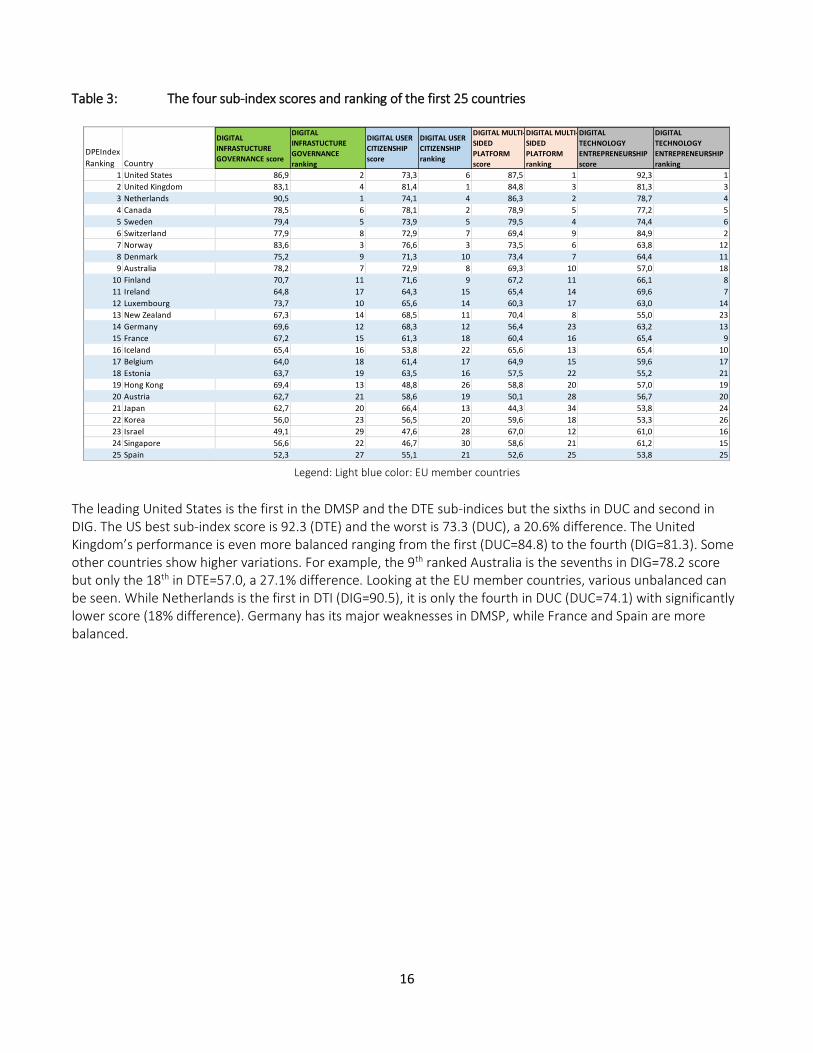
The third-degree adjusted curve explains around 90% of the variation between development (measured by the per capita GDP) and digital platform-based ecosystem (DPE Index). Note that it is not implying causal relationship; we simply refer to the strong connection between development and digital entrepreneurship ecosystem. Examining a particular country’s position being below or above the development implied trend line is more appropriate than simply comparing differently developed nations. For example, the United States has the highest DPE Index score, 85.0, and is above the trend line as is the United Kingdom, the Netherlands, and Sweden. Out of the large EU countries, only France and Spain are on or above the trend line. Germany and Italy both have lower DPE Index scores than implied by the trend line. Poorer EU countries like Poland or Greece have much lower DPE Index scores and they are below the trend-line. While DPE Index score is useful to evaluate the digital platform-based ecosystem performance of a country as compared to other nations, it does not tell us anything about the strengths and weaknesses of this country. For viewing it, we need to decompose the DPE Index into its components. Table 3 presents the four sub-index score and ranking of the first 25 countries.
y = -5E-13x3 + 4E-08x2 + 0,0005x + 11,342R² = 0,9033
0,0
10,0
20,0
30,0
40,0
50,0
60,0
70,0
80,0
90,0
0 5000 10000 15000 20000 25000 30000 35000 40000 45000 50000 55000 60000 65000 70000
DP
EIn
dex
Sco
re
Per capita GDP in 2011 International $
United Kingdom
Spain
Netherlands
Germany
Greece
Sweden
United States
Poland Italy
France
16
Table 3: The four sub-index scores and ranking of the first 25 countries
Legend: Light blue color: EU member countries
The leading United States is the first in the DMSP and the DTE sub-indices but the sixths in DUC and second in DIG. The US best sub-index score is 92.3 (DTE) and the worst is 73.3 (DUC), a 20.6% difference. The United Kingdom’s performance is even more balanced ranging from the first (DUC=84.8) to the fourth (DIG=81.3). Some other countries show higher variations. For example, the 9th ranked Australia is the sevenths in DIG=78.2 score but only the 18th in DTE=57.0, a 27.1% difference. Looking at the EU member countries, various unbalanced can be seen. While Netherlands is the first in DTI (DIG=90.5), it is only the fourth in DUC (DUC=74.1) with significantly lower score (18% difference). Germany has its major weaknesses in DMSP, while France and Spain are more balanced.
DPEIndex
Ranking Country
DIGITAL
INFRASTUCTURE
GOVERNANCE score
DIGITAL
INFRASTUCTURE
GOVERNANCE
ranking
DIGITAL USER
CITIZENSHIP
score
DIGITAL USER
CITIZENSHIP
ranking
DIGITAL MULTI-
SIDED
PLATFORM
score
DIGITAL MULTI-
SIDED
PLATFORM
ranking
DIGITAL
TECHNOLOGY
ENTREPRENEURSHIP
score
DIGITAL
TECHNOLOGY
ENTREPRENEURSHIP
ranking
1 United States 86,9 2 73,3 6 87,5 1 92,3 1
2 United Kingdom 83,1 4 81,4 1 84,8 3 81,3 3
3 Netherlands 90,5 1 74,1 4 86,3 2 78,7 4
4 Canada 78,5 6 78,1 2 78,9 5 77,2 5
5 Sweden 79,4 5 73,9 5 79,5 4 74,4 6
6 Switzerland 77,9 8 72,9 7 69,4 9 84,9 2
7 Norway 83,6 3 76,6 3 73,5 6 63,8 12
8 Denmark 75,2 9 71,3 10 73,4 7 64,4 11
9 Australia 78,2 7 72,9 8 69,3 10 57,0 18
10 Finland 70,7 11 71,6 9 67,2 11 66,1 8
11 Ireland 64,8 17 64,3 15 65,4 14 69,6 7
12 Luxembourg 73,7 10 65,6 14 60,3 17 63,0 14
13 New Zealand 67,3 14 68,5 11 70,4 8 55,0 23
14 Germany 69,6 12 68,3 12 56,4 23 63,2 13
15 France 67,2 15 61,3 18 60,4 16 65,4 9
16 Iceland 65,4 16 53,8 22 65,6 13 65,4 10
17 Belgium 64,0 18 61,4 17 64,9 15 59,6 17
18 Estonia 63,7 19 63,5 16 57,5 22 55,2 21
19 Hong Kong 69,4 13 48,8 26 58,8 20 57,0 19
20 Austria 62,7 21 58,6 19 50,1 28 56,7 20
21 Japan 62,7 20 66,4 13 44,3 34 53,8 24
22 Korea 56,0 23 56,5 20 59,6 18 53,3 26
23 Israel 49,1 29 47,6 28 67,0 12 61,0 16
24 Singapore 56,6 22 46,7 30 58,6 21 61,2 15
25 Spain 52,3 27 55,1 21 52,6 25 53,8 25
17
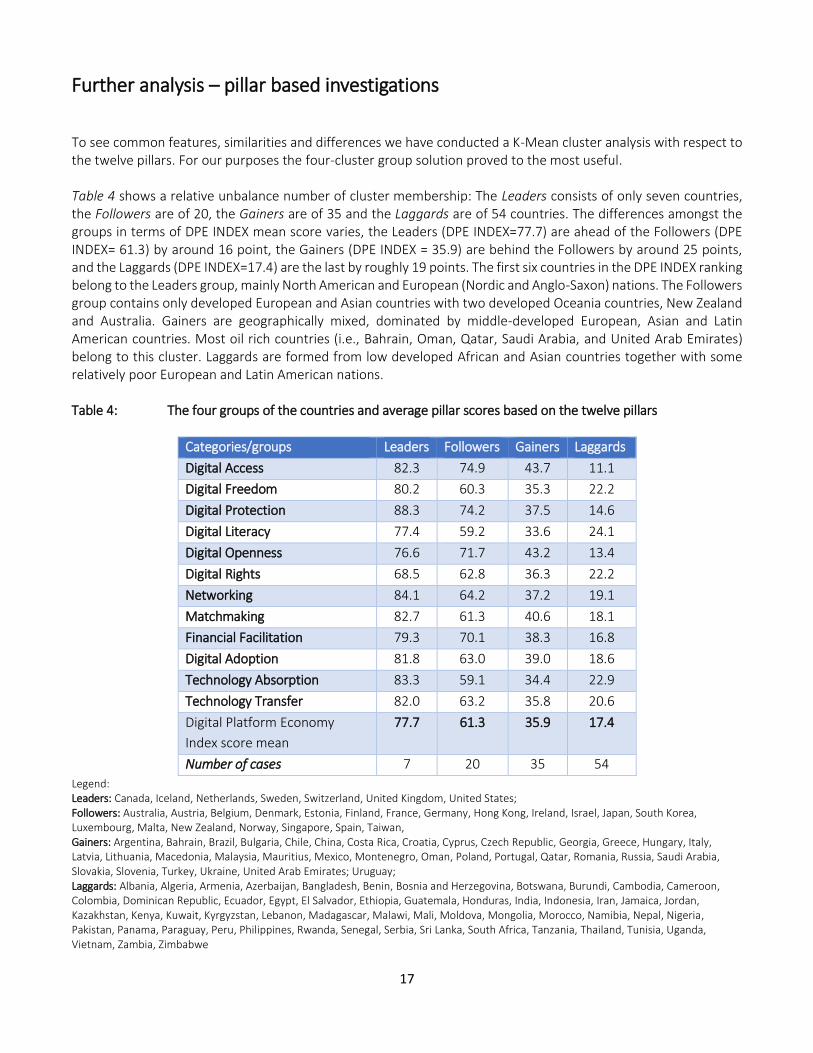
Further analysis – pillar based investigations To see common features, similarities and differences we have conducted a K-Mean cluster analysis with respect to the twelve pillars. For our purposes the four-cluster group solution proved to the most useful. Table 4 shows a relative unbalance number of cluster membership: The Leaders consists of only seven countries, the Followers are of 20, the Gainers are of 35 and the Laggards are of 54 countries. The differences amongst the groups in terms of DPE INDEX mean score varies, the Leaders (DPE INDEX=77.7) are ahead of the Followers (DPE INDEX= 61.3) by around 16 point, the Gainers (DPE INDEX = 35.9) are behind the Followers by around 25 points, and the Laggards (DPE INDEX=17.4) are the last by roughly 19 points. The first six countries in the DPE INDEX ranking belong to the Leaders group, mainly North American and European (Nordic and Anglo-Saxon) nations. The Followers group contains only developed European and Asian countries with two developed Oceania countries, New Zealand and Australia. Gainers are geographically mixed, dominated by middle-developed European, Asian and Latin American countries. Most oil rich countries (i.e., Bahrain, Oman, Qatar, Saudi Arabia, and United Arab Emirates) belong to this cluster. Laggards are formed from low developed African and Asian countries together with some relatively poor European and Latin American nations. Table 4: The four groups of the countries and average pillar scores based on the twelve pillars
Categories/groups Leaders Followers Gainers Laggards
Digital Access 82.3 74.9 43.7 11.1
Digital Freedom 80.2 60.3 35.3 22.2
Digital Protection 88.3 74.2 37.5 14.6
Digital Literacy 77.4 59.2 33.6 24.1
Digital Openness 76.6 71.7 43.2 13.4
Digital Rights 68.5 62.8 36.3 22.2
Networking 84.1 64.2 37.2 19.1
Matchmaking 82.7 61.3 40.6 18.1
Financial Facilitation 79.3 70.1 38.3 16.8
Digital Adoption 81.8 63.0 39.0 18.6
Technology Absorption 83.3 59.1 34.4 22.9
Technology Transfer 82.0 63.2 35.8 20.6
Digital Platform Economy
Index score mean
77.7 61.3 35.9 17.4
Number of cases 7 20 35 54
Legend: Leaders: Canada, Iceland, Netherlands, Sweden, Switzerland, United Kingdom, United States; Followers: Australia, Austria, Belgium, Denmark, Estonia, Finland, France, Germany, Hong Kong, Ireland, Israel, Japan, South Korea, Luxembourg, Malta, New Zealand, Norway, Singapore, Spain, Taiwan, Gainers: Argentina, Bahrain, Brazil, Bulgaria, Chile, China, Costa Rica, Croatia, Cyprus, Czech Republic, Georgia, Greece, Hungary, Italy, Latvia, Lithuania, Macedonia, Malaysia, Mauritius, Mexico, Montenegro, Oman, Poland, Portugal, Qatar, Romania, Russia, Saudi Arabia, Slovakia, Slovenia, Turkey, Ukraine, United Arab Emirates; Uruguay; Laggards: Albania, Algeria, Armenia, Azerbaijan, Bangladesh, Benin, Bosnia and Herzegovina, Botswana, Burundi, Cambodia, Cameroon, Colombia, Dominican Republic, Ecuador, Egypt, El Salvador, Ethiopia, Guatemala, Honduras, India, Indonesia, Iran, Jamaica, Jordan, Kazakhstan, Kenya, Kuwait, Kyrgyzstan, Lebanon, Madagascar, Malawi, Mali, Moldova, Mongolia, Morocco, Namibia, Nepal, Nigeria, Pakistan, Panama, Paraguay, Peru, Philippines, Rwanda, Senegal, Serbia, Sri Lanka, South Africa, Tanzania, Thailand, Tunisia, Uganda, Vietnam, Zambia, Zimbabwe
18
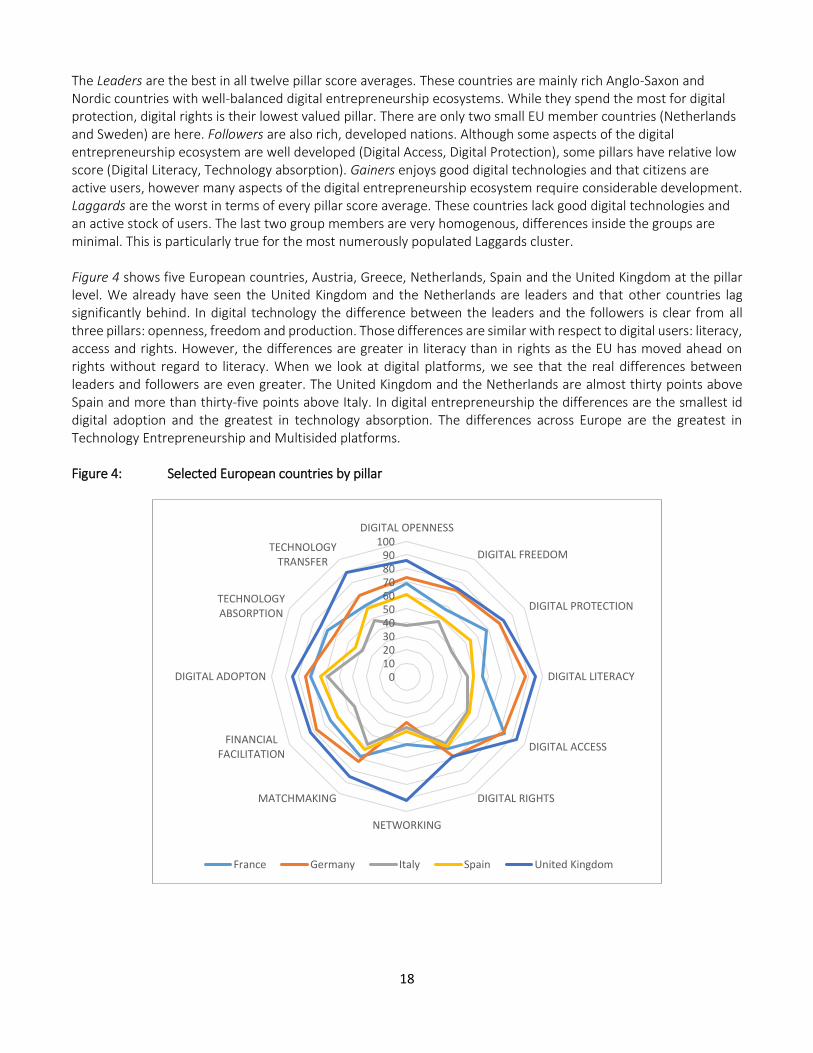
The Leaders are the best in all twelve pillar score averages. These countries are mainly rich Anglo-Saxon and Nordic countries with well-balanced digital entrepreneurship ecosystems. While they spend the most for digital protection, digital rights is their lowest valued pillar. There are only two small EU member countries (Netherlands and Sweden) are here. Followers are also rich, developed nations. Although some aspects of the digital entrepreneurship ecosystem are well developed (Digital Access, Digital Protection), some pillars have relative low score (Digital Literacy, Technology absorption). Gainers enjoys good digital technologies and that citizens are active users, however many aspects of the digital entrepreneurship ecosystem require considerable development. Laggards are the worst in terms of every pillar score average. These countries lack good digital technologies and an active stock of users. The last two group members are very homogenous, differences inside the groups are minimal. This is particularly true for the most numerously populated Laggards cluster. Figure 4 shows five European countries, Austria, Greece, Netherlands, Spain and the United Kingdom at the pillar level. We already have seen the United Kingdom and the Netherlands are leaders and that other countries lag significantly behind. In digital technology the difference between the leaders and the followers is clear from all three pillars: openness, freedom and production. Those differences are similar with respect to digital users: literacy, access and rights. However, the differences are greater in literacy than in rights as the EU has moved ahead on rights without regard to literacy. When we look at digital platforms, we see that the real differences between leaders and followers are even greater. The United Kingdom and the Netherlands are almost thirty points above Spain and more than thirty-five points above Italy. In digital entrepreneurship the differences are the smallest id digital adoption and the greatest in technology absorption. The differences across Europe are the greatest in Technology Entrepreneurship and Multisided platforms. Figure 4: Selected European countries by pillar
0102030405060708090
100DIGITAL OPENNESS
DIGITAL FREEDOM
DIGITAL PROTECTION
DIGITAL LITERACY
DIGITAL ACCESS
DIGITAL RIGHTS
NETWORKING
MATCHMAKING
FINANCIALFACILITATION
DIGITAL ADOPTON
TECHNOLOGYABSORPTION
TECHNOLOGYTRANSFER
France Germany Italy Spain United Kingdom

19
Basic DPE Index policy suggestions – DPE Index trend line and Digital Ecosystem-Entrepreneurship Ecosystem difference analysis Figure 5 shows the grouping the 116 countries into four quadrants. On the horizontal axis is the difference between the DPE Index trend-line and the actual DPE Index score in percentages. The DPE INDEX trend-line calculation is based on the per capita GDP. The DPE Index trend-line represent the best fit power function according to the following equation:
GDP per capita = -5E (-13)*DPE Index3 + 4E (-08)DPE Index2 + 0.0005*DPE Index + 11.34 (7) Countries above zero have higher digital entrepreneurship ecosystem development then implied by its per capita GDP (Quadrants I and IV). Countries below zero have lower digital entrepreneurship ecosystem development then implied by the trend-line (Quadrants II and III). For countries, significantly below the trend-line (by rule of thumbs the 10% threshold is selected) is suggested to increase more on the development of the digital entrepreneurship ecosystem. Caution is advised if the DE is somewhere between 5%-10% range. Figure 5: The four groups of countries based on the difference between DE and EE scores and the deviation from development implied trend-line.
On the vertical axis, there is the difference between the digital ecosystem (DE) and the Entrepreneurship Ecosystem (EE) scores. Countries in Quadrant I and II have higher DE then EE score. In Quadrants III and IV, countries have higher EE then DE scores. For a balanced development, DE and EE scores should be about the same. If the difference is higher than 10%, resources should be redirected to harmonize the digital and the entrepreneurship ecosystems. If the difference is between 5% and 10%, some resource allocation seems to be reasonable to balance the two ecosystems. So, for countries in Quadrants I and II entrepreneurship ecosystem component development is suggested. For countries in Quadrants III and IV digital ecosystem development is more fruitful. Countries where the DPE Index-DPE Index trend difference is positive and there are within the ten
-30,00%
-25,00%
-20,00%
-15,00%
-10,00%
-5,00%
0,00%
5,00%
10,00%
15,00%
20,00%
25,00%
30,00%
-50% -45% -40% -35% -30% -25% -20% -15% -10% -5% 0% 5% 10% 15% 20% 25% 30% 35% 40% 45% 50%
The
dif
fere
nce
bet
wee
n D
igit
al E
cosy
stem
an
d
Entr
epre
neu
rsh
ip E
cosy
stem
The difference between DPE index and DPE Index trend
I
III IV
II
FranceItaly
Spai
n
GermanyUnited
Kingdom
Greece
20
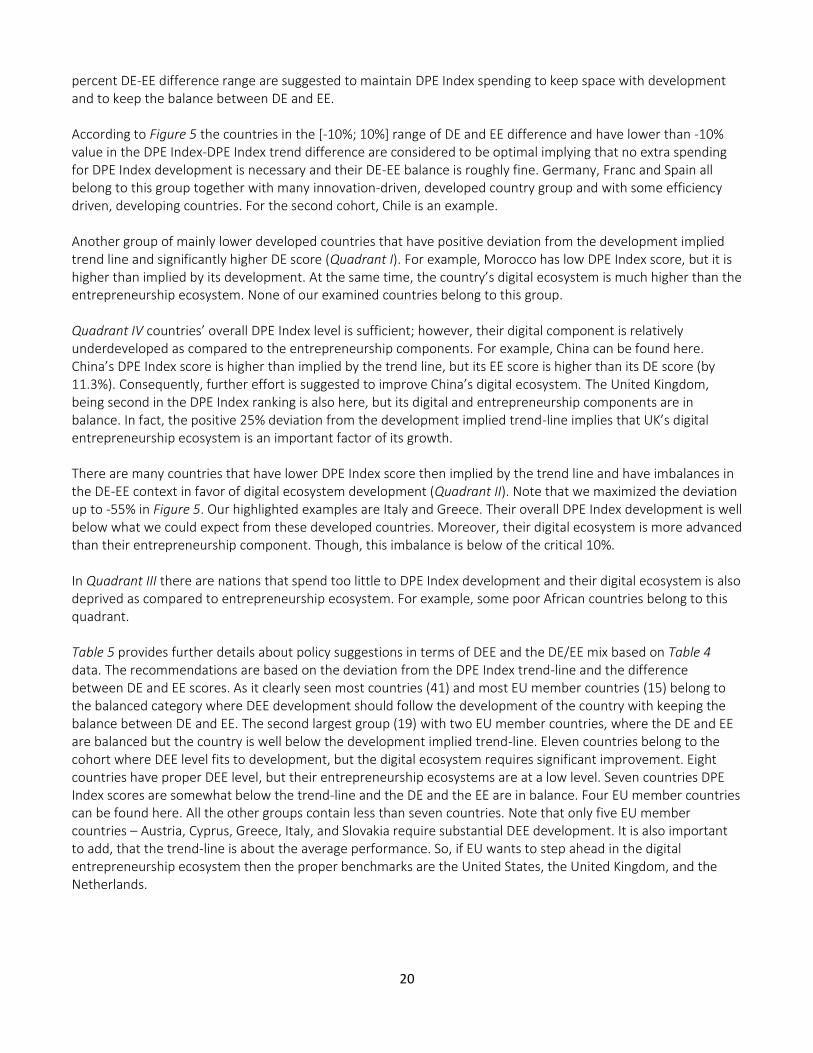
percent DE-EE difference range are suggested to maintain DPE Index spending to keep space with development and to keep the balance between DE and EE. According to Figure 5 the countries in the [-10%; 10%] range of DE and EE difference and have lower than -10% value in the DPE Index-DPE Index trend difference are considered to be optimal implying that no extra spending for DPE Index development is necessary and their DE-EE balance is roughly fine. Germany, Franc and Spain all belong to this group together with many innovation-driven, developed country group and with some efficiency driven, developing countries. For the second cohort, Chile is an example. Another group of mainly lower developed countries that have positive deviation from the development implied trend line and significantly higher DE score (Quadrant I). For example, Morocco has low DPE Index score, but it is higher than implied by its development. At the same time, the country’s digital ecosystem is much higher than the entrepreneurship ecosystem. None of our examined countries belong to this group. Quadrant IV countries’ overall DPE Index level is sufficient; however, their digital component is relatively underdeveloped as compared to the entrepreneurship components. For example, China can be found here. China’s DPE Index score is higher than implied by the trend line, but its EE score is higher than its DE score (by 11.3%). Consequently, further effort is suggested to improve China’s digital ecosystem. The United Kingdom, being second in the DPE Index ranking is also here, but its digital and entrepreneurship components are in balance. In fact, the positive 25% deviation from the development implied trend-line implies that UK’s digital entrepreneurship ecosystem is an important factor of its growth. There are many countries that have lower DPE Index score then implied by the trend line and have imbalances in the DE-EE context in favor of digital ecosystem development (Quadrant II). Note that we maximized the deviation up to -55% in Figure 5. Our highlighted examples are Italy and Greece. Their overall DPE Index development is well below what we could expect from these developed countries. Moreover, their digital ecosystem is more advanced than their entrepreneurship component. Though, this imbalance is below of the critical 10%. In Quadrant III there are nations that spend too little to DPE Index development and their digital ecosystem is also deprived as compared to entrepreneurship ecosystem. For example, some poor African countries belong to this quadrant. Table 5 provides further details about policy suggestions in terms of DEE and the DE/EE mix based on Table 4 data. The recommendations are based on the deviation from the DPE Index trend-line and the difference between DE and EE scores. As it clearly seen most countries (41) and most EU member countries (15) belong to the balanced category where DEE development should follow the development of the country with keeping the balance between DE and EE. The second largest group (19) with two EU member countries, where the DE and EE are balanced but the country is well below the development implied trend-line. Eleven countries belong to the cohort where DEE level fits to development, but the digital ecosystem requires significant improvement. Eight countries have proper DEE level, but their entrepreneurship ecosystems are at a low level. Seven countries DPE Index scores are somewhat below the trend-line and the DE and the EE are in balance. Four EU member countries can be found here. All the other groups contain less than seven countries. Note that only five EU member countries – Austria, Cyprus, Greece, Italy, and Slovakia require substantial DEE development. It is also important to add, that the trend-line is about the average performance. So, if EU wants to step ahead in the digital entrepreneurship ecosystem then the proper benchmarks are the United States, the United Kingdom, and the Netherlands.
21
Table 5: Suggested policy recommendation with respect to DPE Index trend-line deviation, and Digital Ecosystem/Entrepreneurship Ecosystem mix
Legend: Bold letters are the EU member countries
Strong DE
development (DE-EE difference is
below -10%)
Some DE development
(DE-EE difference is between (-5%, -
10%)
Keep balance between DE and EE (DE-EE difference is between
(-5%, 5%)
Some EE development (DE-EE difference is between( 5%, 10%)
Strong EE development (DE-EE difference is
above 10%)
Keep DEE development with GDP
Albania, Bosnia and Herzegovina, Colombia, Honduras, India, Indonesia, Peru, Philippines, Senegal, Ukraine, Vietnam
China, Finland, Jordan Pakistan, South Africa, Switzerland,
Argentina, Armenia, Australia, Bahrain, Belgium, Brazil, Bulgaria, Canada, Chile, Costa Rica, Croatia, Czech Republic, Denmark, Ecuador, Egypt, Estonia, France, Germany, Israel, Jamaica, Kenya, Korea, Lithuania, Luxembourg, Malaysia, Mexico, Montenegro, Netherlands, New Zealand, Norway, Poland, Portugal, Qatar, Singapore, Spain, Sweden, Tunisia, United Arab Emirates, United Kingdom, United States, Zambia
Kuwait, Latvia, Moldova, Saudi Arabia, Thailand
Georgia, Macedonia, Mauritius, Morocco, Oman, Rwanda, Serbia, Uruguay
Some DEE development (deviation from trend-line is 5%-10%)
- Malta El Salvador, Hungary, Iceland, Ireland, Nepal, Romania, Slovenia
Japan, Namibia -
Overall DEE development (deviation from trend-line is over 10%)
Madagascar, Sri Lanka
Austria, Dominican Republic
Azerbaijan, Botswana, Burundi, Cambodia, Cameroon, Cyprus, Ethiopia, Guatemala, Hong Kong, Kazakhstan, Kyrgyzstan, Lebanon, Malawi, Mali, Nigeria, Panama, Slovakia, Taiwan, Turkey
Bangladesh, Greece, Italy, Mongolia, Paraguay, Russia
Algeria, Benin, Iran, Tanzania, Uganda, Zimbabwe
22
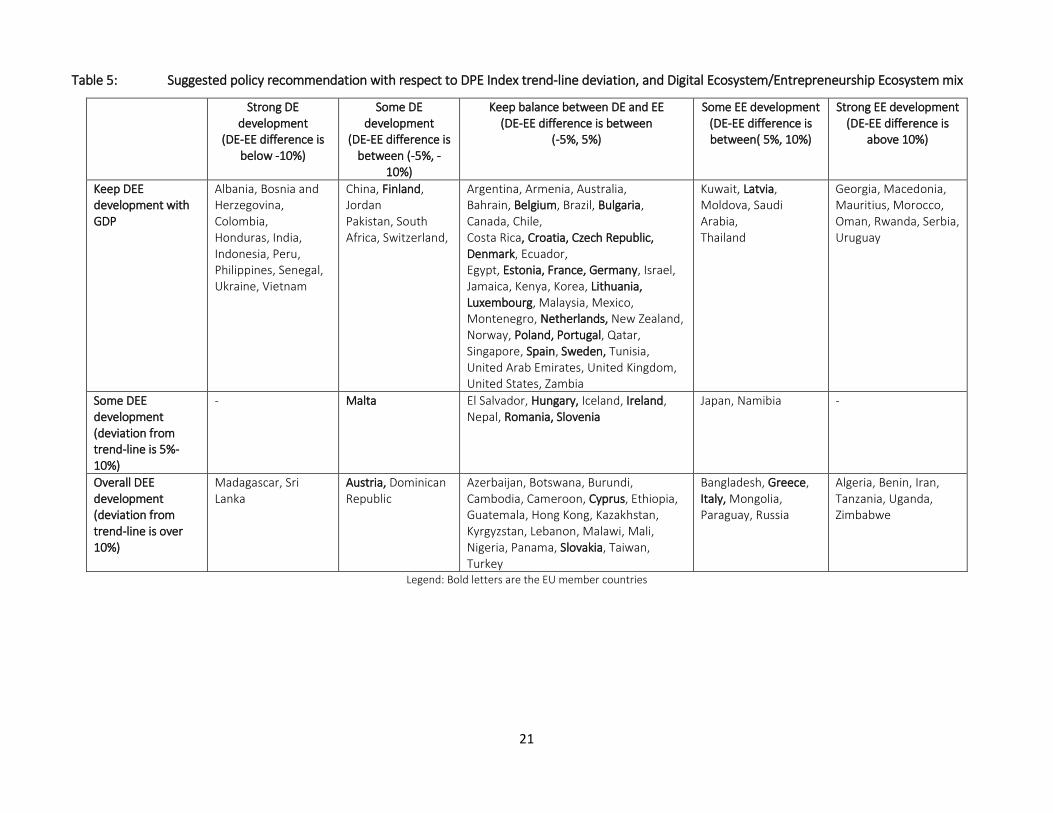
While the DPE Index measures the digital platform-based ecosystem on a country level it is important to see where the most important platform companies reside. Figure 6 shows the top 100 platform company market values. Figure 6: The top 100 platform companies all around the world (June 2020)
Source: https://www.netzoekonom.de/plattform-oekonomie/
It is immediately clear from Figure 6 that two countries the US and China dominate the landscape. The US alone takes more than two-third (68%) of the world platform economy based on the market value of the companies. Second, European platform-based companies play a marginal role having only 3% of the market value. Third, the distribution of the top 100 platform-based companies is uneven; the first fifteen companies take around 75% of the whole market value. Examining further the twelve European platform-based companies, there are one Norwegian, one Russian, two Netherlands, two Swedish, three German and three UK based businesses. Just comparing it to the DPE Index ranking the UK, Netherlands, Sweden and Norway are in the top ten, while Germany is 14th and Russia is 48th. It is immediately clear that strong digital-platform based ecosystem alone is not enough to nurture multi-billion dollar platform-based companies. Country size also seems to matter. Now UK is leaving the EU and the number of top platform-based EU companies narrows down to seven, and out of them only SAP is among the top 15. Perhaps, a more unified EU could provide a more favorable environment for platform-based development.
23
Summary and conclusion Recent digital and information technology revolution has a major impact on entrepreneurship. In particular, platform-based developments contribute to drastically decreasing transaction costs and the appearance of new business models. This Schumpeterian type of organizational innovations has raised trillion dollar worth businesses like Apple, Alphabet, Amazon, Microsoft, or Facebook. Together with others, these platforms provide a fertile field for Kirznerian type of digital entrepreneurs. However, digital entrepreneurs require a different environmental context as compared to non-digital ones. If a country builds out its digital ecosystem there is no guarantee it will be implemented by existing firms. In the same vain if a country builds out its entrepreneurial ecosystem there is no guarantee startups will introduce new technologies. For technology to be successfully introduced, both the digital ecosystem and the entrepreneurial ecosystem need to be developed simultaneously. The digital entrepreneurship ecosystem theory developed by Sussan and Acs (2017) and amended by Song (2019), integrates the entrepreneurship ecosystem and the digital ecosystem concepts. This paper builds on the DEE concept and provides a measurement of it. The Digital Platform Economy Index consist of four sub-indices (i.e., Digital User Citizenship, Digital Technology Infrastructure, Digital Multi-sided Platform and Digital technology Entrepreneurship), twelve pillars (i.e., Digital Access, Digital Freedom, Digital Protection, Digital Literacy, Digital Openness, Digital Rights, Networking, Matchmaking, Financial Facilitation, Digital Adoption, Technology Absorption, and Technology Transfer), and 61 indices. At the global scale, developed Anglo-Saxon and Nordic nations lead the DPE ranking followed by other European, Asian as well as Oceania (i.e., Australia and New Zealand) prosperous countries. Many mid-developed countries from Europe, Asia and Latin America together with some oil rich countries (i.e., Bahrain, Oman, Qatar, Saudi Arabia, and United Arab Emirates) report below average DPE index scores. The group of poor performing countries, in terms of the DPE index, includes underdeveloped African and Asian countries as well as some developing European and Latin American nations. The specific analysis for the EU reveals that for most countries (22 out of 27) are on or above the development implied trend-line; however, they are far from the DPE top performing countries (US and UK), with the exception of the Netherlands. The gap between the US and the large EU member countries like Germany and France is significant, around 25%. Spain, Italy and Poland lag behind the US by more than 35%. It seems that EU’s institutional setup supports more the self-employment type of small business than fast growing billion dollar businesses, that is, the unicorns. Recent regulations, like the General Data Protection Regulation or GDPR, focusing on ensuring that users know, understand, and consent to the data collected about them, are not really helpful and limit not only the existing non-EU businesses but also weaken EU based startups. Other EU investigations against Microsoft, Alphabet/Google or Facebook and other digital giants could only provide temporal protection for EU based platform businesses. Another example is the German auto industry that dominates the world in many respects from the mass market to the luxury market and even the racing world. However, they missed to implement new technologies. It would focus on product improvement that would give it cars that were in some sense over engineered. Hobijn and Jovanovic (2001) suggested that new technologies will not be effectively implemented by existing firms in the absence of: awareness and skills; vintage capital; and vested interests. The German auto industry fits this analysis like a glove. The move of Tesla to Berlin, the digital capital of Europe is an indication that the future of the European auto industry may be with the startup and not the incumbent. If the EU is to survive and prosper, the EU needs to rebalance it digital entrepreneurial ecosystem policy to promote technology innovation, platform companies and create a sustainable platform economy.
24
References Acs, Z. J., Autio, E., & Szerb, L. (2014). National Systems of Entrepreneurship: Measurement issues and policy
implications. Research Policy, 43(3), 476–494. https://doi.org/10.1016/j.respol.2013.08.016
Acs, Zoltan J., Stam, E., Audretsch, D. B., & O’Connor, A. (2017). The lineages of the entrepreneurial ecosystem
approach. Small Business Economics, 49(1), 1–10. https://doi.org/10.1007/s11187-017-9864-8
Autio, E., Szerb, L., Komlosi, E., & Tiszberger, M. (2019). EIDES 2019-The European Index of Digital
Entrepreneurship Systems (No. JRC117495). Joint Research Centre (Seville site).
Autio, E., Szerb, L., Komlosi, E., & Tiszberger, M. (2018). The European index of digital entrepreneurship systems.
Publications Office of the European Union (Ed.), JRC Technical Reports, 153.
Cavallo, A., Ghezzi, A., & Balocco, R. (2018). Entrepreneurial ecosystem research: Present debates and future
directions. International Entrepreneurship and Management Journal. https://doi.org/10.1007/s11365-
018-0526-3
Cusumano, M. A., Gawer, A., & Yoffie, D. B. (2019). The business of platforms: Strategy in the age of digital
competition, innovation, and power. New York, NY: HarperCollins.
Elia, G., Margherita, A., & Passiante, G. (2020). Digital entrepreneurship ecosystem: How digital technologies and
collective intelligence are reshaping the entrepreneurial process. Technological Forecasting and Social
Change, 150, 119791.
Evans, D. S., & Schmalensee, R. (2016). Matchmakers: The new economics of multi-sided platforms. Boston,
Massachusetts: Harvard Business Review Press.
Ferguson, N. (2019). The square and the tower: Networks and power, from the Freemasons to Facebook. Penguin
Books.
Gawer, A. (Ed.). (2009). Platforms, Markets, and Innovation. Cheltenham, UK ; Northampton, MA: Edward Elgar.
Goldfarb, A., &Tucker, C. (2019). Digital Economics. Journal of Economic Literature, 57(1), 3-43.
Gompers, P., & Lerner, J. (2001). The venture capital revolution. Journal of Economic Perspectives, 15(2), 145-168.
Hobijn, B., & Jovanovic, B. (2001). The Information-Technology Revolution and the Stock Market: Evidence.
American Economic Review, 91(5), 1203–1220. https://doi.org/10.1257/aer.91.5.1203
Isenberg, D. J. (2010). How to start an entrepreneurial revolution. Harvard business review, 88(6), 40-50.
Jovanovic, B. (1982). Selection and the Evolution of Industry. Econometrica, 50(3), 649–670.
https://doi.org/10.2307/1912606
Jovanovic, B. (2001). New Technology and The Small Firm. Small Business Economics, 16(1), 53–56.
https://doi.org/10.1023/A:1011132809150
Jullien, B. 2012. “Two-Sided B to B Platforms.” In The Oxford Handbook of the Digital Economy, edited by Martin
Peitz and Joel Waldfogel, 161–85. Oxford and New York: Oxford University Press.
Kenney, M., & Zysman, J. (2016). The rise of the platform economy. Issues in science and technology, 32(3), 61.
Li, W., Badr, Y., & Biennier, F. (2012). Digital ecosystems: challenges and prospects. In proceedings of the
international conference on management of Emergent Digital EcoSystems (pp. 117-122).
Malecki, E. J. (2018). Entrepreneurship and entrepreneurial ecosystems. Geography Compass, 12(3).
https://doi.org/10.1111/gec3.12359
Nambisan, S. (2017). Digital Entrepreneurship: Toward a Digital Technology Perspective of Entrepreneurship.
Entrepreneurship Theory and Practice, 41(6), 1029–1055. https://doi.org/10.1111/etap.12254
Naudé, W. (2016). “Is European Entrepreneurship in Crisis?” IZA Working Paper, DP 9817.

25
Peitz, M., & Waldfogel, J. (Eds.). (2012). The Oxford handbook of the digital economy. Oxford University Press.
Rochet, J.-C., & Tirole, J. (2006). Two-sided markets: A progress report. The RAND Journal of Economics, 37(3),
645–667. https://doi.org/10.1111/j.1756-2171.2006.tb00036.x
Root, H.L. (2020) Network Origins of the Global Economy, Cambridge University Press.
Saadatmand, F., Lindgren, R., & Schultze, U. (2019). Configurations of platform organizations: Implications for
complementor engagement. Research Policy, 48(8), 103770.
https://doi.org/10.1016/j.respol.2019.03.015
Sahut, J.-M., Iandoli, L., & Teulon, F. (2019). The age of digital entrepreneurship. Small Business Economics.
https://doi.org/10.1007/s11187-019-00260-8
Shannon, C. (1948). A Mathemataical Theory of Communication, Bell Systems Technical Journal, 27(3), 379-423.
Song, A. K. (2019). The Digital Entrepreneurial Ecosystem—A critique and reconfiguration. Small Business
Economics, 53(3), 569–590. https://doi.org/10.1007/s11187-019-00232-y
Spigel, B. (2017). The relational organization of entrepreneurial ecosystems. Entrepreneurship Theory and
Practice, 41(1), 49-72.
Stam, E. (2015). Entrepreneurial Ecosystems and Regional Policy: A Sympathetic Critique. European Planning
Studies, 23(9), 1759–1769. https://doi.org/10.1080/09654313.2015.1061484
Szerb, L., Lafuente, E., Horváth, K., & Páger, B. (2019). The relevance of quantity and quality entrepreneurship for
regional performance: the moderating role of the entrepreneurial ecosystem. Regional Studies, 53(9),
1308-1320.
Sussan, F., & Acs, Z. J. (2017). The digital entrepreneurial ecosystem. Small Business Economics, 49(1), 55–73.
https://doi.org/10.1007/s11187-017-9867-5
Weill, P., & Woerner, S. L. (2015). Thriving in an increasingly digital ecosystem. MIT Sloan Management Review,
56(4), 27.
26
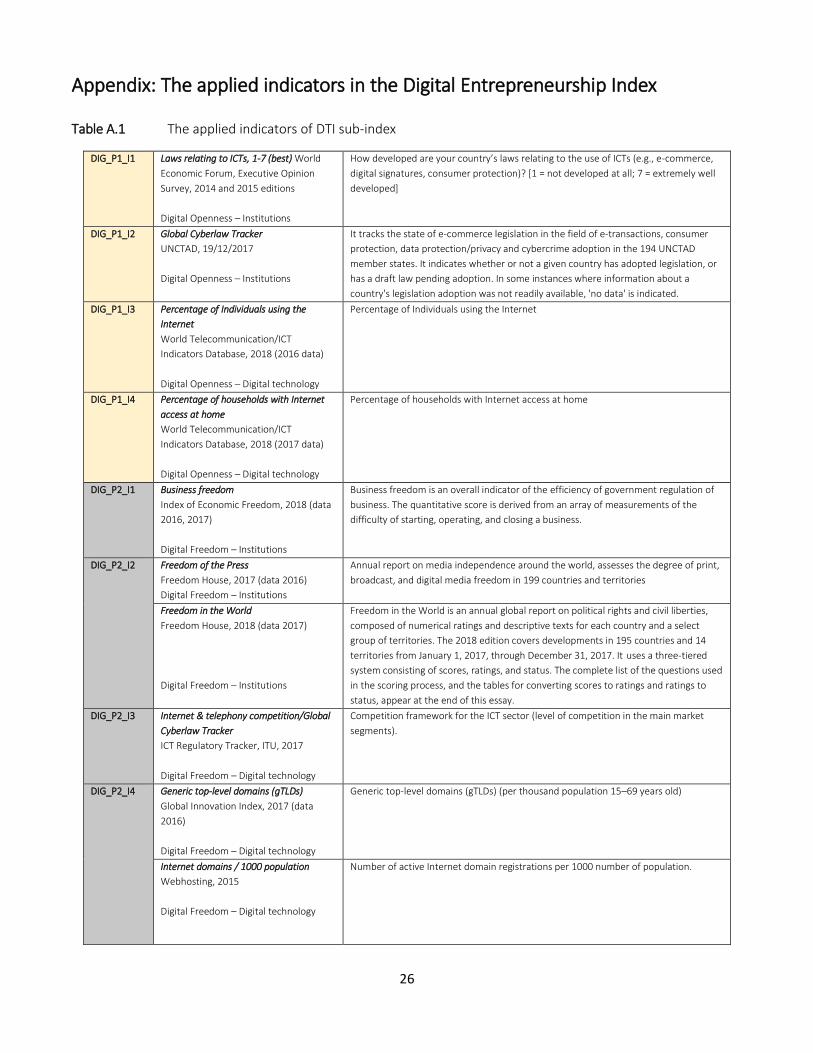
Appendix: The applied indicators in the Digital Entrepreneurship Index
Table A.1 The applied indicators of DTI sub-index
DIG_P1_I1 Laws relating to ICTs, 1-7 (best) World
Economic Forum, Executive Opinion
Survey, 2014 and 2015 editions
Digital Openness – Institutions
How developed are your country’s laws relating to the use of ICTs (e.g., e-commerce,
digital signatures, consumer protection)? [1 = not developed at all; 7 = extremely well
developed]
DIG_P1_I2 Global Cyberlaw Tracker
UNCTAD, 19/12/2017
Digital Openness – Institutions
It tracks the state of e-commerce legislation in the field of e-transactions, consumer
protection, data protection/privacy and cybercrime adoption in the 194 UNCTAD
member states. It indicates whether or not a given country has adopted legislation, or
has a draft law pending adoption. In some instances where information about a
country's legislation adoption was not readily available, 'no data' is indicated.
DIG_P1_I3 Percentage of Individuals using the
Internet
World Telecommunication/ICT
Indicators Database, 2018 (2016 data)
Digital Openness – Digital technology
Percentage of Individuals using the Internet
DIG_P1_I4 Percentage of households with Internet
access at home
World Telecommunication/ICT
Indicators Database, 2018 (2017 data)
Digital Openness – Digital technology
Percentage of households with Internet access at home
DIG_P2_I1 Business freedom
Index of Economic Freedom, 2018 (data
2016, 2017)
Digital Freedom – Institutions
Business freedom is an overall indicator of the efficiency of government regulation of
business. The quantitative score is derived from an array of measurements of the
difficulty of starting, operating, and closing a business.
DIG_P2_I2 Freedom of the Press
Freedom House, 2017 (data 2016)
Digital Freedom – Institutions
Annual report on media independence around the world, assesses the degree of print,
broadcast, and digital media freedom in 199 countries and territories
Freedom in the World
Freedom House, 2018 (data 2017)
Digital Freedom – Institutions
Freedom in the World is an annual global report on political rights and civil liberties,
composed of numerical ratings and descriptive texts for each country and a select
group of territories. The 2018 edition covers developments in 195 countries and 14
territories from January 1, 2017, through December 31, 2017. It uses a three-tiered
system consisting of scores, ratings, and status. The complete list of the questions used
in the scoring process, and the tables for converting scores to ratings and ratings to
status, appear at the end of this essay.
DIG_P2_I3 Internet & telephony competition/Global
Cyberlaw Tracker
ICT Regulatory Tracker, ITU, 2017
Digital Freedom – Digital technology
Competition framework for the ICT sector (level of competition in the main market
segments).
DIG_P2_I4 Generic top-level domains (gTLDs)
Global Innovation Index, 2017 (data
2016)
Digital Freedom – Digital technology
Generic top-level domains (gTLDs) (per thousand population 15–69 years old)
Internet domains / 1000 population
Webhosting, 2015
Digital Freedom – Digital technology
Number of active Internet domain registrations per 1000 number of population.
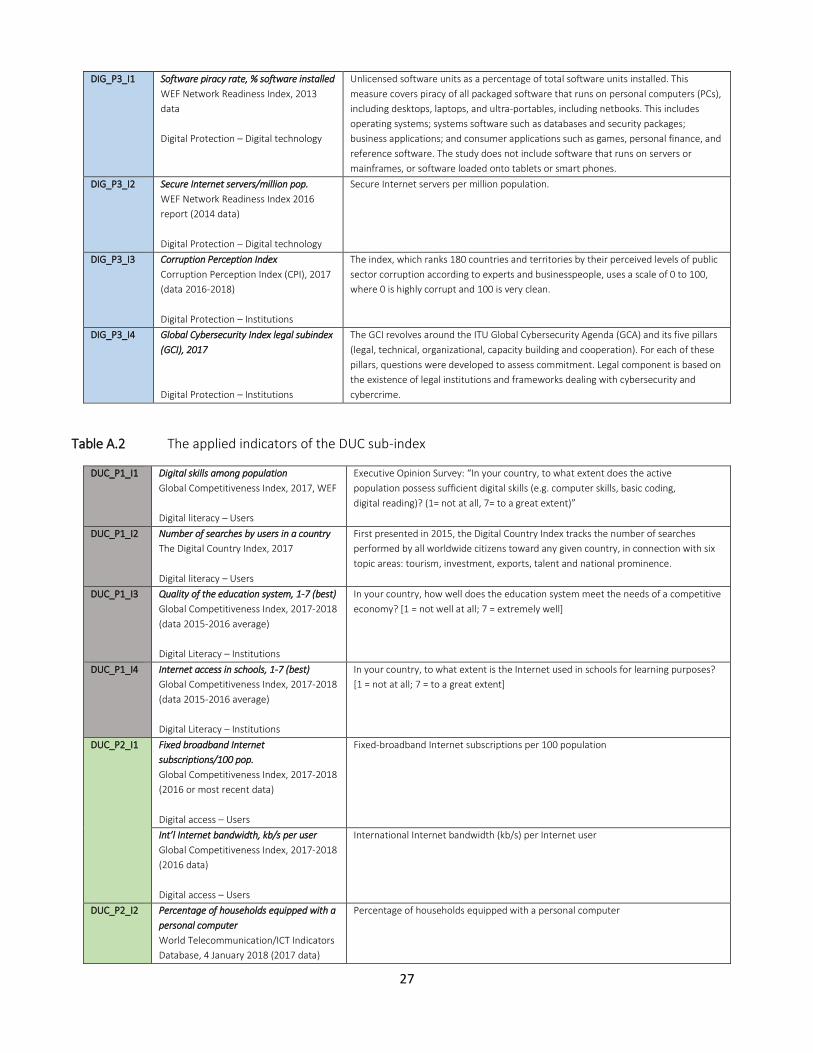
27
DIG_P3_I1 Software piracy rate, % software installed
WEF Network Readiness Index, 2013
data
Digital Protection – Digital technology
Unlicensed software units as a percentage of total software units installed. This
measure covers piracy of all packaged software that runs on personal computers (PCs),
including desktops, laptops, and ultra-portables, including netbooks. This includes
operating systems; systems software such as databases and security packages;
business applications; and consumer applications such as games, personal finance, and
reference software. The study does not include software that runs on servers or
mainframes, or software loaded onto tablets or smart phones.
DIG_P3_I2 Secure Internet servers/million pop.
WEF Network Readiness Index 2016
report (2014 data)
Digital Protection – Digital technology
Secure Internet servers per million population.
DIG_P3_I3 Corruption Perception Index
Corruption Perception Index (CPI), 2017
(data 2016-2018)
Digital Protection – Institutions
The index, which ranks 180 countries and territories by their perceived levels of public
sector corruption according to experts and businesspeople, uses a scale of 0 to 100,
where 0 is highly corrupt and 100 is very clean.
DIG_P3_I4 Global Cybersecurity Index legal subindex
(GCI), 2017
Digital Protection – Institutions
The GCI revolves around the ITU Global Cybersecurity Agenda (GCA) and its five pillars
(legal, technical, organizational, capacity building and cooperation). For each of these
pillars, questions were developed to assess commitment. Legal component is based on
the existence of legal institutions and frameworks dealing with cybersecurity and
cybercrime.
Table A.2 The applied indicators of the DUC sub-index
DUC_P1_I1 Digital skills among population
Global Competitiveness Index, 2017, WEF
Digital literacy – Users
Executive Opinion Survey: “In your country, to what extent does the active
population possess sufficient digital skills (e.g. computer skills, basic coding,
digital reading)? (1= not at all, 7= to a great extent)”
DUC_P1_I2 Number of searches by users in a country
The Digital Country Index, 2017
Digital literacy – Users
First presented in 2015, the Digital Country Index tracks the number of searches
performed by all worldwide citizens toward any given country, in connection with six
topic areas: tourism, investment, exports, talent and national prominence.
DUC_P1_I3 Quality of the education system, 1-7 (best)
Global Competitiveness Index, 2017-2018
(data 2015-2016 average)
Digital Literacy – Institutions
In your country, how well does the education system meet the needs of a competitive
economy? [1 = not well at all; 7 = extremely well]
DUC_P1_I4 Internet access in schools, 1-7 (best)
Global Competitiveness Index, 2017-2018
(data 2015-2016 average)
Digital Literacy – Institutions
In your country, to what extent is the Internet used in schools for learning purposes?
[1 = not at all; 7 = to a great extent]
DUC_P2_I1 Fixed broadband Internet
subscriptions/100 pop.
Global Competitiveness Index, 2017-2018
(2016 or most recent data)
Digital access – Users
Fixed-broadband Internet subscriptions per 100 population
Int’l Internet bandwidth, kb/s per user
Global Competitiveness Index, 2017-2018
(2016 data)
Digital access – Users
International Internet bandwidth (kb/s) per Internet user
DUC_P2_I2 Percentage of households equipped with a
personal computer
World Telecommunication/ICT Indicators
Database, 4 January 2018 (2017 data)
Percentage of households equipped with a personal computer
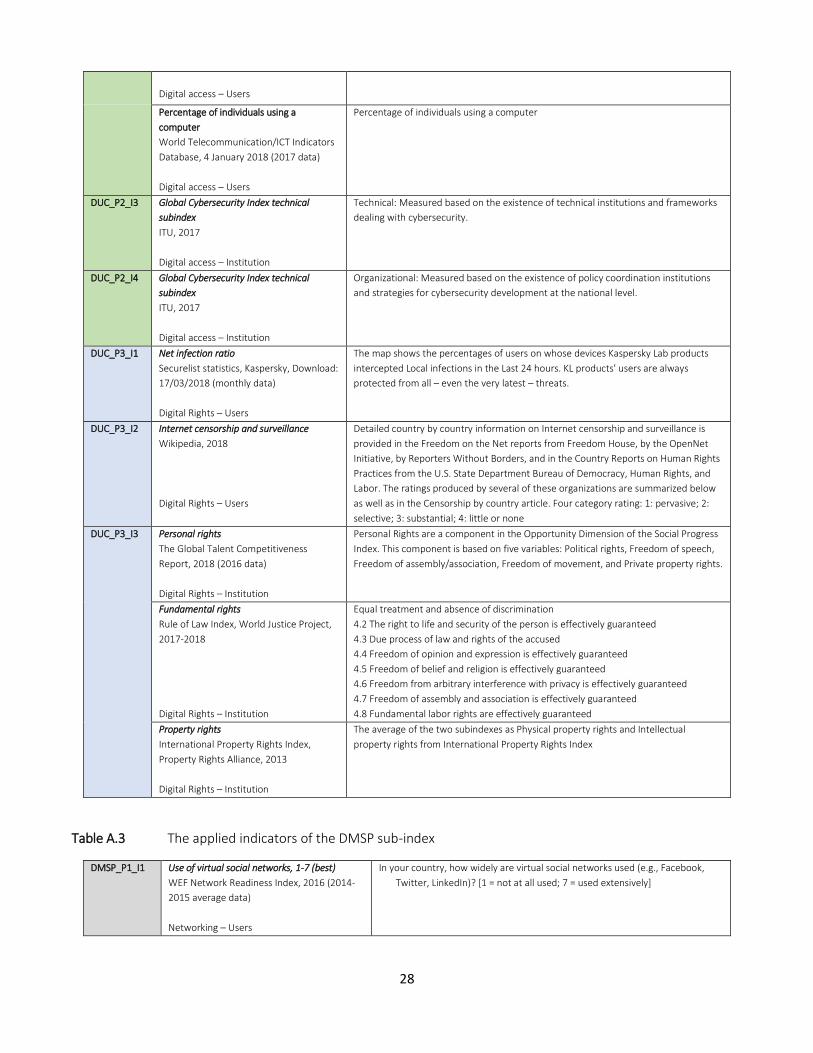
28
Digital access – Users
Percentage of individuals using a
computer
World Telecommunication/ICT Indicators
Database, 4 January 2018 (2017 data)
Digital access – Users
Percentage of individuals using a computer
DUC_P2_I3 Global Cybersecurity Index technical
subindex
ITU, 2017
Digital access – Institution
Technical: Measured based on the existence of technical institutions and frameworks
dealing with cybersecurity.
DUC_P2_I4 Global Cybersecurity Index technical
subindex
ITU, 2017
Digital access – Institution
Organizational: Measured based on the existence of policy coordination institutions
and strategies for cybersecurity development at the national level.
DUC_P3_I1 Net infection ratio
Securelist statistics, Kaspersky, Download:
17/03/2018 (monthly data)
Digital Rights – Users
The map shows the percentages of users on whose devices Kaspersky Lab products
intercepted Local infections in the Last 24 hours. KL products' users are always
protected from all – even the very latest – threats.
DUC_P3_I2 Internet censorship and surveillance
Wikipedia, 2018
Digital Rights – Users
Detailed country by country information on Internet censorship and surveillance is
provided in the Freedom on the Net reports from Freedom House, by the OpenNet
Initiative, by Reporters Without Borders, and in the Country Reports on Human Rights
Practices from the U.S. State Department Bureau of Democracy, Human Rights, and
Labor. The ratings produced by several of these organizations are summarized below
as well as in the Censorship by country article. Four category rating: 1: pervasive; 2:
selective; 3: substantial; 4: little or none
DUC_P3_I3 Personal rights
The Global Talent Competitiveness
Report, 2018 (2016 data)
Digital Rights – Institution
Personal Rights are a component in the Opportunity Dimension of the Social Progress
Index. This component is based on five variables: Political rights, Freedom of speech,
Freedom of assembly/association, Freedom of movement, and Private property rights.
Fundamental rights
Rule of Law Index, World Justice Project,
2017-2018
Digital Rights – Institution
Equal treatment and absence of discrimination
4.2 The right to life and security of the person is effectively guaranteed
4.3 Due process of law and rights of the accused
4.4 Freedom of opinion and expression is effectively guaranteed
4.5 Freedom of belief and religion is effectively guaranteed
4.6 Freedom from arbitrary interference with privacy is effectively guaranteed
4.7 Freedom of assembly and association is effectively guaranteed
4.8 Fundamental labor rights are effectively guaranteed
Property rights
International Property Rights Index,
Property Rights Alliance, 2013
Digital Rights – Institution
The average of the two subindexes as Physical property rights and Intellectual
property rights from International Property Rights Index
Table A.3 The applied indicators of the DMSP sub-index
DMSP_P1_I1 Use of virtual social networks, 1-7 (best)
WEF Network Readiness Index, 2016 (2014-
2015 average data)
Networking – Users
In your country, how widely are virtual social networks used (e.g., Facebook,
Twitter, LinkedIn)? [1 = not at all used; 7 = used extensively]
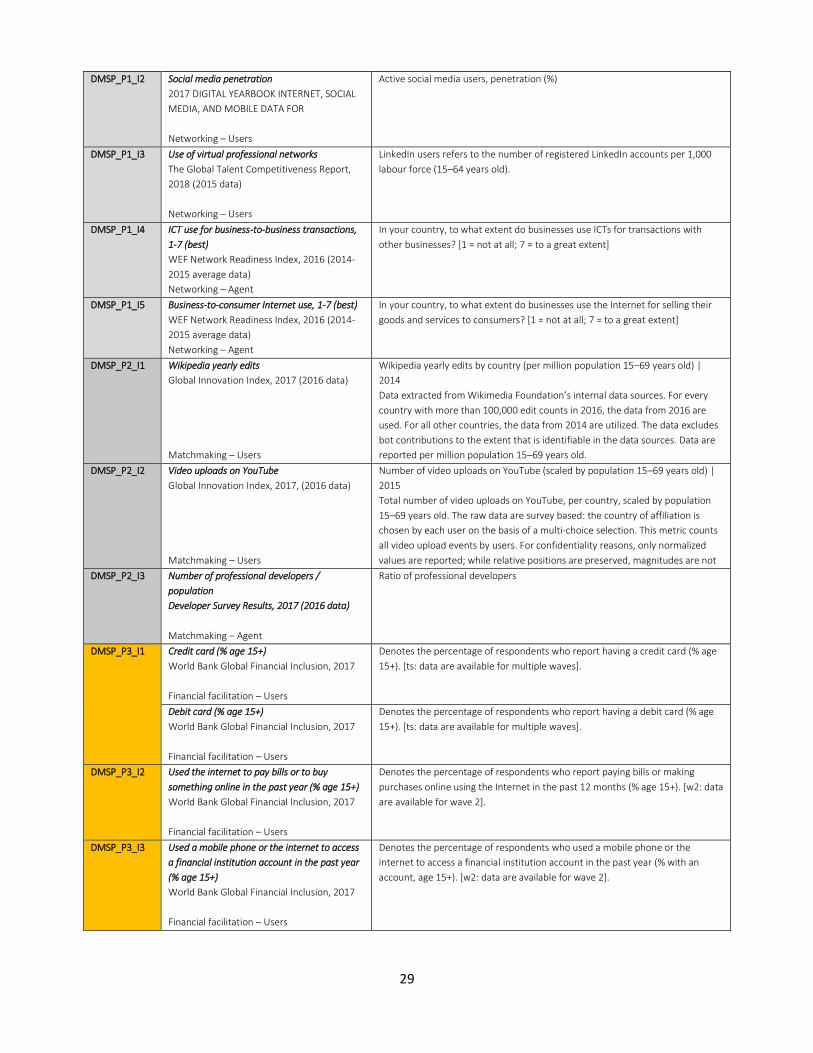
29
DMSP_P1_I2 Social media penetration
2017 DIGITAL YEARBOOK INTERNET, SOCIAL
MEDIA, AND MOBILE DATA FOR
Networking – Users
Active social media users, penetration (%)
DMSP_P1_I3 Use of virtual professional networks
The Global Talent Competitiveness Report,
2018 (2015 data)
Networking – Users
LinkedIn users refers to the number of registered LinkedIn accounts per 1,000
labour force (15–64 years old).
DMSP_P1_I4 ICT use for business-to-business transactions,
1-7 (best)
WEF Network Readiness Index, 2016 (2014-
2015 average data)
Networking – Agent
In your country, to what extent do businesses use ICTs for transactions with
other businesses? [1 = not at all; 7 = to a great extent]
DMSP_P1_I5 Business-to-consumer Internet use, 1-7 (best)
WEF Network Readiness Index, 2016 (2014-
2015 average data)
Networking – Agent
In your country, to what extent do businesses use the Internet for selling their
goods and services to consumers? [1 = not at all; 7 = to a great extent]
DMSP_P2_I1 Wikipedia yearly edits
Global Innovation Index, 2017 (2016 data)
Matchmaking – Users
Wikipedia yearly edits by country (per million population 15–69 years old) |
2014
Data extracted from Wikimedia Foundation’s internal data sources. For every
country with more than 100,000 edit counts in 2016, the data from 2016 are
used. For all other countries, the data from 2014 are utilized. The data excludes
bot contributions to the extent that is identifiable in the data sources. Data are
reported per million population 15–69 years old.
DMSP_P2_I2 Video uploads on YouTube
Global Innovation Index, 2017, (2016 data)
Matchmaking – Users
Number of video uploads on YouTube (scaled by population 15–69 years old) |
2015
Total number of video uploads on YouTube, per country, scaled by population
15–69 years old. The raw data are survey based: the country of affiliation is
chosen by each user on the basis of a multi-choice selection. This metric counts
all video upload events by users. For confidentiality reasons, only normalized
values are reported; while relative positions are preserved, magnitudes are not
DMSP_P2_I3 Number of professional developers /
population
Developer Survey Results, 2017 (2016 data)
Matchmaking – Agent
Ratio of professional developers
DMSP_P3_I1 Credit card (% age 15+)
World Bank Global Financial Inclusion, 2017
Financial facilitation – Users
Denotes the percentage of respondents who report having a credit card (% age
15+). [ts: data are available for multiple waves].
Debit card (% age 15+)
World Bank Global Financial Inclusion, 2017
Financial facilitation – Users
Denotes the percentage of respondents who report having a debit card (% age
15+). [ts: data are available for multiple waves].
DMSP_P3_I2 Used the internet to pay bills or to buy
something online in the past year (% age 15+)
World Bank Global Financial Inclusion, 2017
Financial facilitation – Users
Denotes the percentage of respondents who report paying bills or making
purchases online using the Internet in the past 12 months (% age 15+). [w2: data
are available for wave 2].
DMSP_P3_I3 Used a mobile phone or the internet to access
a financial institution account in the past year
(% age 15+)
World Bank Global Financial Inclusion, 2017
Financial facilitation – Users
Denotes the percentage of respondents who used a mobile phone or the
internet to access a financial institution account in the past year (% with an
account, age 15+). [w2: data are available for wave 2].
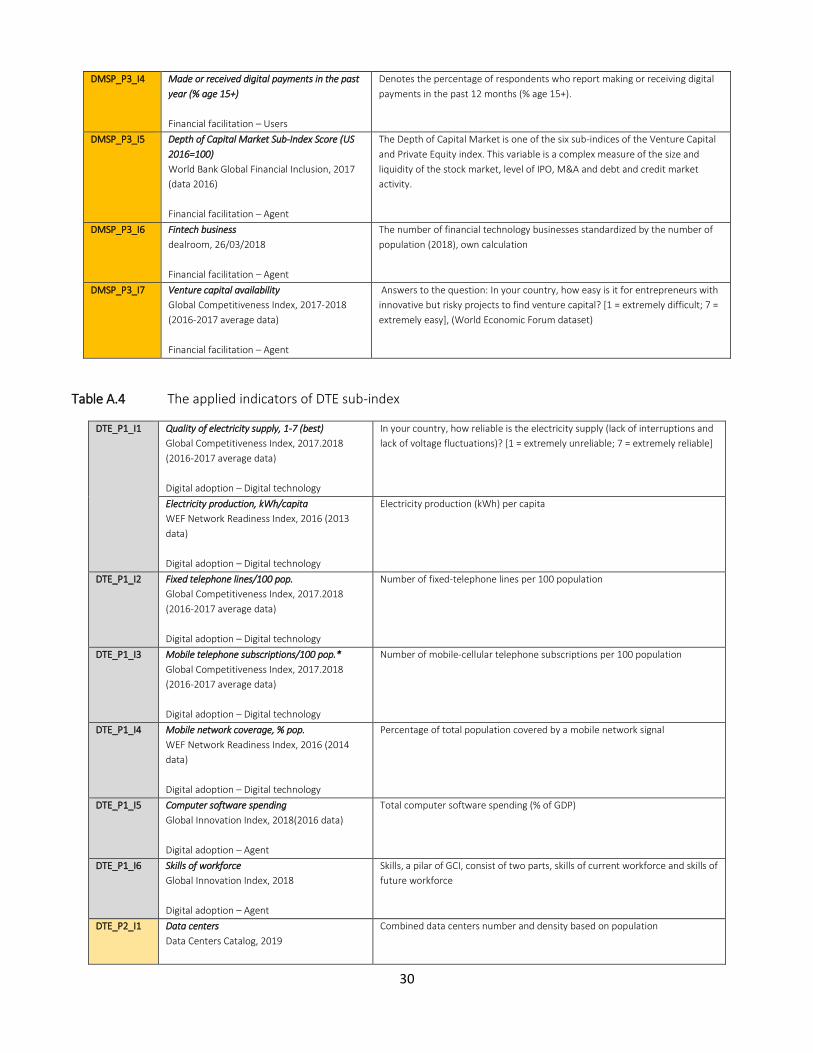
30
DMSP_P3_I4 Made or received digital payments in the past
year (% age 15+)
Financial facilitation – Users
Denotes the percentage of respondents who report making or receiving digital
payments in the past 12 months (% age 15+).
DMSP_P3_I5 Depth of Capital Market Sub-Index Score (US
2016=100)
World Bank Global Financial Inclusion, 2017
(data 2016)
Financial facilitation – Agent
The Depth of Capital Market is one of the six sub-indices of the Venture Capital
and Private Equity index. This variable is a complex measure of the size and
liquidity of the stock market, level of IPO, M&A and debt and credit market
activity.
DMSP_P3_I6 Fintech business
dealroom, 26/03/2018
Financial facilitation – Agent
The number of financial technology businesses standardized by the number of
population (2018), own calculation
DMSP_P3_I7 Venture capital availability
Global Competitiveness Index, 2017-2018
(2016-2017 average data)
Financial facilitation – Agent
Answers to the question: In your country, how easy is it for entrepreneurs with
innovative but risky projects to find venture capital? [1 = extremely difficult; 7 =
extremely easy], (World Economic Forum dataset)
Table A.4 The applied indicators of DTE sub-index
DTE_P1_I1 Quality of electricity supply, 1-7 (best)
Global Competitiveness Index, 2017.2018
(2016-2017 average data)
Digital adoption – Digital technology
In your country, how reliable is the electricity supply (lack of interruptions and
lack of voltage fluctuations)? [1 = extremely unreliable; 7 = extremely reliable]
Electricity production, kWh/capita
WEF Network Readiness Index, 2016 (2013
data)
Digital adoption – Digital technology
Electricity production (kWh) per capita
DTE_P1_I2 Fixed telephone lines/100 pop.
Global Competitiveness Index, 2017.2018
(2016-2017 average data)
Digital adoption – Digital technology
Number of fixed-telephone lines per 100 population
DTE_P1_I3 Mobile telephone subscriptions/100 pop.*
Global Competitiveness Index, 2017.2018
(2016-2017 average data)
Digital adoption – Digital technology
Number of mobile-cellular telephone subscriptions per 100 population
DTE_P1_I4 Mobile network coverage, % pop.
WEF Network Readiness Index, 2016 (2014
data)
Digital adoption – Digital technology
Percentage of total population covered by a mobile network signal
DTE_P1_I5 Computer software spending
Global Innovation Index, 2018(2016 data)
Digital adoption – Agent
Total computer software spending (% of GDP)
DTE_P1_I6 Skills of workforce
Global Innovation Index, 2018
Digital adoption – Agent
Skills, a pilar of GCI, consist of two parts, skills of current workforce and skills of
future workforce
DTE_P2_I1 Data centers
Data Centers Catalog, 2019
Combined data centers number and density based on population
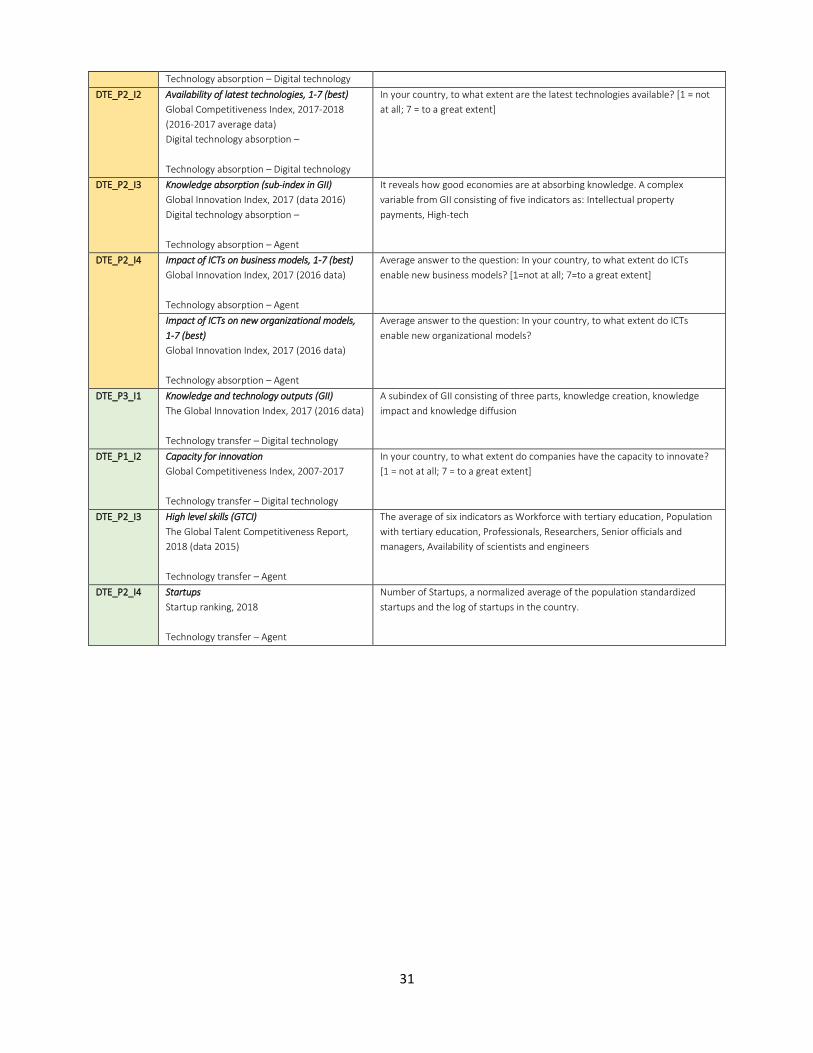
31
Technology absorption – Digital technology
DTE_P2_I2 Availability of latest technologies, 1-7 (best)
Global Competitiveness Index, 2017-2018
(2016-2017 average data)
Digital technology absorption –
Technology absorption – Digital technology
In your country, to what extent are the latest technologies available? [1 = not
at all; 7 = to a great extent]
DTE_P2_I3 Knowledge absorption (sub-index in GII)
Global Innovation Index, 2017 (data 2016)
Digital technology absorption –
Technology absorption – Agent
It reveals how good economies are at absorbing knowledge. A complex
variable from GII consisting of five indicators as: Intellectual property
payments, High-tech
DTE_P2_I4 Impact of ICTs on business models, 1-7 (best)
Global Innovation Index, 2017 (2016 data)
Technology absorption – Agent
Average answer to the question: In your country, to what extent do ICTs
enable new business models? [1=not at all; 7=to a great extent]
Impact of ICTs on new organizational models,
1-7 (best)
Global Innovation Index, 2017 (2016 data)
Technology absorption – Agent
Average answer to the question: In your country, to what extent do ICTs
enable new organizational models?
DTE_P3_I1 Knowledge and technology outputs (GII)
The Global Innovation Index, 2017 (2016 data)
Technology transfer – Digital technology
A subindex of GII consisting of three parts, knowledge creation, knowledge
impact and knowledge diffusion
DTE_P1_I2 Capacity for innovation
Global Competitiveness Index, 2007-2017
Technology transfer – Digital technology
In your country, to what extent do companies have the capacity to innovate?
[1 = not at all; 7 = to a great extent]
DTE_P2_I3 High level skills (GTCI)
The Global Talent Competitiveness Report,
2018 (data 2015)
Technology transfer – Agent
The average of six indicators as Workforce with tertiary education, Population
with tertiary education, Professionals, Researchers, Senior officials and
managers, Availability of scientists and engineers
DTE_P2_I4 Startups
Startup ranking, 2018
Technology transfer – Agent
Number of Startups, a normalized average of the population standardized
startups and the log of startups in the country.