THE DIDACTICAL USE OF MODELS IN REALISTIC MATHEMATICS
28
MARJA VAN DEN HEUVEL-PANHUIZEN THE DIDACTICAL USE OF MODELS IN REALISTIC MATHEMATICS EDUCATION: AN EXAMPLE FROM A LONGITUDINAL TRAJECTORY ON PERCENTAGE 1 ABSTRACT. The purpose of this article is to describe how, within the Dutch approach to mathematics education, called Realistic Mathematics Education (RME), models are used to elicit students’ growth in understanding of mathematics. First some background information is given about the characteristics of RME related to the role of models in this approach. Then the focus is on the use of the bar model within a longitudinal trajectory on percentage that has been designed for Mathematics in Context, a curriculum for the U.S. middle school. The power of this model is that it develops alongside both the teaching and the students: from a drawing that represents a context related to percentage to a strip for estimation and reasoning to an abstract tool that supports the use of percentage as an operator. KEY WORDS: contexts, curriculum design, mathematics education, models, percentage, primary school, shift in levels of understanding I NTRODUCTION Realistic Mathematics Education (RME) is a domain-specific instruction theory for mathematics education (e.g., Treffers, 1987; De Lange, 1987; Streefland, 1991, Gravemeijer, 1994a; Van den Heuvel-Panhuizen, 1996). This theory is the Dutch answer to the need, felt worldwide, to reform the teaching of mathematics. The roots of RME go back to the early 1970s when Freudenthal and his colleagues laid the foundations for it at the former IOWO 2 , the earliest predecessor of the Freudenthal Institute. Based on Freudenthal’s (1977) idea that mathematics – in order to be of human value – must be connected to reality, stay close to children and should be relevant to society, the use of realistic contexts became one of the determ- ining characteristics of this approach to mathematics education. In RME, students should learn mathematics by developing and applying mathemat- ical concepts and tools in daily-life problem situations that make sense to them. On the one hand the adjective ‘realistic’ is definitely in agreement with how the teaching and learning of mathematics is seen within RME, but on the other hand this term is also confusing. In Dutch, the verb ‘zich Educational Studies in Mathematics 54: 9–35, 2003. © 2003 Kluwer Academic Publishers. Printed in the Netherlands.
Transcript of THE DIDACTICAL USE OF MODELS IN REALISTIC MATHEMATICS
MARJA VAN DEN HEUVEL-PANHUIZEN
THE DIDACTICAL USE OF MODELS IN REALISTICMATHEMATICS EDUCATION: AN EXAMPLE FROM A
LONGITUDINAL TRAJECTORY ON PERCENTAGE1
ABSTRACT. The purpose of this article is to describe how, within the Dutch approachto mathematics education, called Realistic Mathematics Education (RME), models areused to elicit students’ growth in understanding of mathematics. First some backgroundinformation is given about the characteristics of RME related to the role of models in thisapproach. Then the focus is on the use of the bar model within a longitudinal trajectory onpercentage that has been designed for Mathematics in Context, a curriculum for the U.S.middle school. The power of this model is that it develops alongside both the teachingand the students: from a drawing that represents a context related to percentage to a stripfor estimation and reasoning to an abstract tool that supports the use of percentage as anoperator.
KEY WORDS: contexts, curriculum design, mathematics education, models, percentage,primary school, shift in levels of understanding
INTRODUCTION
Realistic Mathematics Education (RME) is a domain-specific instructiontheory for mathematics education (e.g., Treffers, 1987; De Lange, 1987;Streefland, 1991, Gravemeijer, 1994a; Van den Heuvel-Panhuizen, 1996).This theory is the Dutch answer to the need, felt worldwide, to reform theteaching of mathematics. The roots of RME go back to the early 1970swhen Freudenthal and his colleagues laid the foundations for it at theformer IOWO2, the earliest predecessor of the Freudenthal Institute. Basedon Freudenthal’s (1977) idea that mathematics – in order to be of humanvalue – must be connected to reality, stay close to children and should berelevant to society, the use of realistic contexts became one of the determ-ining characteristics of this approach to mathematics education. In RME,students should learn mathematics by developing and applying mathemat-ical concepts and tools in daily-life problem situations that make sense tothem.
On the one hand the adjective ‘realistic’ is definitely in agreement withhow the teaching and learning of mathematics is seen within RME, buton the other hand this term is also confusing. In Dutch, the verb ‘zich
Educational Studies in Mathematics 54: 9–35, 2003.© 2003 Kluwer Academic Publishers. Printed in the Netherlands.

10 MARJA VAN DEN HEUVEL-PANHUIZEN
realiseren’ means ‘to imagine’. In other words, the term ‘realistic’ refersmore to the intention that students should be offered problem situationswhich they can imagine (see Van den Brink, 1973; Wijdeveld, 1980) thanthat it refers to the ‘realness’ or authenticity of problems. However, thelatter does not mean that the connection to real life is not important. Itonly implies that the contexts are not necessarily restricted to real-worldsituations. The fantasy world of fairy tales and even the formal world ofmathematics can be very suitable contexts for problems, as long as theyare ‘real’ in the students’ minds.
Apart from this often-arising misconception about the meaning of ‘real-istic’ the use of this adjective to define a particular approach to mathem-atics education has an additional ‘shortcoming’. It does not reflect anotheressential feature of RME: the didactical use of models. In this article thefocus will be on this aspect of RME.
In the first part of this position paper I will give general backgroundinformation about the theory of RME and the role of models within thistheory. Among other things, attention will be paid to the two ways ofmathematizing that characterize RME, the different levels of understand-ing that can be distinguished and that typify the learning process, the waystudents can play an active role in developing models and how modelscan evolve during the teaching-learning process, and – as a result of this –can prompt and support level raising. In the second part of the article thisgeneral information will be made more concrete by concentrating on thecontent domain of percentage. A description is given of how the bar modelcan support the longitudinal process of learning percentage.
This description of the didactical use of the bar model is based on thedevelopment work carried out in the Mathematics in Context project, aproject aimed at the development of a mathematics curriculum for theU.S. middle school (Romberg, 1997–1998). The project was funded by theNational Science Foundation and executed by the Center for Research inMathematical Sciences Education at the University of Wisconsin-Madison3 ,and the Freudenthal Institute of Utrecht University. The designed curriculumreflects the mathematical content and teaching methods suggested by the‘Curriculum and Evaluation Standards for School Mathematics’ (NCTM,1989). This means that the philosophy of the curriculum and its devel-opment is based on the belief that mathematics, like any other body ofknowledge, is the product of human inventiveness and social activities.This philosophy has much in common with RME. It was Freudenthal’s(1987) belief that mathematical structures are not a fixed datum, but thatthey emerge from reality and expand continuously in individual and col-lective learning processes. In other words, in RME students are seen as
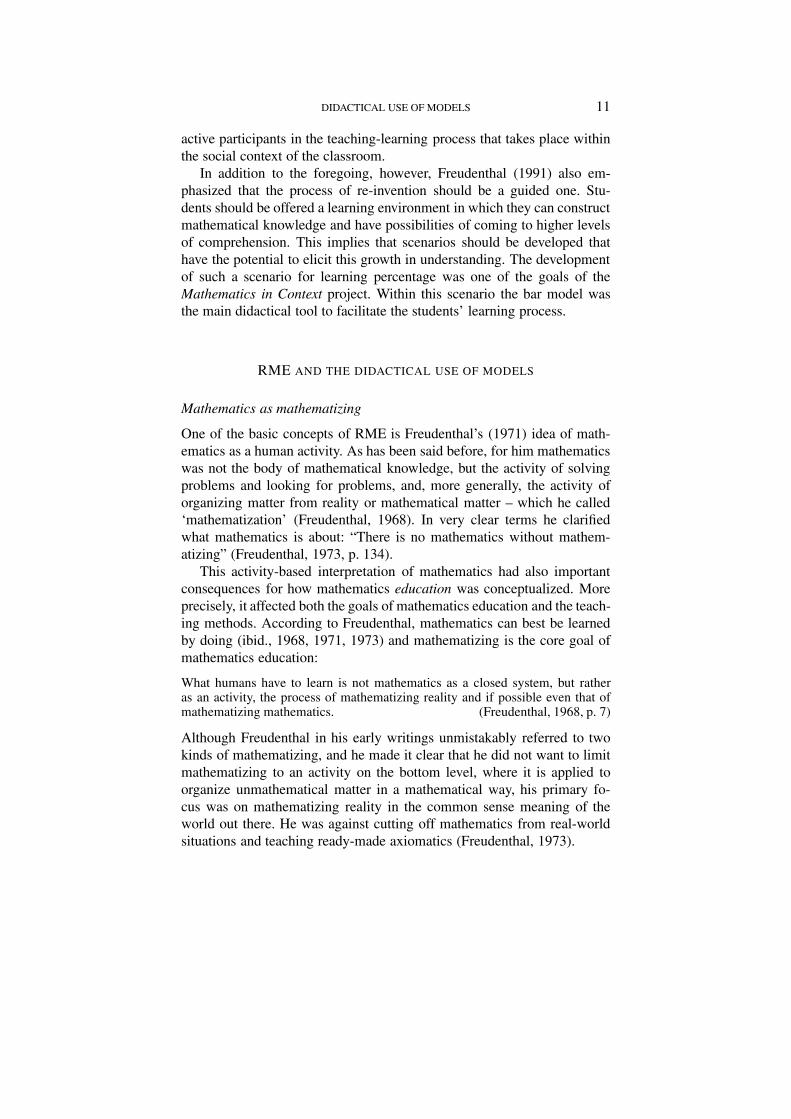
DIDACTICAL USE OF MODELS 11
active participants in the teaching-learning process that takes place withinthe social context of the classroom.
In addition to the foregoing, however, Freudenthal (1991) also em-phasized that the process of re-invention should be a guided one. Stu-dents should be offered a learning environment in which they can constructmathematical knowledge and have possibilities of coming to higher levelsof comprehension. This implies that scenarios should be developed thathave the potential to elicit this growth in understanding. The developmentof such a scenario for learning percentage was one of the goals of theMathematics in Context project. Within this scenario the bar model wasthe main didactical tool to facilitate the students’ learning process.
RME AND THE DIDACTICAL USE OF MODELS
Mathematics as mathematizing
One of the basic concepts of RME is Freudenthal’s (1971) idea of math-ematics as a human activity. As has been said before, for him mathematicswas not the body of mathematical knowledge, but the activity of solvingproblems and looking for problems, and, more generally, the activity oforganizing matter from reality or mathematical matter – which he called‘mathematization’ (Freudenthal, 1968). In very clear terms he clarifiedwhat mathematics is about: “There is no mathematics without mathem-atizing” (Freudenthal, 1973, p. 134).
This activity-based interpretation of mathematics had also importantconsequences for how mathematics education was conceptualized. Moreprecisely, it affected both the goals of mathematics education and the teach-ing methods. According to Freudenthal, mathematics can best be learnedby doing (ibid., 1968, 1971, 1973) and mathematizing is the core goal ofmathematics education:
What humans have to learn is not mathematics as a closed system, but ratheras an activity, the process of mathematizing reality and if possible even that ofmathematizing mathematics. (Freudenthal, 1968, p. 7)
Although Freudenthal in his early writings unmistakably referred to twokinds of mathematizing, and he made it clear that he did not want to limitmathematizing to an activity on the bottom level, where it is applied toorganize unmathematical matter in a mathematical way, his primary fo-cus was on mathematizing reality in the common sense meaning of theworld out there. He was against cutting off mathematics from real-worldsituations and teaching ready-made axiomatics (Freudenthal, 1973).

12 MARJA VAN DEN HEUVEL-PANHUIZEN
Two ways of mathematizing
It was Treffers (1978, 1987) who placed the two ways of mathematizing ina new perspective, which caused Freudenthal to change his mind as well.Treffers formulated the idea of two ways of mathematizing in an educa-tional context. He distinguished ‘horizontal’ and ‘vertical’ mathematizing.Generally speaking the meaning of these two forms of mathematizing isthe following. In the case of horizontal mathematizing, mathematical toolsare brought forward and used to organize and solve a problem situated indaily life. Vertical mathematizing, on the contrary, stands for all kinds ofre-organizations and operations done by the students within the mathem-atical system itself. In his last book Freudenthal (1991) adopted Treffers’distinction of these two ways of mathematizing, and expressed their mean-ings as follows: to mathematize horizontally means to go from the worldof life to the world of symbols; and to mathematize vertically means tomove within the world of symbols. The latter implies, for instance, makingshortcuts and discovering connections between concepts and strategies andmaking use of these findings. Freudenthal emphasized, however, that thedifferences between these two worlds are far from clear cut, and that, inhis view, the worlds are not, in fact, separate. Moreover, he found the twoforms of mathematizing to be of equal value, and stressed the fact that bothactivities could take place on all levels of mathematical activity. In otherwords, even on the level of counting activities, for example, both formsmay occur.
Although Freudenthal introduced some important nuances in the for-mulation of the two ways of mathematizing, these do not affect the coreof Treffer’s classification or its significance. Furthermore, it was Treffers’merit that he made it clear that RME clearly differentiates itself, throughthis focus on two ways of mathematizing, from other (then prevailing)approaches to mathematics education. According to Treffers (1978, 1987,1991) an empiricist approach only focuses on horizontal mathematizing,while a structuralist approach confines oneself to vertical mathematizing,and in a mechanistic approach both forms are missing. As Treffers andGoffree (1985) stressed, the kind of mathematizing on which one is fo-cused in mathematics education has important consequences for the roleof models in the different approaches to mathematics education, and alsofor the kind of models that are used.
Different levels of understanding
Another characteristic of RME that is closely related to mathematizing iswhat could be called the ‘level principle’ of RME. Students pass throughdifferent levels of understanding on which mathematizing can take place:

DIDACTICAL USE OF MODELS 13
from devising informal context-connected solutions to reaching some levelof schematization, and finally having insight into the general principlesbehind a problem and being able to see the overall picture. Essential for thislevel theory of learning – which Freudenthal derived from the observationsand ideas of the Van Hieles (see, for instance, Freudenthal 1973, 1991) –is that the activity of mathematizing on a lower level can be the subject ofinquiry on a higher level. This means that the organizing activities that havebeen carried out initially in an informal way, later, as a result of reflection,become more formal.
This level theory of learning is also reflected in ‘progressive mathem-atization’ that is considered as the most general characteristic of RME andwhere models – interpreted broadly – are seen as vehicles to elicit and sup-port this progress (Treffers and Goffree, 1985; Treffers, 1987; Gravemeijer,1994a; Van den Heuvel-Panhuizen, 1995, 2002). Models are attributed therole of bridging the gap between the informal understanding connected tothe ‘real’ and imagined reality on the one side, and the understanding offormal systems on the other.
Broad interpretation of models
Within RME, models are seen as representations of problem situations,which necessarily reflect essential aspects of mathematical concepts andstructures that are relevant for the problem situation, but that can havedifferent manifestations. This means that the term ‘model’ is not takenin a very literal way. Materials, visual sketches, paradigmatic situations,schemes, diagrams and even symbols can serve as models (see Treffersand Goffree, 1985; Treffers 1987, 1991; Gravemeijer 1994a). For instance,an example of a paradigmatic situation that can function as a model, isrepeated subtraction. Within the learning strand on long division, this pro-cedure – elicited, for instance, by the transit of a large number of supportersby coach (see Gravemeijer 1982; Treffers, 1991) – both legitimizes andgives access to the formal long division algorithm. As an example of away of notation the arrow language can be mentioned. The initial way ofdescribing the changes in the number of passengers on a bus ends up beingused to describe all kind of numerical changes later on (see Van den Brink,1984).
For being suitable to give the intended support to learning processes,models must have at least two important characteristics. On the one handthey have to be rooted in realistic, imaginable contexts and on the otherhand they have to be sufficiently flexible to be applied also on a moreadvanced, or more general level. This implies that a model should supportprogression in vertical mathematizing without blocking the way back to
14 MARJA VAN DEN HEUVEL-PANHUIZEN
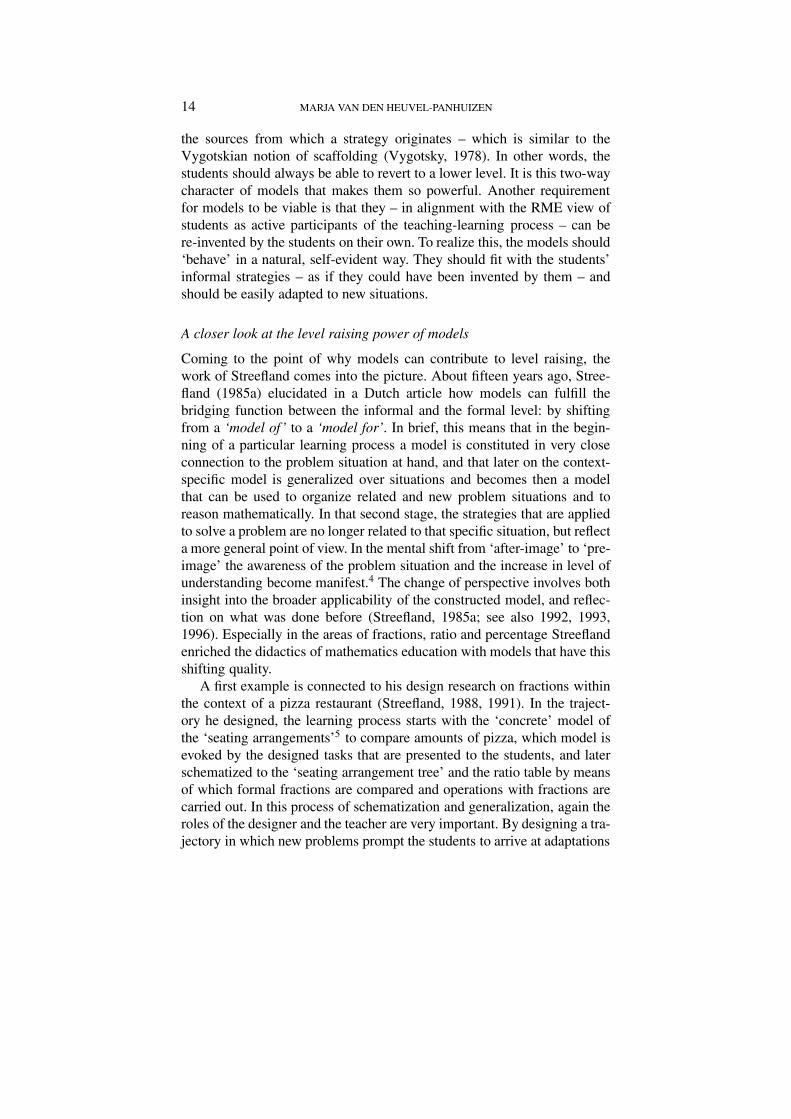
the sources from which a strategy originates – which is similar to theVygotskian notion of scaffolding (Vygotsky, 1978). In other words, thestudents should always be able to revert to a lower level. It is this two-waycharacter of models that makes them so powerful. Another requirementfor models to be viable is that they – in alignment with the RME view ofstudents as active participants of the teaching-learning process – can bere-invented by the students on their own. To realize this, the models should‘behave’ in a natural, self-evident way. They should fit with the students’informal strategies – as if they could have been invented by them – andshould be easily adapted to new situations.
A closer look at the level raising power of models
Coming to the point of why models can contribute to level raising, thework of Streefland comes into the picture. About fifteen years ago, Stree-fland (1985a) elucidated in a Dutch article how models can fulfill thebridging function between the informal and the formal level: by shiftingfrom a ‘model of’ to a ‘model for’. In brief, this means that in the begin-ning of a particular learning process a model is constituted in very closeconnection to the problem situation at hand, and that later on the context-specific model is generalized over situations and becomes then a modelthat can be used to organize related and new problem situations and toreason mathematically. In that second stage, the strategies that are appliedto solve a problem are no longer related to that specific situation, but reflecta more general point of view. In the mental shift from ‘after-image’ to ‘pre-image’ the awareness of the problem situation and the increase in level ofunderstanding become manifest.4 The change of perspective involves bothinsight into the broader applicability of the constructed model, and reflec-tion on what was done before (Streefland, 1985a; see also 1992, 1993,1996). Especially in the areas of fractions, ratio and percentage Streeflandenriched the didactics of mathematics education with models that have thisshifting quality.
A first example is connected to his design research on fractions withinthe context of a pizza restaurant (Streefland, 1988, 1991). In the traject-ory he designed, the learning process starts with the ‘concrete’ model ofthe ‘seating arrangements’5 to compare amounts of pizza, which model isevoked by the designed tasks that are presented to the students, and laterschematized to the ‘seating arrangement tree’ and the ratio table by meansof which formal fractions are compared and operations with fractions arecarried out. In this process of schematization and generalization, again theroles of the designer and the teacher are very important. By designing a tra-jectory in which new problems prompt the students to arrive at adaptations

DIDACTICAL USE OF MODELS 15
of the initial ‘concrete’ model and by accentuating particular adaptationsthat the students come up with the process of model development is guided.
The bar model that will be discussed later in this article is a secondexample. In the development of teaching a unit on percentage in whichthis bar model is the backbone for progress, Leen Streefland and I workedvery closely together.
Although we owe the concept of the shifts in models to Streefland,he did not do his work in isolation. Again, the role Freudenthal playedshould not be underestimated. The distinction between the two meaningsof ‘model’ was already an issue in his writings in the 1970s, when hewrote: “Models of something are after-images of a piece of given real-ity; models for something are pre-images for a piece of to be createdreality” (Freudenthal, 1975, p. 66). In connection with these two func-tions of models he distinguished also ‘descriptive models’ and ‘normativemodels’ (Freudenthal, 1978). However, the difference with Streefland isthat Freudenthal was thinking about models at a much more general di-dactical level – such as models for lessons, curriculum plans, goal descrip-tions, innovation strategies, interaction methods, and evaluation proced-ures – and not on the micro-didactical level that Streefland had in mind.By applying Freudenthal’s thinking within a micro-didactic context herevealed the level raising mechanisms of models and the didactical useof this power. His idea of ‘model of’ and ‘model for’ undoubtedly turnedout to be an eye-opener for many (see e.g., Treffers, 1991; Gravemeijer,1994a, 1994b, 1997, 1999; Van den Heuvel-Panhuizen, 1995, 2001; Grave-meijer and Doorman, 1999; Yackel et al., 2001, Van Amerom, 2002). Itis a simple, immediately recognizable and applicable idea, in which theessence of learning processes, namely raising the level of knowledge, isgiven a didactical entrance. For this reason it has been followed up inthinking about the didactics of mathematics education both within andwithout the RME community.
In particular, Gravemeijer (1994a, 1994b, 1997, 1999) worked out thisidea. He showed that the shift in models can also be connected to theprocess of mathematical growth in a more general way. The distinctionbetween ‘model of’ and ‘model for’ led him to split up the intermedi-ate level, between the situational level and the formal level of solvingproblems and mathematical understanding, into a referential and a generallevel. In addition to this, Gravemeijer emphasized the connection betweenthe use of models and the re-invention principle of RME. Because of theshift in model – that causes the formal level of mathematics to becomelinked to informal strategies – the top-down element that characterized the
16 MARJA VAN DEN HEUVEL-PANHUIZEN
use of models within the structuralist and cognitive approaches to math-ematics education could be converted to a bottom-up process.
How to find suitable models and model-eliciting activities?
Although the bottom-up process implies that the models are invented bythe students themselves, the students should be provided with a learn-ing environment – the whole of problems, activities, and contexts, placedwithin scenarios or trajectories, together with the stimulating and accen-tuating role of the teacher – to make this happen. As said earlier, withinRME, re-invention is taken to be guided re-invention. However, an essen-tial facet of this process is that the students should have the feeling ofhaving the lead in it. The emergence of models and their further evolutionmust occur in a natural manner.
The previous requirement puts a large onus on the development ofeducational materials. Education developers have to look for problem situ-ations that are suitable for model building and fit within a scenario ortrajectory that elicits the further evolution of the model, to let it grow intoa didactic model that opens up the path to higher levels of understandingfor the students. It should be clear that this puts certain demands on sucha problem situation. A key requirement is that the problem situation canbe easily schematized. Another demand is that, from the point of view ofthe students, there should be a necessity for model building. This aspect re-quires that the problem has to include model-eliciting activities, such as forinstance, planning and executing solutions steps, generating explanations,identifying similarities and differences, and making predictions. Althoughthese criteria already give a good indication of what is necessary to have amodel emerge, the most important is that the problem situations and activ-ities bring the students to identify mathematical structures and concepts.To discover which problems and activities can do this, ‘phenomenologicaldidactical analyses’, as Freudenthal (1978, 1983) called them, are needed.These analyses are focused on how mathematical knowledge and conceptscan manifest themselves to students and how they can be constituted. Partof this analysis is done by means of thought experiments and intercol-league deliberation – including discussions with teachers – in which bothknowledge about students and ideas about the desired mathematical con-cepts function as a guiding pre-image. The more important part of theanalysis, however, is done while working with students and analyzing stu-dents’ work. In this way what is important for constituting the model andhence what has to be ‘put’ in the problem situation can be found, so thatsituation-specific solutions can be elicited, which can be schematized, andwhich will have vertical perspective.

DIDACTICAL USE OF MODELS 17
THE BAR MODEL FOR LEARNING PERCENTAGE AS AN EXAMPLE
In the remaining part of this article the didactical use of models in RME isillustrated by the use of the bar model in a longitudinal learning-teachingtrajectory on percentage that was designed for the Mathematics in Contextcurriculum. Simply put, this bar model refers to a strip on which differentscales are depicted at the same time, as a result of which an amount or aquantity can be expressed through a different amount or quantity. Throughthis, the bar model touches on the essence of a rational number such aspercentage.
The main part of the percentage trajectory extends over three teachingunits of this curriculum:
– Per Sense (Van den Heuvel-Panhuizen et al., 1997), is meant for grade5 and intends to be a starting unit on percentage;
– Fraction Times (Keijzer et al., 1998b), is meant for grade 6 and coversthe domain of rational number more broadly and contains materialabout percentages, fractions, decimals and ratios;
– More or Less (Keijzer et al., 1998a), is meant for grade 6 and focuseson percentages, fractions and decimals.
Because my focus in this article is on giving a view of the longitudinaltrajectory and connections within it, I will restrict myself to the learning ofpercentage. The conclusion that, within Mathematics in Context, the teach-ing of percentage is considered a separate teaching strand should not bedrawn, however. On the contrary, learning percentage is embedded withinthe whole of the rational number domain and is strongly entwined withlearning fractions, decimals and ratios with the bar model connecting theserational number concepts (see Middleton, Van den Heuvel-Panhuizen, andShew, 1998). However, the bar model is not the only supporting model forthis domain. Apart from the bar, which later becomes a double numberline, the ratio table and the pie-chart also play an important role in theMathematics in Context trajectory on percentage (see Wijers and Van Ga-len, 1995; Middleton and Van den Heuvel-Panhuizen, 1995). For the sakeof clarity, this article will avoid describing the complexity that is typical inthis learning process. Nor will attention be given to how the trajectory onpercentage was developed and how the bar model found its place withinthe trajectory. Regarding the Per Sense unit, information about this designprocess can be found in Van den Heuvel-Panhuizen and Streefland (1993).The assessment that was developed for this unit is reported in Van denHeuvel-Panhuizen (1994, 1996).
The purpose of this article is to describe how, within a series of teachingunits as designed for the Mathematics in Context curriculum, the bar model

18 MARJA VAN DEN HEUVEL-PANHUIZEN
emerges and evolves, and supports the students’ learning. The descriptionis based on snapshots taken from the draft versions of these units7, includ-ing some student work that shows to what degree the intended process ofmodel building is in line with the students’ ways of working and thinking.The latter is important because it enables them to re-invent the modelon their own, or at least, to participate actively in the process of modelbuilding.
A brief overview of the percentage learning-teaching trajectory
In the three Mathematics in Context units the learning-teaching trajectoryon percentage starts with a qualitative way of working, with percentagesas descriptors of so-many-out-of-so-many situations, and ends with a morequantitative way of working with percentages by using them as operators.During this process of growing understanding of percentage, the bar gradu-ally changes from a concrete context-connected representation to a moreabstract representational model that moreover is going to function as anestimation model, and to a model that guides the students in choosing thecalculations that have to be made. This means that the model then becomesa calculation model. At the end of the trajectory, when the problems be-come more complex, it can also be used as a thought model for gettinga grip on problem situations. However, the foregoing does not mean thatseparate stages in the use of the bar model can be distinguished, or thatthere is a strict order in which these different applications are learned; thisis not the case. Indeed, though there is a kind of sequence laid down in theteaching units, the different interpretations of the bar model are accessiblein all stages of the learning process. It all depends on how the students seeand use the model.
Another change to the bar has to do with its form. Together with thechange in function the appearance of the model changes. Eventually thebar is reduced to a double number line. Although there is not a large dif-ference between these two models – both can be seen as a strip on whichon either side different units of measurement are used – this change hasthe advantage that the bar model becomes simpler and thus easier to use,and that it becomes more flexible. Among other things, this change makesthe model more suitable for going beyond one hundred percent.
Some first explorative activities
With the point of departure that education must build on the informal,preschool and outside school knowledge of the students, in mind, the PerSense unit – aimed at having the students making sense of percentage –starts with an introductory chapter in which the students are confronted
DIDACTICAL USE OF MODELS 19
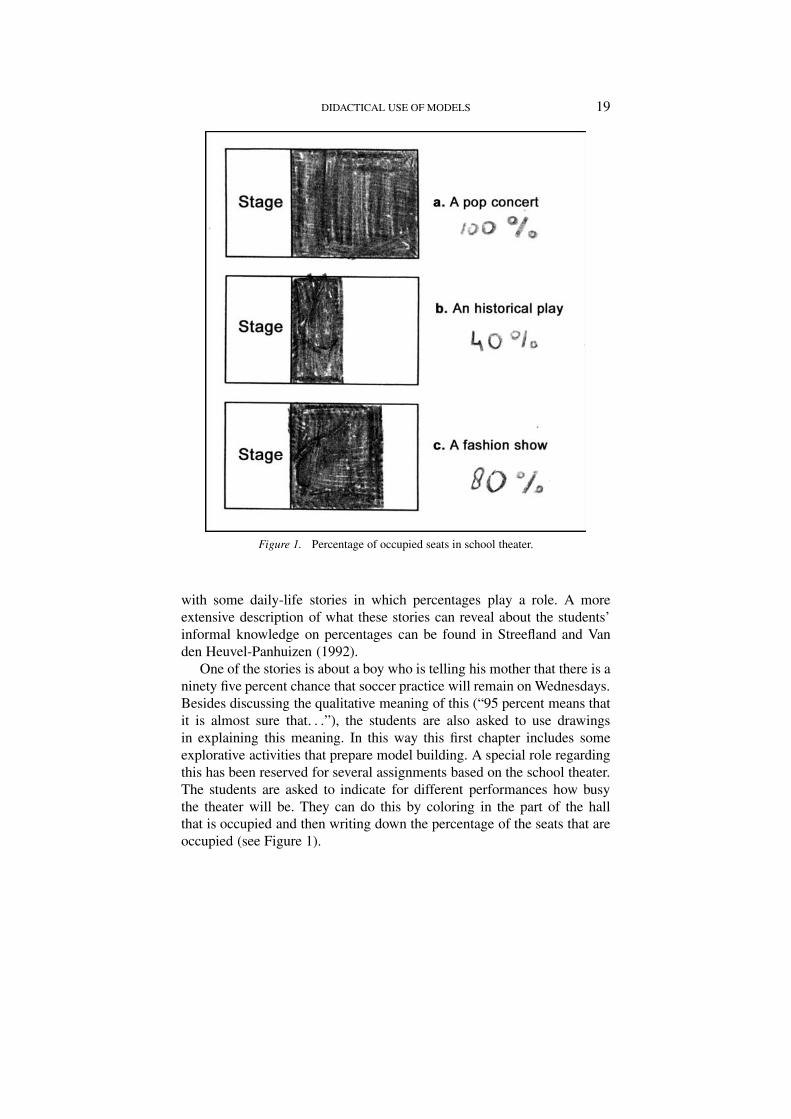
Figure 1. Percentage of occupied seats in school theater.
with some daily-life stories in which percentages play a role. A moreextensive description of what these stories can reveal about the students’informal knowledge on percentages can be found in Streefland and Vanden Heuvel-Panhuizen (1992).
One of the stories is about a boy who is telling his mother that there is aninety five percent chance that soccer practice will remain on Wednesdays.Besides discussing the qualitative meaning of this (“95 percent means thatit is almost sure that. . .”), the students are also asked to use drawingsin explaining this meaning. In this way this first chapter includes someexplorative activities that prepare model building. A special role regardingthis has been reserved for several assignments based on the school theater.The students are asked to indicate for different performances how busythe theater will be. They can do this by coloring in the part of the hallthat is occupied and then writing down the percentage of the seats that areoccupied (see Figure 1).
20 MARJA VAN DEN HEUVEL-PANHUIZEN
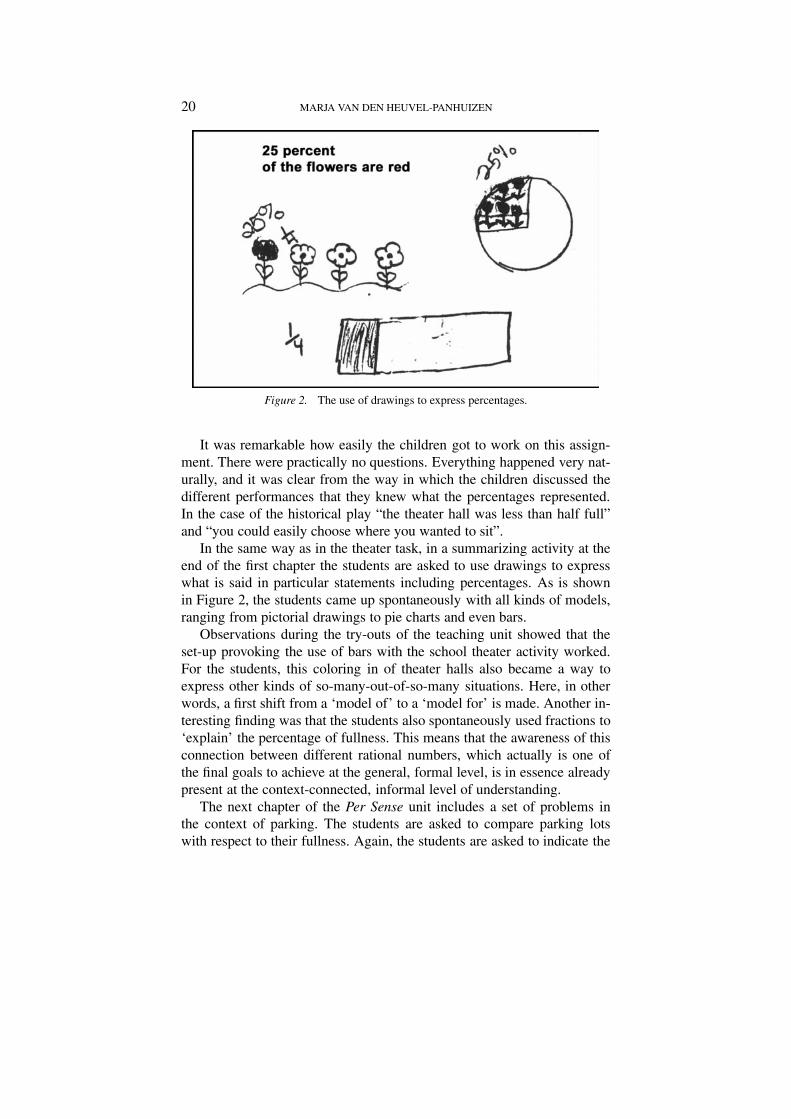
Figure 2. The use of drawings to express percentages.
It was remarkable how easily the children got to work on this assign-ment. There were practically no questions. Everything happened very nat-urally, and it was clear from the way in which the children discussed thedifferent performances that they knew what the percentages represented.In the case of the historical play “the theater hall was less than half full”and “you could easily choose where you wanted to sit”.
In the same way as in the theater task, in a summarizing activity at theend of the first chapter the students are asked to use drawings to expresswhat is said in particular statements including percentages. As is shownin Figure 2, the students came up spontaneously with all kinds of models,ranging from pictorial drawings to pie charts and even bars.
Observations during the try-outs of the teaching unit showed that theset-up provoking the use of bars with the school theater activity worked.For the students, this coloring in of theater halls also became a way toexpress other kinds of so-many-out-of-so-many situations. Here, in otherwords, a first shift from a ‘model of’ to a ‘model for’ is made. Another in-teresting finding was that the students also spontaneously used fractions to‘explain’ the percentage of fullness. This means that the awareness of thisconnection between different rational numbers, which actually is one ofthe final goals to achieve at the general, formal level, is in essence alreadypresent at the context-connected, informal level of understanding.
The next chapter of the Per Sense unit includes a set of problems inthe context of parking. The students are asked to compare parking lotswith respect to their fullness. Again, the students are asked to indicate the

DIDACTICAL USE OF MODELS 21
Figure 3. Comparing the fullness of parking lots.
degree of occupation for each parking lot by coloring in the rectangularframe that represents the parking lot. Next it can be determined whichparking lot is the fullest (see Figure 3).
The emergence of the bar model
The following step is that the rectangular frame that represents the ‘real’parking lot is replaced by an ‘occupation meter’. Such a meter is similarto, for instance, a display to check the amount of dust in a vacuum cleaneror a charge indicator for batteries. Like these, the occupation meter offers

22 MARJA VAN DEN HEUVEL-PANHUIZEN
Figure 4. The ‘occupation meter’ shows the fullness of the parking lot.
Figure 5. The ‘occupation meter’ reveals the percentage of fullness of the parking lot.
the students a way to represent the parking lot’s fullness. They can againcolor in the part that is occupied (see Figure 4).
Moreover, after doing this, the ‘occupation meter’ visualizes the per-centage of occupied spaces for the students. If the meter is completelycolored in, it means that the parking lot is 100% full. If 24 out of 40spaces are occupied the parking lot is filled for, let us say as a preliminaryfirst answer, a little bit over 50%. But after indicating 75% as the middlebetween 50% and 100%, and using it as a reference, 60% might come upas ‘a good guess’ (see Figure 5).
Depending on the actual numbers in these parking lot problems, theoccupation meter can be used in different ways to find the percentage offullness (see Figure 6). If 60 spaces out of 80 are occupied (a), the studentscan make use of an easy fraction. In the case of 50 spaces out of 85 (b), thepercentage of fullness can be approximated by a strategy based on repeatedhalving. And finally, when the figures are 36 out of 40 (c) the students canmaking use of a known percentage, 10% of 40 is 4, thus. . . (see Figure 6).
In other words, there is no fixed strategy to solve these percentage prob-lems, and the occupation meter allows this flexibility in approach. Thereis another great advantage to such an approach, next to the didactic ad-vantage of being able to connect flexibly to the differences in the students’knowledge of numbers – the benchmarks and number relations the studentshave on hand. Using this approach makes it possible that what is the aim at

DIDACTICAL USE OF MODELS 23
Figure 6. Different ways of using the ‘occupation meter’ for finding the percentage offullness.
Figure 7. Using the bar as an estimation model.
the highest level – making handy and flexible use of networks of numbersand properties of relations and operations – is already elicited at the lowestlevel.
The bar as an estimation model
Later on, in chapter three of the Per Sense unit, the ‘occupation meter’gradually changes into a plain bar model. In other words, again a shift ismade from a ‘model of’ to a ‘model for’ – that is to say from the perspect-ive of teaching; the real shift, of course, is made in the students’ thinking.The shift means that the model is no longer exclusively connected to the
24 MARJA VAN DEN HEUVEL-PANHUIZEN
Figure 8. Introduction of 1% as a benchmark.
parking lot context, but that it helps the students, for instance, to comparethe preference of fans for particular baseball souvenirs. Moreover, the shiftgives access to a higher level of understanding, in which the bar is usedto reason about so-many-out-of-so-many situations. Especially in caseswhere the problems concern numbers that cannot be simply converted toan easy fraction or percentage, the bar gives a good hold for estimatingan approximate percentage. An example of this is shown in Figure 7. Theproblem is about two groups of fans, the Giants fans and the Dodgers fans,who have been interviewed about their favorite baseball souvenir. In total,310 Giant fans have been interviewed and 123 of them chose the cap astheir favorite souvenir. In the case of the Dodgers fans, 119 out of 198 fanschose the cap. The students are asked which fans like the cap the best?
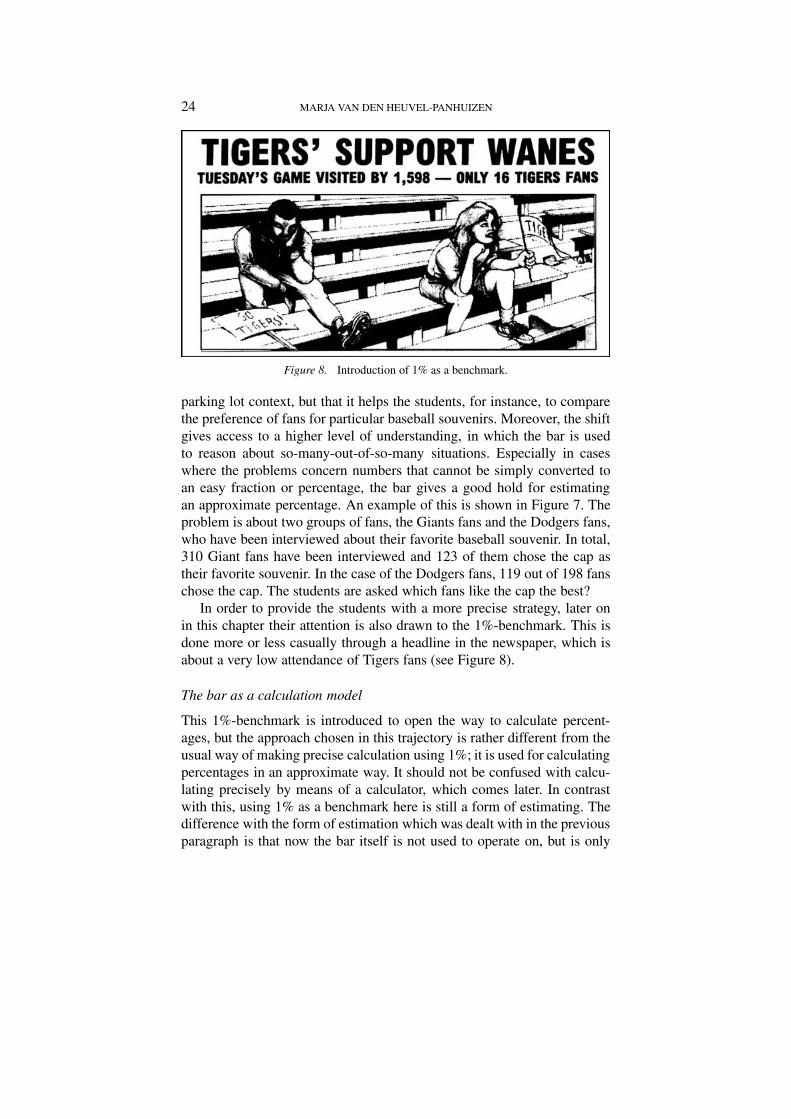
In order to provide the students with a more precise strategy, later onin this chapter their attention is also drawn to the 1%-benchmark. This isdone more or less casually through a headline in the newspaper, which isabout a very low attendance of Tigers fans (see Figure 8).
The bar as a calculation model
This 1%-benchmark is introduced to open the way to calculate percent-ages, but the approach chosen in this trajectory is rather different from theusual way of making precise calculation using 1%; it is used for calculatingpercentages in an approximate way. It should not be confused with calcu-lating precisely by means of a calculator, which comes later. In contrastwith this, using 1% as a benchmark here is still a form of estimating. Thedifference with the form of estimation which was dealt with in the previousparagraph is that now the bar itself is not used to operate on, but is only

DIDACTICAL USE OF MODELS 25
Figure 9. Using the bar as a calculation model with 1% as a benchmark.
Figure 10. A so-many-out-of-so-many situation converted into a percentage via a decimal.
used to guide the students in calculating the percentage. The bar tells themin an understandable manner what calculation they have to carry out to findthe answer (see Figure 9).
The bar is also relevant for the reverse, though, since it can also give aninsight into the results of calculations, which can be important for under-standing the relationship between percentages and decimal numbers. Thisis particularly important when working with percentages as operators.
A first step to this next stage in the learning of percentage is made in thegrade 6 unit Fraction Times8 where the students learn to convert so-many-out-of-so-many situations ‘directly’ into a percentage. Instead of dividingthe part by 1% of the total number, now the part is divided directly by thetotal number. This latter strategy clearly gives a different result than thefirst one, but it does not effect the ratio between the part and the whole, asthe students have experienced in their working with the ratio table whichhas a very central role in this teaching unit. As a result of working withthe ratio table, the students gradually learn to interpret the ratio in a flex-ible way, they can work towards a so-many-out-of-hundred situation anddiscover also that they can replace this so-many-out-of-hundred situationwith a so-many-out-of-thousand, out-of-ten or out-of-one situation. Suchexperiences in their turn, help in interpreting the decimal answer of the
26 MARJA VAN DEN HEUVEL-PANHUIZEN
Figure 11. Checking the sale price by one multiplication.
division in which the part is divided directly by the total number, as ananswer that stands for a so-many-out-of-ten, hundred, thousand, etceteraexpression that can be depicted on a bar. Depending on the degree ofaccuracy needed, any bar is suitable for this, but in the case of expressingthe ratio as a percentage, the 100-segment bar is most suitable, as is donefor instance in the problem about the results of an election (see Figure 10).
The percentage of votes that Jiminez got in the election is found bydividing his number of votes by the total number of respondents. Thedecimal that appears on the display of the calculator tells how many seg-ments out of the hundred have to be colored in. At the same time it is stillpossible to make an estimation: 121 out of 600 is approximately one fifthof the total, or about 20%.
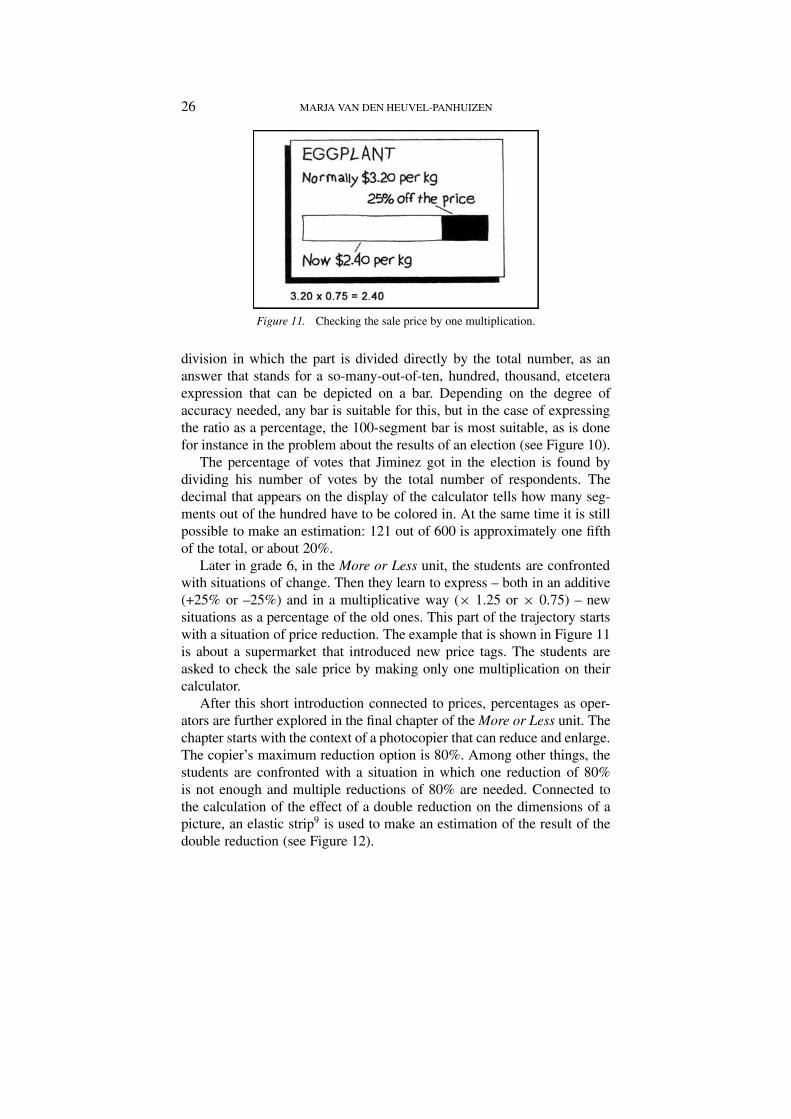
Later in grade 6, in the More or Less unit, the students are confrontedwith situations of change. Then they learn to express – both in an additive(+25% or –25%) and in a multiplicative way (× 1.25 or × 0.75) – newsituations as a percentage of the old ones. This part of the trajectory startswith a situation of price reduction. The example that is shown in Figure 11is about a supermarket that introduced new price tags. The students areasked to check the sale price by making only one multiplication on theircalculator.
After this short introduction connected to prices, percentages as oper-ators are further explored in the final chapter of the More or Less unit. Thechapter starts with the context of a photocopier that can reduce and enlarge.The copier’s maximum reduction option is 80%. Among other things, thestudents are confronted with a situation in which one reduction of 80%is not enough and multiple reductions of 80% are needed. Connected tothe calculation of the effect of a double reduction on the dimensions of apicture, an elastic strip9 is used to make an estimation of the result of thedouble reduction (see Figure 12).
DIDACTICAL USE OF MODELS 27
Figure 12. Using an elastic strip to find the result of double reduction of 80%.
Figure 13. Bar graph showing how the money grows in an interest-bearing savingsaccount.
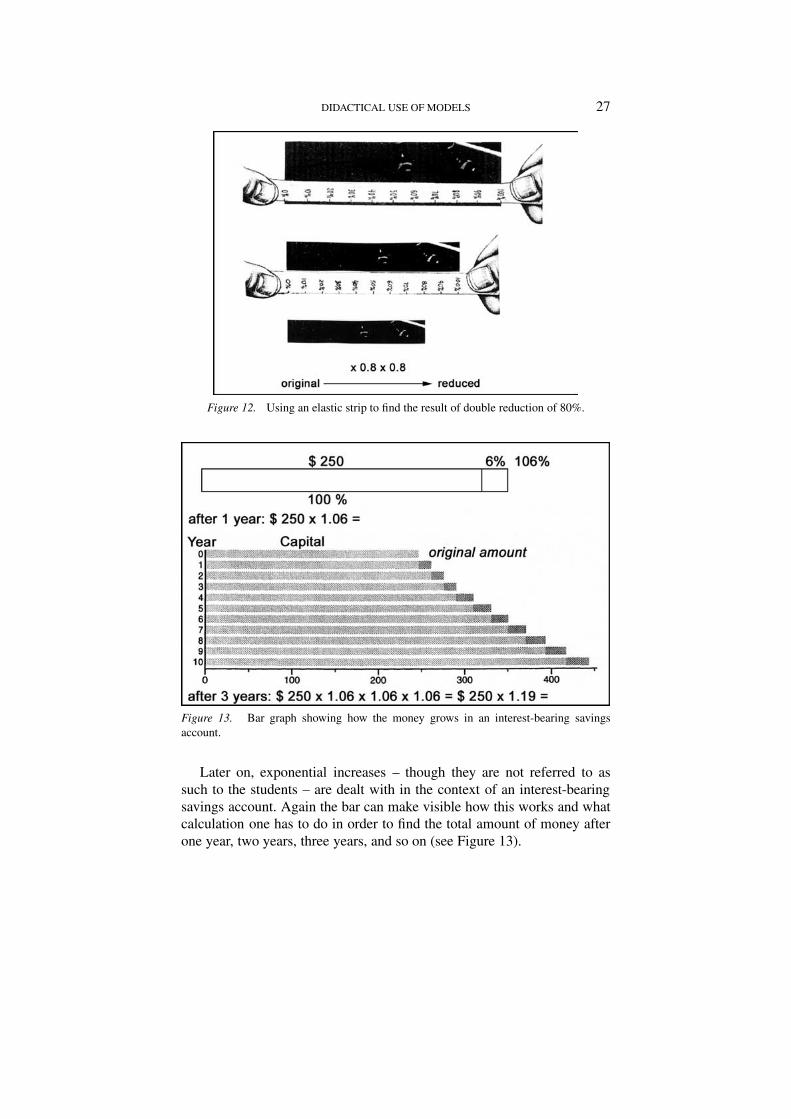
Later on, exponential increases – though they are not referred to assuch to the students – are dealt with in the context of an interest-bearingsavings account. Again the bar can make visible how this works and whatcalculation one has to do in order to find the total amount of money afterone year, two years, three years, and so on (see Figure 13).

28 MARJA VAN DEN HEUVEL-PANHUIZEN
Figure 14. The double number line as a support for backwards reasoning.
Figure 15. Finding the original price as the reverse of finding the sale price.
The bar as a thought model
As is shown in the previous example, the bar can also be helpful in un-derstanding complex situations. The same applies to situations that ask forbackward reasoning, which is the case in the next problem. Here the saleprice and the discount percentage are given and the students have to findout the original price (see Figure 14).
In the student work shown in Figure 14, instead of the bar a simpledouble number line is used to support the backwards reasoning. It con-firms in a way the natural switch from one version of the model to another.Crucial for both versions is that they help the students to understand thatthe sale price equals 75% of the original price and that they have to dividethe sale price by 3 and then multiply it by 4.
On a higher level, however, the original price can be found by meansof a one-step division by dividing the sale price by three fourths or byseventy-five hundredths, which is the opposite of finding the sale price

DIDACTICAL USE OF MODELS 29
when the original price and the percentage of discount has been given (seeFigure 15).
Actually, this latter solution is an example of vertical mathematizing. Itis based on a shortcut within the mathematical system.
TO CONCLUDE: A REFLECTION ON THE DIDACTICAL USE OF MODELS
The foregoing snapshots from a learning-teaching trajectory on percentageillustrate how, within RME, models are used as didactical tools for teach-ing mathematics. The didactical perspective taken in this article means thatthe spotlight here was not on modeling as a goal of mathematics education,although this is of course a significant characteristic of RME which at thesame time characterizes recent thinking about mathematics education. Agood example of the latter is the work of Lesh and Doerr (2000). Modeling,in their interpretation, relates to the process of model development throughwhich students gradually gain better understanding of a rich, meaning-ful problem situation by describing and analyzing it with more and moreadvanced means, and by going through a series of modeling cycles theyfinally develop an effective model with which they can also take on other(similar) complex problem situations. The focus in this article, however,was not on how students can be taught to solve problems through buildingmodels by progressive mathematizing, but on how mathematical conceptssuch as rational number and especially the understanding of percentagecan be taught. Although both learning processes are necessary, have a lotin common and support each other, working on students’ model buildingattitude will not be enough to teach them percentage.
This article focused rather on how they can learn percentage and howmodels can be used didactically to realize this learning process.
Formulated more precisely, it is not the models in themselves that makethe growth in mathematical understanding possible, but the students’ mod-eling activities. Within RME, students are not handed ready-made modelsthat embody particular mathematical concepts, but they are confrontedwith context problems, presented in such a way that they elicit modelingactivities, which in their turn lead to the emergence of models. Moreover,the longitudinal perspective of the percentage trajectory demonstrates clear-ly that the model that emerges here, the bar model, develops more andmore throughout the trajectory. The initial modeling activities, executedon context problems embedded in the students’ reality, accomplish thatthe students arrive at new realities, which in their turn can become thesubject of new modeling activities. This shift results in the bar modelmanifesting its function in different ways at different points in the tra-
30 MARJA VAN DEN HEUVEL-PANHUIZEN
Figure 16. Levels of understanding and the shifts from ‘model of’ to ‘model for’.
jectory: from a picture of a so-many-out-of-so-many situation to an oc-cupation meter to a double number line. In fact, the modeling activitiesdo not produce one single model, but a chain of models. Evoked by asequence of problems presented in a learning environment that stimulatesreflection and classroom interaction, new manifestations of the model keepcoming into view, giving access to new perspectives, new possibilities forproblem solving and higher levels of understanding, but at the same timeencompassing previous manifestations of the model. All this implies thatthe model provides the students with opportunities for progress, withoutblocking the way back to the sources in which the understanding is groun-ded. The foregoing also means that the bar model can function on differentlevels of understanding, and that it can keep pace with the long-term learn-ing process that students have to pass through. It is this enduring qualityin particular that makes the bar model so powerful. Its flexible and generalcharacter expose the different appearances of rational numbers and theirmutual relations; as a consequence of this, the students will get more of agrip on the underlying concept of rational number, which in turn combineswith applying the model on a progressively higher level: from depictinga partwhole situation to local estimating and calculating to mathematicalreasoning based on insights gained in (rational) number relations.
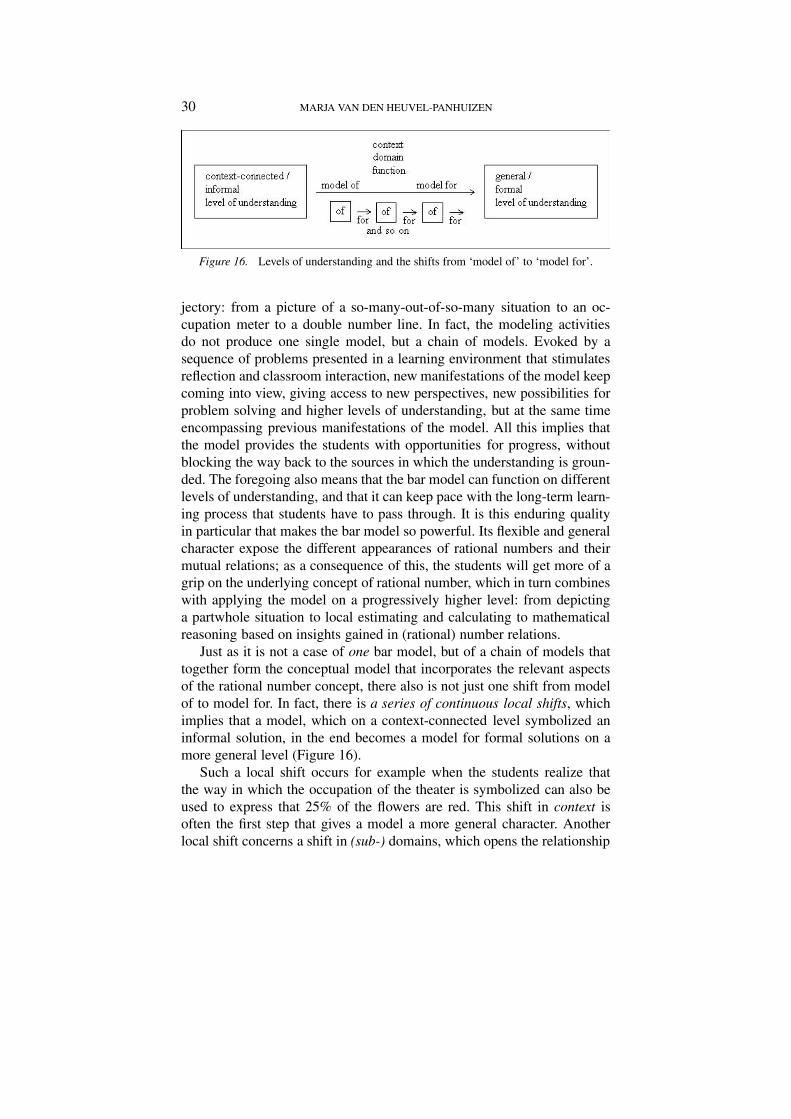
Just as it is not a case of one bar model, but of a chain of models thattogether form the conceptual model that incorporates the relevant aspectsof the rational number concept, there also is not just one shift from modelof to model for. In fact, there is a series of continuous local shifts, whichimplies that a model, which on a context-connected level symbolized aninformal solution, in the end becomes a model for formal solutions on amore general level (Figure 16).
Such a local shift occurs for example when the students realize thatthe way in which the occupation of the theater is symbolized can also beused to express that 25% of the flowers are red. This shift in context isoften the first step that gives a model a more general character. Anotherlocal shift concerns a shift in (sub-) domains, which opens the relationship
DIDACTICAL USE OF MODELS 31
between different (sub-) domains. This transition demands that the stu-dents understand that the same bar can be used for percentages as well asfor fractions. Although the relation between these rational numbers basedon well-known familiar fractions and percentages is an important corner-stone of the program, this shift occurs only when the children start makingconscious use of it. Yet another local shift occurs when the different waysin which the model can function – and students can use it – are connected:what at first was just depicting is used later to estimate a percentage, orto calculate back from the new reduced price to the original price. Thisshift in function in the long run leads to the students being able to makeflexible use of the model and manipulate it. At that point they have in effectreached the general, formal level of understanding.
Although a certain degree of ordering can be found in the different typesof local shifts – the shifts in context, for instance, will often happen first– these must not be seen as being strictly sequential. Within the learningprocess the different local shifts are closely linked. Together they form thebuilding blocks on the basis of which the rise in level of understanding isachieved.
Going through the different steps of the trajectory shown in this article,it seems that we have found a good scenario for teaching students percent-age. This was further confirmed in the trial lessons through the experiencethat the perspectives of the developers, the teachers and the students ap-peared to coincide most of the time. Teachers could easily identify withthe proposed trajectory. It was recognizable for them before they had car-ried it out themselves. In itself this inherent ability to convince is alreadytelling. Even more important however is the experience that the studentscame up with solutions that were similar to the ones that were forecastin the trajectory. This experience truly gave the feeling of being able toaccomplish what Streefland (1985b, p. 285) called:
to foresee where and how one can anticipate that which is just coming into viewin the distance.
However, these experiences must not result in concluding that this barmodel based trajectory is the final answer to the question of how studentscan best learn percentages. It is just one answer. The trajectory depicted inthis article should therefore not be seen as a fixed recipe, nor as a funnelin which the students have very few options to escape into finding anotherway of gaining certain insights, but as a model for teaching and learningpercentage in which the didactical use of models plays a key role.

32 MARJA VAN DEN HEUVEL-PANHUIZEN
NOTES
1. This article is an adapted version of Van den Heuvel-Panhuizen (1995).2. IOWO stands for Instituut Ontwikkeling Wiskunde Onderwijs (Institute for Develop-
ment of Mathematics Education).3. CRMSE is the predecessor of the National Center for the Improvement of Student
Learning and Achievement in Mathematics and Science (NCISLA) at the Universityof Wisconsin-Madison.
4. Streefland (1985a, p. 63) put it in Dutch as follows: “In de mentale omslag van nabeeldtot voorbeeld worden bewustwording en niveauverhoging in het leerproces manifest.”
5. The ‘seating arrangements’ (or ‘table arrangements’) refer to the way the children areseated in the pizza restaurant. The seating arrangement tells how many pizza are onthe table and how many children are seated at that table.
6. This is the English translation of: “Modellen van iets zijn nabeelden van een stukgegeven werkelijkheid; modellen voor iets zijn voorbeelden voor een te scheppen stukwerkelijkheid.”
7. The draft version of Per Sense was developed by Marja van den Heuvel-Panhuizenand Leen Streefland. This took place from 1991 to 1993. The draft version of Frac-tion Times was developed by Keijzer, Van Galen and Gravemeijer. More or Less wasdesigned in draft by Keijzer, Van den Heuvel-Panhuizen and Wijers.
8. The draft version of this unit was called Travail Times.9. This elastic strip was an idea of Abels (1991).
REFERENCES
Abels, M.: 1991, ‘Procenten in W12-16’, Nieuwe Wiskrant 10(3), 20–25.De Lange, J.: 1987, Mathematics, Insight and Meaning, OW&OC, Utrecht University,
Utrecht, The Netherlands.Freudenthal, H.: 1968, ‘Why to teach mathematics so as to be useful?’, Educational Studies
in Mathematics 1, 3–8.Freudenthal, H.: 1971, ‘Geometry between the devil and the deep sea’, Educational Studies
in Mathematics 3, 413–435.Freudenthal, H.: 1973, Mathematics as an Educational Task, Riedel Publishing Company,
Dordrecht, The Netherlands.Freudenthal, H.: 1975, ‘Voorwoord’, in R. de Jong, A. Treffers and E. Wijdeveld (eds.),
Overzicht van Wiskundeonderwijs op de Basisschool. Leerplanpublikatie 2, IOWO,Utrecht, The Netherlands.
Freudenthal, H.: 1977, ‘Antwoord door Prof. Dr H. Freudenthal na het verlenen van heteredoctoraat’ [Answer by Prof. Dr H. Freudenthal upon being granted an honorarydoctorate], Euclides 52, 336–338.
Freudenthal, H.: 1978, Weeding and Sowing. Preface to a Science of MathematicalEducation, Reidel Publishing Company, Dordrecht, The Netherlands.
Freudenthal, H.: 1983, Didactical Phenomenology of Mathematical Structures, RiedelPublishing Company, Dordrecht, The Netherlands.
Freudenthal, H.: 1987, ‘Mathematics starting and staying in reality’, in I. Wirszup andR. Street (eds.), Proceedings of the USCMP Conference on Mathematics Education onDevelopment in School Mathematics around the World, NCTM, Reston, VA.

DIDACTICAL USE OF MODELS 33
Freudenthal, H.: 1991, Revisiting Mathematics Education. China Lectures, Kluwer Aca-demic Publishers, Dordrecht, The Netherlands.
Gravemeijer, K.: 1982, ‘Het gebruik van contexten’, Willem Bartjens 1(4), 192–197.Gravemeijer, K.P.E.: 1994a, Developing Realistic Mathematics Education, CD-ß Press /
Freudenthal Institute, Utrecht, The Netherlands.Gravemeijer, K.P.E.: 1994b, ‘Educational development and developmental research in
mathematics education’, Journal for Research in Mathematics Education 25(5), 443–471.
Gravemeijer, K.P.E.: 1997, ‘Mediating between concrete and abstract’, in T. Nunes andP. Bryant (eds.), Learning and Teaching Mathematics: An International Perspective,Lawrence Erlbaum, Hove, Sussex, United Kingdom, pp. 315–343.
Gravemeijer, K: 1999, ‘How emergent models may foster the constitution of formalmathematics’, Mathematical Thinking and Learning 1(2), 155–177.
Gravemeijer, K. and Doorman, D.: 1999, ‘Context problems in Realistic MathematicsEducation: A calculus course as an example’, Educational Studies in Mathematics 39,111–129.
Keijzer, R., Van den Heuvel-Panhuizen, M., Wijers, M., Shew, J., Brinker, L.J., Pligge,M.A., Shafer, M.C. and Brendefur, J.: 1998a: ‘More or Less’, in T.A. Romberg (ed.),Mathematics in Contexts: A Connected Curriculum for Grade 5–8, EncyclopaediaBritannica Educational Corporation, Chicago, IL.
Keijzer, R., Van Galen, F., Gravemeijer, K., Shew, A., Cole, B.R. and Brendefur, J.: 1998b,‘Fraction Times’, in T.A. Romberg (ed.), Mathematics in Contexts: A Connected Cur-riculum for Grade 5–8, Encyclopaedia Britannica Educational Corporation, Chicago,IL.
Lesh, R. and Doerr, H. M.: 2000, ‘Symbolizing, communication and mathematizing:Key components of models and modeling’, in P. Cobb, E. Yackel and K. McClain(eds.), Symbolizing and Communicating in Mathematics Classrooms, Lawrence ErlbaumAssociates, Mahwah, NJ, pp. 361–383.
National Council of Teachers of Mathematics: 1989, Curriculum and Evaluation Standardsfor School Mathematics, NCTM, Reston VA.
Middleton, J.A., Van den Heuvel-Panhuizen, M. and Shew, J.A.: 1998, ‘Using bar repres-entations as a model for connecting concepts of rational number’, Mathematics Teachingin the Middle School 3(4), 302–311.
Middleton, J.A. and Van den Heuvel-Panhuizen, M.: 1995, ‘The ratio table’, MathematicsTeaching in the Middle School 1(4), 282–288.
Romberg, T.A. (ed.): 1997–1998, Mathematics in Contexts: A Connected Curriculum forGrade 5–8, Encyclopaedia Britannica Educational Corporation, Chicago, IL.
Streefland, L.: 1985a, ‘Wiskunde als activiteit en de realiteit als bron’, Nieuwe Wiskrant5(1), 60–67.
Streefland, L.: 1985b, ‘Vorgreifendes Lernen zum Steuern Langfristiger Lernprozesse’,in W. Dörfler and R. Fischer (eds.), Empirische Untersuchungen zum Lehren undLernen von Mathematik. Beiträge zum 4. Internationalen Symposium für Didaktikder Mathematik in Klagenfurt in 1984, Hölder-Pichler-Tempsky, Wien, Austria, pp.271–285.
Streefland, L.: 1988, ‘Reconstructive learning’, in Proceedings of the XII PME Conference,Veszprein, Hungary, Vol. I, pp. 75–91.
Streefland, L.: 1991, Fractions in Realistic Mathematics Education. A Paradigm ofDevelopmental Research, Kluwer Academic Publisher, Dordrecht.
34 MARJA VAN DEN HEUVEL-PANHUIZEN
Streefland, L.: 1992, ‘Het ontwerpen van een wiskundeleergang’, Tijdschrift voor Naschol-ing en Onderzoek van het Reken-Wiskundeonderwijs 10(4), 3–14.
Streefland, L. and Van den Heuvel-Panhuizen, M.: 1992, ‘Evoking pupils’ informal know-ledge on percents’, Proceedings of the Sixteenth PME Conference, University of NewHampshire, Durham, NH, Vol. III, pp. 51–57.
Streefland, L.: 1993, ‘The design of a mathematics course. A theoretical reflection’,Educational Studies in Mathematics 25(1–2), 109–135.
Streefland, L.: 1996, Learning from History for Teaching in the Future, Utrecht,Freudenthal Institute, Utrecht University, The Netherlands. (Regular lecture held at theICME-8 in Sevilla, Spain)
Treffers, A. and Goffree, F.: 1985, ‘Rational analysis of realistic mathematics education– the Wiskobas program’, in L. Streefland (ed.), Proceedings of the Ninth InternationalConference for the Psychology of Mathematics Education, OW&OC, Utrecht University,Utrecht, The Netherlands, Vol. II, pp. 97–121.
Treffers, A.: 1978, Wiskobas Doelgericht, IOWO, Utrecht, The Netherlands.Treffers, A.: 1987, Three Dimensions. A Model of Goal and Theory Description in Math-
ematics Instruction – The Wiskobas Project, Reidel Publishing Company, Dordrecht,The Netherlands.
Treffers, A.: 1991, ‘Didactical background of a mathematics programm for primary educa-tion’, in L. Streefland (ed.), Realistic Mathematics Education in Primary School, CD-ßPress / Freudenthal Institute, Utrecht University, Utrecht, The Netherlands, pp. 21–56.
Van Amerom, B.: 2002, Reinvention Early Algebra. Developmental Research on theTransition from Arithmetic to Algebra, CD-ß Press / Freudenthal Institute, Utrecht, TheNetherlands.
Van den Brink, J.: 1973, ‘Bijna noemen’, Wiskobasbulletin 3, 129–131.Van den Brink, J.: 1984, ‘Numbers in contextual frameworks’, Educational Studies in
Mathematics 15, 239–257.Van den Heuvel-Panhuizen, M. and Streefland, L.: 1993, ‘Per Sense – Een onder-
wijspakketje over procenten’, in M. Dolk and W. Uittenbogaard (eds.), Procenten –Op de grens van basisschool en basisvorming, Panama / HMN & Freudenthal Instituut,Utrecht, The Netherlands, pp. 25–48.
Van den Heuvel-Panhuizen, M.: 1994, ‘Improvement of (didactical) assessment by im-provement of the problems: An attempt with respect to percentage’, Educational Studiesin Mathematics 27(4), 341–372.
Van den Heuvel-Panhuizen, M.: 1995, ‘A representional model in a long term learning pro-cess – the didactical use of models in Realistic Mathematics Education’ paper presentedat the AERA conference, San Francisco, CA.
Van den Heuvel-Panhuizen, M.: 1996, Assessment and Realistic Mathematics Education,CD-ß Press Utrecht University, Utrecht, The Netherlands.
Van den Heuvel-Panhuizen, M., Streefland, L., Meyer, M., Middleton, J.A. and Browne, J.:1997, ‘Per Sense’, in T.A. Romberg (ed.), Mathematics in Contexts: A Connected Cur-riculum for Grade 5–8, Encyclopaedia Britannica Educational Corporation, Chicago,IL.
Van den Heuvel-Panhuizen, M.: 2001, ‘Realistic Mathematics Education in the Nether-lands’, in J. Anghileri (ed.), Principles and Practices in Arithmetic Teaching. InnovativeApproaches for the Primary Classroom, Open University Press, Buckingham, UnitedKingdom, pp. 49–63.
Van den Heuvel-Panhuizen, M.: 2002, ‘Realistic Mathematics Education as work in pro-gress’, in F.L. Lin (ed.), Common Sense in Mathematics Education. Proceedings of 2001
DIDACTICAL USE OF MODELS 35
The Netherlands and Taiwan Conference on Mathematics Education, Taipei, Taiwan,National Taiwan Normal University, Taipei, Taiwan, pp. 1–42.
Vygotsky, L.S.: 1978, Mind in Society: The Development of Higher PsychologicalProcesses, Harvard University Press, Cambridge, MA.
Wijdeveld, E.: 1980, ‘Zich realiseren’, in IOWO, De Achterkant van de Möbiusband,IOWO, Utrecht, The Netherlands, pp. 23–26.
Wijers, M. and Van Galen, F.: 1995, ‘Breuken, procenten en kommagetallen in het MiddleSchool Project’, in C. van den Boer and M. Dolk (eds.), Rekenen in de Bovenbouw vande Basisschool, Panama / HvU & Freudenthal Institute, Utrecht University, Utrecht, TheNetherlands, pp. 65–74.
Yackel, E., Underwood, D., Stephan, M. and Rasmussen, Ch.: 2001, ‘Didactising: Continu-ing the work of Leen Streefland’, in M. van den Heuvel-Panhuizen (ed.), Proceedingsof the 25th Conference of the International Group for the Psychology of MathematicsEducation, Freudenthal Institute, Utrecht University, Utrecht, The Netherlands, Vol. 1,pp. 239–249 and 251–253.
Freudenthal Institute, Utrecht University,Aïdadreef 12, 3561 GE Utrecht, The Netherlands,Telephone +31 (0)302635548, Fax +31 (0)302660430,E-mail: [email protected]