The development of an ant colony’s foraging...
11
Anim. Behav., 1995, 49, 649659 The development of an ant colony’s foraging range DEBORAH M. GORDON Department of Biological Sciences, Stanford University, Stanford, CA 94305-5020, US. A. (Received 23 September 1993; initial acceptance 27 December 1993, final acceptance 3 March 1994; MS. number: ~6807) Abstract. This study examines how an ant colony’s foraging range changes as the colony grows older, and whether colonies preserve their foraging ranges from year to year. Foraging ranges were measured in 88 colonies of known age over the course of 5 years. A seed-eating ant, Pogonomyrmex barbatus, colony lives for 15-20 years, reaching a stable size of about 12 000 workers when it is about 5 years old. On average, foraging ranges of colonies 2 years and older were similar in size, so a colony with about 2000 workers uses as much area to forage as one with 12 000. A colony’s foraging range increased most from ages 1 to 2 years, when the colony is still very small; increase of foraging area appears to be related to colony growth rather than overall colony size. From year to year, colonies did not retain or expand from a core foraging range. Instead, only about half the foraging range a colony used one summer was used by it the previous summer. However, the overlap of foraging ranges from year to year was significantly greater than expected if foraging ranges were distributed each year at random. The extent of year-to-year turnover in foraging range did not depend on colony age. Most colonies in which reproductives were observed were 5 years or older. These results are considered in the light of previous work showing that 3-4-year-old colonies, at about 75% of mature size, are more persistent in conflict with neighbours over foraging space than older, larger colonies. Effects of colony size on the rate of encounter with neighbours, and the costs of reproduction, may determine developmental changes in the territorial behaviour of an ant colony. Territory sizecan change during the lifetime of an individual. Such changes may result from fluctu- ations in resource abundance (Lott 1991). Models that predict optimal territory sizeusually compare the benefits available from resources on the terri- tory with the costs of maintaining and defending a territory (Schoener 1987). These models, which link territory size and costs of defence, suggest that at a given level of resource abundance, ability to win territorial conflict can determine territory size (e.g. Davies & Houston 1981). Territory size and territorial behaviour may also change during the ontogeny of territory own- ers. This has been demonstrated in vertebrates (Mackintosh 1970; Nolan 1978; Tooker & Miller 1980; Michener 1981; Doncaster & Macdonald 1991) and, to a lesser extent, in invertebrates (Koenig 1990). Life-history constraints may in- fluence the costs and benefits associated with a territory; for example, costs of reproduction appear to influence the timing of territory acqui- sition in the ontogeny of some cooperatively breeding birds (Stacey & Ligon 1987). A territory may have prospective value for a juvenile animal 0003-3472/95/030649+ 11 $08.0010 Cd 1995 The Association for the Study of Animal Behaviour if it can obtain a territory for use later in life, as in anole lizards (Stamps & Tollestrup 1984; Stamps 1987; Stamps & Eason 1989). Prospective value thus may contribute to the benefits of territory in young animals, and this may help to explain ontogenetic changes in territorial behaviour. Resource availability, costs of defence, and life history may all interact to influence territory size. The relationship between individual size and ter- ritory size is an example. Everything else being equal, it seems reasonable to assume that larger individuals, if they are more likely to win in territorial conflicts, should have larger territories. But this does not always hold when individuals grow larger as they grow older. Individuals may establish territories when they are young and small, while older, larger individuals devote more energy to reproduction than territorial defence. When young, small individuals value territory more than older, larger ones, the largest territories may not be occupied by the largest individuals (e.g. Stamps 1984). Ant colonies tend to grow larger as they grow older, and colony size is often related to colony 649
Transcript of The development of an ant colony’s foraging...
Anim. Behav., 1995, 49, 649659
The development of an ant colony’s foraging range
DEBORAH M. GORDON Department of Biological Sciences, Stanford University, Stanford, CA 94305-5020, US. A.
(Received 23 September 1993; initial acceptance 27 December 1993, final acceptance 3 March 1994; MS. number: ~6807)
Abstract. This study examines how an ant colony’s foraging range changes as the colony grows older, and whether colonies preserve their foraging ranges from year to year. Foraging ranges were measured in 88 colonies of known age over the course of 5 years. A seed-eating ant, Pogonomyrmex barbatus, colony lives for 15-20 years, reaching a stable size of about 12 000 workers when it is about 5 years old. On average, foraging ranges of colonies 2 years and older were similar in size, so a colony with about 2000 workers uses as much area to forage as one with 12 000. A colony’s foraging range increased most from ages 1 to 2 years, when the colony is still very small; increase of foraging area appears to be related to colony growth rather than overall colony size. From year to year, colonies did not retain or expand from a core foraging range. Instead, only about half the foraging range a colony used one summer was used by it the previous summer. However, the overlap of foraging ranges from year to year was significantly greater than expected if foraging ranges were distributed each year at random. The extent of year-to-year turnover in foraging range did not depend on colony age. Most colonies in which reproductives were observed were 5 years or older. These results are considered in the light of previous work showing that 3-4-year-old colonies, at about 75% of mature size, are more persistent in conflict with neighbours over foraging space than older, larger colonies. Effects of colony size on the rate of encounter with neighbours, and the costs of reproduction, may determine developmental changes in the territorial behaviour of an ant colony.
Territory size can change during the lifetime of an individual. Such changes may result from fluctu- ations in resource abundance (Lott 1991). Models that predict optimal territory size usually compare the benefits available from resources on the terri- tory with the costs of maintaining and defending a territory (Schoener 1987). These models, which link territory size and costs of defence, suggest that at a given level of resource abundance, ability to win territorial conflict can determine territory size (e.g. Davies & Houston 1981).
Territory size and territorial behaviour may also change during the ontogeny of territory own- ers. This has been demonstrated in vertebrates (Mackintosh 1970; Nolan 1978; Tooker & Miller 1980; Michener 1981; Doncaster & Macdonald 1991) and, to a lesser extent, in invertebrates (Koenig 1990). Life-history constraints may in- fluence the costs and benefits associated with a territory; for example, costs of reproduction appear to influence the timing of territory acqui- sition in the ontogeny of some cooperatively breeding birds (Stacey & Ligon 1987). A territory may have prospective value for a juvenile animal
0003-3472/95/030649+ 11 $08.0010 Cd 1995 The Association for the Study of Animal Behaviour
if it can obtain a territory for use later in life, as in anole lizards (Stamps & Tollestrup 1984; Stamps 1987; Stamps & Eason 1989). Prospective value thus may contribute to the benefits of territory in young animals, and this may help to explain ontogenetic changes in territorial behaviour.
Resource availability, costs of defence, and life history may all interact to influence territory size. The relationship between individual size and ter- ritory size is an example. Everything else being equal, it seems reasonable to assume that larger individuals, if they are more likely to win in territorial conflicts, should have larger territories. But this does not always hold when individuals grow larger as they grow older. Individuals may establish territories when they are young and small, while older, larger individuals devote more energy to reproduction than territorial defence. When young, small individuals value territory more than older, larger ones, the largest territories may not be occupied by the largest individuals (e.g. Stamps 1984).
Ant colonies tend to grow larger as they grow older, and colony size is often related to colony
649
650 Animal Behaviour, 49, 3
age. Although individual ants of most species are short lived, ant colonies can persist for many years. Because colonies are the reproductive units, colonies can be viewed as the individuals that make up ant populations. Colonies are initially founded by one or a few queens, which produce all the workers. Workers fmd the food and pro- vide the care necessary to rear more workers, and worker production often accelerates as worker number increases, levelling off when the colony reaches its mature size.
It is often assumed that an ant colony’s territory or foraging range is correlated with its size (e.g. Hiilldobler & Wilson 1990, page 220), because in territorial conflict between colonies, the larger colony is thought likely to win. However, there has been little empirical work on this. Several studies have examined the effect of colony size on territorial conflict, with diverse results: in some species, larger colonies, or colonies that appear larger, usually win (Holldobler 1981; Adams 1990); in others, more persistent, smaller colonies are favoured (Gordon 1992). To my knowledge no previous study of ants has examined directly the relation between territory size and colony age or size.
Because of the paucity of long-term data, there have been few studies of the development of social insect colonies. Such data are now available for a population of colonies of the seed-eating or har- vester ant, Pogonomyrmex barbatus. The territory of a harvester ant colony was originally described as a fiercely defended set of permanent foraging trails, and these ants are often mentioned in textbooks as an example of a stable territorial system (e.g. Krebs & Davies 1984, page 150). But subsequent work has shown that on the timescale of days and weeks, foraging trails are not stable. A colony uses different foraging trails from one day to the next, and where a colony forages depends in part on the foraging behaviour of its neighbours (Gordon 1991, 1992). Here I consider the year-to-year stability of foraging ranges.
In harvester ants, new colonies are founded after a yearly mating aggregation, composed of the virgin males and queens from all colonies in a large area, when newly mated queens fly off at random to find a new nest site. Thus neighbouring colonies are unrelated, unless a newly mated queen happens to land back near her parent nest, and there is no evidence this tends to occur. After the mating flight, males die. Each colony is
founded by a single queen, which lives for 15-20 years. All the ants in the colony are produced by this queen, which uses sperm stored from the original mating flight; ant workers live at most a year (Gordon & Holldobler 1988). By the time a colony is 5 years old, it reaches a stable size of about 12 000 workers (see Fig. 2).
As a colony grows older and larger, its internal organization (Gordon 1987) and territorial behav- iour change. Ants distinguish workers of neigh- bouring colonies from those of more distant ones (Gordon 1989a); this recognition is probably established by repeated encounters between workers of neighbouring colonies at the edges of foraging ranges. Colonies 5 years old or older are likely to avoid conflict with neighbours over foraging area, although colonies of any age will usurp a neighbour’s foraging range if daily con- tact between neighbours is interrupted (Gordon 1992). Quickly growing colonies, aged 3-4 years, with 4000-8000 workers, interact with neigh- bours more persistently and aggressively than do older, larger colonies, both in natural (Gordon 1991) and experimental (Gordon 1991, 1992) conditions.
Why is the territorial behaviour of younger, smaller colonies different from that of older, larger ones? A foraging range may have prospec- tive value for a young, growing colony if the colony can maintain use of the same foraging range in the future. Colony size, and the area a colony’s foragers can cover, may determine how neighbouring colonies partition foraging area. Life-history constraints may interact with the effects of colony size, so that ontogenetic changes in a colony’s allocation to reproduction influence its territorial behaviour. To examine how these factors contribute to the development of colony behaviour, I ask whether colonies preserve their foraging ranges from year to year, how the size of a colony’s foraging range changes as the colony grows older and larger, and when colonies begin to reproduce.
METHODS
The work was conducted at a site near Rodeo, New Mexico, where I have followed a population of about 250 identified P. barbatus colonies since 1985. Using the census, the ages of all colonies founded since 1985 could be specified exactly;

Gordon: Development of ant colony foraging range 651
1 estimated the ages of older colonies using measurements of nest size and numbers of ants active outside the nest. Census methods are described in Gordon (1987, 1991, 1992). For the present study I used maps of foraging ranges made each summer from 1988 to 1992, during which time, the density of colonies at the study site had doubled, from 0.002 to 0.004 colonies per m2.
Foraging Rehaviour
Foragers sometimes travel away from the nest in a linear trail and then fan out to search for seeds. In the absence of human intervention, colonies rarely form recruitment trails. Instead, foragers are widely dispersed and move slowly in search of seeds, then travel more quickly and directly back to the nest. Ants usually continue searching until they find a food item (Gordon 1991), and foraging continues until high midday temperatures drive all ants back into the nest. Foragers travelling in the same general direction tend to cover a fan-shaped region emanating from the nest. These regions can be very irregular in shape, often becoming more elongated during the course of the day, as areas closer to the nest become depleted. A foraging track may be visible even when it is not used by any foragers that day, because the ants have previously cleared the veg- etation along it, but at my study site, such cleared ‘trunk trails’ (sensu Hiilldobler 1976) are rare. Here I use ‘foraging trail’, ‘foraging direction’ and ‘foraging range’ to refer to regions occupied by ants at a particular time, not to any features of the ground visible in the absence of ants.
The area occupied by foragers of a particular colony changes from one day to the next. A mature colony may have up to eight habitual foraging directions, of which it uses about three to five a day (Gordon 1991). Each morning, a decision about which foraging direction to use is made by the patrollers, a distinct gr;oup of workers that search the foraging area before the foragers become active (Gordon 1983, 1989b, 1991).
Foraging Maps
To map the foraging area of a colony, my assistants and I used a reference grid set out at 6.2-m intervals, extending about 15 m on all sides of the nest. Criteria used in drawing the foraging
maps changed slightly from 1988 to 1992 (details in Gordon 1991, 1992) but in general, foraging regions were designated as those in which there were more than five ants passing any point within 20 s; the edges of the region were designated at those places where no ants came within 1 m in 10 s. I estimate the maps are accurate at least to the nearest 0.5 m. Colonies forage from about sunrise to midday (Gordon 1983), and the location of a colony’s foraging activity changes in the course of this activity period. Foraging maps are cumulative, showing all locations in which a colony was seen to forage on a given day, in at least two observations.
In the course of five summers (1988-1992), we obtained 404 foraging maps of 88 colonies of known age, with l-7 map-days of the same colony in 1 year. Of these 88 colonies, 33 were mapped in more than 1 year, and of these, 17 were mapped in 3 successive years, 11 were mapped in 2 successive years, one was mapped twice with a year inter- vening, and four were mapped twice with 2 years intervening.
Some foraging maps were made in the course of other studies (Gordon 1991, 1992); here I use only maps of undisturbed colonies before any manipu- lations were performed. Experimental manipu- lations included putting out extra food, and preventing a colony from foraging for 2 weeks. In most of the experiments, colonies returned to pre-manipulation foraging behaviour during the same summer that experiments were performed. This suggests that none of the manipulations would affect year-to-year changes in foraging range.
I used a digitizing computer program (MTV, Data Crunch) to measure the area of each forag- ing trail, its length (distance between nest entrance and furthest point of foraging trail), and its direc- tion (taking due north as 0 degrees), on all 404 foraging maps.
Figure 1 shows a series of foraging maps for one colony in 2 successive years.
Area of Foraging Range and Colony Age
To calculate the mean size per year of foraging area for colonies of a given age, I used the total foraging area for each colony, averaged over all days on which it was mapped in a given year. Total foraging area is the sum of the areas of all foraging trails, or regions of any shape, occupied

652
16 July 19 July 29 July 1991 1991 1991
22 July 1992
“y;;z
10 m
Animal Behaviour, 49, 3
5 August 1992
12 August 1991
1991 Cumulative
1991-1992 Overlap
10 August 1992
1992 Cumulative
Figure 1. Foraging maps for the same colony (a) 4 days in 1991 and the cumulative map for 1991, which shows all areas ever occupied, (b) 4 days in 1992 and the cumulative map for 1992 and (c) the overlap in foraging ranges of 1991 and 1992, the intersection of the cumulative maps for 1991 and 1992. All maps are drawn to the same scale. The nest entrance is at the centre of each map. The colony was 2 years old in 1991.
by foragers. Foraging maps were made each year in bouts, with the consequence that most colonies that were mapped in a given year were mapped on the same days. Averaging over days within a year thus reduces the effect of day-to-day variation on comparisons between colonies. I used mean forag- ing area per year as the variate in an ANOVA testing for effects of colony age, calendar year and the age-by-year interaction.
For measures of foraging range area as a func- tion of colony age, there were 138 colony-years (88 colonies, plus 50 additional colony-years for 33 of the colonies, as above). These data included a smaller sample of l-year-old colonies compared with those of other ages (see Fig. 2). To check the results for l-year-old colonies, I measured forag- ing areas of 10 l-year-old colonies in 1993, each mapped on 2-3 days using the methods described above. These 1993 data were not included in any other analysis.
,
Year-to-year Changes in Area of Foraging Range
For colonies that were mapped in successive years, I calculated relative change in foraging area
as the difference in size of foraging area (in m2) from one year to the next, divided by the size in the first year.
To test whether colonies with larger foraging ranges are more likely to expand them, I per- formed regressions on mean area of foraging range in 1 year as a function of the same measure the previous year. I performed separate regres- sions for year-to-year transitions within different age classes (1-2 years; 2-3, 34 and 2-4 years; +5 years; and 5 years and older). Data from the same colonies in different years were not used in any regression; to ensure this for the colonies 5 years and older, I eliminated the earlier of two transitions each for three colonies. For this analy- sis there were 43 year-to-year transitions involving 29 colonies.
I used two procedures to test whether a colony occupied the same foraging range in successive years. The analysis for both procedures used data from 50 year-to-year transitions involving 33 colonies, including four transitions with 2 years intervening. The two procedures differ in how they treat daily variation in the location of forag- ing. The first procedure ignores such variation.

Gordon: Development of ant colony foraging range 653
- 3 4 5 >5
11
12 000 2 2 8
8000 ; 3 -a
4000 g
Colony age (years) Figure 2. Mean (+ SE) total area covered by foragers ( 0) and colony size (in number of workers; ---) in relation to colony age. N-values above bars indicate the number of colony-years in measure of total area of foraging range. The curve for colony size is derived from counts of all ants in colonies of known age; data and sample sizes are given in Gordon (1992).
To compare the foraging areas of a colony in 2 years, a computer program was used to identify the area occupied each year on all days mapped, that is, the year’s cumulative map (see Fig. 1). The map was divided into a grid of squares, the side of each square representing 0.01405 cm and thus much smaller than 0.5 m, the estimated accuracy of a foraging map. The computer analysis smoothed the irregular shapes of the foraging trails or regions by recording each region as a sector of a circle with a radius of the measured length of the trail or region, and an area and direction as measured. The first measure of over- lap between years was simply the total area of the regions that had been occupied sometime in both years (see Fig. 1, which shows overlap of the original foraging maps, not of the sectors used in the analysis).
The second procedure weights each grid-square by the fraction of days it was occupied by foragers in a given year. For example, if a colony was mapped four times in 1 year, and a particular grid square was occupied two of those four times, it is ‘assigned a value of 0.5; if it was never occupied, it is assigned a value of 0. The ‘weighted area’ for a colony in 1 year is the sum of all these weighted values. Overlap between 2 years was calculated as the sum, over all grid squares, of the product of
the two weighted values for that square in the 2 years. If a square was never occupied in 1 year, its value, and the product of the 2 years’ values for that square, will be 0.
I used this weighted measure to test whether overlap differed significantly from that expected by chance. For the 2 years compared, foraging areas differed in size, so I 6rst eliminated the portion of the map covered only in the year of the larger foraging range, because there could be no overlap in this portion. To do this, I first deter- mined the circle of minimum radius that enclosed all occupied regions for each year’s cumulative map. One year’s circle was larger than the other’s, I then superimposed the smaller of the two circles on the larger map, and after eliminating every- thing outside it, I determined the weighted foraging area as above.
To obtain an expected value for overlap, I calculated the proportion of the enclosing circle occupied by each year’s weighted area. The prod- uct of the proportions of area occupied in each year is the amount of overlap expected if foraging were distributed randomly in space. Using a Wilcoxon matched-pairs signed-ranks test for each pair of years, I compared the product of the proportions of area occupied with the proportion occupied by the observed weighted overlap. This null model assumes colonies are equally likely to forage anywhere in the circle. Thus, it is likely to overestimate expected overlap (i.e. make it more difficult to demonstrate overlap significantly greater than expected) if there are any physical characteristics that impede foraging in some area of the circle around each nest. However, I rarely observed such impediments; foragers simply go around the base of small bushes, and colonies frequently appear to cover a full circle around their nests in the course of several days.
Age at First Reproduction
The only way to determine whether a colony has produced sexual forms, that is, males and unmated, winged queens, is to excavate the colony in the weeks before the annual mating tight, which would probably kill the colony. However, the following less destructive method gives some information on the age at which colonies first produce sexual forms. The mating fight usually takes place after the first few heavy

654 Animal Behaviour, 49, 3
rains of the summer; rain may soften the soil and facilitate digging by newly mated queens. During the week or two before the mating flight, reproductives often come briefly to the nest entrance in the late morning, at the time the mating flight would begin, and then go back inside the nest or are pulled back in by workers. In the course of this behaviour, workers and reproductives may somehow assess whether con- ditions outside the nest are appropriate for a mating fight; it is not known how large numbers of colonies all manage to send reproductives to the mating flight on the same day. The presence of males and unmated queens in a colony shows that a colony is reproducing, although their absence does not show a colony is not reproduc- ing; some colonies may have alate reproductives that do not emerge from the nest before the day of the mating flight. In the week before the mating flights of 1992 and 1993, we noted the identities of all colonies in which reproductives were observed at nest entrances. Observations were made during daily walks around the study site. In 1993, in the course of other work, we checked 11 l-year-old colonies daily for repro- ductives during the week before the mating flight. Reproductives were seen in a total of 77 colonies of known age.
RESULTS
Area of Foraging Range and Colony Age
Older, larger colonies do not necessarily have larger foraging ranges. On average, foraging ranges of colonies 2 years or older were similar in size (Fig. 2). Foraging ranges of l-year-old colonies were much smaller. There was no signifi- cant effect of colony age (sum of squares: 4370.9, F 5,, , =2.1, NS); an a posteriori Duncan’s multiple- range test showed significant differences in size only between the foraging ranges of l-year-old colonies and those of other ages. Results for the 10 l-year-old colonies mapped in 1993 showed a mean ( f SD) total foraging range of 9.4 & 5.9 m2, similar to the mean (6.5 & 5.2 m’) for the 1 year olds mapped in 1988-1992 (Fig. 2).
Area of foraging rangevaried among calendar years (sum of squares: 9034.3, Fd., 11 =5.5, P<O.OOl) and there was a significant age-by-year interaction (sum of squares: 14716.8, F15,, I, =2.4, BO.005; Fig. 3). Many factors could contribute
6 80 .s m $ 60
.3 $ 40
-z g 20
5
2 0 1987 1988 1989 1990 1991 1992 l! 33
Figure 3. Colony age x calendar year interaction. Each point shows the mean total foraging area covered by foragers in colonies of a certain age. 0: Colonies I year old; n : colonies 2 years old; 0 : colonies 3 years old; 0: colonies 4 years old; A : colonies 5 years old; A : colonies 5 years and older (5-15 years). Data were not available every year for colonies of each age.
to yearly variation: years differed in rainfall and in overall foraging activity level (personal obser- vation), and colony density increased over the 5 years.
Year-to-year Changes in Area of Foraging Range
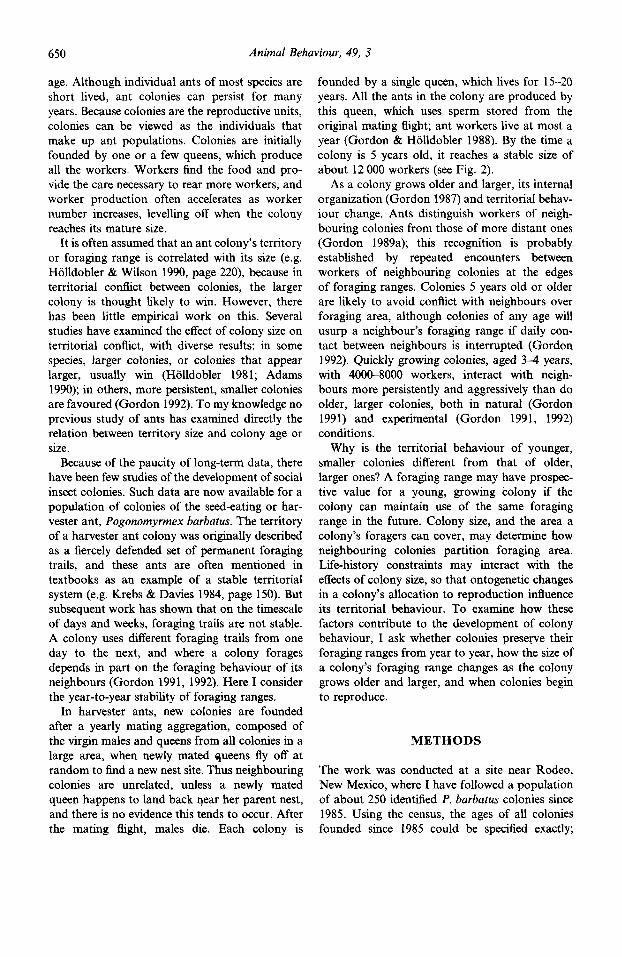
The year-to-year increase in foraging range was greatest at l-2 years of age (Fig. 4). This result was obtained by comparing the area of foraging range of the same colony in 2 successive years. Thus it differs from the result described above (Fig. 2), based on the average area for all colonies of a given age regardless of year, which shows that the average foraging range of a l-year-old colony was smaller than that of a 2-year-old colony. The two results are not equivalent, but they are consistent.
Increase in foraging range appears to be related to colony growth rather than overall colony size. Foraging ranges increased during years 1 to 4, when the number of workers in the colony was increasing, and foraging ranges stopped increasing in colonies that were 5 years or older, which were no longer growing in size (Fig. 2). Relative increases in foraging range were greater when colonies made the transition from 2 to 3, 2 to 4 and 3 to 4 years of age, then when they grew from 4 to 5 years, or older (Fig. 4). Thus the increase in foraging range is not a function of colony size;
Gordon: Development of ant colony Aforaging range 655
N=8 N=12 T
2-3 3-4 4-5 25
2O:
Age transition (year)
Fjgure 4. Mean ( +sE) relative increase in foraging range of colonies in 2 successive years, making the transition between the indicated ages. Relative increase is the difference between the mean total foraging area of a colony in 2 years, divided by the mean total foraging area in the previous year. N-values above bars indicate the number of colony transitions.
older, larger colonies do not expand their foraging ranges as much as younger, smaller ones.
Among 3-4-year-old colonies, those that had larger foraging ranges to begin with, expanded their foraging ranges more. A regression of mean total area of foraging range on mean total area the preceding year had a positive slope for colonies in transition from ages 3 to 4 years (slope=0.5, intercept=%8, r2=0.8, N=8, P<O,OO5). For quickly growing colonies aged 34 years, a large foraging range appears to facilitate further expan- sion. There was no such tendency for colonies of other ages. Similar regressions were not significant for colonies moving from ages 1 to 2 (slope=0.3, intercept=22.4, ?=0.02, N=S, NS) from 2 to 3, or 2 to 4 years (slope=0.2, interceptz26.9, adjusted
I PzO.1, N=13, Ns), 4 to 5 years (slope=O.l, inter- cept=16.9, ;=@l, N=8, NS) nor from 5 years or older to the next year (slope=0.3, intercept= 17.5, ?=@I, N=9, NS).
Year-to-year Overlap in Foraging Range
From year to year, colonies did not retain or expand from a core foraging range. If a colony kept exactly the same foraging range in 2 succes- sive years, the region of overlap of 2 successive years’ foraging ranges would be exactly the same
size as the foraging range the first year. Jf ;, coJon\ expanded its fOt’aghg area from one !.cZIr :x1 rhe next, so that year J’s area was cc>mpIrteJ) s:an- tained in year 2’ s, then the overlap of‘ 2 ~uccr~siLz years would also be exactly the came ci7(: ,!, the foraging range of the first year. C‘omJ,:lring tJ~e foraging ranges of a colony in 2 year-\. J <:lJcLIJ,,ted how much of the first year’s fomping rLrngr waz covered by the overlap of the 2 !KIIY us;r~!: the first measure of overlap described in the ivfe&ds, To do this, I divided the area <If the ~cgi~?~~ of overlap by the area of the colony's foraging range the first year. For example, for the maps shown in Fig. 1, the area of the foraging range in the first year, 1991, was 70.9m’; the total are:~ of the region of overlap between 1991 and 1992 was 35.6 m’; the proportion of the area of overlap, out of the area used in 1991, was 0.50.
Only about half the foraging range a colony used one summer was used by it the previous summer. The area of foraging range overlap between years was usually about half the area used the previous year; the mean proportion was 044 i 0.22 (N=50 year-to-year transitions, including five with 1 or more years intervening; range=O.Ol-1).
There was no relation between colony age and proportion overlap from one year to the next, using the first measure described above, although the trend was for overlap to decrease as a colony grew older. Mean ( i SD) proportion of overlap for colonies l-2 years old in the first year of the comparison was 0.53 i 0.25 (N= 17); for 3-4 year- oIds, 0.43 f O-21 (N= 18); for 5 years and older, 0.39 f 0.19 (N= 14); these differences were not significant (ANOVA, effect of age class; sum of squares: 0.17, F,,,,=21.76, NS).
The overlap of foraging ranges was significantly greater than expected if foraging ranges were tc intersect at random from year to year (null mode: described above; Wilcoxon matched-pairs signed, ranks test, z corrected= - 4.56, ZQO.0001). Tht amount of overlap was larger than expected in 4( of the 50 cases.
Age at First Reproduction
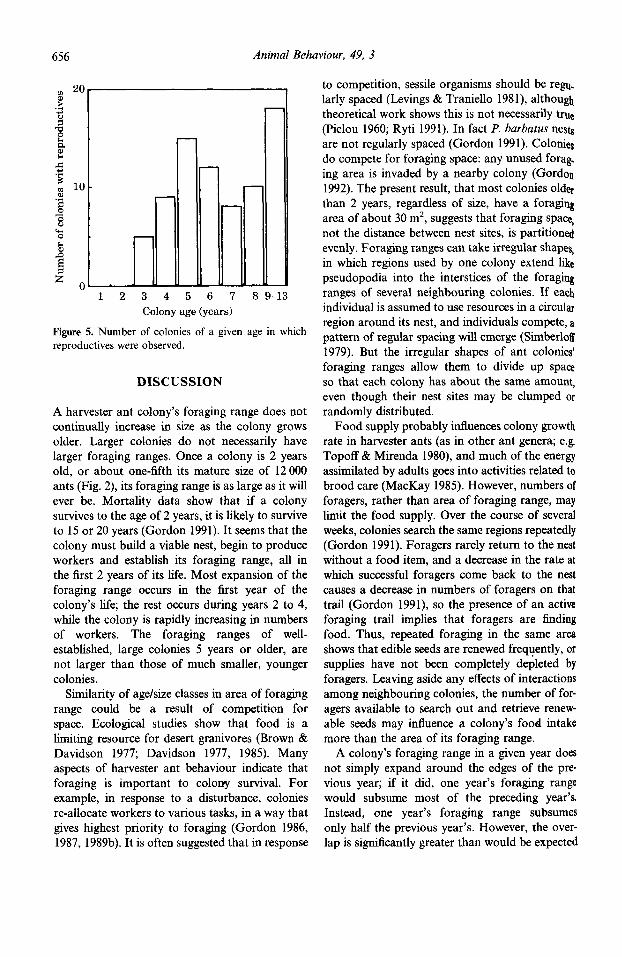
Most colonies in which reproductives wer observed were 5 years or older (Fig. 5). A few 3 and 4-year-old colonies contained reproductive! No reproductives were seen in colonies 1 or years old.
Animal Behaviour, 49, 3
1234567 Colony age (years)
Figure 5. Number of colonies of a given age in which reproductives were observed.
DISCUSSION
A harvester ant colony’s foraging range does not continually increase in size as the colony grows older. Larger colonies do not necessarily have larger foraging ranges. Once a colony is 2 years old, or about one-fifth its mature size of 12 000 ants (Fig. 2), its foraging range is as large as it will ever be. Mortality data show that if a colony survives to the age of 2 years, it is likely to survive to 15 or 20 years (Gordon 1991). It seems that the colony must build a viable nest, begin to produce workers and establish its foraging range, all in the first 2 years of its life. Most expansion of the foraging range occurs in the first year of the colony’s life; the rest occurs during years 2 to 4, while the colony is rapidly increasing in numbers of workers. The foraging ranges of well- established, large colonies 5 years or older, are not larger than those of much smaller, younger colonies.
Similarity of age/size classes in area of foraging range could be a result of competition for space. Ecological studies show that food is a limiting resource for desert granivores (Brown & Davidson 1977; Davidson 1977, 1985). Many aspects of harvester ant behaviour indicate that foraging is important to colony survival. For example, in response to a disturbance, colonies re-allocate workers to various tasks, in a way that gives highest priority to foraging (Gordon 1986, 1987, 1989b). It is often suggested that in response
to competition, sessile organisms should be regu. larly spaced (Levings & Traniello 1981), although theoretical work shows this is not necessarily true (Pielou 1960; Ryti 1991). In fact P. barbatus nests are not regularly spaced (Gordon 1991). Colonies do compete for foraging space: any unused forag. ing area is invaded by a nearby colony (Gordon 1992). The present result, that most colonies older than 2 years, regardless of size, have a foraging area of about 30 m2, suggests that foraging space, not the distance between nest sites, is partitioned evenly. Foraging ranges can take irregular shapes, in which regions used by one colony extend like pseudopodia into the interstices of the foraging ranges of several neighbouring colonies. If each individual is assumed to use resources in a circular region around its nest, and individuals compete, a pattern of regular spacing will emerge (Simberloff 1979). But the irregular shapes of ant colonies’ foraging ranges allow them to divide up space so that each colony has about the same amount, even though their nest sites may be clumped or randomly distributed.
Food supply probably influences colony growth rate in harvester ants (as in other ant genera; e.g. Topoff & Mirenda 1980), and much of the energy assimilated by adults goes into activities related to brood care (MacKay 1985). However, numbers of foragers, rather than area of foraging range, may limit the food supply. Over the course of several weeks, colonies search the same regions repeatedly (Gordon 1991). Foragers rarely return to the nest without a food item, and a decrease in the rate at which successful foragers come back to the nest causes a decrease in numbers of foragers on that trail (Gordon 1991), so the presence of an active foraging trail implies that foragers are finding food. Thus, repeated foraging in the same area shows that edible seeds are renewed frequently, or supplies have not been completely depleted by foragers. Leaving aside any effects of interactions among neighbouring colonies, the number of for- agers available to search out and retrieve renew- able seeds may influence a colony’s food intake more than the area of its foraging range.
A colony’s foraging range in a given year does not simply expand around the edges of the pre- vious year; if it did, one year’s foraging range would subsume most of the preceding year’s Instead, one year’s foraging range subsumes only half the previous year’s, However, the over- lap is significantly greater than would be expected

Gordon: Development of ant colony foraging range 657
if it were random, using a null model that is conservative in the sense that it could over- estimate expected values. Thus, while a colony does tend to use the same foraging areas year after year, there is also considerable turnover in each col~ny’s use of space.
A colony’s current foraging range is, in part, its foraging range of the future, as it can retain about half a year’s foraging range for the subsequent year. The prospective value of a foraging range probably does not depend on what food is avail- able at particular sites. It seems unlikely that the same site consistently provides seeds of the same abundance and species, year after year. Most seeds collected by P. barbatus ants, at least during the summer, are produced by plants many months before and widely dispersed by wind and flooding (Gordon 1993), and the species most frequently collected change from year to year (Gordon 1993). How a seed disperses, and thus the likelihood that wind and flooding will cause seeds of a given species to accumulate in a particular site, depends strongly on seed size and shape (Harper et al. 1970; Reichman 1984). Because the seed species available change from year to year (Kemp 1989), a site where seeds of a certain size and shape tend to collect, will probably not trap seeds consistently year after year. Thus, all regions where ants forage are of more or less equal value in the long term as space in which to search for dispersed seeds.
The area of a colony’s foraging range may influence the amount of time it spends in inter- actions with neighbours. Encounters between neighbouring colonies determine the boundaries of their respective foraging ranges. When one colony is prevented from foraging, its neighbours invade its foraging range within 10 days (Gordon 1992). The larger an area a colony can cover, the greater the probability that it will encounter a neighbouring colony. In some cases, such encoun- ters cause the other colony to forage elsewhere (for example, if the other colony is old and food in the contested region is not especially abundant). The larger a colony’s foraging range, the more likely it is to deter its neighbours, and this may contribute to the value of a large foraging range fof any colony.
Previous work showed that 3-4-year-old colonies are most likely to engage in conflict with neighbours over foraging range. The present study shows one result of this behaviour: 3-4-year-old colonies with larger colonies expanded them more
rapidly from one year to the next, while there was no relation of area of foraging range and rate of expansion in colonies older or younger than 3-4 years.
Colonies expand their foraging ranges most when l-2 years old, but at this age, conflict with neighbours is unlikely. In exclusion experiments, l-year-old colonies were more likely to retreat from confrontation with neighbours than older colonies (Gordon 1992). An adaptive explanation might be that l- and 2-year-old colonies are not yet large enough to sustain the losses incurred in fighting with neighbours. By the time they are 3 or 4 years old, they may be large enough to afford to fight to keep foraging ranges they have already acquired.
A proximate explanation for the observation that young colonies (l-2 years old) rarely extend their foraging trails to meet those of their neigh- bours may also involve colony size. Because for- aging ranges are about the same size in all colonies over 2 years old, a 2-year-old colony, with about 2000 ants, must often have a foraging range large enough to sustain a 5-20-year-old colony with 12 000 ants. But a 2-year-old colony has relatively few foragers to visit all parts of its large foraging range, so the likelihood is small that one of its foraging trails will intersect with one of a neighbour’s. Infrequent fighting may be a consequence of infrequent contact.
Colony size may explain why smaller 1-2-year- old colonies are less likely to meet their neigh- bours than larger 34-year-old colonies. The next question is why colonies 5 years and older, which are even larger than those 34 years old, seem to avoid encounters with neighbours. It appears that most colonies begin to produce sexual forms when they are 5 years old (Fig. 5). Males and queens are larger than workers and require more food. The costs of meeting neighbours include foraging time spent on encounters rather than searching, and the loss of foragers killed in fights. For older colonies the costs of reproduction may make it worthwhile to avoid meeting neighbours. Whether this explanation is the correct one, and how older colonies avoid their neighbours, both remain to be investigated.
If a newly founded colony must establish its foraging area in the first 2 years of its life, and if the territorial behaviour of its neighbours changes as colonies grow older, the ages of a colony’s neighbours may be crucial to its survival and

658 Animal Behaviour, 49, 3
reproductive success. The age structure of a popu- Davidson, D. W. 1985. An experimental study of lation will determine the probability that a new diffuse competition in harvester ants. Am. Nat., 125,
colony is surrounded by neighbours of a par- 500-506.
titular age. Because 34-year-old colonies are the Davies, N. B. & Houston, A. 1981. Owners and sate].
most aggressive neighbours, newly founded lites: the economics of territory defence in the pied wagtail Motacilla alba. J. Anim. Ecol., 50, 157-180.
colonies may have a higher chance of survival if Doncaster, C. P. & Macdonald, D. W. 1991. Drifting they are near colonies older or younger than 3-4 territoriality in the red fox Vulpes vulpes. J. Anim.
years. Territorial behaviour and conflict over Ecol.. 60, 423439.
space can determine the spacing pattern of a Gordon, D. M. 1983. The relation of recruitment rate to
population (Lack 1954; Lomnicki 1980). Under- activity rhythms in the harvester ant. Pogonomyrmex barbatus. J. Kans. entomol. Sot., 56, 277-285.
standing how territorial behaviour develops in individual colonies will make it possible to inves- tigate how age structure determines the dynamics of populations.
ACKNOWLEDGMENTS
The foraging maps were made with the help, over the years, of many research assistants: Melissa Bateson, Victoria Braithwaite, Mark Brown, Dawn Cotter, Lis Dalrymple, Scott De Pue, David Ferrier, Emma Lewis, Ric Paul, Ben Raymond, Geraint Tarling, Franziska Weigand and Mike Weiser; my thanks to them all. Dawn Cotter helped digitize the foraging maps. Phil Constantinou wrote the computer program to calculate foraging overlap, and I am grateful for his persistence over many iterations. Barbary Grant’s help in manuscript preparation was invaluable. The method for calculating foraging overlap was developed by Fred Adler in the course of several very helpful discussions; any errors in its application are my own. I thank the staff at the Southwestern Research Station where this work was done. The manuscript was greatly improved by the comments of Fred Adler, Mark Brown, Ben Crow, John Gregg and an anony- mous referee. The work was supported by grants from the National Geographic Society and the British Ecological Society.
REFERENCES
Adams, E. S. 1990. Boundary disputes in the territorial ant Azteca trigona: effects of asymmetries in colony size. Anim. Behav., 39, 321-328.
Brown, J. H. & Davidson, D. W. 1977. Competition between seed-eating rodents and ants in desert eco- systems. Science, 196, 88&882.
Davidson, D. W. 1977. Species diversity and community organization in desert seed-eating *ants. Ecology, 58, 71 l-724.
Gordon, D. M. 1986. The dynamics of the daily round of the harvester ant colony. Anim. Behav.. 34, 1402- 1419.
Gordon, D. M. 1987. Group-level dynamics in harvester ants: young colonies and the role of patrolling. Anim. Behav., 35, 833-843.
Gordon, D. M. 1989a. Ants distinguish neighbours from strangers. Oecologia (Berl. ) , 81, 198-200.
Gordon, D. M. 1989b. Dynamics of task switching in harvester ants. Anim. Behav., 38, 194204.
Gordon, D. M. 1991. Behavioral flexibility and the foraging ecology of seed-eating ants. Am. Nat., 138, 379411.
Gordon, D. M. 1992. How colony growth affects forager intrusion in neighboring harvester ant colonies. Behav. Ecol. Sociobiol., 31, 417427.
Gordon, D. M. 1993. The spatial scale of seed collection by harvester ants. Oecologia (Berl), 95, 479487.
Gordon, D. M. & Holldobler, B. 1988. Worker longevity in harvester ants. Psyche, 94, 341-346.
Harper, J. L., Lovell, P. H. & Moore, K. G. 1970. The shapes and sizes of seeds. A. Rev. Eeol. Syst., 1, 327-356.
Holldobler, B. 1976. Recruitment behavior, home range orientation and territoriality in harvester ants, Pogonomyrmex. Behav. Ecol. Sociobiol., I, 344.
Holldobler, B. 1981. Foraging and spatialtemporal territories in the honey ant Myrmecocystus mimicus Wheeler (Hymenoptera: Formicidae). Behav. Ecol. Sociobiol., 9, 301-314.
Holldobler, B. & Wilson, E. 0. 1990. The Ants. Cambridge, Massachusetts: Harvard University Press.
Kemp, P. 1989. Seed banks and vegetation processes in deserts. In: Ecology of Soil Seed Banks (Ed. by M. A. Leek, V. T. Parker & R. L. Simpson), pp. 257-281. San Diego: Academic Press.
Koenig, W. D. 1990. Territory size and duration in the white-tailed skimmer Plathemis lydia (Odonata: Libellulidae). J. Anim. Ecol., 59, 317-333.
Krebs, J. R. & Davies, N. B. 1984. Behavioral Ecology: an Evolutionary Approach. 2nd edn. Oxford: Blackwell Scientific Publications.
Lack, D. 1954. The Natural Regulation of Animal Numbers. Oxford: Oxford University Press.
Levings, S. & Traniello, J. F. A. 1981. Territoriality, nest dispersion, and community structure in ants. Psyche, 88,265-319.
Lomnicki, A. 1980. Regulation of population density due to individual differences and patchy environment. Oikos, 35, 185-193.

Gordon: Development of ant colony foraging range 659
dolt, D. F. 1991. Intraspecific Variation in the Social Systems of Wild Vertebrates. Cambridge, Massachusetts: Cambridge University Press.
MacKay, W. P. 1985. A comparison of the energy budgets of three species of Pogonomyrmex harvester ants (Hymenoptera: Formicidae). Oecologia (Berj. j, (gj, 484494.
Mackintosh, J. H. 1970. Territory formation by labora- tory mice. Anim. Behav., 18, 177-183.
Michener, G. R. 1981. Ontogeny of spatial relationships and social behaviour in juvenile Richardson’s ground squirrels. Can. J. Zool., 59, 16661676.
Nolan, V., Jr. 1978. The Ecology and Behavior of the Prairie Warbler Dendroica Discolor. Lawrence. Kansas: Allen Press.
Pielou, E. C. 1960, A single mechanism to account for regular, random and aggregated populations, J. Ecol., 48, 5755584.
Reichman. 0. J. 1984. Spatial and temporal variation of seed distributions in Sonoran Desert soils. J. Biogeogr.. 11, l-11.
Ryti, R. T. 199 1. Theoretical considerations of density- dependent spacing of a mound-building ant (Formica alitpetens). J. theor. Biol., 147, 289-301,
Schoener, T. W. 1987. Time budgets and territory size: some simultaneous optimization models for energy maximizers. Am. Zool., 27, 259-292.
Simberloff, D. 1979. Nearest neighbor assessments of spatial configurations of circles rather than points. Ecology, 60, 679-685.
Stacey, P. B. & Ligon, J. D. 1987. Territory quality and dispersal options in the acorn woodpecker, and a challenge to the habitat-saturation model of coopera- tive breeding. Am. Nat., 130, 654676.
Stamps, J. A. 1984. The growth costs of territorial overlap in a juvenile lizard (Anolis aenus). Behav. Ecol. Sociobiol., 15, 115-l 19.
Stamps, J. A. 1987. Conspecifics as cues to territory quality: a preference of juvenile lizards (Anolis aeneus) for previously used territories. Am. Nat., 129, 629- 642.
Stamps, J. A. & Eason, P. K. 1989. Relationships between spacing behavior and growth rates: a field study of lizard feeding territories. Behav. Ecol. Sociobiol., 25, 999107.
Stamps, 3. A. & Tollestrup, K. 1984. Prospective resource defense in a territorial species. Am. Nat. 123, 99-l 14.
Tooker. C. P. & Miller. R. J. 1980. The ontogeny of agonistic behaviour in the blue gourami, Trichogaster trichopterus (Pisces, Anabantoidei). Anim. Behav., 28, 9733988.
Topoff, H. & Mirenda, J. 1980. Army ants on the move: relation between food supply and emigration frequency. Science, 207, 109991100.


![Ant Paintings Based on the Seed Foraging Behavior of P ...archive.bridgesmathart.org/2013/bridges2013-43.pdf · [4] Gordon, D., Ant Encounters: Interaction Networks and Colony Behavior,](https://static.fdocuments.us/doc/165x107/5f04e3ce7e708231d410381a/ant-paintings-based-on-the-seed-foraging-behavior-of-p-4-gordon-d-ant-encounters.jpg)