THE DEVELOPMENT AND USE OF SAILING … · An advanced velocity prediction programme was used to...
10
3 rd High Performance Yacht Design Conference Auckland, 2-4 December, 2008 1 Research Fellow, Australian Maritime College, University of Tasmania 2 Managing Director, Friendship Consulting GmbH THE DEVELOPMENT AND USE OF SAILING SIMULATION FOR IACC STARTING MANOEUVRE TRAINING Jonathan R. Binns 1 [email protected] Karsten Hochkirch 2 [email protected] Frank De Bord 3 [email protected] Ian A. Burns 4 [email protected] Abstract. Sailing simulation has rapidly evolved over the last twenty years to be a useful tool in design optimisation, design evaluation, human factor analysis and beginner sailor training. The research work detailed in this paper explains a systematic approach to the development of a sailing simulation system suitable for use by elite sailor in the preparation of starting manoeuvres. An advanced velocity prediction programme was used to simulate the steady state force balance based on towing tank and wind tunnel experiments. The dynamic terms in the equations have been estimated by a systematic series of full scale tests of increasing complexity. The final simulation was incorporated into existing race analysis software permitting its use by professional sailors without the need for learning additional software skills. 1 INTRODUCTION Sailing simulation has been used for the analysis of tacking [1], handicap assessment [2] and design optimisation of engineering and human systems [3, 4]. Simulation as a laboratory tool has been used in sailing for at least twenty years [5] continuing to the present day [6] and more recently generalised sail training is making use of simulation [7]. Each of these applications require varying degrees of accuracy in the predicted parameters. This paper describes an ambitious application of sailing simulation for practicing starting manoeuvres for International America’s Cup Class (IACC) yachts as used in the 32 nd America’s Cup sailed off Valencia in 2007. BMW Oracle Racing won 76 match races throughout the 4 year campaign, from which the team crossed the start line first in 50, of these 50 races the team went on to win 40. Therefore, the team had an 80% chance of winning after crossing the start line first. A similar trend is evident from the top four challengers in the series. It is clear from the race results and sailor experience that a “win” at the start will not compensate for non-optimum equipment or sailing, however the start is where equal teams will often decide the winner. The problem facing IACC crews when training is that no matter how deeply they examine each manoeuvre they will never be able to answer questions such as “what-if we turned left instead of right?”. A consistent request by sailing teams of their design teams is to provide such a prediction. This paper reports on a project completed by BMW Oracle Racing aimed at achieving this goal in 2006. Figure 1 USA 87 under sail on the America’s Cup race course off Valencia. This yacht was used for the full scale manoeuvring tests detailed within this paper. The velocity of an IACC yacht during starting consistently ranges from negative values to top speed; rudder, keel and sail loadings vary from zero to completely stalled; high rates of heel change are experienced; and maximum yaw rates are routinely requested. To achieve these dynamic and kinematic extremes, the crew of 17 professional sailors are required to extend their skills in altering sail and appendage trim to their limit. These extremes are largely imposed by the nature of the starting procedure and by the fact that so much of the race can be decided in the pre-start 3 Managing Partner, Chesapeake Marine Technology LLC 4 Navigator, BMW Oracle Racing SL 158
Transcript of THE DEVELOPMENT AND USE OF SAILING … · An advanced velocity prediction programme was used to...
3rd High Performance Yacht Design Conference
Auckland, 2-4 December, 2008
1 Research Fellow, Australian Maritime College, University of Tasmania 2 Managing Director, Friendship Consulting GmbH
THE DEVELOPMENT AND USE OF SAILING SIMULATION FOR IACC STARTING MANOEUVRE TRAINING
Jonathan R. Binns1 [email protected] Karsten Hochkirch2 [email protected]
Frank De Bord3 [email protected] Ian A. Burns4 [email protected]
Abstract. Sailing simulation has rapidly evolved over the last twenty years to be a useful tool in design optimisation, design evaluation, human factor analysis and beginner sailor training. The research work detailed in this paper explains a systematic approach to the development of a sailing simulation system suitable for use by elite sailor in the preparation of starting manoeuvres. An advanced velocity prediction programme was used to simulate the steady state force balance based on towing tank and wind tunnel experiments. The dynamic terms in the equations have been estimated by a systematic series of full scale tests of increasing complexity. The final simulation was incorporated into existing race analysis software permitting its use by professional sailors without the need for learning additional software skills.
1 INTRODUCTION
Sailing simulation has been used for the analysis of tacking [1], handicap assessment [2] and design optimisation of engineering and human systems [3, 4]. Simulation as a laboratory tool has been used in sailing for at least twenty years [5] continuing to the present day [6] and more recently generalised sail training is making use of simulation [7]. Each of these applications require varying degrees of accuracy in the predicted parameters. This paper describes an ambitious application of sailing simulation for practicing starting manoeuvres for International America’s Cup Class (IACC) yachts as used in the 32nd America’s Cup sailed off Valencia in 2007.
BMW Oracle Racing won 76 match races throughout the 4 year campaign, from which the team crossed the start line first in 50, of these 50 races the team went on to win 40. Therefore, the team had an 80% chance of winning after crossing the start line first. A similar trend is evident from the top four challengers in the series. It is clear from the race results and sailor experience that a “win” at the start will not compensate for non-optimum equipment or sailing, however the start is where equal teams will often decide the winner. The problem facing IACC crews when training is that no matter how deeply they examine each manoeuvre they will never be able to answer questions such as “what-if we turned left instead of right?”. A consistent request by sailing teams of their design teams is to provide such a prediction. This paper reports on a project completed by BMW Oracle Racing aimed at achieving this goal in 2006.
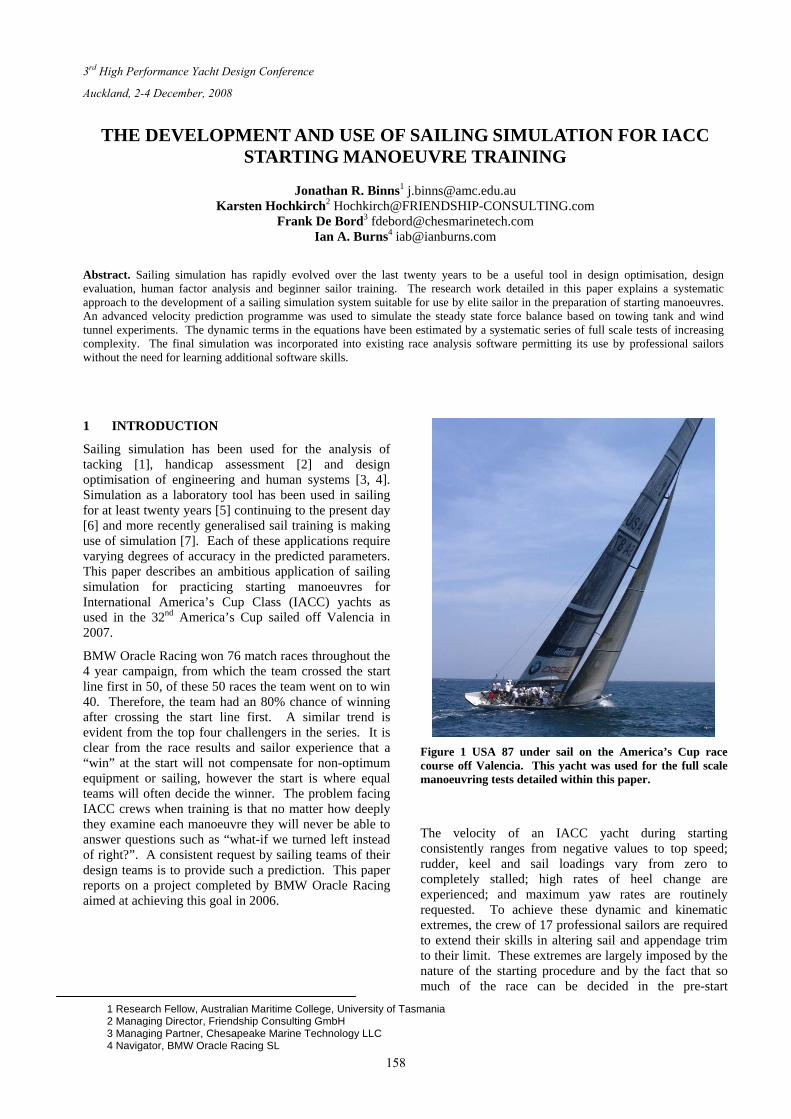
Figure 1 USA 87 under sail on the America’s Cup race course off Valencia. This yacht was used for the full scale manoeuvring tests detailed within this paper.
The velocity of an IACC yacht during starting consistently ranges from negative values to top speed; rudder, keel and sail loadings vary from zero to completely stalled; high rates of heel change are experienced; and maximum yaw rates are routinely requested. To achieve these dynamic and kinematic extremes, the crew of 17 professional sailors are required to extend their skills in altering sail and appendage trim to their limit. These extremes are largely imposed by the nature of the starting procedure and by the fact that so much of the race can be decided in the pre-start
3 Managing Partner, Chesapeake Marine Technology LLC 4 Navigator, BMW Oracle Racing SL
158

manoeuvres. To answer the “what-if” scenarios of a pre-start, the simulation described here was developed to predict: (1) the kinematic conditions; (2) realistic sail trim and resulting aerodynamic forces; and (3) keel tab angles and resulting hydrodynamic forces, such that the user could simply steer and expect realistic motions.
To begin the process of building such a simulation, the team utilised a 6 degree of freedom VPP developed by the team of Friendship Consulting which incorporated towing tank and wind tunnel testing results to predict straight line speeds. This program permits the use of a single data model in steady state analysis and dynamic simulations with the implementation of object-oriented programming units for force modules linked at run-time with customised plug-ins.
The sail model used was for two sails only, as all manoeuvres of interest were for pre-start conditions. For this purpose the team had access to a well refined upwind sail model based on vortex lattice results. The downwind sail forces were estimated from wind tunnel data and the two sets of data were linearly merged over an apparent wind angle range of 15-30°.
For the unsteady hydrodynamic forces a linearised methodology was used. Lewis form sections were assumed for the hull shape and bulb. Added masses and damping coefficients for the keel and rudder were calculated based on assumed transportation of layers of water. In this study no allowance has been made for aerodynamic added mass, although future studies by Friendship Consulting has shown that aerodynamic added mass can be estimated.
Figure 2 Manoeuvring simulation flow chart, from Richardt et al. [8]
We then conducted a series of full scale tests aimed at simplifying typical starting manoeuvres. Beginning with a simple tow and release test and finishing with a full crash tack, significant terms in the dynamic model employed were sequentially estimated. The final model developed was cross checked with six such tests and the results of boat track and velocity are presented for two of the tests.
The final product was a program usable by a single operator. This required considerable programming for: realistic sail trimming based on helm responses; seamless integration with existing race presentation software; and multi-player or historical record options for opponents.
2 THE UNDERLYING SIMULATION
The simulation methodology used for this paper was based on the work by Masuyama et al. [1] containing the developments described in Richardt et al. [8]. This methodology can be described as a quasi-steady instationary analysis using Runge-Kutta methods to step forward in time. Both 4th and 5th order methods were used and were found to lead to near identical results. For analysis of set manoeuvres the 5th order method was preferred because of the adaptive step-size control, which significantly reduced computation times before and after radical manoeuvres. However, this project finished with a real time application which precludes the realisation of computation performance gains of adaptive step size control. In addition a 4th order fixed step size Runge-Kutta integration scheme was more convenient to synchronize with the external application in real-time. A schematic flow chart of the simulation process is shown in Figure 2.
3 ON-WATER TESTING EQUIPMENT
The IACC yacht USA87 was used for all experiments mentioned within this paper. This yacht was designed for use in the 32nd America’s Cup to suit the Version 5 rule of the IACC. The yacht sailing to windward is shown in Figure 1. The crew for the tests were drawn from the sailing team for BMW Oracle Racing at the time of tests, just prior to the 32nd AC.
In its standard configuration the yacht is equipped with a WTP on-board measurement system operating at a sample rate of 1 Hz. This system is extremely versatile in the number of measurements acquired. For the experiments conducted for this research the following measurements were made:
1) GPS position 2) Apparent wind speed 3) Flow velocity past the hull 4) Mainsail traveller position 5) Heel angle 6) Rudder angle 7) Keel trim-tab angle 8) Forestay loading 9) Mainsail clew loading 10) V1 rigging load
3.1 Errors in the test measurements
The positional data for the full scale tests was obtained by differential GPS measurements for which error estimates are generally around ±3 m but can be as low as ±1 m [9]. This data was converted into a geodetic coordinate system using the WGS-84 standard [10] in addition the exact position of the GPS antenna relative to
159
the body fixed computational coordinate system needed to be taken into account at the level of accuracy looked at in this project. The GPS data was sampled at 1 Hz. The sampling rate and accuracy of the GPS system mandates that accurate measurement of boat speed be obtained through a paddle-type encoder sensor as is typical on sailing yachts. The use of such a sensor does, however, open the measurements to errors due to localised flow characteristics during manoeuvring. An estimate of the steady state error of ±0.025 m/s (±0.05 knots) has been used although dynamic measurement errors are likely to be greater.
The rudder and tab angle measurements were performed with a rotary potentiometer as such the errors on the actual measured angle were largely confined to the calibration process and the play in the coupling between the rudder and potentiometer. The calibration errors have been estimated at ±0.5° and the coupling errors at ±0.5° combining to make a total error of ±1.0°.
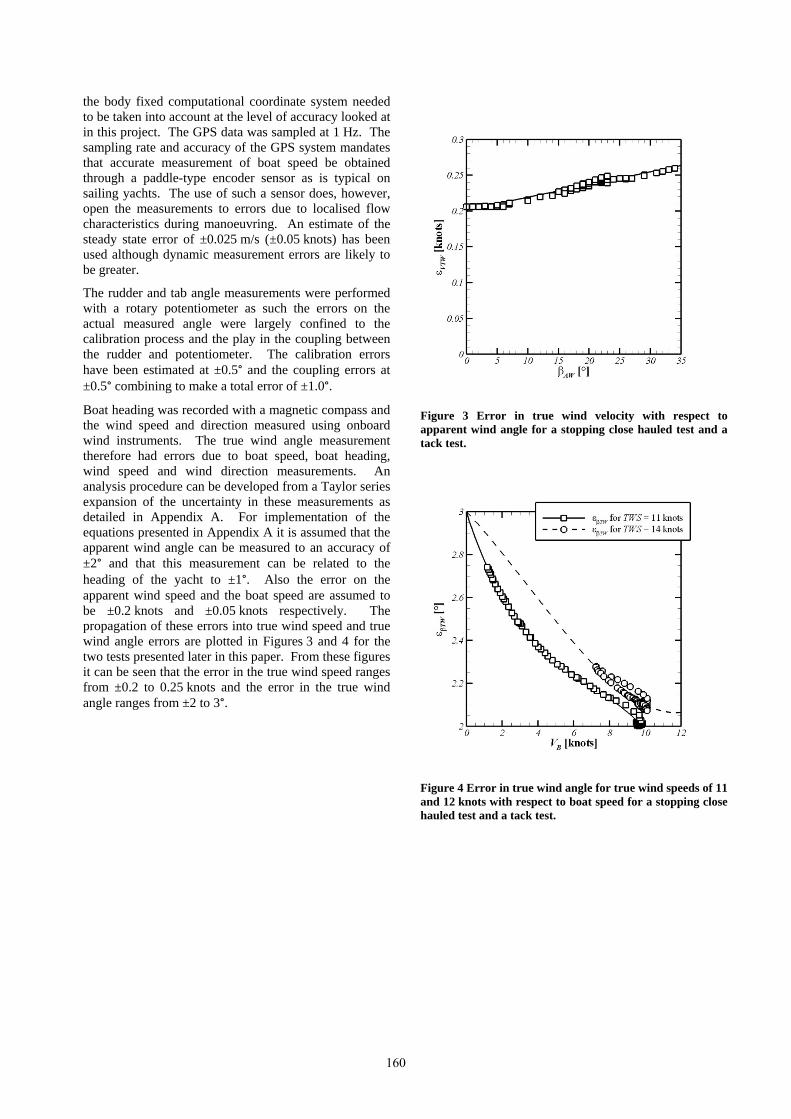
Boat heading was recorded with a magnetic compass and the wind speed and direction measured using onboard wind instruments. The true wind angle measurement therefore had errors due to boat speed, boat heading, wind speed and wind direction measurements. An analysis procedure can be developed from a Taylor series expansion of the uncertainty in these measurements as detailed in Appendix A. For implementation of the equations presented in Appendix A it is assumed that the apparent wind angle can be measured to an accuracy of ±2° and that this measurement can be related to the heading of the yacht to ±1°. Also the error on the apparent wind speed and the boat speed are assumed to be ±0.2 knots and ±0.05 knots respectively. The propagation of these errors into true wind speed and true wind angle errors are plotted in Figures 3 and 4 for the two tests presented later in this paper. From these figures it can be seen that the error in the true wind speed ranges from ±0.2 to 0.25 knots and the error in the true wind angle ranges from ±2 to 3°.
Figure 3 Error in true wind velocity with respect to apparent wind angle for a stopping close hauled test and a tack test.
Figure 4 Error in true wind angle for true wind speeds of 11 and 12 knots with respect to boat speed for a stopping close hauled test and a tack test.
160

4 ON-WATER TESTING PROTOCOL AND METHODS
A schematic diagram of the full simulation and the components has been shown in Figure 5. For each component the estimation method has been displayed in italics.
Tests 1 through to 6 listed in Figure 5 form a progression of experiments with successively increasing degrees of complexity. These experiments were performed to validate the assumed dynamic behaviour of the yacht. The six experimental procedures were conducted which are described in the following sections.
Figure 5 The components of the full simulation. The full simulation has been checked by Tests 5 and 6, each of the other components were estimated by the methods shown in italics.
4.1 Test 1 - Deceleration with no sails
For this experiment the yacht was towed by a chase boat and was kept outside of the chase boat wash by use of the rudder. At the start of the test the tow line was released from the bow of the yacht and the rudder was centred.
This test was designed to measure the effect of hydrodynamic added mass in the longitudinal direction, in the absence of sails. This was the only test conducted without sails.
4.2 Test 2 - Stopping close hauled by releasing the mainsail
Whilst in optimum VMG upwind sailing conditions, the mainsail and headsail sheets were dropped whilst a constant heading was maintained by adjusting the rudder.
Given that the hydrodynamic equations in the longitudinal direction were previously estimated, this test was designed to estimate the amount of drag flogging sails produced.
4.3 Test 3 - Stopping close hauled by luffing head to wind
With the yacht sailing in optimum VMG upwind mode, the heading was altered to bring the heading to a true wind angle of 0° as quickly as possible. Once the sails began to flog they were completely eased.
Given that the hydrodynamic and aerodynamic characteristics were estimated in the longitudinal direction, this test was used to check the effective hydrodynamic added mass in the yaw and heel directions.
4.4 Test 4 - Rapid change of course downwind
Whilst sailing in the optimum VMG upwind condition, the rudder was altered to bring the coarse heading to 50° true wind angle as quickly as possible. The sails were trimmed throughout the manoeuvre to maintain maximum speed.
Given that the added mass in the yaw and heel directions were checked previously, this test was used to check the yaw and heel damping characteristics.
4.5 Test 5 - Zig-zag manoeuvre with and without tab
At a true wind angle of 45°, sails trimmed for maximum speed and keel trim tab set to the upwind optimum, the rudder was altered by 5° in the round up direction and held at that setting until a heading 40° relative to the true wind was obtained. Then a bear-away rudder angle of 5° was applied until a heading of 50° relative to the true wind was obtained. This was repeated until five headings of 40° and five headings of 50° were obtained.
The zig-zag manoeuvre described in the previous paragraph was repeated whilst using a keel trim tab angle of 0°. This set of tests was used to check all of the parameter estimates.
4.6 Test 6 - Full tacking manoeuvre
While sailing in optimum VMG condition, a full racing tack was performed and recorded.
As for Test 5, this test was designed to check the simulation in its entirety.
5 SIMULATION RESULTS FOR TWO SETS OF EXPERIMENTS
5.1 Test 3 - Stopping close hauled by luffing head to wind
The stopping close hauled manoeuvre was simulated firstly by using the actual rudder angles measured and secondly by allowing the rudder angle to vary using an autopilot algorithm based on obtaining the measured true wind angle. Results for the measured and predicted yacht positions are presented in Figure 6. The measured and simulated rudder angle variation with respect to time are shown in Figure 7. The measured and simulated boat
161

speed variation with respect to time are shown in Figure 8.
Figure 6 shows position data for the prescribed rudder manouevre, that is the simulated manoeuvre using the as measured rudder angles, which can be seen to finish the manouevre with a higher true wind angle (the true wind direction is straight down the page). In addition, the prescribed rudder simulation can be seen to be slightly advanced as compared with the autopilot solution and the experimental results. These two discrepancies are related, that is the prescribed rudder manoeuvre results in the prediction turning too far in the early stages of the manoeuvre, resulting in an increase in the acquired true wind angle which results in slightly increased boat speeds. It should be noted that very small errors in experimentally measured rudder angles could have resulted in large errors in simulation results using the measured angles, since the errors would have been cumulative over time i.e. the process is an integration.
The rudder angles and boat speeds for the two simulated and one measured result of Figure 6 are shown in Figure 7 and Figure 8 respectively. The rudder angles plotted in Figure 7 diverge significantly after 60 s, however from Figure 6 at this time the manoeuvre is essentially complete and from Figure 8 the boat speed is less than 25% of the windward sailing speed. Therefore, large rudder angles at this time will have no effect on the manoeuvre of interest and they will produce around 6% of the force for the same rudder angle at windward sailing speeds.
For these tests the true wind speed was assumed to be constant at a value equal to the average measurement taken over the entire test. Considering that the measured true wind speed had a standard deviation of 0.4 knots, which is larger than the 0.2 knot error estimated above, there was some variation in true wind strength throughout the test. In addition the 2-3° error in the true wind angle estimated above accounts for the variation in as-sailed tracks seen in the early sections of the test.
Figure 6 Measured and simulated positions through a stopping close hauled manoeuvre, using a prescribed rudder and an autopilot controller based on the desired true wind angle. Points have been plotted every 10 s, the true wind direction is in the negative latitude direction, that is down the page. Typical GPS errors are shown for the experimental data.
Figure 7 Measured and simulated rudder angle through a stopping close hauled manoeuvre, using a prescribed rudder and an autopilot controller based on the desired true wind angle. Points have been plotted every 5 s for the experimental data with ±1° error bars.
162
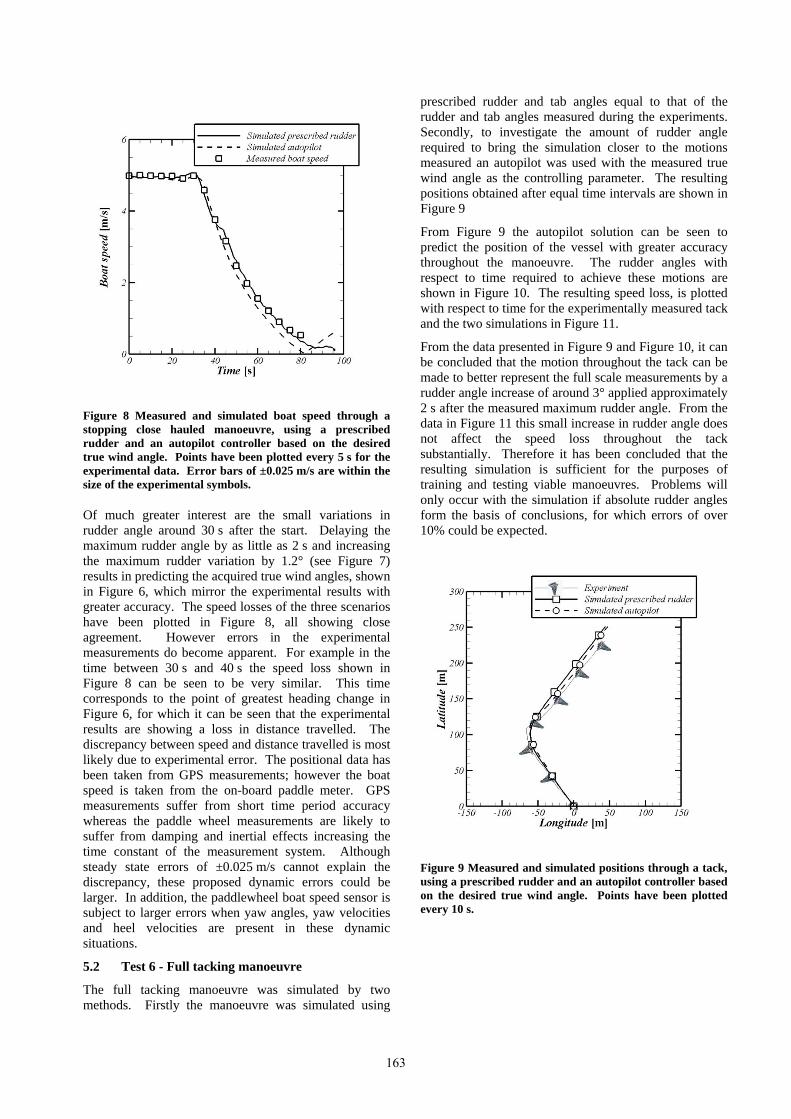
Figure 8 Measured and simulated boat speed through a stopping close hauled manoeuvre, using a prescribed rudder and an autopilot controller based on the desired true wind angle. Points have been plotted every 5 s for the experimental data. Error bars of ±0.025 m/s are within the size of the experimental symbols.
Of much greater interest are the small variations in rudder angle around 30 s after the start. Delaying the maximum rudder angle by as little as 2 s and increasing the maximum rudder variation by 1.2° (see Figure 7) results in predicting the acquired true wind angles, shown in Figure 6, which mirror the experimental results with greater accuracy. The speed losses of the three scenarios have been plotted in Figure 8, all showing close agreement. However errors in the experimental measurements do become apparent. For example in the time between 30 s and 40 s the speed loss shown in Figure 8 can be seen to be very similar. This time corresponds to the point of greatest heading change in Figure 6, for which it can be seen that the experimental results are showing a loss in distance travelled. The discrepancy between speed and distance travelled is most likely due to experimental error. The positional data has been taken from GPS measurements; however the boat speed is taken from the on-board paddle meter. GPS measurements suffer from short time period accuracy whereas the paddle wheel measurements are likely to suffer from damping and inertial effects increasing the time constant of the measurement system. Although steady state errors of ±0.025 m/s cannot explain the discrepancy, these proposed dynamic errors could be larger. In addition, the paddlewheel boat speed sensor is subject to larger errors when yaw angles, yaw velocities and heel velocities are present in these dynamic situations.
5.2 Test 6 - Full tacking manoeuvre
The full tacking manoeuvre was simulated by two methods. Firstly the manoeuvre was simulated using
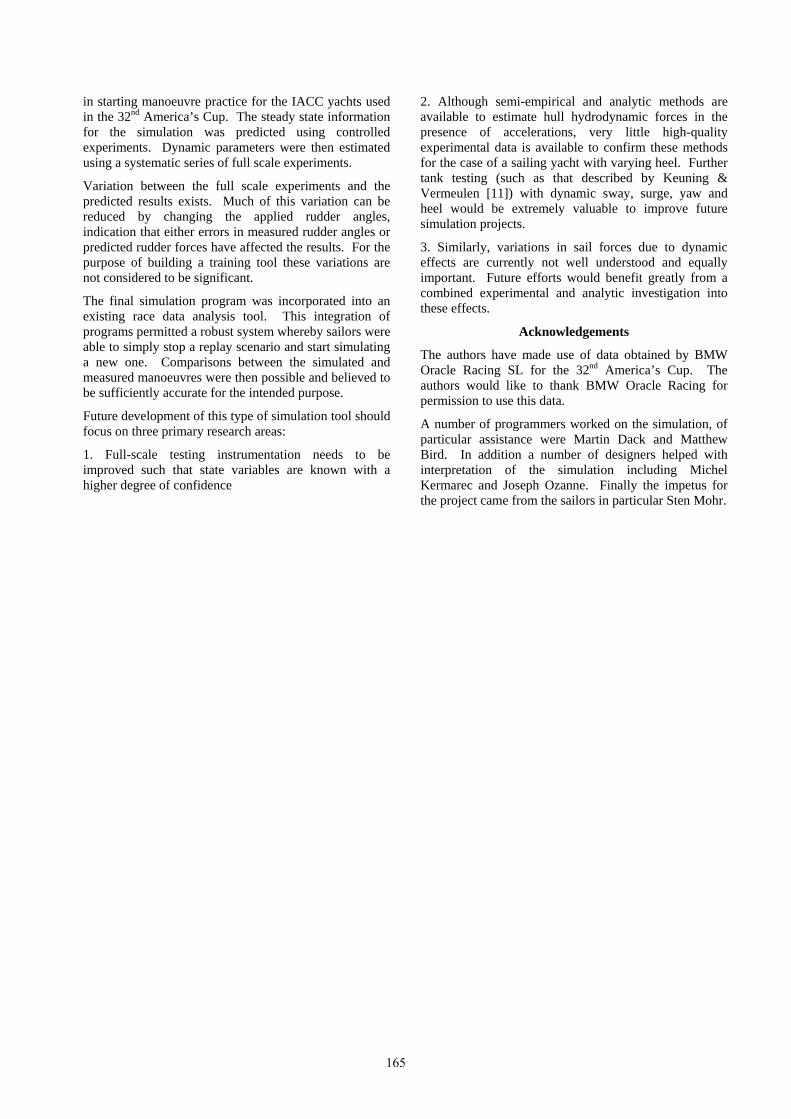
prescribed rudder and tab angles equal to that of the rudder and tab angles measured during the experiments. Secondly, to investigate the amount of rudder angle required to bring the simulation closer to the motions measured an autopilot was used with the measured true wind angle as the controlling parameter. The resulting positions obtained after equal time intervals are shown in Figure 9
From Figure 9 the autopilot solution can be seen to predict the position of the vessel with greater accuracy throughout the manoeuvre. The rudder angles with respect to time required to achieve these motions are shown in Figure 10. The resulting speed loss, is plotted with respect to time for the experimentally measured tack and the two simulations in Figure 11.
From the data presented in Figure 9 and Figure 10, it can be concluded that the motion throughout the tack can be made to better represent the full scale measurements by a rudder angle increase of around 3° applied approximately 2 s after the measured maximum rudder angle. From the data in Figure 11 this small increase in rudder angle does not affect the speed loss throughout the tack substantially. Therefore it has been concluded that the resulting simulation is sufficient for the purposes of training and testing viable manoeuvres. Problems will only occur with the simulation if absolute rudder angles form the basis of conclusions, for which errors of over 10% could be expected.
Figure 9 Measured and simulated positions through a tack, using a prescribed rudder and an autopilot controller based on the desired true wind angle. Points have been plotted every 10 s.
163

Figure 10 Measured and simulated rudder angle through a tack, using a prescribed rudder and an autopilot.
Figure 11 Measured and simulated boat speed through a tack, using a prescribed rudder and an autopilot.
6 RESULTING SIMULATION PROGRAM
A great deal of effort was expended to make the final simulation program as user friendly to the end users (the sailors) as possible. For this purpose the simulation detailed above was run by an external program as a dynamic linked library. This is possible using the Friendship Consulting velocity prediction program called FS-Equilibrium. The external program chosen was the standard race analysis program developed by BMW Oracle Racing called RaceCutter. An annotated screen of the final program is shown in Figure 12. As FS-Equilibrium was run with exactly the same data in its native interface and by the external application a very
consistent data model could be maintained for the dynamic simulation as well as for the steady state predictions. In addition specific conditions observed in the simulation could be recorded by the external application to be subsequently analysed with greater technical rigour and detail in the native interface.
By incorporating the simulation into the standard race analysis software it was possible for sailors to simply stop the playback of what actually occurred; start a simulation with the actual parameters as initial conditions; and try a different manoeuvre. Figure 12 shows one such hypothetical manoeuvre along with what actually happened.
In Figure 12 there are two racing yachts seen in plan-view with the start boat shown in the top middle and the start line shown to the left. The scenario shown is just after the “dial-up”, when the controlled vessel has broken away and has attempted to do a circle to avoid being the lead boat. The opponent vessel has continued to sail to the right side of the start box. The as measured bear away manoeuvre has been predicted using an autopilot and the results presented in Figure 13. This is a particularly difficult manoeuvre to reproduce exactly as there was significant and unknown sail trimming occurring. For the simulation presented here an approximate method of applying the global flat function based on mainsail clew loading has been applied. A more accurate method would be to interrogate the sail vision data and establish how off-optimum the sails were trimmed. Nevertheless, although the early stages of the manoeuvre are not well predicted the final position obtained by the yacht is predicted quite accurately.
As stated above, for this particular scenario the controlled vessel actually bore away and gybed (the solid line of motion in Figure 12). So the question would be: “how much additional time/space would be lost if a tacking manoeuvre were attempted?”. To answer this question the playback was stopped just at the point the gybe manoeuvre was begun. A simulation was added which was externally controlled, with automated sails and tab angle. From the simulation shown as the dashed line, it can be readily seen that around 3.5 boat lengths are lost by the variation in the manoeuvre.
This simple scenario is not quite realistic because the opponent vessel may not simply attempt to continue sailing. For this purpose the program was modified such that a second simulation could be incorporated by networked computers. From this simple scenario the importance of position and speed can be seen, the error on the required rudder angle can be seen to be less important.
7 CONCLUSIONS AND RECOMMENDATIONS
Dynamic simulation of sailing yachts is a well developed field of research being applied to many different areas of sailing yacht investigations. The work presented within this paper has focussed on producing a simulation for use
164
in starting manoeuvre practice for the IACC yachts used in the 32nd America’s Cup. The steady state information for the simulation was predicted using controlled experiments. Dynamic parameters were then estimated using a systematic series of full scale experiments.
Variation between the full scale experiments and the predicted results exists. Much of this variation can be reduced by changing the applied rudder angles, indication that either errors in measured rudder angles or predicted rudder forces have affected the results. For the purpose of building a training tool these variations are not considered to be significant.
The final simulation program was incorporated into an existing race data analysis tool. This integration of programs permitted a robust system whereby sailors were able to simply stop a replay scenario and start simulating a new one. Comparisons between the simulated and measured manoeuvres were then possible and believed to be sufficiently accurate for the intended purpose.
Future development of this type of simulation tool should focus on three primary research areas:
1. Full-scale testing instrumentation needs to be improved such that state variables are known with a higher degree of confidence
2. Although semi-empirical and analytic methods are available to estimate hull hydrodynamic forces in the presence of accelerations, very little high-quality experimental data is available to confirm these methods for the case of a sailing yacht with varying heel. Further tank testing (such as that described by Keuning & Vermeulen [11]) with dynamic sway, surge, yaw and heel would be extremely valuable to improve future simulation projects.
3. Similarly, variations in sail forces due to dynamic effects are currently not well understood and equally important. Future efforts would benefit greatly from a combined experimental and analytic investigation into these effects.
Acknowledgements
The authors have made use of data obtained by BMW Oracle Racing SL for the 32nd America’s Cup. The authors would like to thank BMW Oracle Racing for permission to use this data.
A number of programmers worked on the simulation, of particular assistance were Martin Dack and Matthew Bird. In addition a number of designers helped with interpretation of the simulation including Michel Kermarec and Joseph Ozanne. Finally the impetus for the project came from the sailors in particular Sten Mohr.
165
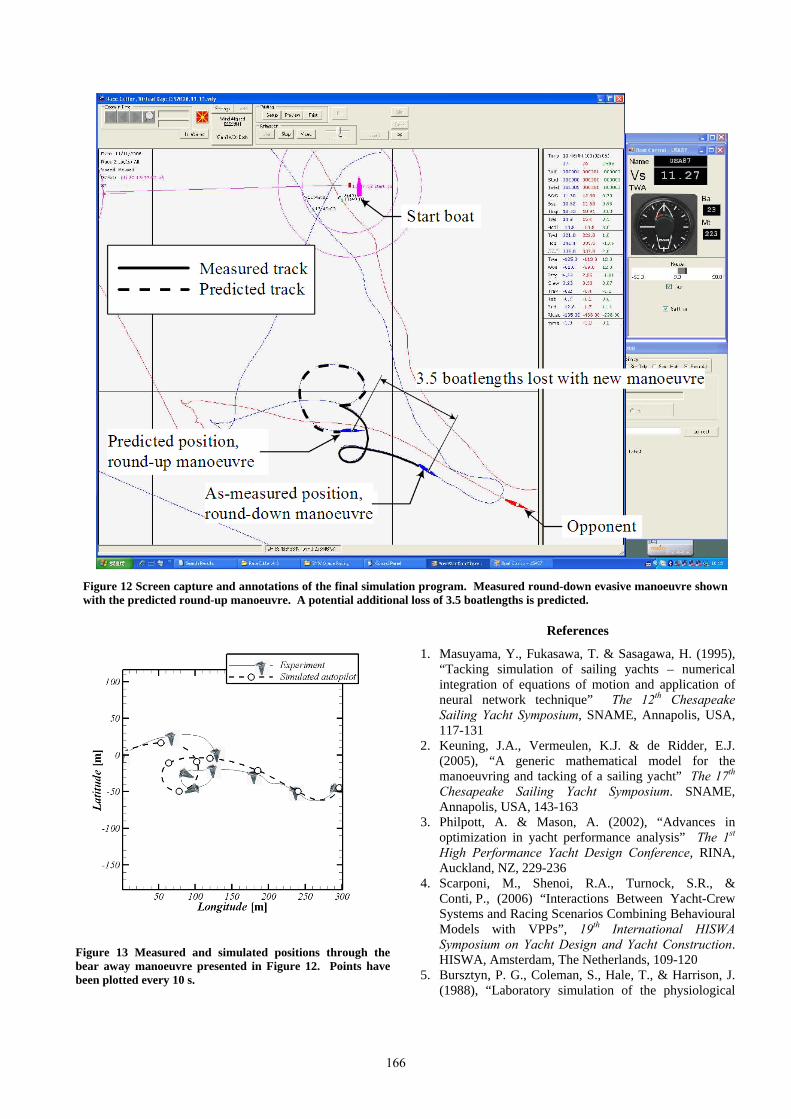
Figure 12 Screen capture and annotations of the final simulation program. Measured round-down evasive manoeuvre shown with the predicted round-up manoeuvre. A potential additional loss of 3.5 boatlengths is predicted.
Figure 13 Measured and simulated positions through the bear away manoeuvre presented in Figure 12. Points have been plotted every 10 s.
References
1. Masuyama, Y., Fukasawa, T. & Sasagawa, H. (1995), “Tacking simulation of sailing yachts – numerical integration of equations of motion and application of neural network technique” The 12th Chesapeake Sailing Yacht Symposium, SNAME, Annapolis, USA, 117-131
2. Keuning, J.A., Vermeulen, K.J. & de Ridder, E.J. (2005), “A generic mathematical model for the manoeuvring and tacking of a sailing yacht” The 17th Chesapeake Sailing Yacht Symposium. SNAME, Annapolis, USA, 143-163
3. Philpott, A. & Mason, A. (2002), “Advances in optimization in yacht performance analysis” The 1st High Performance Yacht Design Conference, RINA, Auckland, NZ, 229-236
4. Scarponi, M., Shenoi, R.A., Turnock, S.R., & Conti, P., (2006) “Interactions Between Yacht-Crew Systems and Racing Scenarios Combining Behavioural Models with VPPs”, 19th International HISWA Symposium on Yacht Design and Yacht Construction. HISWA, Amsterdam, The Netherlands, 109-120
5. Bursztyn, P. G., Coleman, S., Hale, T., & Harrison, J. (1988), “Laboratory simulation of the physiological
166

demands of singlehanded dinghy racing” Journal of Physiology (London), 400, 14
6. Cunningham, P. & Hale, T., (2007), “Physiological responses of elite Laser sailors to 30 minutes of simulated upwind sailing” Journal of Sports Sciences, 25(10): 1109 – 1116
7. Binns, J.R., Bethwaite, F.W. & Saunders, N.R. (2002), “Development of a more realistic sailing simulator” The 1st High Performance Yacht Design Conference, RINA, Auckland, NZ, 221-228
8. Richardt, T., Harries, S. & Hochkirch, K. (2005) “Maneuvering Simulations for Ships and Sailing Yachts using FRIENDSHIP-Equilibrium as an Open Modular Workbench”, International Euro-Conference on Computer Applications and Information Technology in the Maritime Industries, Hamburg
9. Farrell, J.A. & Barth M. (1998) The Global Positioning System & Inertial Navigation, Mc Graw- Hill, New York, USA, 186
10. Grewal, M.S., Weill, L.R. & Andrews, A.P. (2001) Global Positioning Systems, Inertial Navigation and Integration, John Wiley & Sons, New York, USA, 161-167
11. Keuning, J.A. & Vermeulen, K.J. (2002) “On the yaw balance of large sailing yachts”, 17th International HISWA Symposium on Yacht Design and Construction, Amerstdam
Beckwith, T.G. & Marangoni, R.D. (1990) Mechanical Measurements, Addison-Wesley Publishing Company Inc., Reading, USA
8 APPENDIX A: ERROR ANALYSIS OF TRUE WIND DIRECTIONS AND VELOCITIES
If the coordinate system is rotated such that the origin is along the boat track then the true wind angle will be defined by
(1)
where VAW is the measured apparent wind speed, βAW is the measured apparent wind angle minus the measured heading angle and VB is the measured boat speed. Using the first term in a Taylor series expansion of the uncertainty in the true wind angle, the error estimate will be [0]
(2)
Symbolically evaluating these differentials and substituting for the following equation is found for the error in the true wind angle
(3)
A similar expression can be developed for the uncertainty in the true wind velocity, resulting in
(4)
167