The Determination of Shortfin Scad (Decapterus sp ... · Most of the fish landed at PPN Pekalongan...
14
Available online at www.worldscientificnews.com ( Received 10 January 2019; Accepted 26 January 2019; Date of Publication 27 January 2019 ) WSN 119 (2019) 111-124 EISSN 2392-2192 The Determination of Shortfin Scad (Decapterus sp.) Potential Fishing Area with Chlorophyll-a Distribution in Pekalongan Sea, Central Java, Indonesia Viga Ananda Wicaksono*, Zahidah Hasan, Iwang Gumilar, Lantun P. Dewanti Faculty of Fisheries and Marine Sciences, Universitas Padjadjaran, Indonesia *E-mail address: [email protected] ABSTRACT The fishing ground can be determined by detecting oceanography parameters in seawater area. One of the oceanographic parameters that can be used is chlorophyll-a. This research aims to analyze the relationship between chlorophyll-a and total catch of shortfin scad along with potential map areas for fishing shortfin scad (Decapterus sp.) in Pekalongan seawater. The research was conducted in two stages, which are field data collection in January and downloading and processing satellite image data in February. This research used the survey method with spatial analysis. Primary spatial data used is the distribution of chlorophyll-a and data of shortfin scad fishing production. The study shows an average concentration of chlorophyll-a from 2013-2017 in Pekalongan seawater ranges around 0,16 - 1,55 mg/m 3 . The result of linear regression test shows that chlorophyll-a has a role as one of the factors that influence the total catch of shortfin scad in Pekalongan seawater, East Java by 23%. Other factors influence the remaining 77%. Based on the assessment of fishing ground, there are 25 potential coordinate points of shortfin scad fishing area in Pekalongan seawater that can be categorized as a potential fishing ground. Keywords: Chlorophyll-a, Fishing ground, Pekalongan, Shortfin Scad
Transcript of The Determination of Shortfin Scad (Decapterus sp ... · Most of the fish landed at PPN Pekalongan...

Available online at www.worldscientificnews.com
( Received 10 January 2019; Accepted 26 January 2019; Date of Publication 27 January 2019 )
WSN 119 (2019) 111-124 EISSN 2392-2192
The Determination of Shortfin Scad (Decapterus sp.) Potential Fishing Area with Chlorophyll-a
Distribution in Pekalongan Sea, Central Java, Indonesia
Viga Ananda Wicaksono*, Zahidah Hasan, Iwang Gumilar, Lantun P. Dewanti
Faculty of Fisheries and Marine Sciences, Universitas Padjadjaran, Indonesia
*E-mail address: [email protected]
ABSTRACT
The fishing ground can be determined by detecting oceanography parameters in seawater area.
One of the oceanographic parameters that can be used is chlorophyll-a. This research aims to analyze
the relationship between chlorophyll-a and total catch of shortfin scad along with potential map areas
for fishing shortfin scad (Decapterus sp.) in Pekalongan seawater. The research was conducted in two
stages, which are field data collection in January and downloading and processing satellite image data
in February. This research used the survey method with spatial analysis. Primary spatial data used is the
distribution of chlorophyll-a and data of shortfin scad fishing production. The study shows an average
concentration of chlorophyll-a from 2013-2017 in Pekalongan seawater ranges around 0,16 - 1,55
mg/m3. The result of linear regression test shows that chlorophyll-a has a role as one of the factors that
influence the total catch of shortfin scad in Pekalongan seawater, East Java by 23%. Other factors
influence the remaining 77%. Based on the assessment of fishing ground, there are 25 potential
coordinate points of shortfin scad fishing area in Pekalongan seawater that can be categorized as a
potential fishing ground.
Keywords: Chlorophyll-a, Fishing ground, Pekalongan, Shortfin Scad
World Scientific News 119 (2019) 111-124
-112-
1. INTRODUCTION
Pekalongan city is one of the regions in Central Java which is known by enormous
potency in the field marine fisheries. Pekalongan City has a national fishing port (PPN) located
in the northern part, which is the biggest port and various resources of catching fish in Central
Java. Most of the fish landed at PPN Pekalongan are small pelagic fish, including selar fish,
tembang fish, and lemuru fish. Shortfin Scad (Decapterus sp.) grouped as small pelagic fish.
The production of shortfin scad in 2013 was about 3,704 tons, a decrease from 2012 production
approximately 4,306 tons (PPN Pekalongan Annual Report 2014, Prasetyo, 2018).
Production in fishing management is correlated with the fishing results. Fishing
optimization can be obtained with information about the fishing ground. Information on the
fishing ground can be identified through oceanographic parameters. Oceanographic parameters
are factors that have sufficient influence on the variability of the catch, especially for the pelagic
fish. As for the many oceanographic parameters that influence the determination of fishing
areas, one of them is chlorophyll-a (Apriliani et al. 2018, Chen, 2008; Rizal, 2019).
The problem faced in the effort to utilize marine fisheries resources is the difficulty in
determining potential areas for fishing. In general, fishers traditionally determine fishing areas,
for instance, based on their experience and presentiment. It would cause decreasing of
efficiency with the amount of time, cost and energy wasted. The proper and effective
technology is needed to overcome this problem. Application of the technology in estimating
potential capture areas can be done by detecting oceanographic parameters, such as chlorophyll,
sea surface temperature, thermal front and upwelling (Oguz et al. 2002).
One example of the remote sensing satellites for determining oceanographic parameters
is the Aqua moderate resolution imaging spectroradiometer MODIS satellite. The Aqua-
MODIS satellite can function in detecting chlorophyll-a in an ocean. Remote sensing with
satellites is an alternative because it can detect chlorophyll-a in a large area at one time with
operational costs that are relatively cheaper when it is compared to measuring data directly
(Reynolds et al. 2009).
This research aims to analyze the relationship between chlorophyll-a and total catch of
shortfin scad along with potential map areas for fishing shortfin scad (Decapterus sp.) in
Pekalongan seawater. Reviewed of the related literature reveals that satellite-derived
information has been used in mapping potential fish zones and marine applications, such as use
of the technology for ocean parameter extraction (William et al. 2007, Zine et al. 2008), and
use of SeaWiFS for mapping potential fish zones (Copeland et al. 2011, Montres et al. 2008).
Therefore, it is essential to determine the potential areas of shortfin scad catch based on the
distribution of chlorophyll-a as the necessary data for fishing activities in Pekalongan waters,
Central Java.
2. MATERIALS AND METHOD
The study was conducted in two stages. The first stage was collecting field data, taken
place at the PPN Pekalongan, Central Java, which was held in January 2018 and the second step
was downloading and processing satellite image data that carried out in February 2018.

World Scientific News 119 (2019) 111-124
-113-
Figure 1. The research site map
The survey method used a spatial and temporal analysis of the shortfin scad production
and chlorophyll-a concentration monthly in a five years periods (2013 – 2017). This research
also used chlorophyll-a satellite image data, downloaded from the NASA database, and shortfin
scad production from fishing base PPN Pekalongan respectively. Furthermore, the obtained
data were analyzed using software, namely SeaDAS and ArcGIS, and horizontal maps as a
result.
The first stage carried out in this research was making a map of the research area using
ArcGIS 10.3, then downloading data on chlorophyll-a. Chlorophyll-a data was downloaded
from the www.oceancolor.gsfc.nasa.gov page in the .nc format and converted to .xls or .txt
files. Data on shortfin scad catches were obtained from PPN Pekalongan as well as interviews
with fishers carrying out fishing activities using fishing gear called mini purse seine.
The second stage was the image processing phase, with chlorophyll-a distribution data
that has been downloaded, then opened SeaDAS software to process the cropping area to be
used. It is essential to change the data that has been cropped so it can be read by ArcGIS
software and filter data that does not exist, the advanced data processing was done in Ms. Excel,
and then the data interpolation process was done in ArcGIS software to determine the
distribution of chlorophyll-a in Pekalongan seawaters.
The final stage was the processing of shortfin scad production data. Data of shortfin scad
obtained from PPN Pekalongan was processed into graphical form, where the data was
World Scientific News 119 (2019) 111-124
-114-
validated by conducting interviews with fishers. Data from the fishing activities that had been
obtained are then analyzed and assessed based on predetermined indicators.
Ms. Excel 2016 was used to determine the relationship between production and
chlorophyll-a indicator. The degree of relationship is expressed by the correlation coefficient
(r). The higher “r” value indicates that the relationship between the two coefficients is getting
closer. The range of correlation coefficient values is -1 ≤ r ≤ +1. The correlation is strong if r ≥
0.7 and r ≤ - 0.7, and the correlation is weak if -0.7 < r < 0.7.
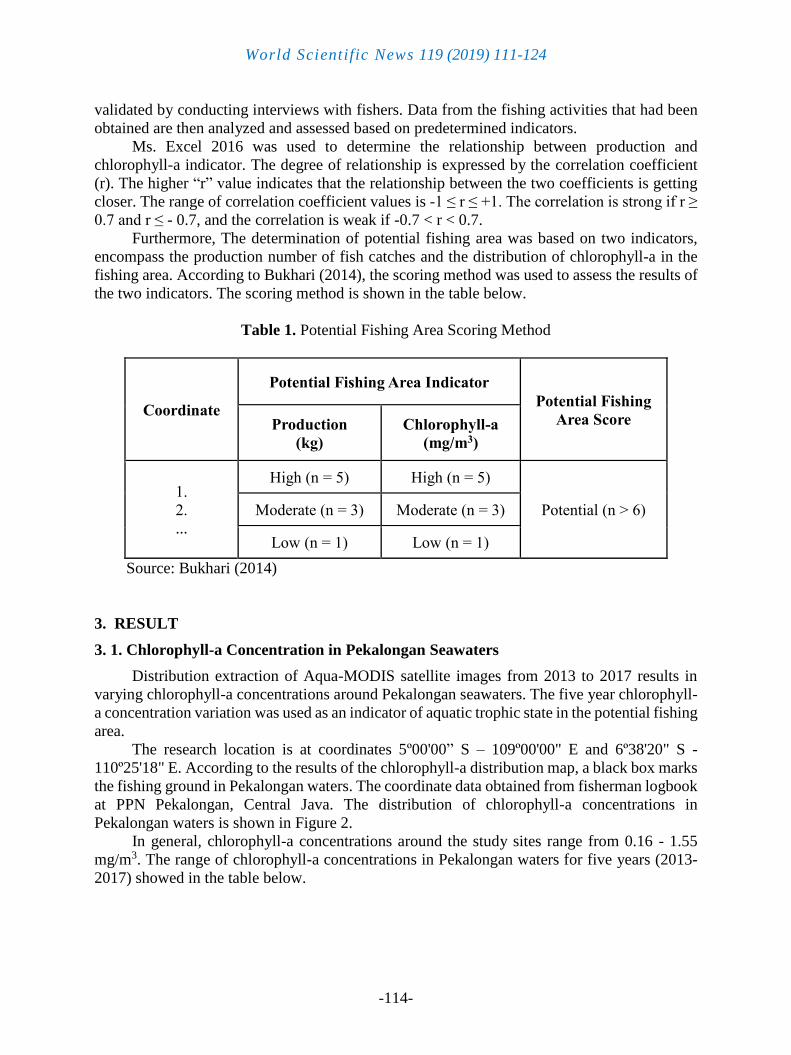
Furthermore, The determination of potential fishing area was based on two indicators,
encompass the production number of fish catches and the distribution of chlorophyll-a in the
fishing area. According to Bukhari (2014), the scoring method was used to assess the results of
the two indicators. The scoring method is shown in the table below.
Table 1. Potential Fishing Area Scoring Method
Coordinate
Potential Fishing Area Indicator
Potential Fishing
Area Score Production
(kg)
Chlorophyll-a
(mg/m3)
1.
2.
...
High (n = 5) High (n = 5)
Potential (n > 6) Moderate (n = 3) Moderate (n = 3)
Low (n = 1) Low (n = 1)
Source: Bukhari (2014)
3. RESULT
3. 1. Chlorophyll-a Concentration in Pekalongan Seawaters
Distribution extraction of Aqua-MODIS satellite images from 2013 to 2017 results in
varying chlorophyll-a concentrations around Pekalongan seawaters. The five year chlorophyll-
a concentration variation was used as an indicator of aquatic trophic state in the potential fishing
area.
The research location is at coordinates 5º00'00” S – 109º00'00" E and 6º38'20" S -
110º25'18" E. According to the results of the chlorophyll-a distribution map, a black box marks
the fishing ground in Pekalongan waters. The coordinate data obtained from fisherman logbook
at PPN Pekalongan, Central Java. The distribution of chlorophyll-a concentrations in
Pekalongan waters is shown in Figure 2.
In general, chlorophyll-a concentrations around the study sites range from 0.16 - 1.55
mg/m3. The range of chlorophyll-a concentrations in Pekalongan waters for five years (2013-
2017) showed in the table below.

World Scientific News 119 (2019) 111-124
-115-
(a) 2013
(b) 2014

World Scientific News 119 (2019) 111-124
-116-
(c) 2015
(d) 2016

World Scientific News 119 (2019) 111-124
-117-
(e) 2017
Figure 2(a-e). Chlorophyll-a Distribution Map (2013–2017)
Table 2. The Lowest and Highest Chlorophyll-a Concentration in Pekalongan Waters
Years Lowest (mg / m3) Highest (mg / m3)
2013 0.19 1.52
2014 0.21 1.51
2015 0.17 1.53
2016 0.16 1.52
2017 0.21 1.55
Based on the data obtained in Table 2, the chlorophyll-a concentration in Pekalongan
seawaters can be categorized as an area that has high chlorophyll-a concentrations. According
to Nontji (1984), the chlorophyll-a concentration is high if the chlorophyll-a concentration is
more than 1 mg / m3. Data on the distribution of chlorophyll-a concentrations presented in
Figure 1 also shows that the closer to the coastal area, the higher the chlorophyll-a

World Scientific News 119 (2019) 111-124
-118-
concentration. The high concentration of chlorophyll-a is influenced by the increase of nutrients
in the surface layer of the water through various processes of water mass dynamics, including
upwelling, vertical mixing of water masses and patterns of movement of water masses, which
carry nutrient-rich water masses from the surrounding waters.
The high concentration of chlorophyll-a around the coast occurs due to the accumulation
of nutrients carried by the river flow to the marine waters in the coastal region. It is following
by Nababan's statement (2009), which states that the supply of nutrients causes the high
distribution of chlorophyll-a through runoff land and increased rainfall.
3. 2. Shortfin Scad Production
The most dominant catch which is landed at the PPN Pekalongan, Central Java is shortfin
scad. Generally, shortfin scad is caught in various seasons, especially during the western season.
The production of shortfin scad during the period of 2013 - 2017 showed that there were
different fluctuations even though they tend to be stable, but there were decreases in 2015 and
2017. The shortfin scad catches for the period 2013 - 2017 are shown in Figure 3.
Figure 3. The production of shortfin scad in five years (2013-2017)
The highest monthly shortfin scad catch was in March 2016 amounting to 311,591 kg,
while the lowest catch was in July 2015 of 420 kg. The average shortfin scad catch for five
years is 897,428 kg, with an average monthly of 75,286 kg. The decline in total production
occurred in 2015 and 2017 due to the adverse effects of the weather and the number of trips per
year which decreased from the previous year.
Based on monthly catch data, it is known that the average shortfin scad catch decreases in June
- August each year. The decrease in catch is due to an alleviated number of boat trips compared
to other months. Otherwise, Perissi (2017) states that other factors must be considered to
0
50 000
100 000
150 000
200 000
250 000
300 000
350 000
2013 2014 2015 2016 2017
Sho
rtfi
n S
cad
Pro
duct
ion (
kg)
Jan
Feb
Mar
Apr
Mei
Jun
Jul
Agt
Sep
Okt
Nov
Des

World Scientific News 119 (2019) 111-124
-119-
declining issues, such as overexploited resources and lack of fishing management. The average
graph of monthly catches of shortfin scad for five years is shown in Figure 4.
Figure 4. Average monthly of shortfin scad catch results (2013-2017)
Results of average shortfin scad for five years in PPN Pekalongan indicate that catch
production shortfin scad is more significant in the west monsoon compared to the east monsoon.
Generally, in Indonesia, the fishing season is divided into west monsoon (September-February)
and east monsoon (March-August). Alleged fishing activities in the western season are more
trips made so that the production value is higher than the east season.
Marine productivity in Java sea also related to the monsoon wind. Chlorophyll-a and Sea
Surface Temperature experience mixing process which is affected by the speed of monsoon
wind. The faster wind speed, the stronger process mixing process occurred. The stronger mixing
process can carry more nutrients from deeper water which make chlorophyll-a increased.
(Wirasatriya et al. 2018).
3. 3. Correlation between Chlorophyll-a and Shortfin Scad Production
The relationship between chlorophyll-a and shortfin scad production in Pekalongan
seawaters is illustrated in Figure 5. The bar axis shows production, while the line axis represents
chlorophyll-a respectively in a five years periods (2013 – 2017).
187 018
121 227
158 835
54 106
27 185
8 555 5 18613 057
35 93237 234
135 420
119 674
0
20 000
40 000
60 000
80 000
100 000
120 000
140 000
160 000
180 000
200 000
Cat
ch R
esult
(kg)
Months

World Scientific News 119 (2019) 111-124
-120-
(a) 2013
(b) 2014
(c) 2015
(d) 2016
(e) 2017
Figure 5. The Relationship between chlorophyll-a and shortfin scad production (2013 – 2015)
0,000
0,100
0,200
0,300
0,400
0,500
0,600
0,700
0
50 000
100 000
150 000
200 000
250 000
Jan
Feb
Mar
Ap
r
Mei
Jun
Jul
Ag
t
Sep
Ok
t
No
v
Des
0,000
0,100
0,200
0,300
0,400
0,500
0,600
0,700
0
50 000
100 000
150 000
200 000
250 000
300 000
Jan
Feb
Mar
Ap
r
Mei
Jun
Jul
Agt
Sep
Okt
No
v
Des
0,000
0,100
0,200
0,300
0,400
0,500
0,600
0
20 000
40 000
60 000
80 000
100 000
120 000
140 000
160 000
180 000
200 000
Jan
Feb
Mar
Ap
r
Mei
Jun
Jul
Agt
Sep
Okt
No
v
Des
0,000
0,100
0,200
0,300
0,400
0,500
0,600
0,700
0
50 000
100 000
150 000
200 000
250 000
300 000
350 000
Jan
Feb
Mar
Ap
r
Mei
Jun
Jul
Ag
t
Sep
Ok
t
No
v
Des
0,000
0,100
0,200
0,300
0,400
0,500
0,600
0
50 000
100 000
150 000
200 000
250 000
Jan
Feb
Mar
Ap
r
Mei
Jun
Jul
Agt
Sep
Okt
No
v
Des

World Scientific News 119 (2019) 111-124
-121-
The relationship between time lag chlorophyll-a concentration and shortfin scad
production in Pekalongan seawaters was obtained through statistical analysis using software
ms. Excel. The results of the linear regression test show that the value of R square (R2) is 0.23
or 23%. Based on these values, it can be overviewed that 23% of the chlorophyll-a factor affects
the shortfin scad catches. The remaining 77% is influenced by other factors. The correlation
test results show that the value of “r” (correlation coefficient) is 0.47. It shows that the
relationship between chlorophyll-a concentration and shortfin scad catches in Pekalongan
waters, Central Java is categorized as a weak relationship due to the value of r <0.7 (Walpole
1995).
Besides this, the relationship of chlorophyll-a with shortfin scad catches is said to be not
tight because chlorophyll-a is not the only indicator that can indicate a potential fishing area. In
addition to chlorophyll-a, indicators that are usually used to determine potential fishing areas
are SST and current. The graph of the relationship between chlorophyll-a to shortfin scad
catches is shown in Figure 6.
Figure 6. The correlation coefficient between catch result and chlorophyll-a time lag
The concentration in an ocean is closely related to the food chain when the chlorophyll-a
concentration is high, and it will increase zooplankton productivity. Moreover, it can create a
food chain that supports fish productivity in water. The trend of increasing or decreasing the
concentration of chlorophyll-a and the catch of shortfin scad can be said to be almost the same,
but the peak increase in the concentration of chlorophyll-a and shortfin scad catches did not
occur at the same time. The time difference shows that the concentration of chlorophyll-a does
not directly affect the fish catches in Pekaongan waters of Central Java but requires time lag for
chlorophyll-a to be utilized by pelagic fish (Chandra and Musuka 2012). According to Simbolon
and Girsang (2009), the time lag between an increase in chlorophyll-a and an increase in the
number of fish catch is 30 days.
y = 580263x - 176474R² = 0,23
0
20000
40000
60000
80000
100000
120000
140000
160000
180000
200000
0 0,1 0,2 0,3 0,4 0,5 0,6
Cat
ch R
esult
(kg)
Chlorophyll-a (mg/m3)

World Scientific News 119 (2019) 111-124
-122-
3. 4. Determination of Potential Fishing Areas
The fishing ground is one of the crucial factors in determining the success of the fishing
activity. Seawater can be said to be a fishing area if there are interactions between the fish that
are the target of catching and the fishing technology used to catch fish. Based on the results of
interviews with fishers who landed shortfin scad in Pekalongan PPN, the catching area of
shortfin scad is scattered around the seawaters of North Pekalongan. The ship used is a type of
mini purse seine. The ship has a volume that varies from 10-30 GT.
Potential fishing area categories of shortfin scad are made based on the fishing season,
namely the west season (September-February) and east season (March-August) which are based
on two indicators including the amount of fish catch and chlorophyll-a concentration in shortfin
scad fishing areas in the seawaters of North Pekalongan. Furthermore, the spatial and temporal
categories of potential shortfin scad areas are assessed. In accordance with the assessment of
the DPI indicator, it can be seen that the shortfin scad area has 25 potential coordinates which
are divided into 13 potential coordinates in the east and 12 potential coordinates in the west
season. The DPI distribution map is made based on the scoring that has been done by taking
into account the optimum number of fish catches and chlorophyll-a for shortfin scad activities.
Judging from the chlorophyll-a concentrations scattered in Pekalongan waters, it can be
indicated that potential fishing areas are found in Figure 7.
Figure 7. Fishing Potential Areas distribution in Pekalongan seawaters
The results of the distribution of potential shortfin scad fishing areas indicate that
oceanographic parameters influence fishing activities, although using one of the parameters

World Scientific News 119 (2019) 111-124
-123-
does not show high significance. According to Daqamseh (2013), the accuracies of mapping
fishing potential areas were low due to considering on single correlation with only one
oceanographic parameter. One alternative is to overlay two variables including combining the
contours between SST (Sea Surface Temperature) and the chlorophyll-a contour in order to
obtain a more optimal calculation result.
One of the most significant factors in determining DPI is oceanographic parameters,
which causes fish to choose a place according to their physiological conditions, thus affecting
patterns of fish behavior, in the form of moving motion for adjusting to conditions favorable to
their existence. As for determining potential fishing grounds, another method should be
implemented, such as in situ sampling survey. (Patra et al. 2018)
4. CONCLUSIONS
Based on the results of research by determining the potential fishing area of shortfin scad
and chlorophyll-a distribution in Pekalongan, it can be concluded that there are 25 coordinates
of potential shortfin scad where 13 potential coordinates in the east and 12 potential coordinates
in the west monsoon. Based on statistical analysis, it can be overviewed that the concentration
of chlorophyll-a affects 23% of the shortfin scad catches in the waters of Pekalongan, and the
rest is influenced by other factors.
Acknowledgment
The authors would like to thank the NASA for the chlorophyll-a data and PPN Pekalongan for production of
shortfin scad data.
References
[1] Apriliani, I. M., Nurrahman, Y. A., Dewanti, L.P., Herawati, H., 2018. Determination of
Potential fishing ground for hairtail (Trichiurus sp.) fishing based on chlorophyll-a
distribution and sea surface temperature in Pangandaran waters, West Java, Indonesia.
AACL Bioflux. 11(4): 1047-1054.
[2] Bukhari. 2014. Estimation of Mackerel Catching Areas Based on Sea Surface
Temperature Distribution and Chlorophyll-A in Bangka Waters. Journal of FPIK
UNDIP Capture Fisheries 1 (3): 1-21.
[3] Chandra K. M., Musuka C. G., 2012. Determination of chlorophyll-a and total
phosphorus abundance in organic manured fish ponds. AACL Bioflux. 5 (4): 223–230.
[4] Copeland, A., Edinger, E., Devillers, R., Bell, T., LeBlanc, P., Wroblewski, J. 2013.
Marine habitat mapping in support of Marine Protected Area management in a subarctic
fjord: Gilbert Bay, Labrador, Canada. Journal of Coastal Conservation 17 (2): 225-237.
[5] Daqamseh, S. T., Mansor, S., Pradhan, B., Billa, L., Mahmud. A. R. 2012. Potential fish
habitat mapping using MODIS-derived sea surface salinity, temperature, and chlorophyll-
a data: South China Sea Coastal areas, Malaysia, Geocarto International, 28 (6): 546-
560.

World Scientific News 119 (2019) 111-124
-124-
[6] Montres, M.A., Vernet, M., Smith, R., Carder, L. 2008. Phytoplankton size-structure on
the western shelf of the Antarctic Peninsula: a remote sensing approach. International
Journal of Remote Sensing, 29 (3): 801–829.
[7] Nontji, A. 1984. Biomass and phytoplankton productivity in Jakarta Bay Waters and its
relation to environmental factors. Research Report of Faculty of Fisheries, Bogor:
Bogor Agricultural Institute, 241 pp.
[8] Oguz, T., Deshpande, A.G., and Rizzoli, P.M., 2002. The role of mesoscale processes
controlling biological variability in the Black Sea coastal waters: inferences from Sea
WiFS derived surface chlorophyll field. Continental Shelf Research, 22, 1477–1492.
[9] Patra, B. C., Bhattacharya, M., Kar, A., Das, B. K., Shit, P. K., 2018. Assessment of
Potential Marine Fishing Zone Using Geospatial Technologies at the Coastal Stretch of
West Bengal: India Case Studies. Geospatial Infrastructure, Applications, and
Technologies. India.
[10] Perissi, I., Bardi, U., Asmar, T. E., Lavacchi, A. 2017. Dynamic patterns of
overexploitation in fisheries. Journal Ecological Modelling, 359, 285-292.
[11] PPN Pekalongan. 2014. 2013 Annual Report. Pekalongan. 80 pp.
[12] Reynolds CA, Yitayew M, Hutchinson CF. 2009. Estimating Crop Yield and Production
by Integrating the FAO Crop Specific Water Balance Model with Real-time Satellite
Data and Ground-Based Ancillary Data. International Journal of Remote Sensing,
21(18): 3487-3508.
[13] Achmad Rizal, Zuzy Anna. Climate Change and Its Possible Food Security Implications
Toward Indonesian Marine and Fisheries. World News of Natural Sciences 22 (2019)
119-128
[14] Simbolon D., Girsang H. S., 2009. The relationship between chlorophyll-a
concentration and frigate mackerel catches in the fishing ground of Palabuhanratu
waters. Journal of Indonesian Fisheries Research, 15 (4): 297–305.
[15] Adi Prasetyo, Herman Hamdani, Sri Astuty, Lantun P. Dewanti, The Eco Friendly
Level of Mini Purse Seine Based on Catch Decapterus spp in Pekalongan Nusantara
Fishing Port, Central Java, Indonesia. World News of Natural Sciences 21 (2018) 42-52
[16] William, T. T., Tedd, H., and Julie, P., 2007. Investigation of a sea breeze front in an
urban environment. Journal of the Royal Meteorological Society, 133, 579–594.
[17] Wirasatriya, A., Prasetyawan, I. B., Triyono, C. D., Muslim, Maslukah., L. 2017. Effect
of ENSO on the variability of SST and Chlorophyll-a in the Java Sea. IOP Conf. Series:
Earth and Environmental Science, 116: 012063
[18] Zine, S., Boutin, J., Font, J., Reul, N. 2008. Overview of the SMOS sea surface salinity
prototype processor. IEEE Transactions on Geoscience and Remote Sensing, 46 (3):
621–645.
[19] Xinjun Chen, Bilin Liu, Yong Chen. A review of the development of Chinese distant-
water squid jigging fisheries. Fisheries Research Volume 89, Issue 3, March 2008,
Pages 211-221