THE DETERMINANTS OF ORGANIZATIONAL INNOVATION …
243
THE DETERMINANTS OF ORGANIZATIONAL INNOVATION MANAGEMENT EFFECTIVENESS IN THE THAI BANKING INDUSTRY Phanu Limmanont A Dissertation Submitted in Partial Fulfillment of the Requirements for the Degree of Doctor of Philosophy (Development Administration) School of Public Administration National Institute of Development Administration 2010
Transcript of THE DETERMINANTS OF ORGANIZATIONAL INNOVATION …
THE DETERMINANTS OF ORGANIZATIONAL INNOVATION
MANAGEMENT EFFECTIVENESS IN THE THAI
BANKING INDUSTRY
Phanu Limmanont
A Dissertation Submitted in Partial
Fulfillment of the Requirements for the Degree of
Doctor of Philosophy (Development Administration)
School of Public Administration
National Institute of Development Administration
2010
iii
ABSTRACT
Title of Dissertation The Determinants of Organizational Innovation
Management Effectiveness in Thai Banking Industry
Author Mr.Phanu Limmanont
Degree Doctor of Philosophy (Development Administration)
Year 2010
The purpose of this study was to develop and to test a theoretical framework
for explaining the determinants of organizational innovation management effectiveness.
The main objective was to explain the determinants of seven contingency prediction
factors behind innovation management effectiveness in an organization, namely
Innovation Strategy, Organizational Structure, Organization Culture, Project Management,
Team Cohesiveness, Strategic Leadership and Coordination and Communication.
In addition, the dissertation attempted to employ the concept of resource-based
view theory organizational contingency theory to explain the determinants of the
seven contingency prediction factors, which examines whether the outputs of all these
positive alignments impact the innovative capacity and to test the model of the seven
contingency prediction factors of innovation management effectiveness.
In research methodology, the researcher provided a literature review of
documents from several sources and used the review to derive at the conceptual
framework and hypotheses model. Furthermore, the questionnaire was developed by
operationalizing the constructs or variables from the literature review to test the
hypotheses. The researcher also conducted a pre-and-test to test the reliability of the
questionnaires as a result of high reliability efficiency. The primary data will be
collected through questionnaires from the non-probability sampling population of the
staff of both commercial banks (SCB and KBank) and state-owned banks (KTB and
GHB). The research methodology is also considered critical to the success of this
work. The research employed both quantitative and qualitative methods and the
iv
quantitative data was analyzed using SPSS and Structural Equation Model-AMOS
program.
A theoretical, managerial and policy models were developed and the
constructs of innovation strategy and strategic leadership were found to be the main
influence on conceptual innovation management effectiveness while organization culture,
team cohesiveness and project management had a significant positive influence on
innovation management effectiveness. Furthermore, there were no significant differences
between commercial banks and state owned banks. Also, business policies which
formulated the business strategy and process were the key drivers behind improving
innovation management effectiveness. Finally, this dissertation provided the limitations of
the study as well as recommendations regarding policy implications and the future
directions of research study.
ACKNOWLEDGEMENTS
I owe my deepest gratitude to Associate Professor Dr. Chindalak Vadhanasindhu,
a major advisor and a member of the examining committee, who truly guided me
throughout this work, providing me with attentive and well-considered comments.
Thank also to Associate Professor Dr. Fredric William Swierczek, a chairperson of
the examining committee, who shared his valuable time to give me constructive
criticism regarding the study. I’d like also to express my gratitude to Associate
Professor Dr. Montree Socatiyanurak, a member of the examining committee, who
provided insightful comments and drew on his experiences in banking to aid the
development of this study. I would like to express again my sincere gratitude and
deep appreciation for all their kindness, support, guidance and generous assistance.
I want to thank all involved persons, all the lecturers and staff of the Graduate
School of Public Administration for their support and valuable advice during the past
period and also to those employees of the banks who assisted during data field
collection.
I also want to thank my lovely wife and my charming daughter for their
inspiration and understanding as well as continuous encouragement during my
accomplishment of my doctorate degree.
Lastly, I would like to express my appreciation to everybody else who has
been very supportive during the completion of the dissertation.
Phanu Limmanont
January 2011
TABLE OF CONTENTS
Page
ABSTRACT iii
ACKNOWLEDGEMENTS v
TABLE OF CONTENTS vi
LIST OF TABLES ix
LIST OF FIGURES xi
ABBREVIATION xii
CHAPTER 1 INTRODUCTION 1
1.1 The Purpose of the Study 1
1.2 Statement of the Problem 2
1.3 Approach of the Study 10
1.4 Objectives of the Study 12
1.5 Significant of the Study 13
CHAPTER 2 LITERATURE REVIEW 25
2.1 Innovation Management Effectiveness 25
2.2 Innovation Strategy 35
2.3 Organization Structure 39
2.4 Organization Culture 45
2.5 Project Management 50
2.6 Team Cohesiveness 54
2.7 Strategic Leadership 59
2.8 Coordination and Communication 64
CHAPTER 3 CONCEPTUAL THEORY 74
3.1 Resource-Based View 74
3.2 Organizational Theory 79
3.3 Contingency Theory 83
vii
3.4 HRM and Innovation 88
3.5 Definition of Effectiveness and Efficiency 89
CHAPTER 4 CONCEPTUAL FRAMEWORK AND HYPOTHESES 95
4.1 Conceptual Overview 95
4.2 Research Hypotheses 105
4.3 Operationalization of Variables 107
CHAPTER 5 RESEARCH METHODOLOGY 112
5.1 Research Design 112
5.2 Approaches of the Study 113
5.3 Units of Analysis 113
5.4 Target Population 113
5.5 Sampling 114
5.6 Method of Analysis 116
5.7 Measurement of Reliability and Validity 122
5.8 Research Process 128
CHAPTER 6 DATA ANALYSIS 130
6.1 Characteristics of the Respondents 130
6.2 Result of Descriptive Statistics 132
6.3 Comparison of Means 139
6.4 Reliability Analysis 142
6.5 Validity 143
6.6 Model Assessment 150
CHAPTER 7 DISCUSSION CONCLUSIONS AND IMPLICATIONS 167
7.1 Discussion 167
7.2 Conclusion of the Study 168
7.3 Contributions of the Study 175
7.4 Managerial Contribution and Implication 177
7.5 Recommendations 178
7.6 Limitations of the Study 179
7.7 Future Directions of Research Study 180

viii
BIBLIOGRAPHY 182
APPENDICES 222
Appendix A Cover Letter 223
Appendix B Survey Questionnaire 225
BIOGRAPHY 231
ix
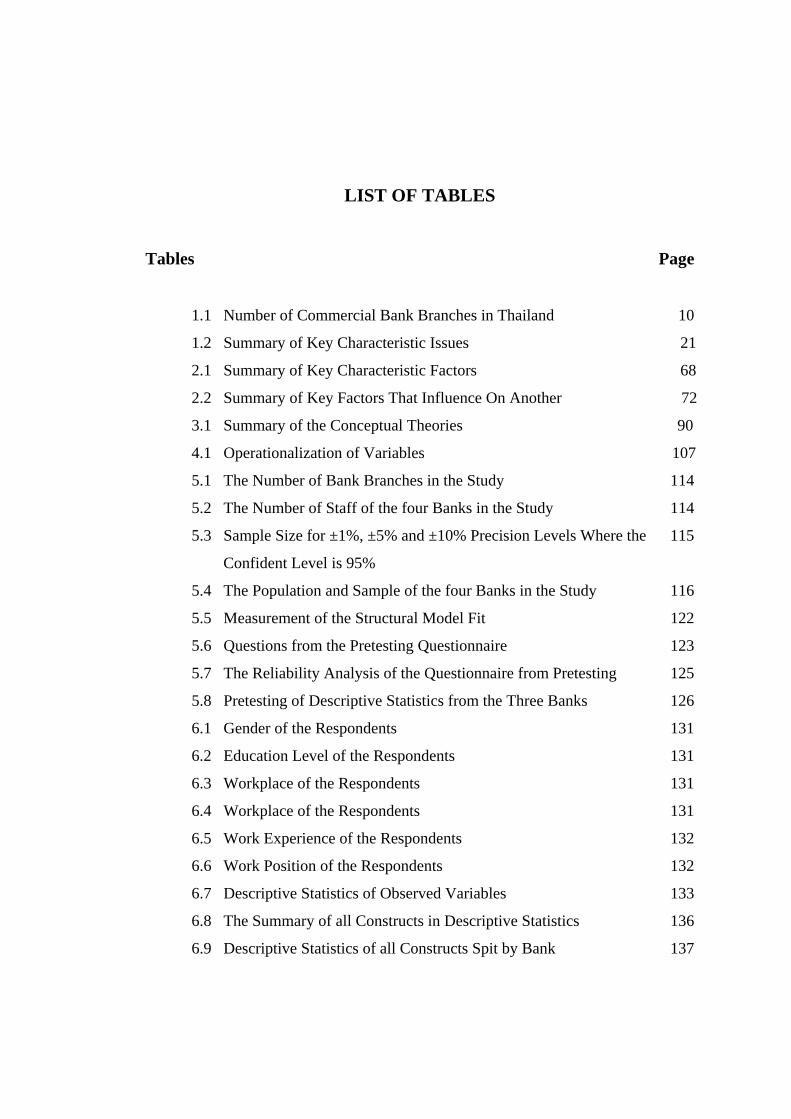
LIST OF TABLES
Tables Page
1.1 Number of Commercial Bank Branches in Thailand 10
1.2 Summary of Key Characteristic Issues 21
2.1 Summary of Key Characteristic Factors 68
2.2 Summary of Key Factors That Influence On Another 72
3.1 Summary of the Conceptual Theories 90
4.1 Operationalization of Variables 107
5.1 The Number of Bank Branches in the Study 114
5.2 The Number of Staff of the four Banks in the Study 114
5.3 Sample Size for ±1%, ±5% and ±10% Precision Levels Where the 115
Confident Level is 95%
5.4 The Population and Sample of the four Banks in the Study 116
5.5 Measurement of the Structural Model Fit 122
5.6 Questions from the Pretesting Questionnaire 123
5.7 The Reliability Analysis of the Questionnaire from Pretesting 125
5.8 Pretesting of Descriptive Statistics from the Three Banks 126
6.1 Gender of the Respondents 131
6.2 Education Level of the Respondents 131
6.3 Workplace of the Respondents 131
6.4 Workplace of the Respondents 131
6.5 Work Experience of the Respondents 132
6.6 Work Position of the Respondents 132
6.7 Descriptive Statistics of Observed Variables 133
6.8 The Summary of all Constructs in Descriptive Statistics 136
6.9 Descriptive Statistics of all Constructs Spit by Bank 137
x
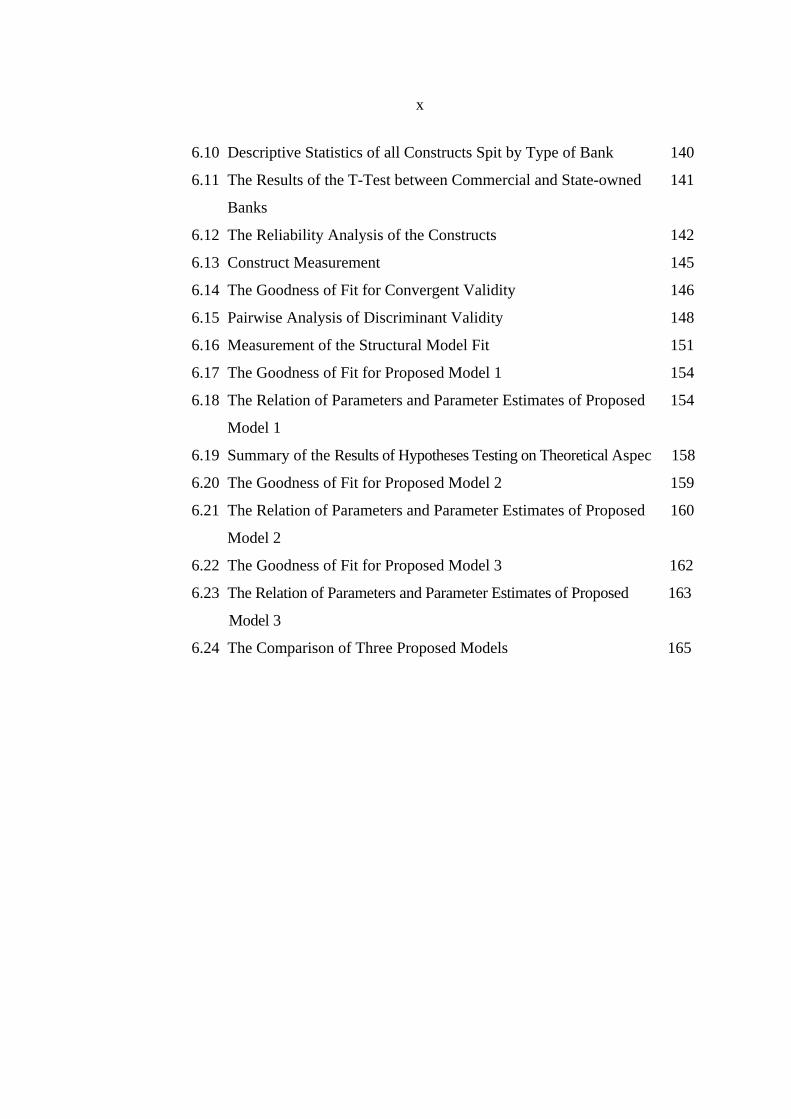
6.10 Descriptive Statistics of all Constructs Spit by Type of Bank 140
6.11 The Results of the T-Test between Commercial and State-owned 141
Banks
6.12 The Reliability Analysis of the Constructs 142
6.13 Construct Measurement 145
6.14 The Goodness of Fit for Convergent Validity 146
6.15 Pairwise Analysis of Discriminant Validity 148
6.16 Measurement of the Structural Model Fit 151
6.17 The Goodness of Fit for Proposed Model 1 154
6.18 The Relation of Parameters and Parameter Estimates of Proposed 154
Model 1
6.19 Summary of the Results of Hypotheses Testing on Theoretical Aspec 158
6.20 The Goodness of Fit for Proposed Model 2 159
6.21 The Relation of Parameters and Parameter Estimates of Proposed 160
Model 2
6.22 The Goodness of Fit for Proposed Model 3 162
6.23 The Relation of Parameters and Parameter Estimates of Proposed 163
Model 3
6.24 The Comparison of Three Proposed Models 165
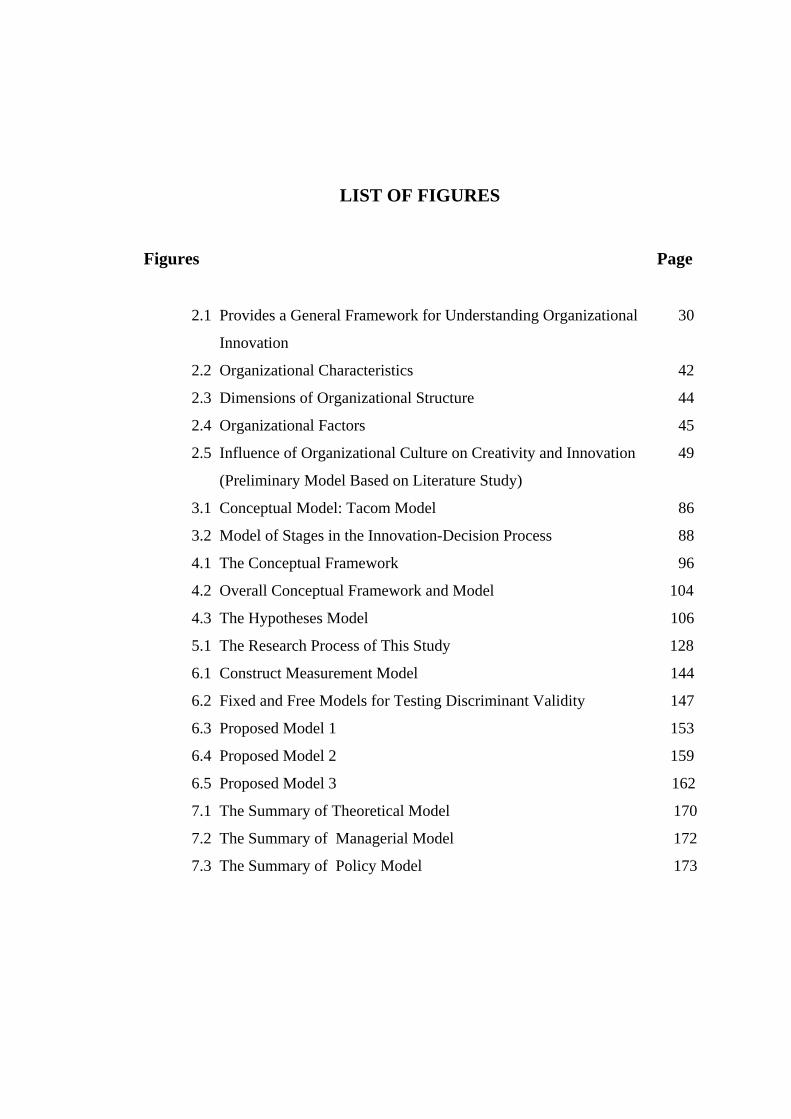
LIST OF FIGURES
Figures Page
2.1 Provides a General Framework for Understanding Organizational 30
Innovation
2.2 Organizational Characteristics 42
2.3 Dimensions of Organizational Structure 44
2.4 Organizational Factors 45
2.5 Influence of Organizational Culture on Creativity and Innovation 49
(Preliminary Model Based on Literature Study)
3.1 Conceptual Model: Tacom Model 86
3.2 Model of Stages in the Innovation-Decision Process 88
4.1 The Conceptual Framework 96
4.2 Overall Conceptual Framework and Model 104
4.3 The Hypotheses Model 106
5.1 The Research Process of This Study 128
6.1 Construct Measurement Model 144
6.2 Fixed and Free Models for Testing Discriminant Validity 147
6.3 Proposed Model 1 153
6.4 Proposed Model 2 159
6.5 Proposed Model 3 162
7.1 The Summary of Theoretical Model 170
7.2 The Summary of Managerial Model 172
7.3 The Summary of Policy Model 173
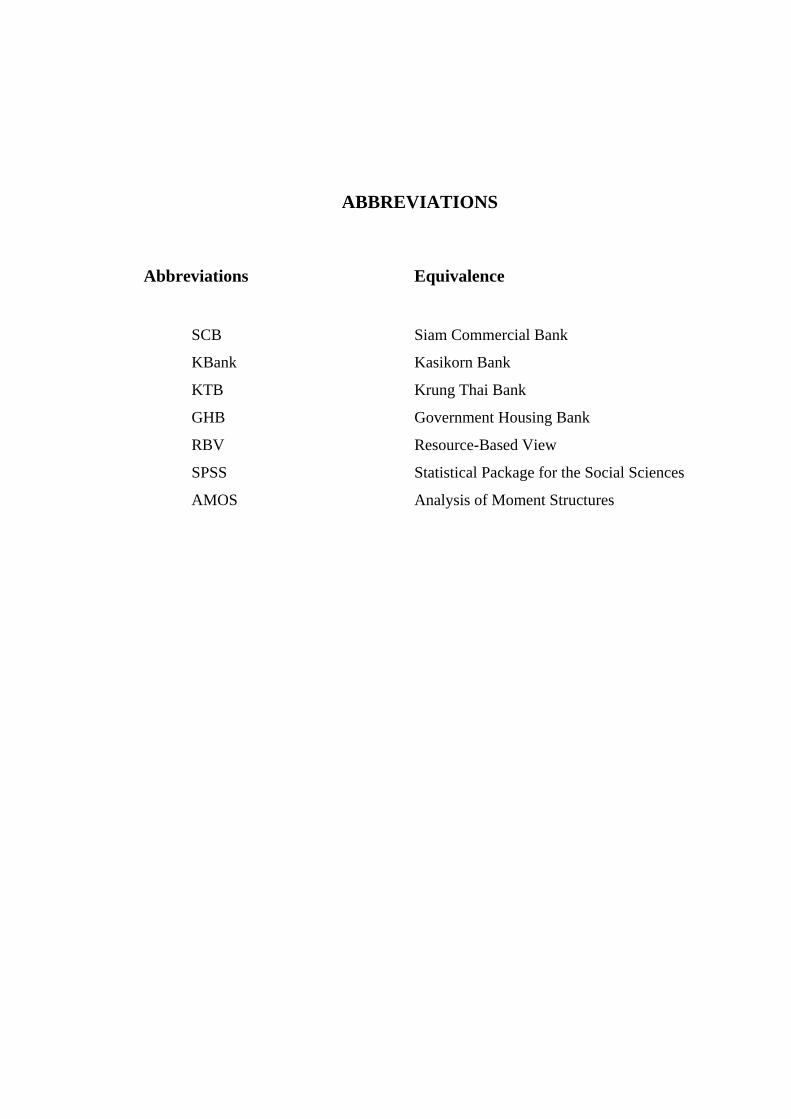
ABBREVIATIONS
Abbreviations Equivalence
SCB Siam Commercial Bank
KBank Kasikorn Bank
KTB Krung Thai Bank
GHB Government Housing Bank
RBV Resource-Based View
SPSS Statistical Package for the Social Sciences
AMOS Analysis of Moment Structures
CHAPTER 1
INTRODUCTION
In this chapter, the researcher introduces the context of the research study, that
of the banking industry, in which the purpose of the study and the statement of
problems are identified. The approach of the study also employs the essential themes
of both resources-based view and organizational contingency theories to explain the
determinants of the contingency prediction factors in the field of innovation
management effectiveness. The objectives of the study are to study the determinant
factors with explanations of the results of the outputs and to test the model of the
hypotheses.
1.1 Purpose of the Study
The purpose of this study is to develop and to test a theoretical framework for
explaining the determinants of organizational innovation management effectiveness.
The main objective is to explain the determinants of the seven contingency prediction
factors behind innovation management effectiveness in an organization, namely
Innovation Strategy, Organizational Structure, Organization Culture, Project Management,
Team Cohesiveness, Strategic Leadership and Coordination and Communication.
The research also attempts to employ the concepts of the resource-based view
theory and organizational contingency theory to explain the determinants of the seven
contingency prediction factors, thereby examining whether the outputs of all these
positively impact innovative capacity by enhancing bank operation management
effectiveness in sustaining competitiveness. Bank operation management effectiveness is
an area of banking concerned with the production of financial goods and services, and
involves the responsibility of ensuring that bank operations are efficient in terms of
using as few resources as needed, and being effective in terms of meeting customer
requirements. It is concerned with managing the process that converts inputs (in the
2
forms of equipments, technology, knowledge and creativity) into outputs (in the forms
of goods and services).
Sample unit analysis is also carried out four banks representative of a non-
probability sampling population of the bank industry These comprise Commercial
Banks (Siam Commercial Bank (SCB) and Kasikorn Bank (KBank)) and State-
Owned Banks (Krung Thai Bank (KTB) and Government Housing Bank (GHB))-with
the number of respondents given below.
Siam Commercial Bank 137 Respondents
Kasikorn Bank 112 Respondents
Krung Thai Bank 127 Respondents
Government Housing Bank 21 Respondents
Total Sampling units 397 Respondents
1.2 Statement of the Problem
1.2.1 Forces of Change
In Thailand, the 1997 financial crisis was not only brought about by factors
related to the economic cycle but also exacerbated by structural weaknesses in the
system. A significant cause of the crisis was the massive capital inflows into the
economy without effective management mechanisms. Some examples of the weak
initial conditions were ineffective corporate governance, inadequate supervision and
regulation, and insufficient or, in some cases, inaccurate disclosure which resulted in
lax credit policies in banks and other financial institutions and misuse of funds in the
corporate sector.
Thailand initiated its financial liberalization efforts in the early 1990s. The
first step was the acceptance of Article VIII of the International Monetary Fund’s
Articles of Agreement, followed by a series of deregulatory measures in the financial
system. Market opening of the financial system ensued with the establishment of the
Bangkok International Banking Facilities (BIBFs) in 1993, which coincided with the
global trend of surges in capital flows to the emerging market economies. In July
1997, Thailand faced the worst economic and financial crisis in its recent history. In
3
retrospect, the crisis was closely linked to the premature financial liberalization and
market opening.
Owing to the liberalization policy and the swiftness of capital mobility in the
integrated financial system, business has access to overseas funds at relatively low
cost and allocated such funds for rapid expansion and other purposes; a process which
was in general not subject to adequate monitoring and control. It cannot be denied that
liberalization at a time when the underlying economic strength and infrastructure were
not yet well instituted posed threats to both the host country and the global market
place because of the potential for contagion and systemic impacts. The following
subsections list some major infrastructure components that were absent at the
outbreak of the recent crisis and what has been done in order to prevent future crises.
1.2.2 Inadequate Information System
While information on foreign borrowing through the banking system was
monitored, inadequate information on non-bank private corporate foreign debt
resulted in an incomplete aggregate picture of the country’s foreign liabilities. Data on
sector allocation of credits did not show any signs of overextension to the property or
real estate sectors, and in fact funds seemed to be properly allocated to the productive
sectors. Direct lending to the property sector or real estate businesses was consistently
below 5% of total lending.
However, it became apparent after the crisis that these so-called productive
sectors, such as exporters, had used their BIBF proceeds to invest heavily in the
property and real estate sectors, thus turning the entire business group into NPLs
overnight as the baht depreciated.
Another area of information deficiency was demand and supply in the
property market. During the bubble economy period, the real estate industry grew
rapidly. However, developers were not fully aware until much later that supply was
considerably outgrowing demand.
Systems for collecting necessary data are now in place. Thailand became the
21st country to meet the specifications of the Special Data Dissemination Standard,
established in May 1996 by the International Monetary Fund to enhance the quality,
integrity, availability and timeliness of comprehensive economic and financial statistics.
4
Moreover, Thailand is in the process of enacting the Credit Bureau Act so that banks
can disclose both personal and corporate loan information about borrowers without
seeking the borrower’s consent.
1.2.3 Inability to Utilize Policy Instruments, Particularly the Exchange
Rate
Rigidity in the exchange rate system, and the lack of political will to tighten
fiscal policy in the midst of an overheating economy, sent a warning signal worldwide
of the unsustainability of the country’s economic situation. Pressure was also put on
monetary policy, which was further constrained by its inability to act autonomously.
The high interest rate policy, in turn, encouraged further foreign capital inflows,
exacerbating the already overheated economy.
Under a basket-peg exchange rate regime and volatile global capital flows,
little room was available for independent monetary policy. Defending or abandoning
the exchange rate peg was a difficult policy dilemma. In fact, before the float, the real
effective exchange rate had appreciated in line with the US dollar. However, whether
and to what extent it was overvalued was controversial, as it depends on the
equilibrium. real effective exchange rate. If one takes the period when the current
account was in equilibrium, say in 1990, as the benchmark, there was an overvaluation of
8% at most of the time of the float. However, recognizing the loss in competitiveness
and structural changes since 1990, such a benchmark would have been too simplistic.
Nevertheless, it was felt that tampering with the exchange rate system (e.g. band
widening) under the circumstances of intense speculative pressure and ebbing
domestic confidence would have resulted in a wholesale run on the baht and prompted
an immediate currency crisis. The Bank of Thailand, even with substantial foreign
reserves, would not have been able to stabilize the exchange rate, given the much
larger unhedged foreign currency debts of Thai corporations, which would have
rushed to close their exposure on the first signs of any weakening commitment to a
stable exchange rate. The decision was made to protect the exchange rate system as
long as possible in order to buy time for the authorities to tackle fundamental
problems in the economy and the financial sector without having to face a simultaneous
currency crisis.
5
Such a policy decision was premised on the rationale that a devaluation of the
baht would have done more harm than good for the following reasons:
1.2.4 Outdated Legal Framework
Another factor contributing to the difficult pre-crisis environment was the
outdated legal and regulatory framework. The foreclosure law involved lengthy
procedures that did not allow financial institutions to sell, foreclose or dispose of bad
debts to stop losses. This law, as well as the bankruptcy law, has now been amended
to expedite legal procedures. The new laws, especially the bankruptcy law, also
facilitate the settling of cases in court as well as provide opportunities for both
creditors and debtors to rehabilitate the debts for mutual benefits. At the same time,
the new Financial Institutions Act has been drafted and is currently before parliament.
It will pave the way for Thai supervisors to improve their approaches in response to
the changing financial environment. The draft law broadens the scope of commercial
banks’ financial activities, by allowing them to form financial conglomerates,
empowering the Bank of Thailand to apply consolidated supervision and encourage
the practice of good governance. Not only can market discipline impose strong
incentives on banks to conduct their business in a safe, sound and efficient manner,
but it can also encourage them to efficiently allocate resources and maintain a strong
cushion against future losses. Since reliable and timely information enables all
stakeholders to make effective assessments, the Bank of Thailand has required
financial institutions to disclose specified information following the accounting
standards, which are in line with international standards.
1.2.5 Inexperienced Risk Management and Poor Governance of Financial
Institutions and Corporations
Banks’ lending practices were largely collateral-based. Less attention was paid
to cash flow or analyses of project feasibility. With the property and stock price
boom, financial institutions did not expend resources on valuing the underlying
collateral. Banks were also under pressure from shareholders to take on risky
investments in return for potential profits that would allow attractive dividend
payments. This, in turn, made them less vigilant in monitoring and taking appropriate
actions against borrowers once they showed signs of financial deterioration.
6
Unfortunately, the real estate and stock market booms overshadowed the growing
risks inherent in the system.
Before 1997, a number of Thai corporations had taken advantage of cheap
foreign funds and the pegged exchange rate to borrow heavily from abroad. Many of
them neither had foreign currency income, nor adequately hedged positions. When the
exchange rate regime changed to the managed float system, many found their foreign
liabilities had approximately doubled. Risk management has become an essential
component of the financial sector as financial institutions compete in an environment
of increased risk and larger and more liquid financial markets. The Bank of Thailand
organized a risk management symposium to promote a broader understanding of the
risks involved in the finance and banking sector as well as stimulate concerted action
to develop and strengthen prudential standards towards risk management for the
stability of the Thai financial system.
1.2.6 Lax Supervision
Prudential regulations, especially in the area of loan classification and
provisioning, were inadequate. The skills required for on-site examination, and off-
site supervision using a risk- based approach, were lacking. This, coupled with the
absence of proper credit risk analysis, led to financial structures that were inherently
fragile. To make matters worse, the weak standard of transparency and disclosure in
private financial institutions also brought on a sense of mistrust. Banks did not have
good internal control systems in place, while their managers had not been made more
accountable.
As such, the component of market discipline can indirectly assist in reinforcing
supervisory efforts in promoting risk management in banks and the financial system,
since it adds pressure for financial institutions to manage themselves in a safe and
sound manner. Effective market discipline requires reliable and timely information
that enables all stakeholders to make effective assessments.
1.2.7 State Banks: Privatization
Current Developments
The economic crisis in Asia in 1997 was the starting point for many
countries in this region to lay down measures to solve financial sector problems.
7
Giving foreign financial institutions an opportunity to invest in this region by, for
example, forming business alliances with domestic financial institutions or buying
financial institutions intervened by the government allows major international
financial institutions to play an essential role in Asia.
During the crisis, seven Thai banks were intervened and taken into state
ownership. In 1998, one bank was closed, and bad assets were transferred to an asset
management company (AMC), due to the large losses. One was fully acquired by a
state-owned bank. One was merged with a bank while another was merged with
another financial institution. The main purpose of intervention is to strengthen
financial institutions by merging them or selling them to the private sector through
open competitive bidding processes to ensure fair competition and transparency.
Consequently, two intervened banks were privatized in 1999 while the resolution of
the other two banks was expected to be completed by the end of 2000. In addition, the
authority gradually decreased gradually its stake in the remaining two banks in the
medium term.
1.2.8 Deposit Guarantee
While a deposit insurance scheme has not been implemented in Thailand, the
Financial Institution Development Fund (FIDF) has provided blanket insurance to
depositors and creditors of the closed banks, finance companies and credit fanciers in
full amount.
For purchasers of state-owned banks, the FIDF guaranteed to compensate
losses from NPL through yield maintenance and gain-/loss-sharing schemes.
1.2.9 Transaction Structure
In most cases, the FIDF is offering two distinct support packages to potential
buyers:
Loss Sharing
Under this structure, the FIDF will enter into a Loss Sharing Agreement
with the bank. The FIDF will thereby agree to reimburse the bank for a specified
percentage of losses on covered NPLs and for the cost of holding covered NPLs on its
balance sheet. Loss sharing will cover only loans above a certain size -those NPLs as
8
of the date of closure with no more than 15% of remaining loans which become NPLs
within six months of the date of closure. The loss-sharing agreement will establish
two loss-sharing percentages, two loss-sharing thresholds and the initial reserve
(representing the proportion of the specified losses to be borne by the FIDF). Under
the loss-sharing agreement, the FIDF will only share the losses above the first
threshold. Bidders must specify the first and second loss-sharing percentages as part
of the bids.
AMC with Loss Sharing
This option is similar to pure loss sharing as described above. The key
difference is that specified NPLs will be transferred to an AMC, which is owned by
the FIDF. There will then be a loss sharing agreement between the Bank and the
AMC.
1.2.10 Domestic Mergers
In a number of countries, mergers take place in order to create synergy, reduce
costs and increase the competitive edge of the merged institutions. In the case of
Thailand, recent mergers were the consequences of problem bank resolution and the
policy to reduce the number of smaller financial institutions. Any five or more finance
companies, finance and securities companies and credit fancier companies can merge
to form a restricted-license bank, which will be further upgraded to a fully fledged
bank at a later stage.
1.2.11 Entry of Foreign Banks
From 1993 the Bank of Thailand authorized the establishment of the Bangkok
International Banking Facilities (BIBFs) which allowed greater diversification of
service providers through new international entrants. In addition, it enabled domestic
banks to diversify their business towards international banking intermediation by
obtaining offshore funds to lend to either the domestic market (out-in) or to the
international market (out-out).
Since BIBFs are not allowed to take domestic deposits, they are subject to
fewer regulations than commercial banks. For instance, BIBFs are not required to
9
observe a minimum capital adequacy ratio. BIBFs also carry a lower corporate tax
rate of 10%, as opposed to 30% in the case of banks. However, current policy does
not allow the new entry of foreign banks through BIBFs or full-licensed branches.
Rather, foreign investors that have sound financial standing and high potential to help
strengthen local financial institutions are allowed to hold more than 49% of the
shares. With the relaxation of the regulation on foreign participation, five local banks
out of a total of 13 banks are now majority-owned by foreign institutions.
Before the 1997 financial crisis, the domestic banks dominated the retail
market through their extensive branch networks and their close relationship with local
customers. Foreign banks, on the other hand, focused their businesses on wholesale
customers. Nevertheless, the role of foreign banks will change significantly now that
they have acquired majority shares in domestic banks. Access to retail customers is
now possible. These foreign-owned banks are offering diversified financial services to
their retail customers.
For the details of bank branches in Thailand, the table below offers details on
the number of commercial bank branches in the country.
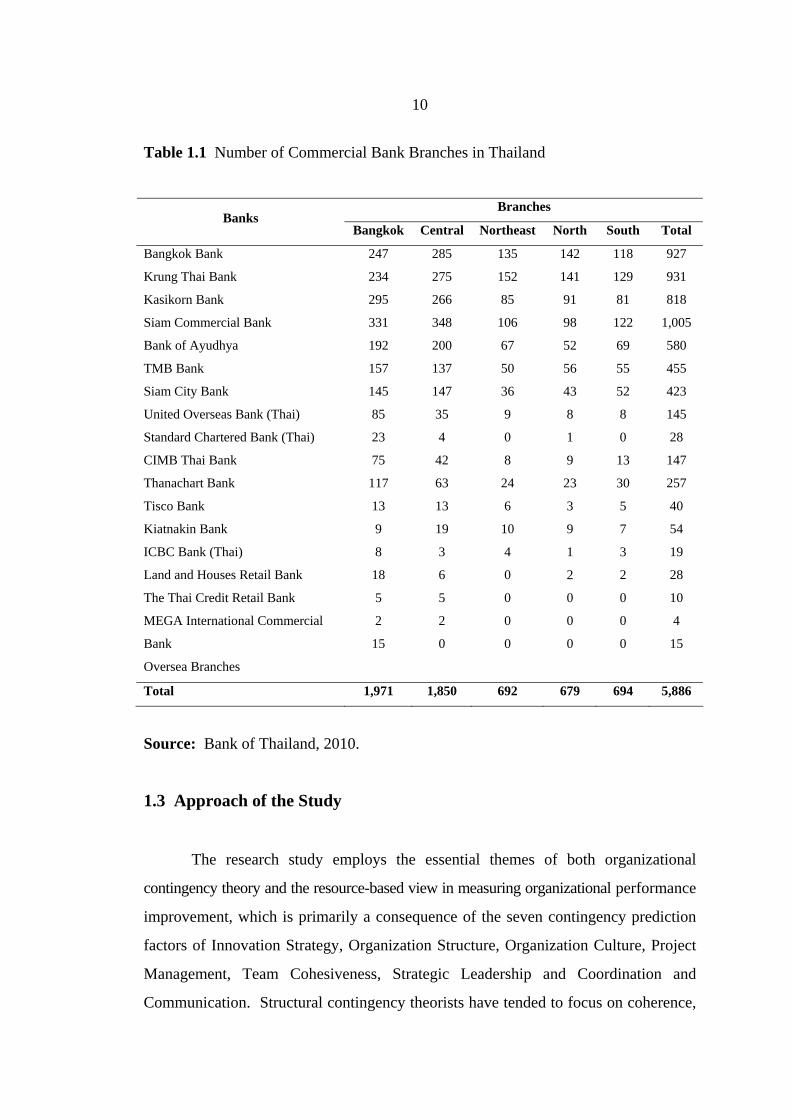
10
Table 1.1 Number of Commercial Bank Branches in Thailand
Branches
Banks Bangkok Central Northeast North South Total
Bangkok Bank
Krung Thai Bank
Kasikorn Bank
Siam Commercial Bank
Bank of Ayudhya
TMB Bank
Siam City Bank
United Overseas Bank (Thai)
Standard Chartered Bank (Thai)
CIMB Thai Bank
Thanachart Bank
Tisco Bank
Kiatnakin Bank
ICBC Bank (Thai)
Land and Houses Retail Bank
The Thai Credit Retail Bank
MEGA International Commercial
Bank
Oversea Branches
247
234
295
331
192
157
145
85
23
75
117
13
9
8
18
5
2
15
285
275
266
348
200
137
147
35
4
42
63
13
19
3
6
5
2
0
135
152
85
106
67
50
36
9
0
8
24
6
10
4
0
0
0
0
142
141
91
98
52
56
43
8
1
9
23
3
9
1
2
0
0
0
118
129
81
122
69
55
52
8
0
13
30
5
7
3
2
0
0
0
927
931
818
1,005
580
455
423
145
28
147
257
40
54
19
28
10
4
15
Total 1,971 1,850 692 679 694 5,886
Source: Bank of Thailand, 2010.
1.3 Approach of the Study
The research study employs the essential themes of both organizational
contingency theory and the resource-based view in measuring organizational performance
improvement, which is primarily a consequence of the seven contingency prediction
factors of Innovation Strategy, Organization Structure, Organization Culture, Project
Management, Team Cohesiveness, Strategic Leadership and Coordination and
Communication. Structural contingency theorists have tended to focus on coherence,
11
consistency and fit harmony as critical factors of organization design, which also
focuses on interaction relationships and is selected according to internally consistent
groupings and which should be consistent with the situation of the organization as
concerns its age and size, industry conditions, and technology. The contingency
approach has also generated value creation in the relationships between innovation
approach and organizational contexts that explain the capability and effectiveness of
innovation with regard to supporting operation management efficiency.
Furthermore, the relationship between Human Resource Management (HRM)
and innovation in recent years has been explored from various angles. One direction
this research has taken assumes that HRM systems in general or HRM systems
comprised of specific practices influence innovation capacity indirectly. For instance,
empirical studies lend support to the contention that HRM influences mechanisms
such as the development and exploitation of intellectual capital (Wright, Dunford and
Snell, 2001: 701-721), knowledge creation and new product development (Collins and
Smith, 2006: 544-560), and organizational learning (Snell, Youndt and Wright, 1996:
61-90) that in turn facilitate innovation.
On the basis of a mixed sample of industrial firms in Spain, Jiminez-Jiminez
and Sanz-Valle (2005) demonstrated a link between performance appraisal systems,
incentive-based compensation, and internal career opportunities with innovation,
speculating that it is the impact of the HRM practices on employee participation that
provides opportunities for innovation. In a similar vein, Shipton et al. (2005) provided
evidence that combining training, appraisal and induction influences different stages
of the organizational learning cycle (i.e. creation, sharing and implementation of
knowledge). Moreover, a study by Shipton et al. (2006) showed that not only do
training, appraisal, and induction impact innovation, but that the influence of these
practices may differ according to the types of innovation activities (i.e. exploitative
vs. explorative). The contention that certain HRM practices impact different aspects
of innovation has been conceptualized by de Leede and Looise (2005) and Jørgensen,
Hyland and Kofoed Lise, 2008: 127-142.
These findings contribute substantially to our understanding of the relationship
between HRM and innovation, but they are also limited by having been conducted
exclusively in manufacturing firms. According to contingency theory models developed
12
by Miles and Snow (1984) and Schuler and Jackson, 1987: 207-220, characteristics of
the organization (e.g. size, external market, industry) are critical factors in determining the
appropriate HRM practices for an innovation strategy; thus, research aimed at
explaining and describing the relationship between HRM in non-manufacturing
environments is clearly warranted.
Secondly, the resource-based view theory (Barney, 1991: 99-120; Wernerfelt,
1984: 171-180) asserts that the internal characteristics and performance of an
organization have idiosyncrasies that are not identical to strategic resources and not
perfectly mobile and therefore heterogeneous. On the other hand, the RBV of
knowledge management for competitive advantage (Halawi, Aronson and McCarthy,
2005: 75-86) defines a strategic asset as one that is rare, valuable, imperfectly
imitable and non-substitutable. Knowledge base is seen as a strategic asset of
innovation with the potential to be a source of competitive advantage for an
organization. This study also uses the contingency perspective toward establishing
boundaries for the RBV by hypothesizing contexts within which the determinants of
the seven contingency prediction factors are assessed as being more or less valuable.
This research also attempts to integrate the RBV model and Organizational
Contingency Model by identifying the determinants of the seven contingency
prediction factors of innovation management effectiveness through the characteristics
of organizations.
1.4 Objectives of the Study
1) To study the determinants of organizational innovation management
effectiveness as organizational improvement.
2) To explain the outputs of the factors of the determinants of organizational
innovation effectiveness (Innovation Strategy, Organization Structure, Organization
Culture, Project Management, Team Cohesiveness, Strategic Leadership and Coordination
and Communication).
3) To test a model of the seven contingency prediction factors of innovation
management effectiveness.
13
1.5 Significance of the Study
1.5.1 The Role between the Determinants and Innovation Management
Effectiveness in Organization
In general, organizations are not successful at attending to the non-technical
aspects of changing technology. It is widely felt that there is little consideration of
these issues, that they are not well understood, that their importance is underestimated
and that action in this area is under-resourced. In particular, not enough attention is
paid to the impact of organizational structures and processes on the implementation
and use of strategic innovation management in the empowerment of individuals in an
organization for higher productivity while enhancing operational efficiency and sustaining
competitive advantage.
This study will again employ the integrated approach of well-know organizational
theories (contingency approach) and the resource-based view to gain further
understanding of the determinants of the contingency prediction factors of innovation
management effectiveness and its context. This integrated approach will offer both a
new perspective into the learning and innovation of management and how it can be
employed in manpower as well as a new way to conceptualize the impact of the
contingency prediction factors of innovation management effectiveness. Furthermore,
the study will provide a conceptual framework that can be used in future studies in
other non-academic environments.
1.5.2 Impact of Innovation Management Effectiveness
Innovation is defined as “the adoption of ideas that are new to the adopting
organization” (Rogers, 1983; Downs and Mohr, 1979: 307-408). It is about profiting
from innovation. Generating good ideas or adopting new ones, in and of itself, is
only a start. To be an innovation management, an idea must be converted into a
product or service that customers want. Coming up with an idea or prototype
invention is one thing. Championing it, shepherding it, and nurturing it into a product
or service that customers want is another. Innovation entails both invention and
commercialization. Innovation management is generally considered to be one of the
key drivers of organizational success (Schillewaert, Ahearne, Frambach and Moenaert,
14
2005: 323-336). There is empirical evidence indicating that implementing innovations
improves organizational performance. For example, a study of manufacturing companies
in Australia and New Zealand showed that implementing total quality management
practices in organizations increased organizational performance (as measured by
percentage growth in sales, Terziovski and Samson, 1999: 226). Yet, how can
organizations be assured that implemented innovations are improving their
performance? Organizations, particularly small to medium-sized enterprises, measure
innovation management effectiveness (using organizational performance as a distal
measure of perceived benefits from innovation). The consequences of innovation
management effectiveness are based on attitudes towards future innovation adoption.
Research in innovation and human resources sets out to develop hypotheses regarding
such measurement and its effects, and test these hypotheses in organizations.
Innovation can be defined as “a technology or practice that an organization is using
for the first time, regardless of whether other organizations have previously used the
technology or practice” (Klein, Conn and Sorra, 2001: 811). In this research,
innovation management effectiveness is defined as the overall organizational outcome
which results from implementing innovations. That is, how an organization perceives
the overall organizational improvement (including factors such as productivity,
finance, and employee morale) which arises specifically from implementing
innovations (Klein, Conn and Sorra, 2001: 811-824).
In short, the future of breakthrough ideas and technology is dependent on
building and sustaining innovative and creative organization structure and culture.
Interdisciplinary task orientation, cross-functional collaboration, teamwork cohesiveness
and convergence of project management are at the core of this organization
effectiveness. Creating cost-effective manufacturing, attractive design, superior
function and value are primary challenges for innovation management. A successful
idea requires many minds in many disciplines. Effective management is a key driver
of this success.
1.5.3 A Holistic Approach to Innovation Strategy
Innovation is recognized as a strategy to achieve competitive businesses and
products. Managing innovation at all levels requires the integration of knowledge and
15
interdisciplinary cooperation. Different understandings and approaches to innovation
between professions often result in communication problems. To overcome this
barrier a common ground is needed which requires a holistic approach to innovation
with a simple tool for facilitating cooperation on a diversity of innovation matters. It
also demonstrates its capacity to support interdisciplinary innovation in diverse
groups. The results are built on a sustained and emergent research process.
Innovation is also recognized as an important strategic means in achieving a
competitive business´ and products in a global market. As requirements and knowledge
increase, innovation becomes a complex matter (Burnett, 1997: 369-377) which needs
the involvement of more professions. Cultural diversities among professions as well
as different interpretations of innovation create an unstable basis for cooperation
resulting in coordination and communication problems (Stokholm, 2005: 54-57), the
losse of valuable information and a waste of time.
1.5.4 The Relationship of Forming Organization Structure and Culture
to Innovation Management Effectiveness
Organizational culture and structure concern the way staff are grouped and the
organizational culture within which they work. There has been considerable work on
the situational and psychological factors supportive of innovation in organizations.
Indeed, it has been widely demonstrated that the perceived work environment
(comprising both structural and cultural elements) does make a difference to the level
of innovation in organizations (Amabile, Conti, Coon, Lanzenby and Herron, 1996:
105-123; Ekvall, 1996: 105-123). Creative and innovative behaviors appear to be
promoted by work environment factors (Mathisen and Einarsen, 2004). Indeed, it is
clear that organizations can create environments in which innovation can be
encouraged or hampered (Dougherty and Cohen, 1995; Tidd et al., 1997). A common
theme is that of the polychromic organization – one with the capacity to be in two
states at once (Becker and Whisler, 1973). Shepard (1967) describes this as a two-state
organization maneuvering between being loose and being tight, while Mitroff (1987)
perceives it as business-as-usual versus business-not-as-usual. More prosaically, this
means organizations need to be able, for example, to provide sufficient freedom to
allow for the exploration of creative possibilities, but sufficient control to manage
innovation in an effective and efficient fashion.
16
1.5.5 The Relationship of Project Management to Innovation Management
Effectiveness
Löh and Katzy (2008) addressed the question of what makes innovation
projects more successful. The project management literature as well as the new
product development literature often takes a rather normative stance towards the best
way of managing innovation projects. Much research (Clark and Wheelwright, 1992;
Cooper 2001; Pahl, Beitz and Feldhusen, 2004; Project Management Institute, 2004;
Ulrich and Eppinger, 2003; Wheelwright and Clark, 1992) has made extensive
recommendations towards organizational setup, planning and execution processes, or
development methods in innovation projects. Heavy-weight project management
organization, detailed planning and work break down combined with a stage gate
process, and the use of some methods like Quality Function Deployment (QFD) seem
to guarantee project success.
Several studies have made efforts to measure project management efficiency,
mostly in the form of comparisons between budget and actual (project costs, project
duration, revenue forecasting). Another measure of project management success is
speed (time management). Innovation speed has been positively correlated with
product quality or the degree to which it satisfies customer requirements; measures
include speed (Hauser and Zettelmeyer, 1997), performance against schedule (Chiesa
and Masella, 1994), and duration of the process (Cebon and Newton, 1999).
To achieve efficiency, it is widely recommended that organizations seeking to
innovate should establish formal operation processes for innovating and make use of
tools and techniques that may facilitate innovative endeavors. The stage-gate process
(Cooper, 1990) is possibly the most familiar of these, but other methodologies for
innovation project management exist, including Phased Development, Product and
Cycle-time Excellence and Total Design (Jenkins, Forbes, Durrani and Banerjee
(1997: 359-378) for a discussion). These methodologies have in common the separation of
the product development process into structured and discrete stages, with each having
milestones in the form of quality control checkpoints at which stop/go decisions are
made with regard to the progress of the project. These highly structured approaches to
the management of the innovation process began to emerge in the 1990s (Veryzer,
1998).
17
1.5.6 The Relationship of Team Cohesiveness to Innovation Management
Effectiveness
Langfred (1998) defined team cohesion as the degree to which team members
identify positively with the team. It can also be defined as the extent to which
members of the team like each other and want to remain members, or to which team
members feel a part of the team as well as the strength of member ties to other
members. Mullen and Copper (1994) reported that it is chiefly the commitment to the
task (as an indicator of cohesion) that shows a significant impact on team innovation.
Keller (1986) found that team cohesiveness was the best predictor of the variables that
significantly correlated with innovation of team.
Team cohesion is a proxy to team functioning and defined as the resultant of
all the focuses acting on the members to remain in the team (Vianen and DeDreu,
2001: 97-120). Team cohesion is considered as being either interpersonal, that is
social cohesion, or task cohesion. Social cohesion concerns an individual’s attraction
to the group because of positive relationships with other members of the team. Group
cohesion usually has effects on group behavior and functioning. Those effects include
reduction of, or even elimination of or, social loafing, drop-out rate and absenteeism,
improvement in communication among group members, greater conformity to group
norms among sports team members, enhanced problem solving, and increased work
output.
A highly innovative team can hardly be achieved without an adequate level of
cohesion. If team members lack a sense of togetherness and belonging and, there is
little desire to keep the team going, then intensive collaboration seems unlikely. An
adequate level of cohesion is necessary to maintain a team, to engage in collaboration,
and thus to build the basis for high innovation effectiveness.
The one specifically group level factor which is commonly mentioned as an
antecedent to innovation is cohesiveness. However, on the basis of current knowledge
of the effects of cohesiveness on group performance, contradictory influences are
evident. On the one hand, it is argued that cohesiveness facilitates innovation because
it increases feelings of self-actualization and psychological safety (Nystrom, 1979).
On the other hand, an important factor in producing high cohesiveness is group
homogeneity which is likely to be an inhibitor of innovation because it leads to
18
unwillingness to question group decisions, and a focus on relationships rather than
tasks in the extreme leading to the 'Group Think' phenomenon (Janis, 1982).
Nystrom (1979) had earlier attempted to resolve the contradiction by stating
the need to alter group characteristics according to the current stage of the innovation
process. Early on loosely joined, heterogeneous groups are required to facilitate the
production of innovative ideas, while later groups should be cohesive and
homogeneous to facilitate implementation. The problem, of course, is how such a
structural transition could be achieved in practice, especially as any given group may
be involved in the introduction of several innovations at the same time, all at different
phases in the process.
1.5.7 Strategic Leadership: A Cross Disciplinary Function and
Collaboration
Managing innovation is about decision making (Mintzberg, 2004) based on
negotiation and uses, among others, the principle of interaction among diversities.
Innovating is different from traditional ways of planning, being a dynamic creative
process on a somewhat unsafe ground. Traditional organizations do not encourage
knowledge sharing and cross-disciplinary function and cooperation. Managing
cooperation on all levels and across functions of innovation requires a firm ground
with the ability of recognizing the value of new, external information, assimilating it
and finally applying it to the commercial end as well as confidence with the principles
of innovation and practical tools.
Many writers have concluded that a democratic-collaborative style encourages
group innovation (Nystrom, 1979). Farris (1973) showed that in research laboratories,
the more innovative groups had more collaboration with their supervisors and with
each other than the less innovative groups. Similarly, West and Wallace (1988) found
that peer leadership discriminated significantly between highly innovative and less
innovative teams in primary health care practices, as reliably rated by independent
experts. The highly innovative teams exhibited a higher degree of leadership support,
goal emphasis, team building and work facilitation.
Although at all levels of analysis, innovation is held to be encouraged by high
levels of discretion (Amabile, 1983; Nicholson and West, 1988), there is evidence
from work on scientific research teams that the highest levels of innovation are
19
elicited by leaders who exert moderate control over the group (Farris, 1973; Pelz and
Andrews, 1976). However, as King and Anderson (1990) point out, a major problem
with such research into leadership is that group factors have been neglected and
research has generally not gone beyond applying individual level concepts directly to
groups. They consider that until more is known about the kind of group environment
that encourages innovation, it is premature to make recommendations about how
leaders may influence groups to be innovative.
Manz et al. (1989) advocate more of a contingency approach, arguing that
multiple leadership approaches seem to be ideal in different innovation contexts and
at various stages of the innovation process. As Anderson and King (1993) argue, a
model of leadership moving from nurturing behaviors at the early stages of group
innovation to stimulate and support ideas, through consensus-seeking behaviors
during the middle stages of the proposal, to delegation and checking behaviors during
and after innovation implementation, is ideal for workgroup innovation. However,
they do caution that additional research is needed to examine in greater detail the
relationship between leadership style and the development of innovations over time.
1.5.8 The Relationship of Coordination and Communication to Innovation
Management Effectiveness
(Mintzberg, 1979) categorizes previous research into three main coordination
strategies: mutual adjustment is based on close collaboration suitable especially in
simple and very complex situations; direct supervision assumes that managers guide
and coordinate the activities of their subordinates, while standardization of processes,
output, or training employs experts that develop rules and policies, but who do not
directly coordinate operative work.
Communication is the vehicle through which personnel from multiple
functional areas share information critical to the successful implementation of a
project (Pinto and Pinto, 1990). The purpose of this research is to study the internal
communication involved in intra-project communication among team members
measured in terms of the reason for communication. The reasons for intra-project
communication among team members were classified into three categories: problem-
solving issues, administrative issues and performance feedback.
20
Pinto and Pinto (1990: 201) established that highly co-operative project teams made significantly more use of informal communication methods (particularly phone calls) than less effective teams. Also, their reasons for communication were more likely to be for brainstorming, obtaining project-related information, reviewing progress and receiving feedback, rather than resolving interpersonal differences.
Kratzer (2004: 63) studied creative performance and communication in 44 innovation teams and gathered data in eleven Dutch companies conducting innovation activities. The subsequent research found that both interaction frequency and subgroup-formation of communication have a negative relationship to team creativity. According to Amason (1996: 125), open communication facilitates creativity and synergistic learning.
Shalley et al. (2004: 951) found that for new product development teams a moderate frequency of communication was most conducive for creativity. This allowed team members to share their ideas and have a constructive dialogue, while a) not becoming distracted by the amount of information exchanged and b) still having the cognitive ability to focus on the value of that information. Furthermore, they found that a low level of communication centralization to be best for team creativity because ideas were not being filtered through just one or two of the members. According to Keller (1986: 720), a high level of communication in a project group in R&D teams may be expected to have high innovation.
Annukka (2008) asserted that internal communication reflects the extent of communication among an organization’s units or groups. It is measured for instance by the number of committees within the organization and the frequency of their meetings (Hage and Aiken, 1967: 631-652), the number of face-to-face contacts (Aiken, Bacharach et al. 1980) and the degree to which different units make common decisions (Damanpour, 1991). External communication refers to an organization’s ability to communicate and interact with its external environment. This is measured by the involvement of the organization’s members in extra-organizational professional events (Damanpour, 1991). Both internal and external communications are regarded as being positively interconnected organizational innovativeness (Huff and Munro, 1985; Nilakanta and Scamell, 1990; Damanpour, 1991; Prescott and Conger, 1995; Rogers, 1995).
21
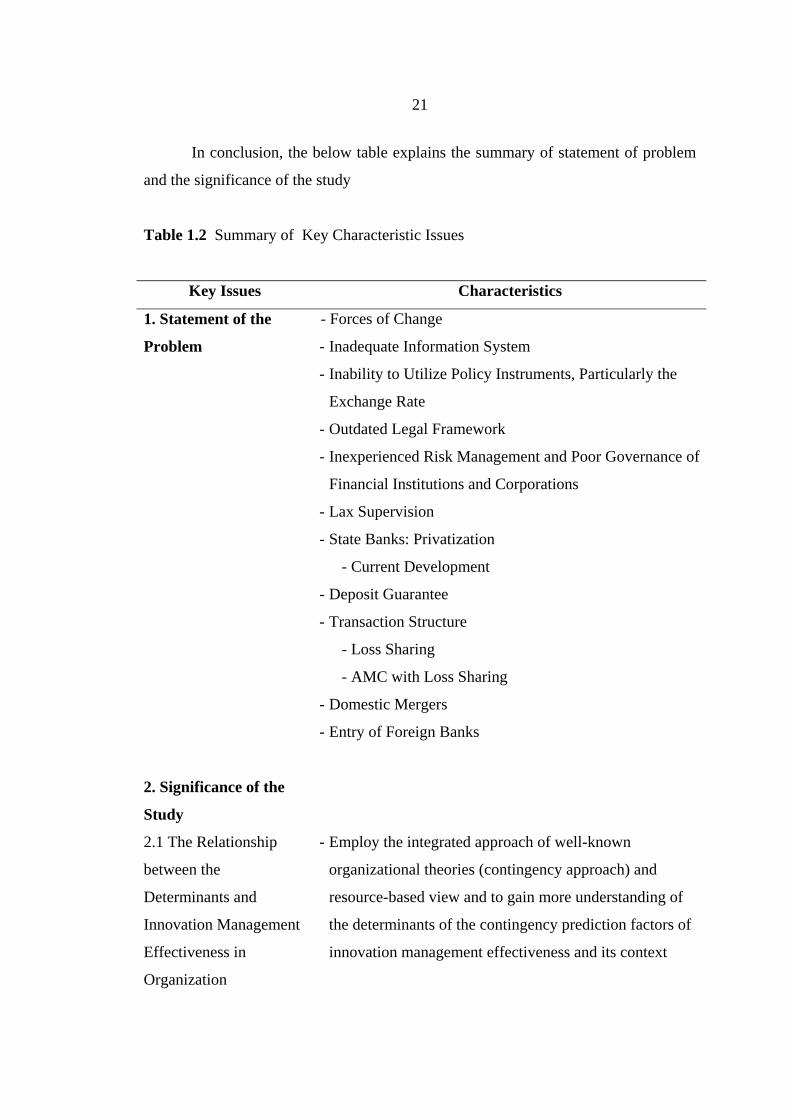
In conclusion, the below table explains the summary of statement of problem
and the significance of the study
Table 1.2 Summary of Key Characteristic Issues
Key Issues Characteristics
1. Statement of the
Problem
- Forces of Change
- Inadequate Information System
- Inability to Utilize Policy Instruments, Particularly the
Exchange Rate
- Outdated Legal Framework
- Inexperienced Risk Management and Poor Governance of
Financial Institutions and Corporations
- Lax Supervision
- State Banks: Privatization
- Current Development
- Deposit Guarantee
- Transaction Structure
- Loss Sharing
- AMC with Loss Sharing
- Domestic Mergers
- Entry of Foreign Banks
2. Significance of the
Study
2.1 The Relationship
between the
Determinants and
Innovation Management
Effectiveness in
Organization
- Employ the integrated approach of well-known
organizational theories (contingency approach) and
resource-based view and to gain more understanding of
the determinants of the contingency prediction factors of
innovation management effectiveness and its context
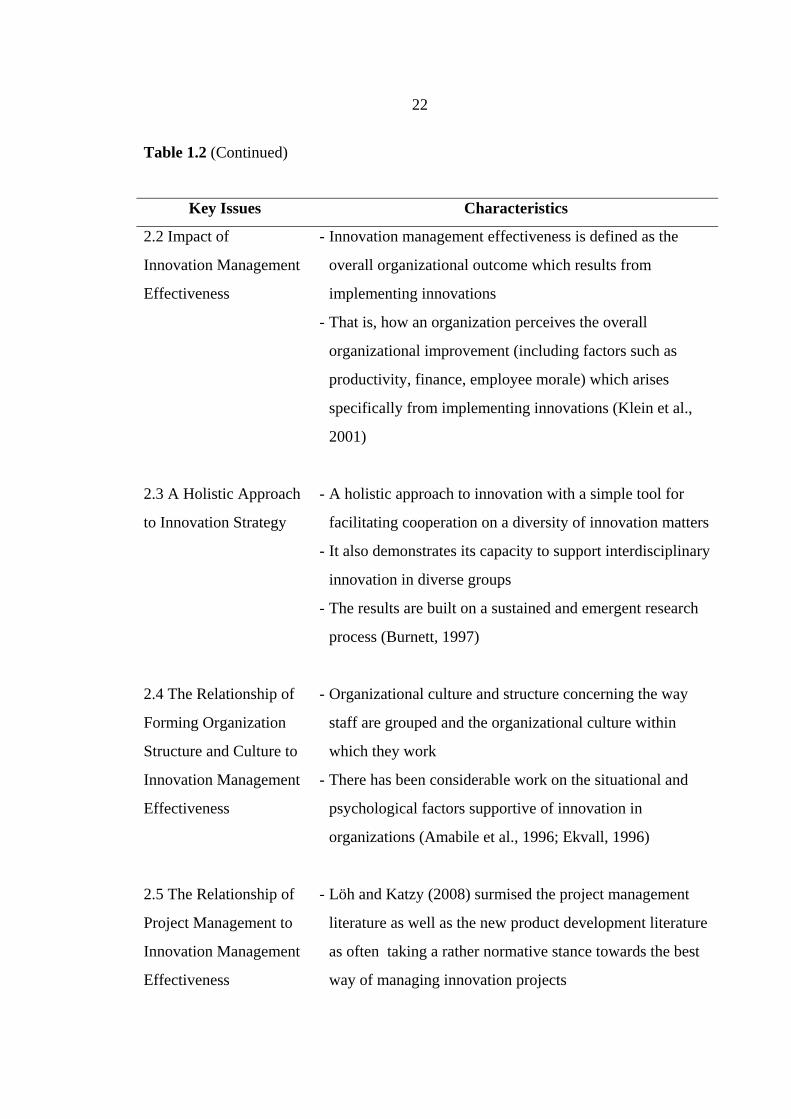
22
Table 1.2 (Continued)
Key Issues Characteristics
2.2 Impact of
Innovation Management
Effectiveness
2.3 A Holistic Approach
to Innovation Strategy
2.4 The Relationship of
Forming Organization
Structure and Culture to
Innovation Management
Effectiveness
2.5 The Relationship of
Project Management to
Innovation Management
Effectiveness
- Innovation management effectiveness is defined as the
overall organizational outcome which results from
implementing innovations
- That is, how an organization perceives the overall
organizational improvement (including factors such as
productivity, finance, employee morale) which arises
specifically from implementing innovations (Klein et al.,
2001)
- A holistic approach to innovation with a simple tool for
facilitating cooperation on a diversity of innovation matters
- It also demonstrates its capacity to support interdisciplinary
innovation in diverse groups
- The results are built on a sustained and emergent research
process (Burnett, 1997)
- Organizational culture and structure concerning the way
staff are grouped and the organizational culture within
which they work
- There has been considerable work on the situational and
psychological factors supportive of innovation in
organizations (Amabile et al., 1996; Ekvall, 1996)
- Löh and Katzy (2008) surmised the project management
literature as well as the new product development literature
as often taking a rather normative stance towards the best
way of managing innovation projects
23
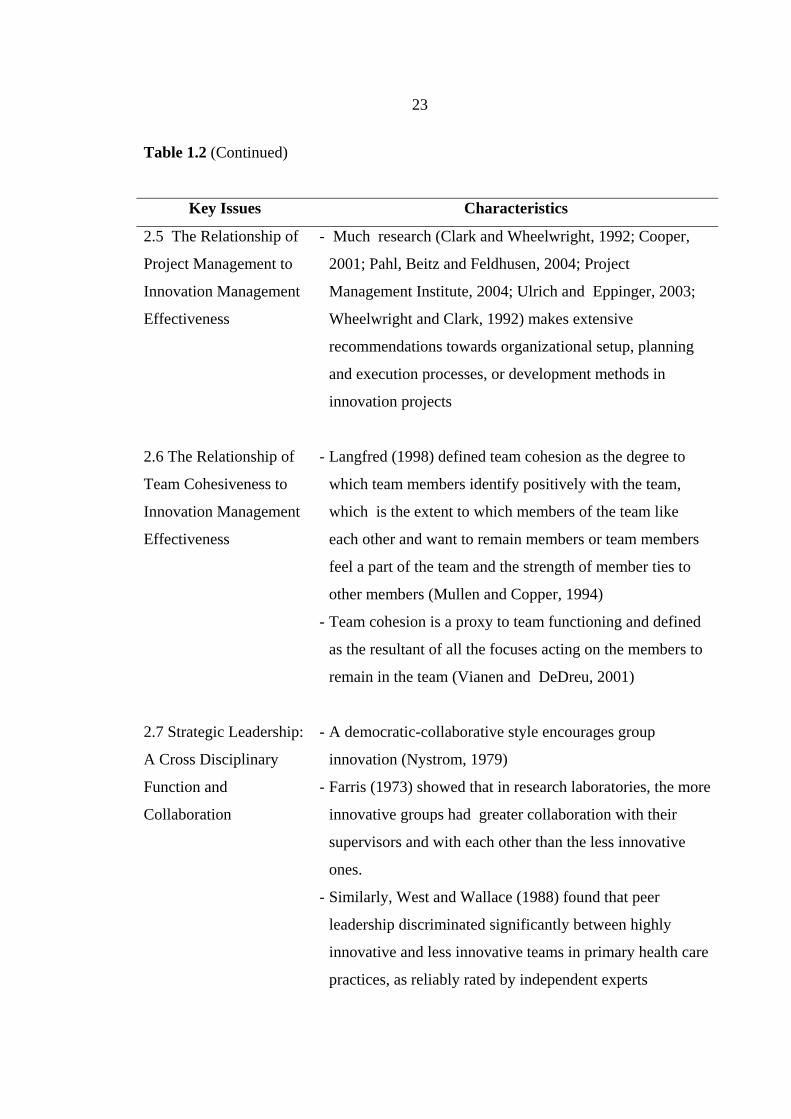
Table 1.2 (Continued)
Key Issues Characteristics
2.5 The Relationship of
Project Management to
Innovation Management
Effectiveness
2.6 The Relationship of
Team Cohesiveness to
Innovation Management
Effectiveness
2.7 Strategic Leadership:
A Cross Disciplinary
Function and
Collaboration
- Much research (Clark and Wheelwright, 1992; Cooper,
2001; Pahl, Beitz and Feldhusen, 2004; Project
Management Institute, 2004; Ulrich and Eppinger, 2003;
Wheelwright and Clark, 1992) makes extensive
recommendations towards organizational setup, planning
and execution processes, or development methods in
innovation projects
- Langfred (1998) defined team cohesion as the degree to
which team members identify positively with the team,
which is the extent to which members of the team like
each other and want to remain members or team members
feel a part of the team and the strength of member ties to
other members (Mullen and Copper, 1994)
- Team cohesion is a proxy to team functioning and defined
as the resultant of all the focuses acting on the members to
remain in the team (Vianen and DeDreu, 2001)
- A democratic-collaborative style encourages group
innovation (Nystrom, 1979)
- Farris (1973) showed that in research laboratories, the more
innovative groups had greater collaboration with their
supervisors and with each other than the less innovative
ones.
- Similarly, West and Wallace (1988) found that peer
leadership discriminated significantly between highly
innovative and less innovative teams in primary health care
practices, as reliably rated by independent experts
24
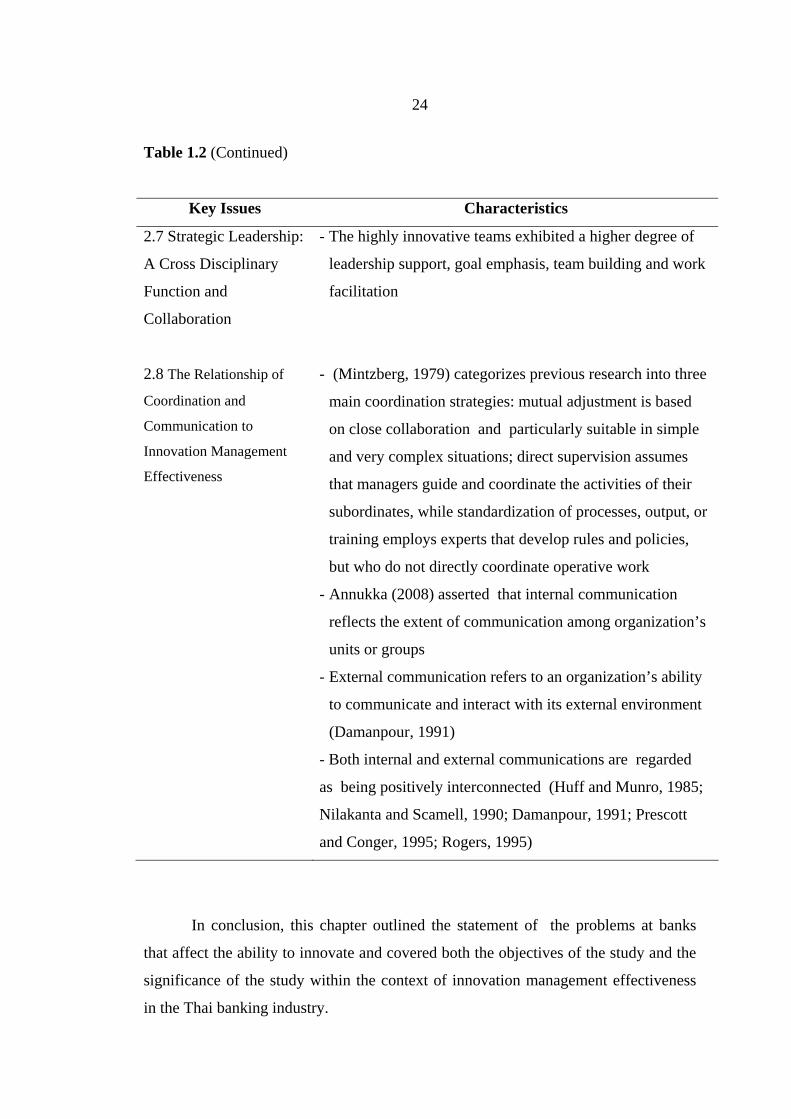
Table 1.2 (Continued)
Key Issues Characteristics
2.7 Strategic Leadership:
A Cross Disciplinary
Function and
Collaboration
2.8 The Relationship of
Coordination and
Communication to
Innovation Management
Effectiveness
- The highly innovative teams exhibited a higher degree of
leadership support, goal emphasis, team building and work
facilitation
- (Mintzberg, 1979) categorizes previous research into three
main coordination strategies: mutual adjustment is based
on close collaboration and particularly suitable in simple
and very complex situations; direct supervision assumes
that managers guide and coordinate the activities of their
subordinates, while standardization of processes, output, or
training employs experts that develop rules and policies,
but who do not directly coordinate operative work
- Annukka (2008) asserted that internal communication
reflects the extent of communication among organization’s
units or groups
- External communication refers to an organization’s ability
to communicate and interact with its external environment
(Damanpour, 1991)
- Both internal and external communications are regarded
as being positively interconnected (Huff and Munro, 1985;
Nilakanta and Scamell, 1990; Damanpour, 1991; Prescott
and Conger, 1995; Rogers, 1995)
In conclusion, this chapter outlined the statement of the problems at banks
that affect the ability to innovate and covered both the objectives of the study and the
significance of the study within the context of innovation management effectiveness
in the Thai banking industry.
CHAPTER 2
LITERATURE REVIEW
This chapter provides the research findings about innovation management
effectiveness and also the determinants of the seven contingency prediction factors, of
innovation strategy, organization structure, organization culture, project management,
team cohesiveness, strategic leadership and coordination and communication, which
form the constructs for the conceptual framework
2.1 Innovation Management Effectiveness
2.1.1 The Interdisciplinary Nature of Innovation Management
2.1.1.1 What is Innovation Management?
Innovation management (Nermien Al-Ali, 2003: 1-288) emerged as a
discipline in the 1890s with Edison’s innovation factory. Edison changed the image of
the sole inventor by converting innovation into a process with recognized steps
practiced by a team of inventors working together – laying the foundations for the
basic design of the R&D department. These steps are streamlined to a major extent in
all industries and include idea generation, concept development, feasibility studies,
product development, market testing and launch. Innovation management thus
corresponds to the development of new products, processes and services. In cases
where the organization does not make or offer products (goods or services),
innovation lies in improving the way jobs are done to meet the organization’s mission
(i.e. process innovation).
2.1.1.2 Why Innovation Management?
The high demand for innovation in the knowledge economy – brought
about by shorter technology and product life cycles as well as the sophistication of
customers – increased the organizational demand for new ideas. This has meant two
things: first, innovation has to be pushed to the frontline where the knowledge of the
26
customer is and where the number of ideas generated is greater; second, top
management has had to adopt appropriate innovation strategies to lead the surge of
the innovative activity. As a result, innovation needed to be systemized as a business
process into the way that the organization does business – and hence the need for
innovation management. Only organizations that liberate the innovative spirit of their
employees, tap into the knowledge of their customers and partners, and manage
innovation projects as a portfolio are able to reduce time to market with successful
products. Examples of such companies are HP, 3M and Procter and Gamble (Nermien
Al-Ali, 2003: 1-288).
2.1.1.3 Main Goals of Innovation Management Effectiveness
Effective innovation management requires the implementation of a
number of processes and the employ of a number of tools. At the outset it is important
that the culture of the organization empowers employees and encourages them to
submit their ideas. Most importantly management should adopt an appropriate
innovation strategy to lead the innovation process and manage the innovation
portfolio. The following summarizes the various actions that management should aim
for under the innovation management stage (Nermien Al-Ali, 2003: 1-288)
1) Effect a shift in the way the organization sees itself where
innovation is recognized as the way of doing business.
2) Decide upon an innovation strategy that best fits the
organization’s situation, and enable it attain its vision.
3) Create a portfolio of innovation projects to translate
competitive strategies and to manage risk across the whole organization.
4) Define a criteria for the selection and prioritization of
projects within the portfolio to weed out less probable projects as soon as possible.
5) Effect the necessary structural changes to arrange skills
throughout the organization in competence centers, to enable the formation of the
right team for the purposes of the innovation project.
6) Arrange current and potential future alliances in a portfolio
that can be tapped when needed, and define when and how such alliances are to be
made (governing conditions).
27
7) Foster an organizational culture that promotes innovation by
allowing employees time to innovate and the implementation of their own ideas for
improving job performance.
8) Develop and implement methods that enable tapping into the
organization’s intellectual capital.
In addition, there are several factors that can explain innovation
management effectiveness.
Number of Innovations
In terms of the banking industry (Lane, 2009: 1-38), the number of innovations
is the number of activities (frequency) that banks undertake in order to improve their
way of business, such as innovations concerning ATMs, credit cards, grants, loans,
payment services, cross-sales between credit and non credit, etc. within a period of
time.
We focused on innovation activity, since technological progress depends
on purposeful effort to develop new technologies or , especially in developing
countries, to move closer to the frontier by adopting existing technologies develop
elsewhere. Even in the latter case, the adoption of existing technologies is costly,
requiring local R&D activity. In addition, the attainment of technological progress
typically involves resource reallocation across firms, with higher-productivity firms
expanding and laggards driven out of business. For this reason, economic environments
that facilitate such firm-level dynamism may be more conducive to higher rates of
effective innovation activity.
Speed of Innovation
Companies increasingly need to make the stark choice of accepting a
rapid decrease in market share or of becoming better informed so that they can
respond to customers’ increasing appetites for new and better solutions (Knowledge
Partners, 2008).
As a result of increased global competition, products and markets that
remain without change are very rapidly becoming commoditized. It is the intense
competition that drives commoditization and downward pressure on the profit
margins.
In many companies the only way to make a healthy profit margin is to
continually innovate and bring customers new experiences and benefits. For this they
28
can enjoy an “early mover” premium. As business cycles continue to speed up and
therefore the life-cycles of products get shorter, organizations have to be more agile
and able to continuously innovate to respond to new changes in customers’ needs and
perceptions.
Return on Investment of Innovation
A performance measure used to evaluate the effectiveness of a
company's investment in new products or services. The return on innovation
investment is calculated by comparing the profits of new product or service sales to
the research, development and other direct expenditures generated in creating these
new products or services (Investopedia, 2010).
Innovation Value-Added Chain
Afuah (1998) claimed that the innovation value-added chain model can
explain both why an incumbent can outperform new entrants at radical innovation,
and why it may also fail at incremental innovation (Porter, 1985). It differs from
previous models in that while these other models focus on the impact of innovation on
a firm’s capabilities and competitiveness, it focuses on what the innovation does to the
competiveness and capabilities of a firm’s suppliers, customers, and complementary
innovators.
The innovation may have a different impact at each of the stages of the
innovation value-added chain, suggesting that an innovation that is incremental to the
manufacturer may not be to suppliers, customers, or complementary innovators. Thus
incumbents for whom an innovation is competence destroying may still do well if the
innovation is competence enhancing to their value chain, and relations with the chain
are important and difficult to establish. The implications are that a firm’s success in
exploiting an innovation may depend as much on what the innovation does to the
capabilities of the firm as on what it does to the capabilities of its innovation value-
added chain of suppliers, customers and complementary innovators.
2.1.1.4 Organizational Performance Improvement
Innovation effectiveness is defined as organizational performance
improvement which results from implementing innovations. That is, how an
organization perceives the overall organizational improvement (including factors such
as productivity, finance, and employee morale) which arises specifically from
implementing innovations (Klein et al., 2001).
29
2.1.2 Organizational Innovation
If defined broadly, innovation (Baker, 2002) can be seen as the business of
science organizations. However, like most of the organizational literature, the
innovation literature has largely focused on innovation in private sector business
organizations. This literature may, nonetheless, have insights that can be used by
science organizations, both private and public.
Science organizations need to innovate - they have not necessarily taken the
lead in systematically studying how organizational and environmental factors can best
promote innovation. Also science organizations in both the private and public sector
are under greater pressure not only to generate innovative science but also to function
as a business. For example, there is greater emphasis on commercializing scientific
discoveries, having a solid and well-designed portfolio of science programs and
projects that help the organization adapt to external changes in funding priorities, and
demonstrating results and favorable cost/benefit ratios.
This innovation literature may provide insights into balancing innovation with
business realities. While the literature on innovation in private sector organizations
may be a source of useful insights, it may also be the case that studying science
organizations could provide critical insights into how to promote and sustain
innovation in private sector business organizations. Public science organizations
should consider playing a lead role in promoting strategies for encouraging and
sustaining innovation and developing a true innovation competency.
30
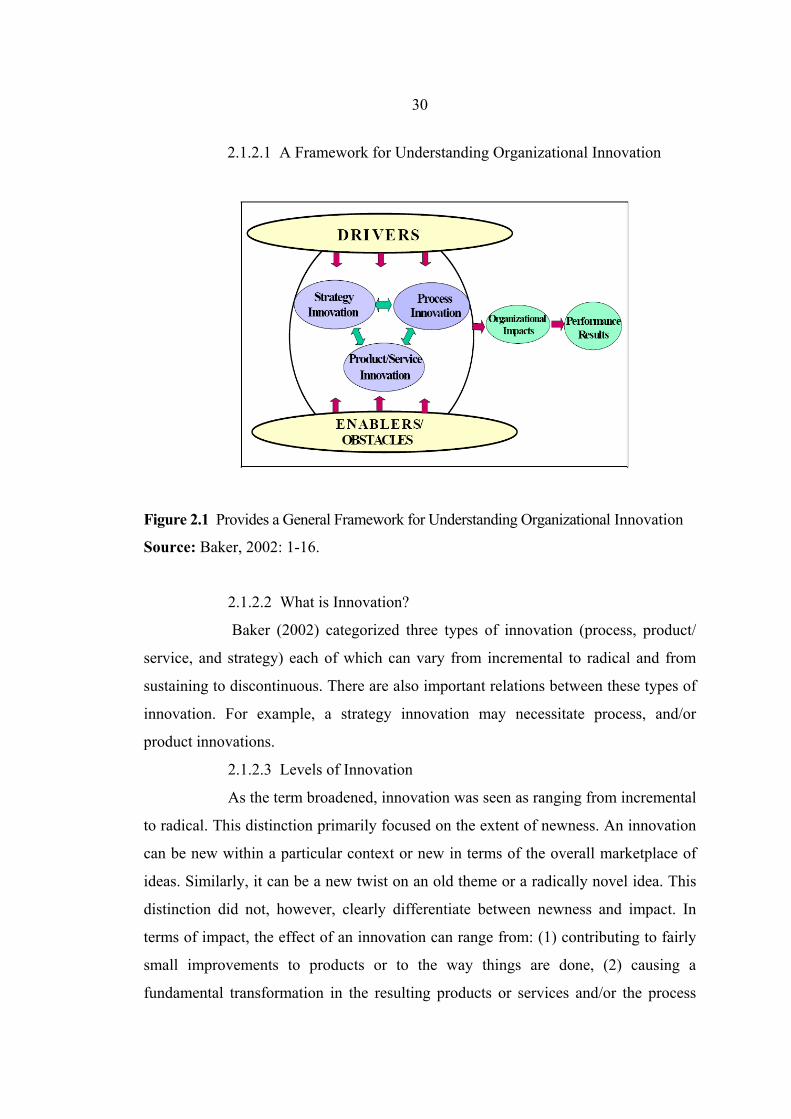
2.1.2.1 A Framework for Understanding Organizational Innovation
Figure 2.1 Provides a General Framework for Understanding Organizational Innovation
Source: Baker, 2002: 1-16.
2.1.2.2 What is Innovation?
Baker (2002) categorized three types of innovation (process, product/
service, and strategy) each of which can vary from incremental to radical and from
sustaining to discontinuous. There are also important relations between these types of
innovation. For example, a strategy innovation may necessitate process, and/or
product innovations.
2.1.2.3 Levels of Innovation
As the term broadened, innovation was seen as ranging from incremental
to radical. This distinction primarily focused on the extent of newness. An innovation
can be new within a particular context or new in terms of the overall marketplace of
ideas. Similarly, it can be a new twist on an old theme or a radically novel idea. This
distinction did not, however, clearly differentiate between newness and impact. In
terms of impact, the effect of an innovation can range from: (1) contributing to fairly
small improvements to products or to the way things are done, (2) causing a
fundamental transformation in the resulting products or services and/or the process
31
technology of an entire industry, or (3) transforming the market place and/or the
economy as a whole.
Christensen (1997) advanced the concept of innovation by disentangling
the attributes of newness and impact. Because radically new innovations do not
always have a significant impact, he differentiates between sustaining versus
discontinuous innovations. Sustaining innovations improve the performance of
established products or services. Discontinuous innovations bring to market very
different products or services that typically undermine established products and
services in the particular market sector. An example of a discontinuous innovation is
steel minimills (while the product was not significantly changed, a change in the
production process led to a drastic change in prices, firms, and markets). A
discontinuous innovation does not always have greater utility; it may, in fact, result in
a product that under-performs established products. The reason for this is that the
momentum of on-going sustaining innovations can push product and service
functionality beyond what many customers may actually require (in other words, the
established products and services eventually overshoot a large segment of their
market).
Christensen advises companies in all industries to be continually attuned
to a potentially discontinuous innovation that could cause their demise if they do not
quickly adapt and adjust to the fundamentally changing situation.
2.1.2.4 Types of Innovation
There are three main types of innovation (process, product/service, and
strategy), each of which can vary in the degree of newness (incremental to radical)
and impact (sustaining versus discontinuous).
2.1.2.5 Process Innovation
Process innovation became an important topic with the rise of quality
and continuous improvement movements and, then again, with the more recent
attention directed at change management, organizational learning and knowledge
management. Corporations today, at least in the developed world, are reaching the
limits of incremental process improvement. Some have argued that what is needed
today is radical process innovation. Hammer and Champy (1994) introduced the
concept of radical reengineering based on their assertion that for companies to achieve
32
maximum efficiency and effectiveness requires radical process reengineering of the
organization and its processes. Because processes lag far behind what is possible
given technological advancement, it is not possible to achieve the necessary
transformation through incrementalism.
2.1.2.6 Product / Service Innovation
Incremental product/service innovation is oriented toward improving the
features and functionality of existing products and services. Radical product/service
innovation is oriented toward creating wholly new products and/or services. Product
life cycles, in particular, have become shorter and shorter, causing business survival
to depend on new product development and, increasingly, on the speed of innovation
in order to develop and bring new products to market faster than the competition
(Jonach and Sommerlatte, 1999). Organizations must direct greater attention to new
product development, while maintaining and improving their existing products.
Discontinuous products and services are increasingly likely with ever-faster new
product/service development. Organizations must be constantly on the lookout for
discontinuous new products and/or services.
Although product/service innovation and process innovation are not the
same thing, they are often interconnected. For example, process innovation may be
required to support product or service.
2.1.2.7 Drivers of Innovation
The primary drivers of innovation include:
1) Financial pressures to decrease costs, increase efficiency, do
more with less
2) Increased competition
3) Shorter product life cycles
4) Value migration
5) Stricter regulations
6) Industry and community needs for sustainable development
7) Increased demand for accountability
8) Community and social expectations and pressures (giving
back to the community, doing good, etc.)
9) Demographic, social, and market changes
33
10) Rising customer expectations regarding service and quality
11) Greater availability of potentially useful new technologies
coupled with the need to keep up or exceed the competition in applying these new
technologies
12) The changing economy.
2.1.2.8 Innovation Capacity
However, Baker (2002) also explained two levels of innovation capacity.
The Individual Level: Factors to look for at the individual level include:
employee empowerment and engagement, trust, training, job rotation, and the extent
and range of individual networks.
The Organizational Level: Organizations must have effective, efficient,
and speedy systems and processes for the following:
1) Environmental scanning, identifying discontinuities, surveying
customer needs, encouraging new ideas to be advanced by staff members, and
innovation activist and other forms of training.
2) Other means of promoting knowledge absorption and
sharing, such as the ability to communicate across organizational boundaries, communities
of practice, enterprise level knowledge systems, and problem identification and
problem solving processes.
3) Deconstructing the dominant mental models regarding
business mission, market scope, relevant products and services, target customers and
questioning existing biases regarding the kinds of profit boosters that can be
exploited, the core competencies that are most important, pricing strategies, bundling
options, and partnering opportunities.
4) Sustained, innovative strategizing and strategy implementation.
5) On-going classification, screening, and prioritization of new
ideas.
6) Managing the innovation stream—the number of ideas being
pursued at a given time and their developmental stages.
7) Effective innovation project management.
8) Effective innovation utilization, transfer, diffusion—the
culmination of innovation is to transfer the innovation to those who will exploit it
34
through successful commercialization and, as needed, promoting its adoption into
organizational practice and/or individual life styles.
9) Effective change management.
10) Promoting a broad definition of business boundaries, fluid
organizational boundaries, and a wide and open market for ideas/talent.
11) Motivating, rewarding, and recognizing innovation.
Hamel (2000) suggests that an innovation competency requires both an
internal and external organizational perspective. To develop an innovation competency,
the organization must:
1) Have a fluid notion of organizational boundaries and an open
market for talent. It is not necessary to create all innovations internally. Partnerships
can be a useful strategy to promote innovation. Also, in addition to development,
acquisition can be an effective innovation strategy.
2) Transform organizational strategy. Typical strategic planning is
often antithetical to promoting radically innovative business models and strategies.
Innovation cannot be held to a scheduled strategic planning timeline; it should be on-
going. Also, strategy should not be restricted to the same set of top level decision-
makers. Innovative strategy does not necessarily come from the top but too often not a
word about contributing strategically appears in the performance criteria for anyone
below the level of senior executive.
3) Create an open market for capital investment and rewards.
Strategic thinking must not only be encouraged but also sponsored and rewarded.
When innovative ideas do not succeed, staff members and sponsors should not be
sanctioned in any way. On the other hand, it is very important to allow staff to share
in the rewards when an idea does pay-off.
4) Manage the risk. Strategy should not be monolithic; it should
be sufficiently varied to allow for organizational agility and flexibility. Although most
new ventures will fail, important learning can be acquired from each. Project risk
must be distinguished from portfolio risk—the risk of any new project will be high
but if there are enough innovation projects, the portfolio risk will be manageable.
5) Create a culture and a structure that promotes innovation.
Having an elastic business definition helps to ward against protectionist instincts.
35
Open up innovation opportunities to all staff and engage customers, suppliers,
competitors, and complementary organizations to develop new approaches to generating
new wealth.
2.2 Innovation Strategy
There is not a lot of literature dedicated completely to innovation strategies.
The majority of research is related to organizational factors that promote (or inhibit)
innovation, new product development or research and development (Mphahlele,
2006). Examples are articles by Martins and Terblanche (2003), Vlok (2005) and
Dewar and Dutton (1986). For those that discuss innovation strategies, very few have
attempted to define the term.
2.2.1 Definition
Grant and King (1984), as referenced by Ramanujam and Mensch (1985),
define a strategy as a timed sequence of internally consistent and conditional resource
allocation decisions that are designed to fulfill an organization’s objectives.
Ramanujam and Mensch (1985) use this definition to describe an innovation
strategy in terms of innovation goals, innovation resource allocation, innovation risk
(overall philosophy), timing (first to market or happy to wait) and a long term
perspective. Formulating an innovation strategy, therefore, is a matter of policy for
those organizations that would like to pursue a sustainable competitive advantage
through innovation.
Activities must be consistent with an overarching organizational strategy that
implies that management must take conscious decisions regarding innovation goals
(Sundbo, 1997: 432-455). Innovation strategy is generally understood to describe an
organization’s innovation posture with regard to its competitive environment in terms
of its new product and market development plans (Dyer and Song, 1998: 505-519).
This techno-centric view predominates in the literature and overlooks those
innovative initiatives that are internally focused (for example, the adoption of new
management techniques and practices).
36
In the conceptualization of innovation strategy as an articulation of the
organization’s commitment to the development of products that are new to itself
and/or to its markets, and because strategy does not operate in a vacuum, but requires
a structural context, two complementary approaches to its measurement, which have
been described as objective and subjective (Li and Atuahene-Gima, 2001: 1123-1134),
can be identified.
In the literature, scholars principally have adapted measures from strategic
management research to explore the existence, nature and extent of innovation
strategy. Richard, McMellan, Chadwick and Dwyer, 2003: 107-126. use three scale
items drawn from the strategic posture scale devised by Covin and Slevin (1989),
who, in turn, draw on Miles and Snow’s (1978) ‘prospectors’ and Mintzberg’s (1978)
‘entrepreneurial’ organizations, for their assessment of bank innovativeness. These
studies classify organizations based on their approach to innovation using classifications
that are ontologically grounded in the assumption that innovation orientation can be
deciphered from quantitative interpretations of new product and market activity.
Other objective evidence of an organization’s innovation strategic posture may
include many of the input measures (such as level of R&D expenditure) that we have
already discussed. It is argued that it is not their absolute magnitude but their
magnitude relative to industry rivals that is significant. As has been noted, although
these may be useful indicators of commitment or intent, they could mask process
inefficiencies. However, O’Brien’s (2003) observation that an interaction between
intended strategy and slack will influence performance suggests that process
inefficiencies are less likely to occur where an innovation strategy is not merely
nominally adopted, but is embedded in the culture, behaviors and actions of the
organization.
In Li and Atuahene-Gima’s (2001) terms, the evidence for an embedded
innovation strategy is subjective and may include evaluations of an organization’s
emphasis on New Product Development (NPD), such as resource allocation. Saleh
and Wang (1993) describe this as consisting of three main components: risk-taking,
pro-activeness and persistent commitment to innovation. These include top management
responsibility for innovation within the organization, including specifying and
communicating a direction for innovation. Cooper (1984) demonstrated that new
37
product performance is largely decided by the strategy that top management adopts.
The key components are the link between innovation strategy and overall business
goals (strategic orientation) and the provision of leadership to make innovation
happen via a strong vision (Pinto and Prescott, 1988) for innovation, a long-term
commitment to innovation and a clear allocation of resources (Cooper, Edgett and
Kleinschmidt, 2004: 50-59). This distinction between strategic planning or orientation
and strategic vision or leadership is frequently replicated in the literature.
Two distinct types of strategic orientation measures can be identified in the
literature. First, those that measure whether the organization has an innovation
strategy; this can be evaluated in several ways, such as commitment to differentiated
funding (White, 2002), explicit expression (does the organization have an innovation
strategy?) (Miller and Friesen, 1982) and identifiable roles for new products and
services (Cooper and Kleinschmidt, 1990; Geisler, 1995; Hauser and Zettelmeyer,
1997; Tipping and Zeffren, 1995). The second type of measure regards strategy as a
dynamic instrument that shapes and guides innovation in the organization. These
measures assume that strategy exists and asks questions about how effective it is in
shaping and guiding: ‘are structures and systems aligned?’ (Bessant, 2003), ‘do
innovation goals match strategic objectives?’ (Tipping and Zeffren, 1995) and further
similar measures of strategic fit (Bessant, 2003).
From a strategic leadership perspective, Dougherty and Cohen (1995) found
the behavior of senior managers to be influential. Those chief executives most likely
to make innovation happen are those with a clear vision of the future operation and
direction of organizational change and creativity (Shin and McClomb, 1998). Senior
management are responsible for developing and communicating a vision for
innovation, being supportive and adopting an attitude tolerant to change and championing
the notion of innovation within the organization. Managerial tolerance to change
creates the right climate for the implementation stage of innovation, where conflict
resolution might be necessary (Damanpour, 1991).
Managerial attitude is also reflected in norms or support for innovation. These
are the expectation, approval and practical support of attempts to introduce new and
improved ways of doing things in the work environment. Measures are mostly
qualitative in nature and explore perceptions, mostly about the extent to which
respondents recognize factors to be present (or absent).
38
Relatively few measures of championing and leadership have been uncovered
in this review other than those that simply ask the question whether or not one or the
other exists, perhaps through evidence of signs of commitment in annual reports
(Chiesa, Coughlan and Voss, 1996: 105-136) or levels of concern of top management
(Coughlan et al., 1994) or whether or not an individual has been physically assigned
to a particular role (Souitaris, 2002). Shane et al. (1995) provide a series of reflective
questions designed to allow organizations to determine for themselves their expectations
and understanding of the role of champion. For example, ‘to what extent should the
organization make it possible for the people working on an innovation to bend the
rules of the organization to develop the innovation, or be allowed to bypass certain
personnel procedures to get people committed to an innovation?’
It must be emphasized that the dominant perspective on strategy in the
literature is one that examines the relationship between strategy and performance.
However, a small number of studies have examined the nature of the transitions of
these states as organizations adopt and embed an innovation strategy. This sub-section
of the literature is underpinned by the assumption that firms that follow innovation
strategies differ from other firms in several respects. It is apparent that more
innovative firms adopt different operational strategies to accommodate flexibility and
quality capabilities (Alegre-Vidal, Lapiedra-Alcami and Chiva-Gomez, 2004: 829-
839), have different capital management practices to facilitate slack resources
(O’Brien, 2003), are more tolerant of internal conflict in support of creativity (Dyer
and Song, 1998), and maintain organizational structures that are in the ‘intermediate
zone between order and disorder’ (Brown and Eisenhardt, 1997: 22). What is clear
from this literature is that any transition towards an innovation strategy will
necessarily take several years because of the resources and energy necessary before
such a transformation can even be triggered (Hailey, 2001).
2.2.2 Key Considerations
One of the articles that looks directly at innovation strategy formulation is by
Kuratko, Ireland and Hornsby (2001), in which the authors describe in detail a
company’s financial success that was put in place. Kuratko et al., (2001) found that
39
for an innovation strategy to serve its purpose of improving the level of innovation in
an organization, it should include a vision, organizational design (e.g. creating venture
teams), management systems (authority, control) as well as a compensation system.
Ireland, Kuratko and Covin (2003) went on to refine this finding into three key
elements of an innovation strategy: entrepreneurial strategic vision, pro-entrepreneurship
organizational architecture and the entrepreneurial strategic vision necessary to create
an awareness of the general direction that the entrepreneurial activities should take.
The importance of innovation goals as a component of an innovation strategy
is echoed by a few more authors – Deschamp (2005), Foster and Pryor (1986) and
Anthony et al.(2006) amongst others. Without clear goals, it will be difficult for any
organization to give meaningful direction to its employees.
Developing the overall vision should logically come before the identification
of goals and objectives because the vision tends to be more long term and more
compelling.
2.3 Organizational Structure
2.3.1 Organizational Structure
Burns and Stalker (1961) described a contingency approach to innovation
management, later developed to include concepts of functional differentiation,
specialization and integration (Lawrence and Lorsch, 1967), which suggests that
environmental change prompts a realignment of the fit between strategy and structure.
That is, to perform effectively, an organization must be appropriately differentiated,
specialized and integrated. Pugh et al. (1969) argued that the structure of an
organization is strongly related to the context within which it functions. Our closing
discussion in the previous section, that the characteristics of organizations following
an innovation-focused strategy will differ from those that do not, is consistent with
this contingency approach and, in the following section, we focus on those
dimensions of culture and structure that have been identified as differentiating
between innovative and non-innovative organizations.
Ernst (2002) specifies a range of generic characteristics for the dedicated
project group assigned the innovation task: multidisciplinarity, dedicated project
40
leader, inter-functional communication and co-operation, qualifications and know-
how of the project leader, team autonomy and responsibility for the process. And
these factors are echoed throughout the literature. Rothwell (1992) refers to them as
‘corporate conditions’, Chiesa et al. (1996) ‘enabling processes’ and O’Reilly and
Tushman (1997) ‘norms for innovation and change’. However, despite their perceived
importance, there is little guidance on how to measure them.
Volberda (1996) developed a conceptual model of alternative flexible
organizational forms that are argued to initiate or respond better to different types of
competition. Yet, in spite of its importance, there is relatively little evidence of the
extant measures of flexibility in the literature. Rothwell (1992) and Ekvall (1996)
propose a range of foci for measures of organizational and production flexibility, such
as ‘corporate flexibility and responsiveness to change’; Coughlan et al. (1994)
considers the flexibility of resource allocation. Several measures of personnel
flexibility are evident, such as ‘the adaptiveness of R&D personnel to technology
changes’ (Lee et al., 1996) and ‘the willingness to try new procedures and to
experiment with change, so as to improve a situation or a process’ (Abbey and
Dickson, 1983). At the level of the firm, Liao et al. (2003) introduce a similar
construct – ‘organizational responsiveness’.
Organizational complexity, the amount of specialization and task differentiation
reportedly have a positive relationship (Damanpour, 1996), though Wolfe (1994)
argues that it may favor initiation at the expense of implementation. Administrative
intensity, that is the ratio of managers to total employees, favors administrative
innovation (Damanpour, 1991, 1996), but possibly at the cost of other product or
technological innovations (Dougherty and Hardy, 1996). Centralization, the concentration
of decision-making authority at the top of the organizational hierarchy, and formalization,
the degree of emphasis on following rules and procedures in role performance, have
both been shown to have a negative impact on organizational innovation (Burns and
Stalker, 1961; Damanpour, 1991). Indeed, rigidity in rules and procedures may
prohibit organizational decision-makers from seeking new sources of information
(Vyakarnam and Adams, 2001).
41
2.3.2 Structuring for Innovation
From the perspective of Mphahlele (2006), the organization structure
represents the development of human resources in different parts of the organization
for doing specific work. Some organizational structures are more advanced in
supporting innovation than others. For example, a steeply hierarchical organization
that is overloaded with strict rules tends to stifle innovation because decision making
tends to be slow.
Organizational structures are broadly divided into two categories: Organic and
Mechanistic (Russel, 1999; Afuah, 2003; Russel and Russel, 1992).
Organic structures are those that facilitate lateral communication across
functions and where the decision-making is given to individuals who have the most
technical knowledge. Companies that have organic structures are characterized by a
higher degree of decentralization, formalization and complexity. This ensures that
decisions are taken by managers with the best knowledge of the business and that
employees at all levels can generate and champion new ideas.
2.3.3 Types of Organizational Structure
Another viewpoint offered by Savvakis C. Savvides is that Burns and Stalker
(1961) were the first to indicate that different types of organizational structures might
be effective in different situations. They identify two extreme types of organizational
structure. The mechanistic structure which is found in organizations operating under
stable conditions, and the organic structure which is found, or rather is best suited, to
organizations operating under unstable conditions. They also suggest nine characteristics
or factors of organizational form that vary between these two extreme forms of
organizational structure.
In a somewhat modified form I present these nine factors in what I believe to
be a more easily identifiable and workable manner than their original presentation
(Burns and Stalker, 1961: 120), in figure 2.2 below. The figure also attempts to relate
the innovation process to the two polar forms of organizational structure put forward
by Burns and Stalker, by showing which organizational structure better facilitates
which particular stage of the innovation process. It is observed that as the innovation
process moves on from the generation of ideas to implementation, the organizational
structure should become less organic and more mechanistic.
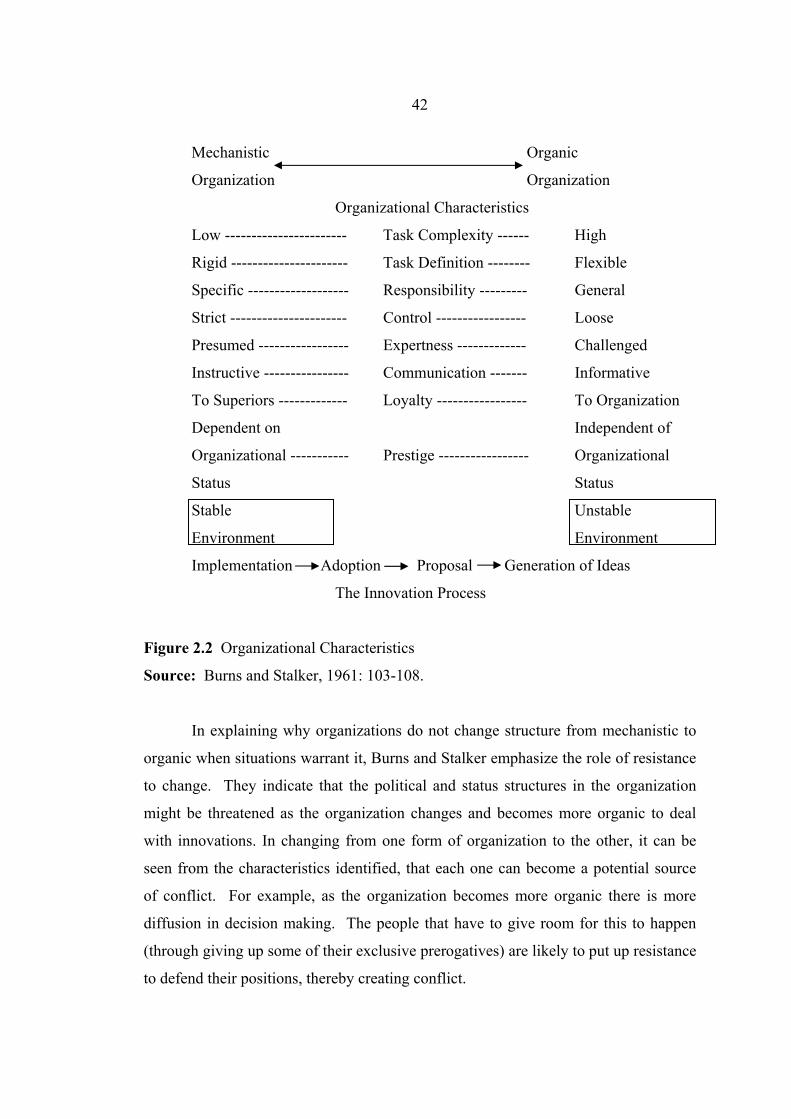
42
Mechanistic Organic
Organization Organization
Organizational Characteristics
Low ----------------------- Task Complexity ------ High
Rigid ---------------------- Task Definition -------- Flexible
Specific ------------------- Responsibility --------- General
Strict ---------------------- Control ----------------- Loose
Presumed ----------------- Expertness ------------- Challenged
Instructive ---------------- Communication ------- Informative
To Superiors ------------- Loyalty ----------------- To Organization
Dependent on Independent of
Organizational ----------- Prestige ----------------- Organizational
Status Status
Stable Unstable
Environment Environment
Implementation Adoption Proposal Generation of Ideas
The Innovation Process
Figure 2.2 Organizational Characteristics
Source: Burns and Stalker, 1961: 103-108.
In explaining why organizations do not change structure from mechanistic to
organic when situations warrant it, Burns and Stalker emphasize the role of resistance
to change. They indicate that the political and status structures in the organization
might be threatened as the organization changes and becomes more organic to deal
with innovations. In changing from one form of organization to the other, it can be
seen from the characteristics identified, that each one can become a potential source
of conflict. For example, as the organization becomes more organic there is more
diffusion in decision making. The people that have to give room for this to happen
(through giving up some of their exclusive prerogatives) are likely to put up resistance
to defend their positions, thereby creating conflict.
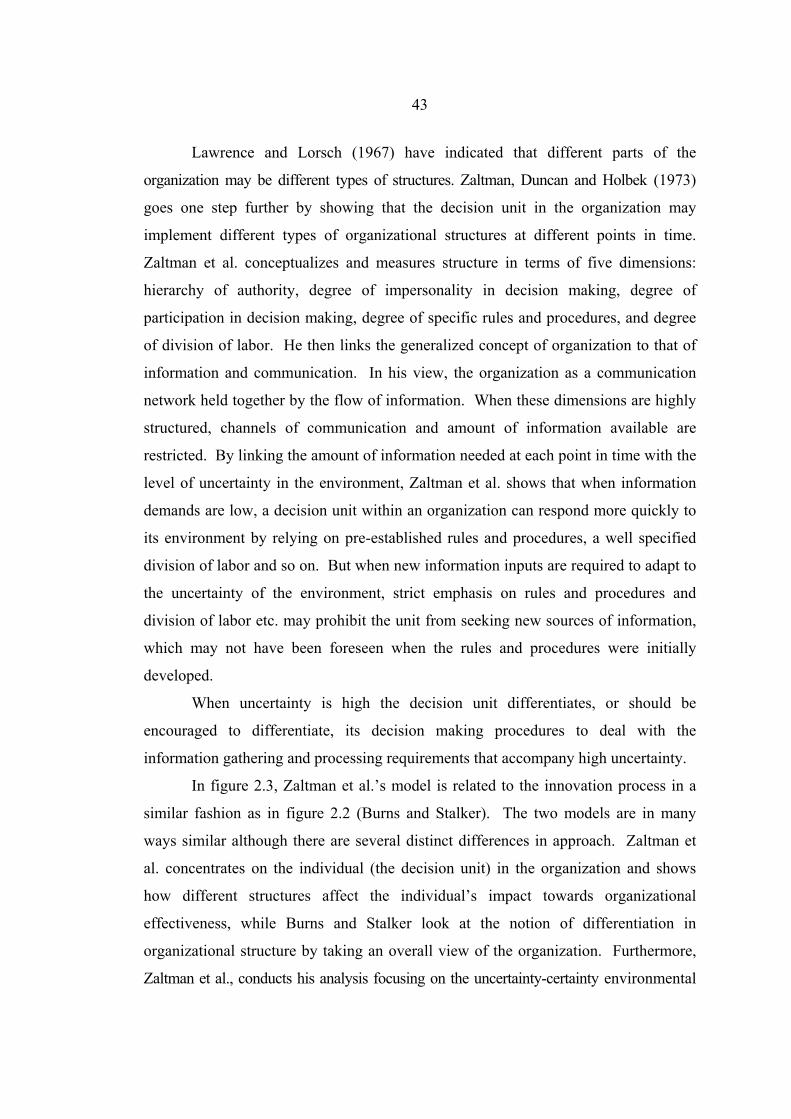
43
Lawrence and Lorsch (1967) have indicated that different parts of the
organization may be different types of structures. Zaltman, Duncan and Holbek (1973)
goes one step further by showing that the decision unit in the organization may
implement different types of organizational structures at different points in time.
Zaltman et al. conceptualizes and measures structure in terms of five dimensions:
hierarchy of authority, degree of impersonality in decision making, degree of
participation in decision making, degree of specific rules and procedures, and degree
of division of labor. He then links the generalized concept of organization to that of
information and communication. In his view, the organization as a communication
network held together by the flow of information. When these dimensions are highly
structured, channels of communication and amount of information available are
restricted. By linking the amount of information needed at each point in time with the
level of uncertainty in the environment, Zaltman et al. shows that when information
demands are low, a decision unit within an organization can respond more quickly to
its environment by relying on pre-established rules and procedures, a well specified
division of labor and so on. But when new information inputs are required to adapt to
the uncertainty of the environment, strict emphasis on rules and procedures and
division of labor etc. may prohibit the unit from seeking new sources of information,
which may not have been foreseen when the rules and procedures were initially
developed.
When uncertainty is high the decision unit differentiates, or should be
encouraged to differentiate, its decision making procedures to deal with the
information gathering and processing requirements that accompany high uncertainty.
In figure 2.3, Zaltman et al.’s model is related to the innovation process in a
similar fashion as in figure 2.2 (Burns and Stalker). The two models are in many
ways similar although there are several distinct differences in approach. Zaltman et
al. concentrates on the individual (the decision unit) in the organization and shows
how different structures affect the individual’s impact towards organizational
effectiveness, while Burns and Stalker look at the notion of differentiation in
organizational structure by taking an overall view of the organization. Furthermore,
Zaltman et al., conducts his analysis focusing on the uncertainty-certainty environmental
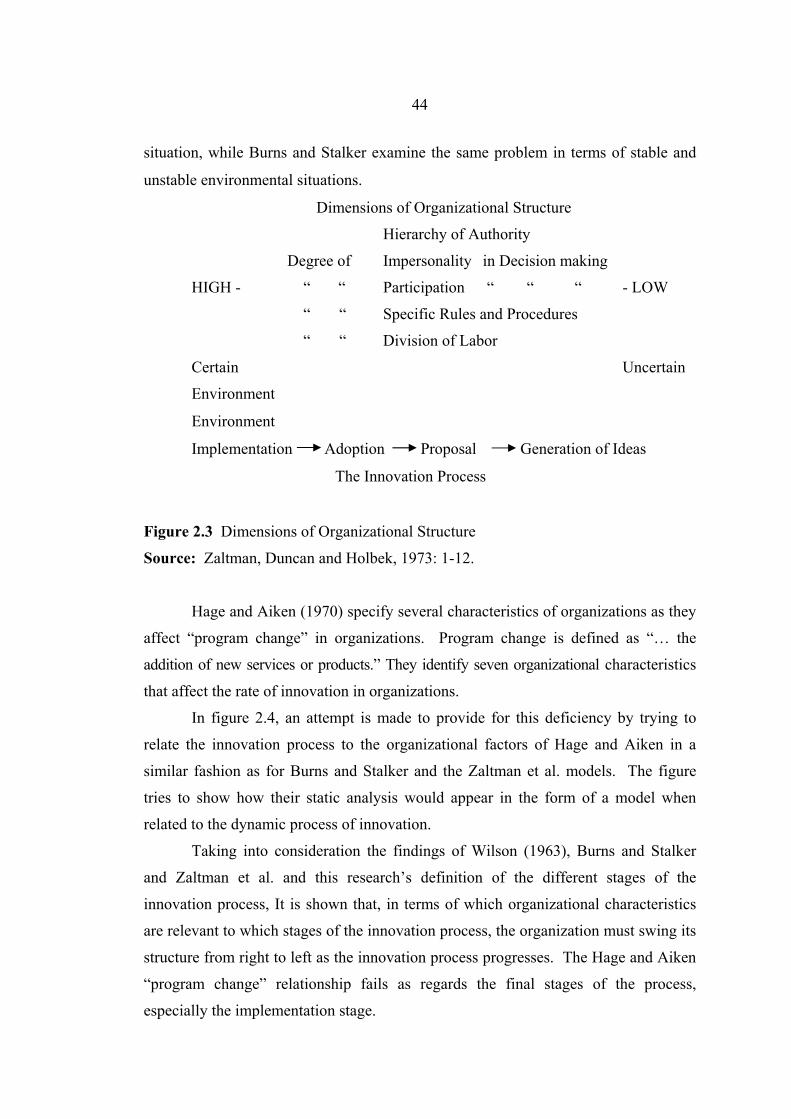
44
situation, while Burns and Stalker examine the same problem in terms of stable and
unstable environmental situations.
Dimensions of Organizational Structure
Hierarchy of Authority
Degree of Impersonality in Decision making
HIGH - “ “ Participation “ “ “ - LOW
“ “ Specific Rules and Procedures
“ “ Division of Labor
Certain Uncertain
Environment
Environment
Implementation Adoption Proposal Generation of Ideas
The Innovation Process
Figure 2.3 Dimensions of Organizational Structure
Source: Zaltman, Duncan and Holbek, 1973: 1-12.
Hage and Aiken (1970) specify several characteristics of organizations as they
affect “program change” in organizations. Program change is defined as “… the
addition of new services or products.” They identify seven organizational characteristics
that affect the rate of innovation in organizations.
In figure 2.4, an attempt is made to provide for this deficiency by trying to
relate the innovation process to the organizational factors of Hage and Aiken in a
similar fashion as for Burns and Stalker and the Zaltman et al. models. The figure
tries to show how their static analysis would appear in the form of a model when
related to the dynamic process of innovation.
Taking into consideration the findings of Wilson (1963), Burns and Stalker
and Zaltman et al. and this research’s definition of the different stages of the
innovation process, It is shown that, in terms of which organizational characteristics
are relevant to which stages of the innovation process, the organization must swing its
structure from right to left as the innovation process progresses. The Hage and Aiken
“program change” relationship fails as regards the final stages of the process,
especially the implementation stage.
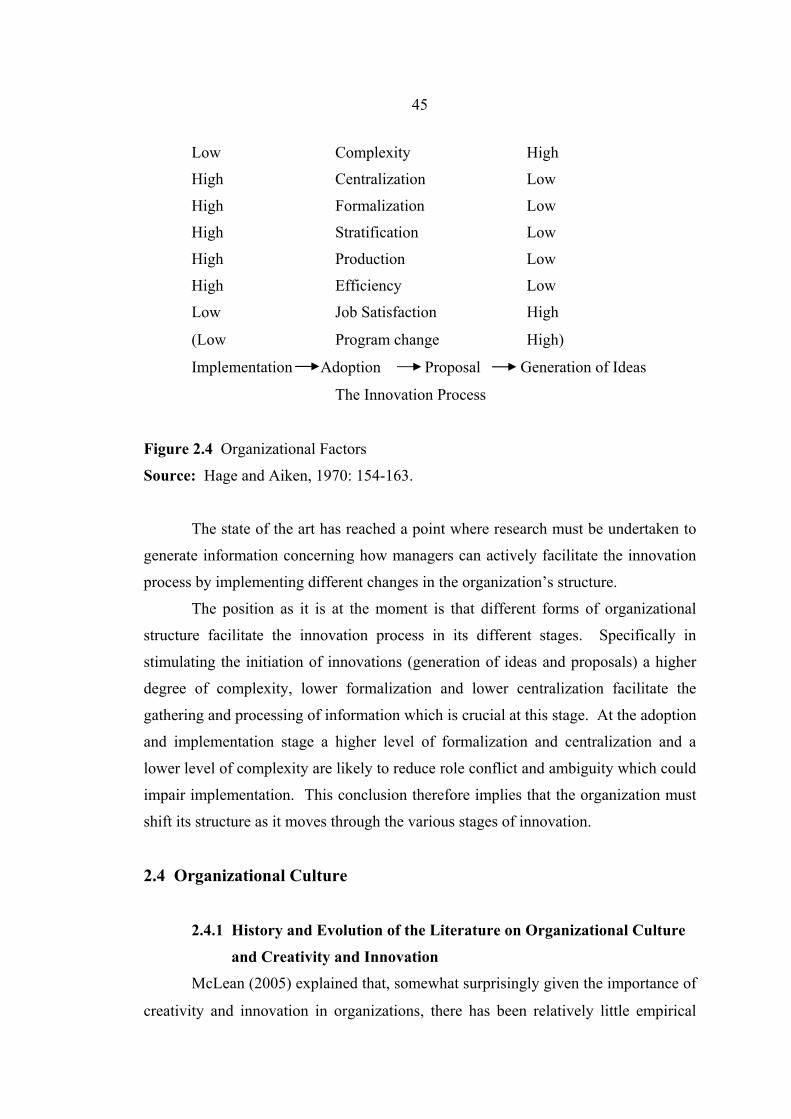
45
Low Complexity High
High Centralization Low
High Formalization Low
High Stratification Low
High Production Low
High Efficiency Low
Low Job Satisfaction High
(Low Program change High)
Implementation Adoption Proposal Generation of Ideas
The Innovation Process
Figure 2.4 Organizational Factors
Source: Hage and Aiken, 1970: 154-163.
The state of the art has reached a point where research must be undertaken to
generate information concerning how managers can actively facilitate the innovation
process by implementing different changes in the organization’s structure.
The position as it is at the moment is that different forms of organizational
structure facilitate the innovation process in its different stages. Specifically in
stimulating the initiation of innovations (generation of ideas and proposals) a higher
degree of complexity, lower formalization and lower centralization facilitate the
gathering and processing of information which is crucial at this stage. At the adoption
and implementation stage a higher level of formalization and centralization and a
lower level of complexity are likely to reduce role conflict and ambiguity which could
impair implementation. This conclusion therefore implies that the organization must
shift its structure as it moves through the various stages of innovation.
2.4 Organizational Culture
2.4.1 History and Evolution of the Literature on Organizational Culture
and Creativity and Innovation
McLean (2005) explained that, somewhat surprisingly given the importance of
creativity and innovation in organizations, there has been relatively little empirical
46
work done in the area of organizational culture and creativity and innovation (Oldham
and Cummings, 1996). The author conducted a search of the electronic catalogs of
several major university libraries, a number of journal indexes, and google.com.
Much of what has been written on the topic has appeared in the popular press and in
books written for practitioners, with little apparent empirical evidence to back up the
content of those books. The first scholarly article of some notoriety on the topic was
written by Burns and Stalker (1961), who compared electronics firms with more
established industrial enterprises and made the distinction between mechanistic and
organic forms of organizing. Mechanistic organizations were characterized as
hierarchical, highly structured organizations with well-defined, formal roles and
positions relative to others in the organization, with communication flowing primarily
vertically. Organic organizations, by contrast, were typified by their fluid organizational
design, with departments and teams forming and reforming to address new problems
and opportunities, with communication flowing primarily laterally. Burns and
Stalker’s environmental determinism view of organizations led to the conclusion that
organic organizations form to deal with unpredictability and volatility in an
organization’s environment. Compared with a mechanistic organization, an organic
one facilitated greater creativity and innovation. This conclusion was later challenged
when Kimberly (1981) found that centralized decision making may enhance an
organization’s ability to implement innovations, particularly in a more stable
environment. Also, whereas Burns and Stalker began a body of knowledge on
creativity and innovation in organizations over the next several decades, relatively
little of that research focused specifically on organizational culture or climate.
Nonetheless, a few key scholars have done work in this area and their work is
reviewed below.
2.4.2 Organizational Culture Framework
Another point made by Martins and Martins (2002) about organization culture
is that for most organizations change is inevitable. Organizational cultural issues are
becoming increasingly important and a source of a strategic competitive advantage.
Organizational changes usually promote and intensify competitiveness, as they
require dramatic changes in strategy, technology, working systems and management
47
style, among others. These changes require in-depth analysis of values, beliefs and
behavior patterns that guide day-to-day organizational performance. Creativity and
innovation have a role to play in this change process. The topic of organizational
culture often presents two contradictory images. The first is of culture as “the glue
that holds the organization together”, and the second regards it as a central part of the
change process (Denison, 2001: 347). According to Read (1996: 223), post-industrial
organizations today are knowledge-based organizations and their success depends on
creativity, innovation, discovery and inventiveness. The importance of creativity and
innovation is emphasized in the words Zaltman et al. (West and Farr, 1990: 3-4):
“The importance of new ideas cannot be overstated. Ideas and their manifestations as
practices and products are the core of social change.”
In the midst of change, organizations and leaders try to create an institutional
framework in which creativity and innovation are accepted as basic cultural norms. It
has become clear that “the unwritten rules of the game” (the norms of behavior) and
shared values influence morale, performance and the application of creativity and
innovation in many different ways. Deal and Kennedy (1982: 164) stated that
openness and trust in the change process influence whether and how change occurs.
Senge, Kleiner, Roberts, Ross, Roth and Smith (1999: 44) support this statement by
pointing out that openness (developing a genuine spirit of inquiry and trust) often
plays a critical role in profound change processes. Furthermore, compelling new ideas
help people think and act in new ways. In this respect there is a definite need to
understand how organizational culture should be dealt with in order to promote
creativity and innovation as part of constant change. This need has already been
identified by Schuster (1986).
Authors like Johnson (1996: 9-11), Judge, Fryxell and Dooley (1997: 73), Pienaar
(1994: 3-35), Shaughnessy (1988: 5), Tesluk, Faar and Klein (1997: 27) and Tushman and
O’Reilly (1997: 27) all agree that organizational culture is a contributing factor to the
degree to which creative and innovative behavior is found among employees in an
organization. Michela and Burke (2000) argue that quality and innovation in
organizations are inextricably intertwined with organizational culture.
There seems to be little agreement in the literature as to what type of
organizational culture promotes creativity and innovation (Judge, Fryxell and Dooley,
1997: 73). There also seems to be a paradox: Organizational culture can promote the
48
creativity and innovation necessary to be competitive and successful, but, on the other
hand, it can also be an obstacle to creative and innovative behavior (Glor, 1997: 44;
Tushman and O’Reilly, 1997: 31,35). The question is: What type of organizational
culture supports creativity and innovation in an organization?
Several researchers (Ahmed, 1998; Filipczak, 1997; Judge, Fryxell and
Dooley, 1997; Nÿstrom, 1990; O’Reilly 1989; Pinchot and Pinchot, 1996; Tesluk,
Faar and Klein, 1997) have worked on identifying the values, norms and assumptions
involved in promoting and implementing creativity and innovation. Very few
empirical studies, especially quantitative research, appear to have been carried out to
support the research findings, but several values, norms and beliefs have been
identified by researchers like (Judge, Fryxell and Dooley, 1997; Nÿstrom, 1990;
O’Reilly, 1989) in their empirical research. The purpose of the research presented here
is to identify, operationalize, measure and describe the determinants of organizational
culture that might influence creativity and innovation.
In order to synthesize the cultural values and norms that influence creativity
and innovation, as found in the literature, the integrated, interactive model shown in
figure 2.5 was created (Martins, 2000). This model is based on the work of Martins
(1989, 1997) which describes organizational culture and the importance of leadership
in creating an ideal organizational culture that influences organizational behavior.
The model developed by Martins (1989) to describe organizational culture was
based on the work of Edgar Schein and draws on open systems theory [originally
developed by Ludwig van Bertalanfy in 1950 and adapted by several authors like Kast
and Rosenzweig, 1985 and Kreitner and Kinicki, 1995. The systems approach offers a
holistic approach, but also emphasizes the interdependence between the different
subsystems and elements in an organization (French and Bell, 1995). The organizational
systems model explains the interaction between organizational subsystems (goals,
structure, management, technology and psycho-sociological). The complex interaction
which takes place on different levels between individuals and groups, and also with
other organizations and the external environment, can be seen as the primary determinants
of behavior in the work place. Based on the dimensions that describe organizational
culture (figure 2.5), Martins (2000) identified and synthesized the determinants of
organizational culture that influence creativity and innovation as found in the
literature.
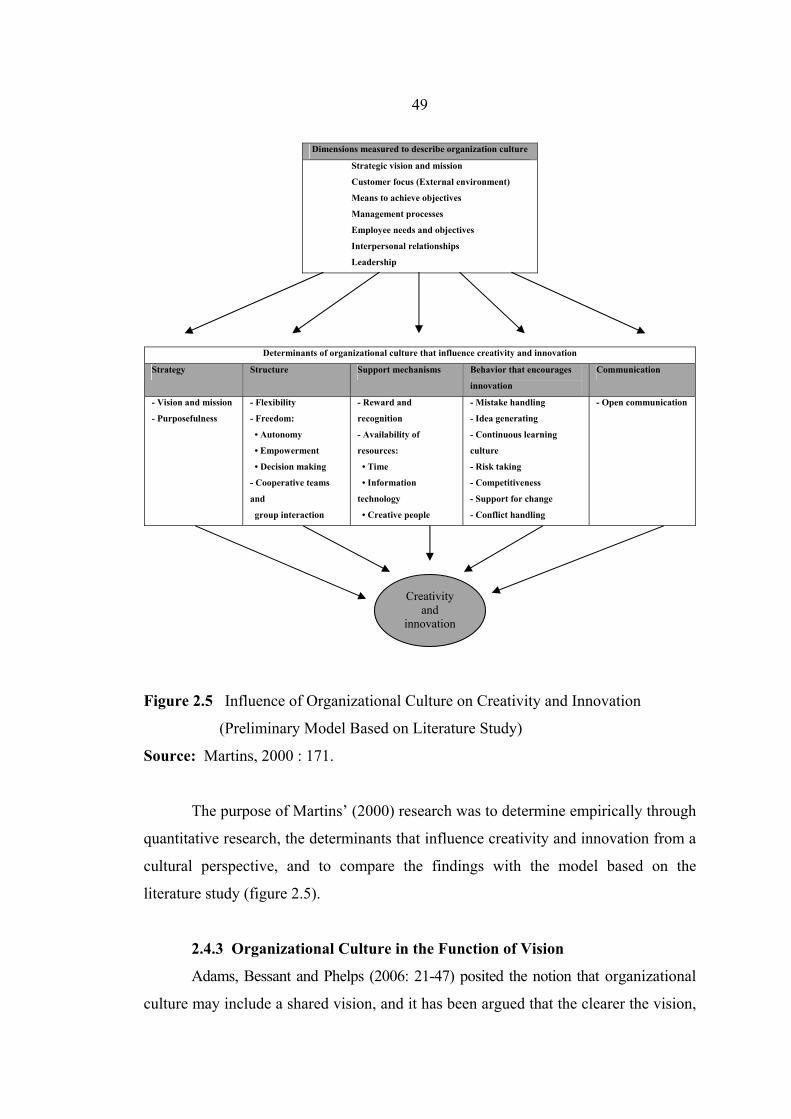
49
Dimensions measured to describe organization culture
Strategic vision and mission
Customer focus (External environment)
Means to achieve objectives
Management processes
Employee needs and objectives
Interpersonal relationships
Leadership
Determinants of organizational culture that influence creativity and innovation
Strategy Structure Support mechanisms Behavior that encourages
innovation
Communication
- Vision and mission
- Purposefulness
- Flexibility
- Freedom:
• Autonomy
• Empowerment
• Decision making
- Cooperative teams
and
group interaction
- Reward and
recognition
- Availability of
resources:
• Time
• Information
technology
• Creative people
- Mistake handling
- Idea generating
- Continuous learning
culture
- Risk taking
- Competitiveness
- Support for change
- Conflict handling
- Open communication
Figure 2.5 Influence of Organizational Culture on Creativity and Innovation
(Preliminary Model Based on Literature Study)
Source: Martins, 2000 : 171.
The purpose of Martins’ (2000) research was to determine empirically through
quantitative research, the determinants that influence creativity and innovation from a
cultural perspective, and to compare the findings with the model based on the
literature study (figure 2.5).
2.4.3 Organizational Culture in the Function of Vision
Adams, Bessant and Phelps (2006: 21-47) posited the notion that organizational
culture may include a shared vision, and it has been argued that the clearer the vision,
Creativity and
innovation
50
the more effective it is as a facilitator of innovation as it enables the focused
development of new ideas that can be assessed more precisely (West, 1990). Pinto
and Prescott (1988) found that the only factor to have predictive power in terms of
potential for success at all stages of the innovation process (conception, planning,
execution and termination) was having a clearly stated mission/vision, while West
(1990) contended that the quality of innovation is partly a function of vision. Keller
(1986) adopted Kirton’s (1976) 32-item adopter–innovator inventory to determine
individual and team orientation to innovation. Vision is operationalized in the team
climate inventory (Agrell and Gustafson, 1994; Anderson and West, 1996, 1998;
West and Anderson, 1996) and is deconstructed into a series of sub-dimensions such
as clarity, sharedness, attainability and value with regard to team objectives.
2.5 Project Management
2.5.1 Project Management Overview
Project management by Adams, Bessant and Phelps (2006) is concerned with
the processes that turn the inputs into a marketable innovation. The innovation
process is complex, comprising a myriad of events and activities- some of which can
be identified as a sequence and some of which occur concurrently- and it is clearly
possible that innovation processes will differ to some degree, across organizations and
even within organizations on a project-by-project basis. Having an efficient process
that is able to manage the ambiguity of the innovation is universally agreed to be
critical to innovation (Globe et al, 1973: 8-15).
Several studies have made efforts to measure project management efficiency,
mostly in the form of comparisons between budget and actual (project costs, project
duration, revenue forecasting). Another measure of project management success is
speed (time management). Innovation speed has been positively correlated with
product quality or the degree to which it satisfies customer requirements; measures
include speed (Hauser and Zettelmeyer, 1997: 32-48), performance against schedule
(Chiesa and Masella, 1994), and duration of the process (Cebon and Newton, 1999).
To achieve efficiency, it is widely recommended that organizations seeking to
innovate should establish formal operation processes for innovating and make use of
51
tools and techniques that may facilitate innovative endeavors. The stage-gate process
(Cooper, 1990) is possibly the most familiar of these, but other methodologies for
innovation project management exist, including Phased Development, Product and
Cycle-time Excellence and Total Design (Jenkins et al. (1997) for a discussion).
These methodologies have in common the separation of the product development
process into structured and discrete stages, which each have milestones in the form of
quality control checkpoints at which stop/go decisions are made with regard to the
progress of the project. These highly structured approaches to the management of the
innovation process began to emerge in the 1990s (Veryzer, 1998).
2.5.2 Innovation and Project Management
Filippov and Mooi (2009) described the relationship between two distinctive
disciplines – project management and innovation management (innovation studies).
Despite the seemingly interrelated nature of both subjects, these two research domains
have been developing relatively isolated from one another.
2.5.2.1 Innovation Studies
Innovation studies are rooted in the seminal writings of Joseph
Schumpeter in the 1920s-30s (Schumpeter, 1934), whose ideas started to gain
popularity in the 1960s, as the general interest among policymakers and scholars in
technological change, R&D and innovation increased. The field formed as a distinctive
academic discipline from the 1980s onwards. Scholars like Richard Nelson, Chris
Freeman, Bengt-Åke Lundvall, Keith Pavitt, Luc Soete, Giovanni Dosi, Jan Fagerberg,
Bart Verspagen, Eric von Hippel and others have shaped and formed this discipline.
The seminal publications in the area include, inter alia, Freeman (1982), Freeman and
Soete (1997), Lundvall (1992), Nelson and Winter (1977, 1982), von Hippel (1988).
Regarding the definition of innovation – a general consensus has been achieved among
innovation scholars who broadly understand this phenomenon as a transformation of
knowledge into new products, processes and services.
An in-depth review of the innovation literature is beyond the scope of
this paper (Fagerberg (2004) for such analysis). Our intention is to outline main
directions of research. In a recent paper, Fagerberg and Verspagen (2009: 218-233)
provided a comprehensive analysis of the cognitive and organizational characteristics
52
of the emerging field of innovation studies and consider its prospects and challenges.
The authors trace the evolution and dynamics of the field. Reflecting the complex
nature of innovation, the field of innovation studies unites various academic
disciplines. For example, Fagerberg and Verspagen (2009) defined four main clusters
of innovation scholars, namely “Management” (cluster 1), “Schumpeter Crowd”
(cluster 2), “Geography and Policy” (cluster 3.1), “Periphery” (cluster 3.2) and “Industrial
Economics” (cluster 4).
For the purposes of our analysis we shall have a closer look at the
“Management” cluster, since it is here where the connection between innovation and
Project Management can be found. In fact “Management” is the smallest cluster
within the entire network of innovation scholars, consisting of only 22 scholars,
mainly and Policy” (298 scholars) or “Schumpeter Crowd” (309). In terms of
publication preferences, apart from Research Policy, the favorite journal for
innovation scholars, members of the “Management” cluster see management journals
as the most relevant publishing outlets, particularly the Journal of Product Innovation
Management, Management Science and Strategic Management Journal. Fagerberg
and Verspagen (2009: 229) see a strong link between innovation and management and
provide the following description:
“Management is to some extent a cross-disciplinary field by default and
firm-level innovation falls naturally within its portfolio... So between innovation
studies and management there clearly is some common ground”.
2.5.2.2 Project Management
Project management as a human activity has a long history –the
construction of the Egyptian pyramids in 2000 BC may itself be regarded as a project
activity. However, the start off the modern Project Management era, as a distinctive
research area, was in the 1950s.
A project is an endeavor in which human, financial and material
resources are organized in a novel way to undertake a unique scope of work, of given
specification, with constraints of cost and time, so as to achieve the beneficial change
defined by quantitative and qualitative objectives.
There have been several attempts to provide an overview of the state-of-
the-art research in PM and outline its trends and future directions (PMI, 2004; Betts
53
and Lansley, 1995; Themistocleous and Wearne, 2000; Crawford et al., 2006;
Kloppenberg and Opfer, 2002). In a recent article, Kwak and Anbari (2009) reviewed
relevant academic journals and identified eight allied disciplines, in which PM is
being applied and developed. These disciplines include the following areas: Operation
Management, Organizational Behavior, Information Technology, Engineering and
Construction, Strategy/Integration, Project Finance and Accounting, and Quality and
Management. Notably, the other of these eight allied disciplines is Technology
Application / Innovation / New Product Development / Research and Development.
The authors found that only 11% of journal publications on the subject of project
management fell under the Innovation heading. Yet, importantly, this area has shown
sustained upward interest, and hence the number of publications, since the 1960s.
Overall, Kwak and Anbari (2009) conclude that the mainstream PM research proceeds
largely in the Strategy / Integration / Portfolio Management / Value of PM /
Marketing direction (30% of all publications examined by the authors).
2.5.2.3 Innovation Projects
As this brief literature review reveals, the interfaces between innovation
studies and (project) management do exist. Yet, it can be seen that both research
streams have developed in relative isolation from one another, and the connection
between the two domains is quite often implicit. As Keegan and Turner (2002: 368)
state,
With some notable exceptions, however, the traditional innovation
literature largely ignores project management and the intricacies of managing
innovation in project-based firms. In addition, the project management literature,
considerably expanded in recent decades, largely ignores innovations.
There are several important links between projects and innovations. This
can be seen in the origins of the two terms. Today we use the word project in a
number of different settings – to signify a group or an organization, to demarcate a
particularly complex transaction, to refer to a visionary plan or idea. Originally,
however, the term draws on the Latin word projicere of which the meaning might be
derived to throw something forward. Innovation is often used to signify something
new, either a new product, service or other output, and/or a new process and method.
The word is also traceable to Latin and the word innovo which could be translated as
54
to renew. In many ways the two fields of research have been kept apart leading to
neglect in the project management area to acknowledge and embrace the unique
processes of projects – to cope with uncertainty instead of eliminating it by the use of
advanced planning techniques. In the innovation arena, project management has often
been looked upon as a simple implementation endeavor with little problems.
However, research has time and time again pointed out the difficulties of moving
from invention to innovation, of moving from ideas to value creating products – a
process where project management potentially would have a very important role.
Keegan and Turner (2002: 367-388) analyzed the management of
innovation in project-based firms along three dimensions – context supportive for
innovation, slack resources and perception of innovation as being useful or not. The
authors observe that the interplay between innovation and projects is dominated by
the ideas on how to correctly manage projects, rather than how to effectively manage
innovation. In other words, the attitude towards managing innovation projects remains
mechanical in nature as traditional project management approaches are applied to
innovation projects. Keegan and Turner (2002) argue in favor of the evolution of the
traditional project management towards a more informal, organic management of
innovation, with a higher tolerance for slack resources and greater levels of
redundancy in order to create time, space and creativity for innovation.
2.6 Team Cohesiveness
2.6.1 Cohesion
It has long been recognized that the relationship between cohesion and team
innovation is inconsistent, in that cohesion can be associated with both high and low
team innovation. Mullen and Copper (1994: 210-227) asserted that it is chiefly the
commitment to the task (as an indicator of cohesion) that shows a significant impact
on team innovation. They included 51 effects of 46 empirical investigations in their
meta-analysis and concluded that cohesion influences performance, particular if the
team task requires coordination and communication (e.g., innovative tasks). These
results indicate that an adequate level of cohesion impacts the performance of
innovation teams through its positive influence on communication and coordination.
55
Forsyth (1999 quoted in Treadwell et al., 2001: 3-11) regarded cohesion as
analogous to the ‘glue’ that holds a group together or as the strength of the bonds
linking group members to the group. He observed that cohesive groups share some
common characteristics: a) enjoyment and satisfaction, b) a cooperative and friendly
atmosphere, c) exchange a praise for accomplishments, d) higher self-esteem and less
anxiety among group members, and e) greater member retention. Additionally, Secord
and Backham (1994 quoted in Treadwell et al., 2001) stated that members of highly
cohesive groups mutually accept each other’s ideas, contribute equally to problem
solving, and are not likely to be adversely affected by the power and status structures
within the group.
Mostafa (2005: 7-33) studied the effects of reward schemes, individualism-
collectivism, and intrinsic motivation on teams’ creative performance and found that
cohesiveness partially mediated some of the effects on creativity. The result indicated
that innovation can result in strong group cohesiveness.
Keller (1986: 715-726) found that the relationship between team cohesion
could generate intellectual competitiveness. Team cohesiveness was the best predictor
of the variables that significantly correlated with the innovation of teams. Rubenstein
(1975 quoted in Keller, 1986) found a cohesive scientific workgroup to be more likely
to build innovations than non-cohesive teams.
West and Wallace (1991: 303-315) found that there was significant positive
relationship between innovativeness and the team cohesiveness and participation in
decision making.
Griffith and Mullen (1972 quoted in Keller, 1986) examined teams of
researchers that had made major changes in their particular fields of science and
found that they had the high levels of cohesive bonds needed to make advance
revolutionary changes in their work. Dailey (1978) found that team cohesion is the
most significant predictor explaining 30 percent of the variance of team innovation.
In this study used the cohesion concept of Langfred (1998: 124-143) to
measure the cohesion of R&D projects. This concept addresses the degree to which
team members identify positively with the team and use. six items to measure the
extent to which team members feel a part of the team, the strength of member ties to
other members, and team members’ commitment to the team. Moreover, the previous
56
studies mentioned above have shown that cohesion has influence on team innovation.
Thus, this study hypothesizes that cohesion has a positive effect on team innovation.
2.6.2 Team Cohesiveness and Team Innovation
From the perspective of McDowell and Zhang (2009), innovativeness is a
psychological trait that adopts new ideas or technologies as indicated by Leavitt and
Walton (1975). This view of innovativeness as a trait can encompass the adoption of
products or processes from other sources (Roehrich, 2002). While innovation is
highly connected to creativity, the purpose of this study is to look at the broader scope
of innovation which includes the implementation of creative ideas and thought
processes within the team (Woodman, Sawyer and Griffin, 1993: 231-293). Calatone,
Cavusgil and Zhao (2002: 515-524) reinforce this idea with the understanding that
innovation and organizational learning are closely related. Thus, the organization
tends to evolve into a more innovative organization as better ideas and processes are
either developed or adopted.
The study of determining factors of overall team innovativeness can certainly
benefit the understanding of teams in the context of organizations. The various
dynamics of team interaction, such as the cultural composition (Hopkins and Hopkins,
2002; Balkundi et al., 2007) the existence of creativity (Kurtzberg and Amabile,
2001), trust (Leung, 2008) and shared leadership (Carson, Tesluk and Marrone, 2007:
1217-1234) are just some of the current variables being examined in regards to teams.
In addition, however, the examination of these factors in light of the current literature
concerning team cohesiveness and the effects that cohesiveness can have on team
innovation will help to understand how these factors work in relation to one another.
The current literature shows mixed findings concerning the role cohesiveness
plays in team performance (Turner et al., 1984; Lokshin et al., 2009). However, by
focusing solely on team innovativeness, this paper seeks to discover if a relationship
does exist between cohesiveness and this aspect of performance. While some research
would suggest that cohesiveness can eventually lead to a myopic view taken by the
group through groupthink (Janis, 1972), it is still believed that the closeness brought
about through cohesiveness can facilitate the members of a team working together
more freely with more communication to develop more innovative ideas.
57
Therefore, the purpose of this study centers on studying the relationship
between team innovativeness and cohesiveness and potency. This adjustment, from
focusing on team performance to team innovativeness in light of cohesiveness will
hopefully develop a better understanding of what does indeed enhance the team
innovative process.
2.6.2.1 Determinants of Team Innovativeness
There are many determinants of team performance (Guzzo and Dickson,
1996; Hsu et al., 2005). These constructs commonly include cohesiveness, heterogeneity,
familiarity, motivation, goals, feedback and communication. Other variables such as
individual creativity (Taggar, 2002), self-efficacy, (Tierney and Farmer, 2002; Earley,
1994) potency, (Tesluk and Mathieu, 1999: 200-217), team training (Rothrock et al.,
2009) and member expertise (Bonner et al., 2002) are also aspects which determine
team performance.
The crossover from performance to innovation has relatively less
research devoted to it, but as Sethi, Smith and Park (2001: 73-85) indicate, many of
the same constructs are related to both. Similarly, Woodman et al. (1993) also listed
issues such as cohesiveness, longevity, and composition as antecedents of team
creativity which is an aspect of team innovation.
2.6.2.2 Team Cohesiveness
Team cohesiveness is greatly influenced by other factors such as
heterogeneity, composition, and longevity. Cohesiveness within teams is determined
by the individuals within the team having a desire to remain a part of that team
because their individual needs are being met Turner, Hogg, Turner and Smith (1984:
97-111) (Turner et al., 1984.) As Hackman (1992) indicates, there are two types of
cohesiveness in teams- task and interpersonal- and more cohesive teams have
members who are more likely to conform to team norms. However, there are differing
views as to whether cohesiveness within a team is beneficial to the overall outcome or
not. Both Hackman (1992) and (Turner et al., 1984) point out that there are various
studies that report both positive and negative outcomes. Guzzo and Dickson (1996:
307-338) found that high cohesiveness is good for team performance, especially when
the team is under pressure. Facilitating this may be that they found that high
interpersonal cohesiveness is highly correlated with communication within the team.
58
However, they also found that low cohesiveness, or those teams that had low levels of
familiarity, actually had lower levels of performance. To counter that, Janis’ (1972)
introduction of groupthink would imply that a negative relationship could exist due to
high cohesiveness, but to think that only a negative relationship exists would be a
very narrow perspective. Tesluk and Mathieu (1999: 121-154) in their study seemed
to indicate that highly cohesive teams were more adaptable and prepared for more
critical problem solving. However, for this study, a positive relationship is expected
between cohesiveness and innovativeness because of increased communication and
the ability to coordinate with team members in a cross functional team.
2.6.2.3 Composition
Wallmark (1973) studied the importance of size in research groups and
found a positive correlation between group size and group productivity. This was
interpreted as resulting from the greater number of possible contacts and consequent
intellectual synergy. Stankiewicsz (1979) examined the innovativeness and productivity of
172 Swedish academic groups. The groups were randomly selected from the fields of
natural science and technology and ranged from 2 - 8 in size. The typical group
contained 4-5 scientists. A positive correlation was confirmed between group size and
productivity in groups high in cohesiveness and with very experienced leaders, but in
groups with low cohesiveness, Stankiewicsz found an optimum size of seven
members. Thus, there appears to be an interaction effect between size and cohesiveness,
since cohesiveness mediates between size and productivity.
Geschka (1983: 169-183), in a theoretical article, proposed that specially
trained innovation planning teams in organizations should contain 6-8 members from
different functional areas and also include opinion leaders who can help in the
implementation phase. The combination of a small workgroup and the presence of an
opinion leader, who pays attention to dissenting minorities, should especially favor
innovation (Geschka, 1983). Avoiding excessive homogeneity of experience and
training of individual members has been advocated as a necessary condition for
securing a diversity of views, and hence innovation (Geschka, 1983; Kanter, 1983).
2.6.2.4 Longevity
Another variable, which has been discussed as a possible influence on
innovation, is group longevity. Lovelace (1986: 161-174) suggests that research
59
scientists will be more creative if not assigned to permanent groups, and Nystrom
(1979) too argues for the advantages of relatively short-lived groups, at least as far as
the early stages of the innovation process are concerned. A study by Katz (1982: 81-
104) investigated the performance of fifty R&D teams over several years. An inverse
relationship between longevity and innovativeness was reported: the longer groups
had been in existence, the less innovative they became. Other authors have, on the
basis of these findings, argued for restricting the active lifespan of groups, as a means
for maximizing innovativeness (Nystrom 1979; Payne, 1990). Work by applied
psychologists into group development and task performance sheds more light upon
the relationship between group innovation and development over time. In initial
experimental studies, Gersick (1989: 274-309) presented groups of subjects with a
simulated project task of one hour's duration, informing subjects in advance of this
time limitation. Groups were videotaped and their interpersonal behavior subsequently
analyzed. The results show an unequivocal change in subjects' task orientation at
roughly the midpoint of the lifespan of the group, whereby individuals reappraised
their approach to the task, developed new ideas, and initiated modified work
practices. Gersick concludes that groups adhered to a ‘punctuated equilibrium model
of group development’, instituting a quantum leap in their work styles at the known
midpoint of the group's lifespan. Subsequent field studies of this effect, e.g. Gersick,
1989, have confirmed the salience of the punctuated equilibrium model in naturally
occurring workgroups, and thus hint at the applicability of this model to innovation
processes in real-life task groups of fixed-term nature.
2.7 Strategic Leadership
2.7.1 The Role of Leadership
The role of leadership in enabling innovation in organizations is acknowledged by
a lot of researchers (Foster and Pryor, 1986; Rothwell, 1994; Kanter, 1985).
Generally, the consensus is that the most significant role that the leadership should
play is that of developing the culture that supports innovation. Some researchers have
suggested other roles not specifically related to cultivating the right culture:
60
1. Facilitate and champion innovation activity, provide the necessary
resources, expertise or protection (Hornsby et al., 2002)
2. Developing and maintaining measurement systems, assessing strategic
performance and reviewing performance indicators (Soosay, 2005)
3. Focusing on networks for collaboration with internal and external
partners, balancing incremental and disruptive innovations, developing metrics for
feedback (Shelton and Davila, 2005)
4. Commitment, walking the talk, declaring the vision (Ahmed, 1998)
Leadership in innovation should, however, not be limited to the top but should
rather be present at all levels of the organization (Roach and Sager, 2000). The role
that innovation leadership at other levels plays includes picking the right teams for
innovation activities, using the right facilitators and distributing ideas throughout the
organization for future use.
Deschamps (2005: 31-38) makes reference to innovation leaders as executives
who create and lead the innovation process, develop and coach the innovators and
promote the innovation culture. Deschamps sees these kinds of leaders as falling
under two categories: front-end innovation leaders who innovate from the market side
by sensing new market needs and back-end innovation leaders who concentrate on
launching or deploying the products, services or processes fast. According to
Deschamps, CEOs must ensure that their organization has both kinds in order to
ensure that their innovation effort is effective.
2.7.2 Strategic Leadership in Exploratory and Exploitative Innovation
With reference to Jansen, Vera and Crossan’s work (2009: 5-18) in strategic
leadership, The researchers built on March’s (1991) logic to argue that both exploratory and
exploitative innovation involve organizational learning. Exploratory innovations
require new knowledge or departure from existing knowledge sources and involve the
“experimentation with new alternatives [that produce] returns [that] are uncertain,
distant, and often negative” (March, 1991: 85). They offer new designs, create new
markets, and develop new channels of distribution (Abernathy and Clark, 1985;
Jansen et al., 2006). Exploitative innovations broaden existing knowledge and skills
and are associated with the “refinement and extension of existing competences,
61
technologies, and paradigms [that produce] returns [that] are positive, proximate, and
predictable” (March, 1991: 85). They improve established designs, expand existing
products and services, and increase the efficiency of existing distribution channels
(Abernathy and Clark, 1985; Jansen et al., 2006). Consistent with prior discussion
about the multi-level processes of organizational learning, leadership behavior and
organizational learning has been linked to innovation by proposing that feed-forward
and feedback flows of learning that challenge institutionalized learning lead to
exploratory innovation, whereas feed-forward and feedback flows of learning that
reinforce institutionalized learning lead to exploitative innovation. In order to support
exploration and exploitation innovation, strategic leaders need to manage a rich
combination of multi-level learning processes.
2.7.3 Strategic Leadership: Leadership Behavior and Style
While the importance of innovation and adoption of new technologies to
improve the performance of the banking/financial services sector is widely recognized
(Fung, 2008; Barrutia, 2005; Alexander and Hixon, 2008; Slonaker, 2005; Conrad,
2007), success implementing the required changes is far from assured (Bielski, 2008a,
2008b; Fisher, 2009; Trombly, 2007; Watts and Garret, 2006). According to the large
body of literature, regardless of the technologies and/or change methodologies being
employed, in general, the factors important to innovation success or failure are many
but can be grouped into a few major areas. Most authors would agree that the change
process used for innovation has to bear certain characteristics. Many researchers have
looked to improvements in strategic leadership as critical to developing an organization
environment conducive to innovation (Waldman, Ramirez, House and Puranam,
2001; Williams, 2004). To help define and prioritize important problems and
opportunities to the organization, many have proposed Competitive Intelligence (CI)
programs as important to company success (Tarraf and Molz, 2006; duToit, 2003;
Vedder and Guynes, 2002; Guimaraes and Armstrong, 1998). Further, effective
Management of Technology (MOT) is thought to be a critical requirement for
successfully implementing most modern business changes (Beattie and Fleck, 2005).
While these propositions are exceedingly important, the existing literature contains
little empirical evidence supporting them. As called for in the study by Guimaraes and
62
Armstrong (1998), while the constructs being studied are well established, much can
be done for empirically testing these propositions. Particularly useful might be testing
an expanded integrated model of the factors potentially important to the effective
implementation of business change within the banking sector. This field test was
undertaken to accomplish these objectives.
In the area of strategic leadership, several implications can be derived from
this study. Charismatic leadership (showing determination while accomplishing goals,
inspiring confidence, making people feel good around you, communicating expectations
for high performance, generating respect, transmitting a sense of mission, and
providing a vision of what lies ahead) seems to be on average relatively scarce in the
banking industry today, and judging by its nature it should be difficult to develop.
Nevertheless, given its importance, managers must try. Also apparently important for
successful business innovation but less scarce than charismatic leadership,
transactional leadership-- taking action if mistakes are made, pointing out what people
will receive if they do what needs to be done, reinforcing the link between achieving
goals and obtaining rewards, focusing attention on deviations from what is expected,
and rewarding good work- by its nature should be easier to develop. Pawar and
Eastman (1997) proposed that transactional leadership is more relevant within an
existing organization environment instead of one attempting to implement changes.
Katz and Kahn (1978) argued that charismatic leadership may be more relevant where
organization change is important, but that both types of strategic leadership are
potentially important. Our results indicate that for successful business innovation both
types of leadership are important.
2.7.4 Strategic Leadership: Action Implementation
Louis Kasekende (2010) concluded in Citation for Outstanding Leadership
that Prof. Emmanuel Tumusiime-Mutebile has led the Bank of Uganda for almost 10
years. It has been a decade of remarkable achievements; achievements which were
made possible both by the Governor’s strategic leadership of the Bank and by his
ability to inspire and motivate its staff. His stewardship of the Bank has been notable,
not just because it has embodied the highest standards of professional expertise, but
also because he has never shied away from taking difficult decisions or of speaking
63
the truth about economic realities, however unpopular this may have been in some
quarters.
The Bank of Uganda’s core mandates are to deliver macroeconomic stability
and to regulate the banking system. In terms of both objectives, the Bank has been
very successful. The Bank’s monetary policy has faced many challenges during the
course of the last 10 years: from the difficulties of sterilising large aid inflows in the
first half of the decade; from the supply side shocks to international fuel prices and
food prices which pushed up inflation temporarily in 2008 and 2009; and then from
the consequences of the global financial crisis for the balance of payments and
aggregate demand. Under Prof. Tumusiime-Mutebile’s leadership, the Bank’s monetary
policy was able to steer the economy through the turbulence created by the external
shocks and keep it on an even keel. In particular, the Bank has delivered low inflation;
the primary policy objective of its monetary policy. Headline inflation over the course
of the last decade has averaged only 6.5 percent per annum. In turn, price stability has
enabled the economy to attract increasing amounts of private investment and grow
rapidly at an average of 7.4 percent per annum in real terms over the course of the
decade. Sound macroeconomic management ensured that our economy was able to
withstand the external shocks from the global economic crisis and avoid recession.
Prof. Tumusiime-Mutebile’s leadership of the Bank of Uganda in its role as
banking regulator has been equally successful. He assumed the stewardship of the
Bank at a time when parts of the banking system in Uganda were experiencing
distress. Several banks had failed towards the end of the 1990s, and the largest bank,
Uganda Commercial Bank, was under the statutory management of the Bank of
Uganda as a result of its insolvency. The Governor’s decision to resolve Uganda
Commercial Bank by selling it to a reputable international bank, in the teeth of
widespread scepticism and in some cases outright opposition, proved to be one of the
most prescient ever taken in the history of banking in the country. UCB was sold to
Stanbic Bank, a sale which preserved the nationwide branch network of UCB, and
protected its deposits. Since acquiring UCB, Stanbic has been in the forefront of the
dynamic expansion of the Ugandan banking system which occurred in the 2000s,
which included the very rapid growth of bank lending to the private sector.
64
The Governor also spearheaded major legislative reforms to financial
regulation which were essential to strengthen the legal framework governing the
financial sector in Uganda. The 2003 Micro-finance Deposit Taking Act brought, for
the first time in Uganda, deposit taking microfinance institutions under the regulatory
aegis of the Bank of Uganda. In the following year, the Financial Institutions Act was
enacted, which upgraded banking legislation in Uganda and incorporated important
elements of international best practice, such as prompt corrective action provisions for
resolving distressed banks. The success of financial regulation in Uganda over the last
decade is indisputable. Despite the shocks emanating from the global financial crisis,
Uganda’s banking system has remained in a markedly robust financial condition, with
average capital adequacy levels comfortably in excess of statutory minimum levels,
low levels of non performing loans and impressive profitability.
Prof. Tumusiime-Mutebile was recently appointed to a third five year term as
Governor. The Bank will face new challenges in the years ahead. The emergence of
Uganda as a “frontier market” will make effective financial regulation, including
macro-prudential regulation, even more critical to the stability of its economy.
2.8 Coordination and Communication
While studying routines alone should already be beneficial for better
understanding of coordination and communication in innovation projects, there is a
danger of not seeing the forest for the woods. One routine (e.g. planning and
assigning tasks) is only a lego piece in the overall project activities and might have
little effect in isolation. However, studies of, for example, the Toyota production
system (Liker, 2003) demonstrate that all routines in the organization follow similar
principles, which one might even call coordinative strategies. With the notion of
coordinative principles or strategies, a new way of integrating from the detailed level
to the overall project level is now possible as well as the formulation of related
research questions. However, the idea of coordinative patterns or principles is well
established in the organizational literature, but not linked to the more detailed analysis
of work activities and routines.
65
2.8.1 Coordination
Mintzberg, (1979) categorizes previous research into three main coordination
strategies: mutual adjustment is based on close collaboration suitable especially in
simple and very complex situations; direct supervision assumes that managers guide
and coordinate the activities of their subordinates, while the standardization of
processes, output, or training employs experts that develop rules and policies, but who
do not directly coordinate operative work.
Grant, (1996: 109-122) builds on Mintzberg and others but proposes a
somewhat different categorization: Rules and directives (similar to Mintzberg’s
standardization of process) capture the knowledge of specialists and convert it to
impersonal coordination. Sequencing of activities allows relatively independent
contributions with minimal coordination, while the mechanism of group problem
solving and decision making is close to Mintzberg’s mutual adjustment. In Grant’s
categorization, routines are themselves coordination mechanisms, emergent from the
mode of mutual adjustment towards an implicit standardization of activities.
While these categorizations have received wide recognition, they seem
somewhat simplistic and abstract especially for the domain of managing innovation
projects. The suggestions of the project management institute (PMI, PMBook) are the
first level of application of the aforementioned principles: Mutual adjustment in teams
is replaced by supervision and directives of project managers based on a standardized
set of project coordination and communication processes.
2.8.2 Communication
Communication is the vehicle through which personnel from multiple
functional areas share information that is critical to the successful implementation of a
project (Pinto and Pinto, 1990: 202-212). The purpose of this research is to study the
internal communication involved in intra-project communication among team
members which was measured in terms of the reason for communication. The reasons
for intra-project communication among team members were classified into three
categories: problem-solving issues, administrative issues and performance feedback.
According to Amason (1996), open communication facilities creativity and synergistic
learning. Shalley et al. (2004) found that for new product development teams, a
moderate frequency of communication was the best for creativity.
66
Johnson et al. (2001: 24-42) asserted that the communication and participation
of individuals are critical factors in innovation. In particular, enhanced communication
quality results in a broader awareness of the implications of an innovation, and as a
result, facilitates further involvement by employees. In a meta-analysis of 782 studies,
Damanpour (1991: 555-590) found a positive association between internal communication
(the extent of cross-functional communication and coordination) and organizational
innovativeness. The mechanisms by which ideas are shared and integrated are
frequent meetings, face-to-face contact in both horizontal and vertical relationships
and units or departments sharing decisions (Han, Kim and Srivastana, 1998: 30-45).
Madhavan and Grover, (1998: 1-12) refer to these mechanisms as the “richness of
personal interaction.”
However, organizational praxis exhibits partly completely different coordination
and communication principles. For example, Weick and Roberts (1993) and
Dougherty and Takacs (2004: 569-590) observe principles which they call “heedful
interrelating” in high reliability, but also in highly innovative organizations. In these
organizations, most routines incorporate these principles, but also specific routines
occur: people develop a shared understanding of objectives, approaches, and personal
roles and competencies, then perform their own contributions as part of the whole and
make them visible, while observing others and adapting their own behavior and
contributions towards the activities of others and the common goal.
Kellogg, Orlikowski and Yates (2006) observed some elements of Weick and
Roberts (1993: 357-381) and Dougherty and Takacs (2004: 569-590), but with a
further reduction of interrelation and communication. In their case of a high-speed
service firm, coordination happened through little direct interaction or even common
goal setting through shared artifacts. Some team members established a structure of,
for example, a deliverable to which other team members contributed. By seeing and
reviewing other peoples’ contributions, they adapted their own contributions in
iterative cycles.
2.8.2.1 Communication in Project Management
Communications are important in project management. Damanpour
(1991) demonstrated the existence of a positive relationship between internal
communication and innovation. Internal communication facilitates the dispersion of
67
ideas within an organization, increases the diversity and also contributes to the team
‘climate’. Communication can be measured by various integration mechanisms, e.g.
committees, number of meetings and contacts (Damanpour, 1991). There are also
measures of external communications, which tend to focus on whether communication is
taking place, the level at which it occurs and with whom (Cebon and Newton, 1999;
Lee et al., 1996; Rothwell, 1992; Souitaris, 2002). These measures of internal and
external communication in the literature are based on both subjective evaluations and
objective frequency counts. Subjective measures include: ‘we always consult
suppliers/customers on new product ideas’ (Parthasarthy and Hammond, 2002) and
‘degree of organization members involved and participating in extra-organizational
professional activities’ (Damanpour, 1991). Objective counts include: ‘extent of
communication amongst organizational units or groups measured by various
integrating mechanisms such as numbers of committees and frequency of meetings’
(Damper, 1991), ‘frequency of formal meetings concerning new ideas’ (Anderson and
West, 1998), and ‘how well do the technical and finance people communicate with
one another’ (Souitaris, 2002; Szakonyi, 1994).
Various approaches have been taken to modeling innovation processes
as: a series of events (Zaltman et al., 1973), a social interaction (Voss et al., 1999), a
series of transactions (Nelson and Winter, 1982) and a process of communication
(Farrukh et al., 2000). The history of project management research is partly
characterized by a debate regarding the extent to which events and activities within
the process occur in linearly sequential, discrete, identifiable stages (Zaltman et al.,
1973), or whether events are more disorganized (King, 1992) or even chaotic (Koput,
1997). However, despite these different viewpoints, there are a number of common
elements that can be summarized as the major components of innovation project
management. These are project efficiency, tools, communications and collaboration.
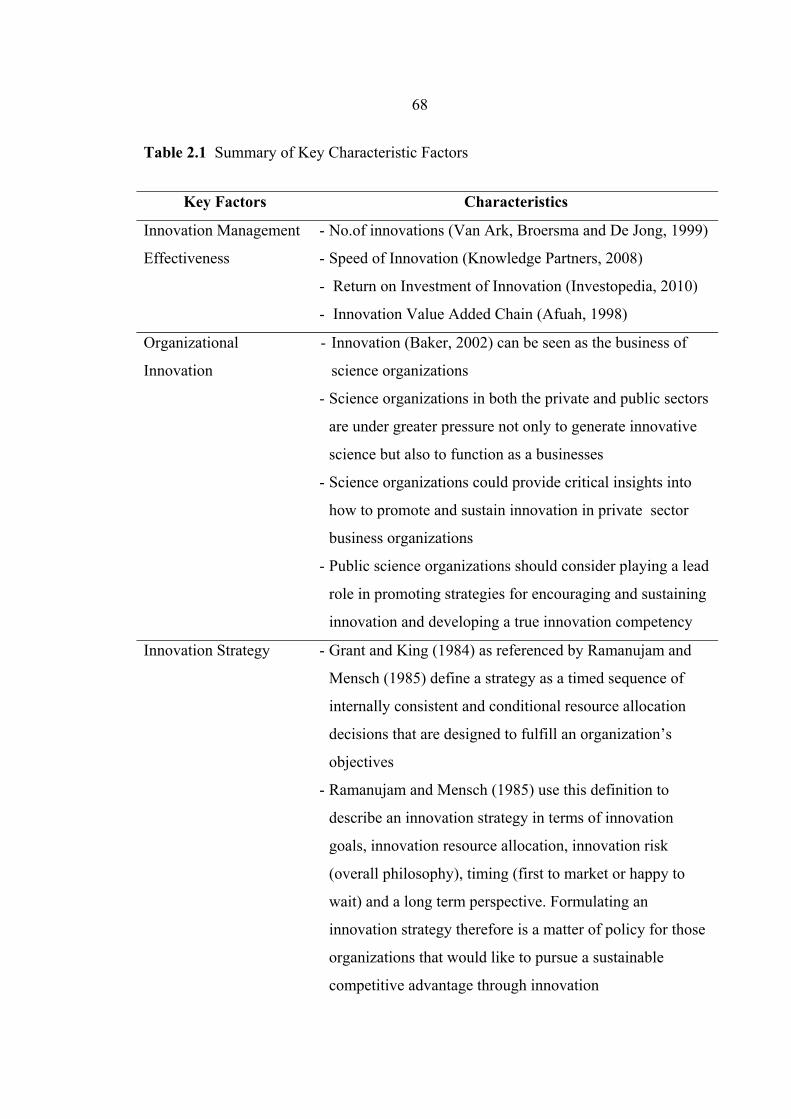
68
Table 2.1 Summary of Key Characteristic Factors
Key Factors Characteristics
Innovation Management
Effectiveness
- No.of innovations (Van Ark, Broersma and De Jong, 1999)
- Speed of Innovation (Knowledge Partners, 2008)
- Return on Investment of Innovation (Investopedia, 2010)
- Innovation Value Added Chain (Afuah, 1998)
Organizational
Innovation
- Innovation (Baker, 2002) can be seen as the business of
science organizations
- Science organizations in both the private and public sectors
are under greater pressure not only to generate innovative
science but also to function as a businesses
- Science organizations could provide critical insights into
how to promote and sustain innovation in private sector
business organizations
- Public science organizations should consider playing a lead
role in promoting strategies for encouraging and sustaining
innovation and developing a true innovation competency
Innovation Strategy - Grant and King (1984) as referenced by Ramanujam and
Mensch (1985) define a strategy as a timed sequence of
internally consistent and conditional resource allocation
decisions that are designed to fulfill an organization’s
objectives
- Ramanujam and Mensch (1985) use this definition to
describe an innovation strategy in terms of innovation
goals, innovation resource allocation, innovation risk
(overall philosophy), timing (first to market or happy to
wait) and a long term perspective. Formulating an
innovation strategy therefore is a matter of policy for those
organizations that would like to pursue a sustainable
competitive advantage through innovation
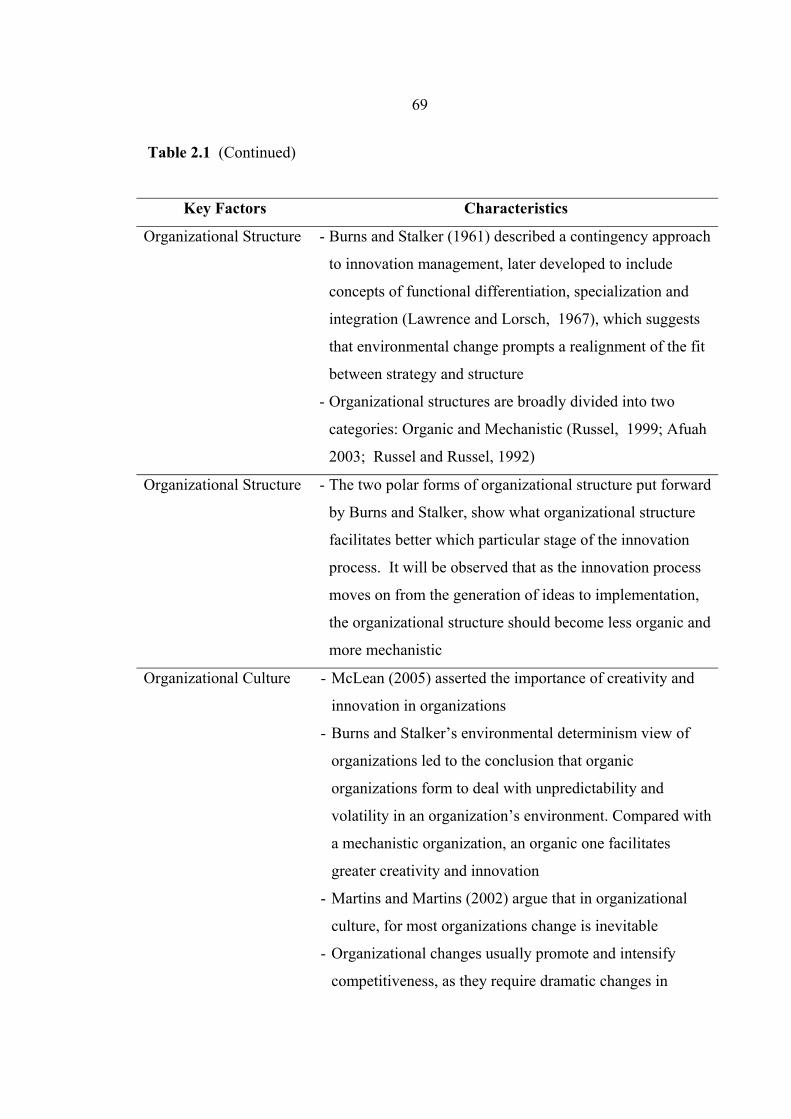
69
Table 2.1 (Continued)
Key Factors Characteristics
Organizational Structure - Burns and Stalker (1961) described a contingency approach
to innovation management, later developed to include
concepts of functional differentiation, specialization and
integration (Lawrence and Lorsch, 1967), which suggests
that environmental change prompts a realignment of the fit
between strategy and structure
- Organizational structures are broadly divided into two
categories: Organic and Mechanistic (Russel, 1999; Afuah
2003; Russel and Russel, 1992)
Organizational Structure - The two polar forms of organizational structure put forward
by Burns and Stalker, show what organizational structure
facilitates better which particular stage of the innovation
process. It will be observed that as the innovation process
moves on from the generation of ideas to implementation,
the organizational structure should become less organic and
more mechanistic
Organizational Culture - McLean (2005) asserted the importance of creativity and
innovation in organizations
- Burns and Stalker’s environmental determinism view of
organizations led to the conclusion that organic
organizations form to deal with unpredictability and
volatility in an organization’s environment. Compared with
a mechanistic organization, an organic one facilitates
greater creativity and innovation
- Martins and Martins (2002) argue that in organizational
culture, for most organizations change is inevitable
- Organizational changes usually promote and intensify
competitiveness, as they require dramatic changes in
70
Table 2.1 (Continued)
Key Factors Characteristics
strategy, technology, working systems and management style, among others. These changes require an in-depth analysis of values, beliefs and behavior patterns that guide day-to-day organizational performance. Creativity and innovation have a role to play in this change process
Project Management
- Project management by Adams, Bessant and Phelps (2006) is concerned with the processes that turn the inputs into a marketable innovation. The innovation process is complex, comprising a myriad of events and activities- some of which can be identified as a sequence and some of which occur concurrently- and it is clearly possible that innovation processes will differ to some degree, across organizations and even within organizations on a project-by-project basis
Team Cohesiveness - Innovativeness is a psychological trait that adopts new ideas or technologies as indicated by Leavitt and Walton (1975)
- Team innovativeness can certainly benefit the understanding of teams in the context of organizations. There are various dynamics of team interaction, such as the cultural composition (Hopkins and Hopkins, 2002; Balkundi et al., 2007), the existence of creativity (Kurtzberg and Amabile, 2001), trust (Leung, 2008) and shared leadership (Carson, Tesluk and Marrone, 2007)
Strategic Leadership - Facilitate and champion innovation activity, provide the necessary resources, expertise or protection (Hornsby et al., 2002)
- Develop and maintain measurement systems, assesss trategic performance and review performance indicators (Soosay, 2005)
71
Table 2.1 (Continued)
Key Factors Characteristics
Strategic Leadership - Focus on networks for collaboration with internal and
external partners, balance incremental and disruptive
innovations, develop metrics for feedback (Shelton and
Davila, 2005)
- Commitment, walking the talk, declaring the vision (Ahmed,
1998)
Coordination and
Communication
- Liker (2003) with the notion of coordinative principles or
strategies, a new way to integrate from the detailed level to
the overall project level has been made possible as well as
the formulation of related research questions
- Mintzberg (1979) categorizes previous research into three
main coordination strategies: mutual adjustment is based on
close collaboration suitable especially in simple and very
complex situations; direct supervision assumes that
managers guide and coordinate the activities of their
subordinates, while standardization of processes, output, or
training employs experts that develop rules and policies
- Johnson et al. (2001) found the communication and
participation of individuals to be critical factors in
innovation. In particular, they found that enhanced
communication quality results in a broader awareness of the
implications of an innovation
- Different coordination and communication principles. Weick
and Roberts (1993) and Dougherty and Takacs (2004),
observed principles which they call “heedful interrelating” in
high reliability, but also highly innovative organizations
72
In addition, the researcher developed the table below to summarize the key
factors which have relationships to one another together with the citations of their
authors’ works
Table 2.2 Summary of Key Factors That Influence One Another
Key Factor → Key Factor Scholar’s Name
Innovation Strategy →
Innovation Management
Effectiveness
Mphahlele (2006), Martins and Terblanche (2003), Vlok
(2005) and Dewar and Dutton (1986)
Organization Structure →
Innovation Management
Effectiveness
Mphahlele (2006), Burns and Stalker (1961), Zaltman,
Duncan and Holbek (1973) and Hage and Aiken (1970)
Organization Culture →
Innovation Management
Effectiveness
Martins and Martins (2002), Martins (2000) and Adams,
Bessant and Phelps (2006)
Project Management →
Innovation Management
Effectiveness
Adams, Bessant and Phelps (2006), Globe et al. (1973)
and Keegan and Turner (2002)
Team Cohesiveness →
Innovation Management
Effectiveness
Mullen and Cooper (1994), Langfred (1998) and Guzzo
and Dickson (1996)
Strategic Leadership →
Innovation Management
Effectiveness
Foster and Pryor (1986), Rothwell (1994) and Kanter
(1985)
Strategic Leadership →
Innovation Strategy
Pinto and Prescott (1988) and Dougherty and Cohen
(1995)
Coordination and
Communication →
Organization Structure
Burns and Stalker (1961) and Zaltman, Duncan and
Holbek (1973)
Coordination and Martins (2000)
73
Table 2.2 (Continued)
Key Factor → Key Factor Scholar’s Name
Communication →
Organization Culture
Coordination and
Communication → Project
Management
Pinto and Pinto (1990) and Damanpour (1991)
Coordination and
Communication → Team
Cohesiveness
Mullen and Cooper (1994) and Visaetsilapanonta (2006)
In summary, this chapter detailed the literature review used to construct the
conceptual framework and describes the relationships among the variables or
constructs and the research findings of the key literature related to the research. These
areas consist of innovation management effectiveness, innovation strategy, organization
structure, organization culture, project management, team cohesiveness, strategic
leadership, and coordination and communication.
CHAPTER 3
CONCEPTUAL THEORY
In this chapter, the researcher describes the significant conceptual theories-
theoretical resources management and structure and performance – and their relationship
to innovation management effectiveness. The core assumptions and statements are
also explained with regard to the contingency approach to the management and
adoption of innovation to the organization.
3.1 Resource-Based View
3.1.1 Resource-Based View
Fortuin (2006) regarded the resource-based view of the firm (RBV) as an
influential theoretical framework for understanding how competitive advantage within
firms is achieved and how that advantage can be sustained over time (Schumpeter,
1934; Penrose, 1959; Wernerfelt, 1984; Prahalad and Hamel, 1990; Barney, 1991;
Nelson, 1991; Peteraf, 1993; Teece et al., 1997; Scholten, 2006). This perspective
focuses on a firm’s internal resources and how these are acquired from factor markets,
e.g. the labor and financial markets. In contrast to the industrial perspective that views
resources as immediately accessible, the RBV stresses the inherent immobility or
stickiness of valuable factors of production and the time and cost required to
accumulate those resources (Peteraf, 1993). This causes firms to be idiosyncratic
because throughout their history they accumulate different physical assets and often,
more importantly, acquire different intangible organizational assets of tacit learning
and dynamic routines (Dosi, 1988). Competitive imitation of these assets is only
possible through the same time consuming process of irreversible investment or
learning that the firm itself underwent (Dierickx and Cool, 1989). The irreversible
investments made in these assets function as commitments that deter the duplication
of valuable product-market positions and secure the distinctive value of the firm
75
(Ghemawat, 1991). Such assets also produce ‘path dependency’ (Dosi et al., 1988).
So a firm's history, strategy and organization combine to yield the unique bundle of
resources it possesses. Had it made different decisions in the past, its path of asset
accumulation and hence the firm today would be different. Moreover, the future
strategy of the firm is determined by its history with its strategy constrained by, and
dependent on, the current level of resources (Collis, 1991). As a consequence, in RBV
thought, Chandler’s (1962) famous adage ‘Structure follows strategy’ is merely
reversed to ‘Strategy follows structure’.
In short, in the resource-based view, competitive advantage rests within the
firm's idiosyncratic and difficult-to-imitate resources. A resource refers to an asset or
input to production (tangible or intangible) that an organization owns, controls or has
access to on a semi-permanent basis (Helfat and Peteraf, 2003). It follows that a firm’s
resources include all those attributes that enable it to conceive of and implement
strategies. They can be divided into four types: financial resources, physical resources,
human resources and organizational resources (trust, teamwork, friendship and
reputation). In RBV the firm’s resources must be unique in four ways. First, they must
add value. The resources must enable the firm to exploit external opportunities or
neutralize external threats. Second, they must be rare. Ideally, no competing firms
possess the same resources. Third, they must be inimitable. Competitors should not be
able to imitate the resource either by duplicating it or by developing a substitute
resource. For example, fast food discount coupons are a very poor competitive
resource because competitors can quickly and easily print their own (duplication) or
simply offer a temporary lower price (substitution). However, another set of barriers
impedes imitation in advanced industrial countries. This is the system of intellectual
property rights, such as patents, trade secrets, and trademarks. Intellectual property
protection is not uniform across products, processes, and technologies, and is best
thought of as an island in a sea of open competition. It presents an imitation barrier in
certain contexts, although one should not overestimate its importance (Omta and
Folstar, 2005). Finally, the firm must have the ability to exploit. the resources. The
firm should have the systems, policies, procedures, and processes in place to take full
competitive advantage of the resources.
76
RBV builds on two basic assumptions about the firm’s resources: (1) that they
can vary significantly across firms (assumption of resource heterogeneity) and (2) that
their differences can be stable (assumption of resource immobility). Furthermore,
RBV considers firms to be rent-seekers rather than profit maximizers (Rumelt, 1987).
Rent can be defined as the excess return to a resource over its opportunity costs. In
other words, the payment received above and beyond that amount necessary to retain
or call the resource into use. Rent-seeking behavior therefore emphasizes the
important role of entrepreneurship and innovation. Firms continuously seek new
opportunities to generate rents rather than contenting themselves with the normal
avenues for profit. If control over scarce resources is the source of economic profits,
then it follows that such issues as skill acquisition, the management of knowledge and
know-how (Shuen, 1994) and learning become fundamental strategic issues. The
more tacit the firm's knowledge, the harder it is for its competitors to replicate it.
When the tacit component is high, imitation may well be impossible.
3.1.2 Resource-Based View in Economics and Management
Within the Economics and Management literature, Lemaire (2003) suggested
that the resource-based view has been gaining broad intellectual support among
scholars interested in issues related to sustainable competitive advantage. The
resource-based view perspective is useful for studying innovation for it adopts a
dynamic approach that emphasizes the importance of resources accumulation.
The resource-based view has its roots in the work of Edith Penrose’s “Theory
of the Growth of the Firm” (1959). The resource-based view of organizations focuses
on resources that can be sources of competitive advantage within the industry. The
basic types of resources providing this competitive advantage are: physical capital
resources, organizational capital resources, and human capital resources (Barney,
1991). The concept of human capital is that employees have the skills, experience,
and knowledge that provide economic value to the firm. Barney and Wright (1998)
noted that in order for human capital to contribute to sustainable competitive
advantage, it must create value, remain hard to imitate, and appear rare. Verona
(1999) shows the strength of the resource-based view in dealing with new product
development. A resource-based view of product development identifies the knowledge
77
required for successful new product development, in the different dimensions of
functional and integrative capabilities.
Within the resource- based view, Miller and Shamsie (1996) distinguished
property- based resources controlled by property rights and knowledge-based
resources protected from imitation by knowledge barriers. The property rights include
contracts, deeds of ownership and patents. The benefits of property-based resources
are quite specific and fixed and thus the resources are adapted for the environment
they have been developed for. Knowledge-based resources are of greater utility in an
uncertain changing environment they give firms the skills to adapt their products to
market need and to deal with competitive challenges.
3.1.3 A Resource-Based View of the Firm’s Capacity to Innovate
According to Kostopoulos, Spanos and Prastacos (2001), one of the most
important research questions in management literature, traditionally, has been the
relationships among innovation, firm structural characteristics (e.g., formalization,
centralization, specialization) and industrial environment. Hereafter, when we use the
term ‘innovation’ we are referring to organizational (or firm-level) innovation.
Organizational innovation is generally defined as an internally generated or externally
purchased device, system, policy, process, product or service that is new to the
adopting organization (Damanpour, 1991). From this traditional perspective,
innovation represents a means of transforming an organization, whether as a response
to changes in its internal or external environment or as a proactive action taken to
influence its environment. It is supposed that differences in the firm’s innovative
activities are basically explained by industry and organizational structure characteristics
(Kimberly and Evanisko, 1981; Damanpour, 1991; Wolfe, 1994; Duncan, 1976; Daft,
1992). In contrast, more behaviorally oriented research streams, and especially
evolutionary economics (Nelson and Winter, 1982) have studied innovation activities
and performance not only in terms of organizational structure or industry characteristics
but also in terms of resources and capabilities (Dosi, 1988).
With the same line of reasoning, a growing body of literature that embraces
the resource-based view of the firm (Brown and Eisenhardt, 1997; Henderson and
Cockburn, 1994; Iansiti and Clark, 1994; Leonard-Barton, 1995) offers new insights
78
into innovation management. According to this influential perspective, the presence of
different organizational resources and capabilities positively affects the outcome of
the innovation process and, thus, can be used to extend the findings -gained by past
research- on the firm’s capacity to innovate.
3.1.4 The Resource-Based View, the Knowledge-Based View and
Organizational Learning Theory
Vanhaverbeke, Cloodt and Van de Vrande (2008) considered the resources,
competencies and knowledge dimension of the open innovation model as being
clearly embedded in the resource-based view, the knowledge-based view and the
organizational learning theory of the firm. The resource-based view of the firm finds
its origins in the work of Wernerfelt (1984) and Penrose (1959). A core feature of this
management theory is that value is created when the firm consists of a unique
collection of difficult-to-imitate resources, competencies and capabilities (Barney,
1986, 1991; Grant, 1996; Wernerfelt, 1984). To create a competitive advantage and
capture an above-normal rate of returns (e.g. rents) these resources must, by
definition, be scarce, valuable and reasonably durable (Barney, 1991). One work that
is closely related to the resource-based view is a study by Grant (1996) -one of the
founders of the knowledge-based view. The knowledge-based view is an outgrowth of
the resource-based view to the extent that it focuses upon knowledge as the
strategically most important resource of the firm (Conner and Prahalad, 1996; Grant,
1996; Nonaka, 1991; Spender, 1989). Knowledge is also a central issue in several
other research traditions that stress the importance of both organizational learning and
the transfer and diffusion of innovative capabilities within the firm (Boisot, 1995;
Grant, 1996; Huber, 1991; Levitt and March, 1988).
The resource-based view and the knowledge-based view argue that firms can
create and capture value according to the unique bundle of resources they possess and
the differences between these resources are held responsible for the differences in
performances between firms (Bierly and Chakrabarti, 1996). In other words,
proponents of the resource-based view or the knowledge-based view emphasize the
fact that a sustainable competitive advantage is based on those resources (knowledge)
and capabilities that are owned and controlled within the boundaries of a single firm
(Dyer and Singh, 1998).
79
An important question that we have to ask ourselves in that respect is: "What
is the value of this introspective viewpoint centered on the firm itself, in relation to
open innovation?" Although the resource- based view emphasizes that a firm’s
competitive advantage results from difficult-to-imitate bundles of resources within the
boundaries of the firm, we argue that from the perspective of open innovation these
resources should not be closed off within one single firm. Rather scarce, valuable and
reasonably durable resources of different (previously independent) companies should
be brought together in order to offer value for the targeted customers. Consequently, a
firm’s critical resources should extend beyond its boundaries and enable resource
flows (knowledge flows) with external firms.
Subsequently, whereas the resource-based view and the knowledge-based
view stresses such issues as independence and the crucial role of competition between
autonomous companies based on the unique set of resources and capabilities they
possess, open innovation emphasizes the interdependence of complementary
resources of firms to introduce an innovative product in the market. This implies that
we are in need of an extension of the resource-based view and the knowledge-based
view with respect to the main theoretical premise underlying open innovation. Part of
this task has been carried out in the area of technology alliances (Kale and Singh,
1999; Kale et al., 2002; Grant and Baden-Fuller, 2004; Gulati and Sytch, 2007) but
more work is required to understand open innovation practices in terms of the
resource or knowledge access and acquisition.
3.2 Organizational Theory
3.2.1 Theories of Structure and Performance
Sine, Mitsuhashi and Kirsch (2006) elaborated upon the theory of structure
and performance, by stating that research on the formal structure of an organization is
typically defined as “the sum total of the ways in which it divides its labor into
distinct tasks and then achieves coordination among them” (Mintzberg, 1979: 2). The
notion that the formal structure is “the documented, official relationships among
members of the organization,” and informal structure is the “unofficial relationships
within the workgroup” (Mintzberg, 1979: 9–10) in organizations hearkens back to the
80
very origins of organizational theory. Weber’s classic text on bureaucracy proclaimed
that the bureaucratic organization, with its clear-cut division of activities, assignment
of roles, and hierarchically arranged authority, is “technically superior to all other
forms of organization” (1947: 196). According to Weber, the formal structures that
made up the modern organization enabled greater precision, speed, task knowledge,
and continuity, while reducing friction and ambiguity. Building on Merton (1949) and
Durkheim (1997), Burns and Stalker (1961) proposed a contingent relationship
between formal structure and organizational performance, arguing that organizations
with organic structures, or loosely coupled networks of workers, are better adapted to
dynamic environments. Organizations with the Weberian mechanistic structure
(bureaucracy), where work is “distributed among specialist roles within a clearly
defined hierarchy” (Burns and Stalker, 1961: 6), were viewed as being more suitable
for static environments.
During the past four decades, a host of studies have examined Burns and
Stalker’s propositions and have generally confirmed that organizations in dynamic
environments do better if their structures are more organic (Aiken and Bacharach,
1994; French, 1980; Covin and Slevin, 1989; however, note Wally and Baum’s work
(1994) as an exception). The majority of the empirical tests of this theory have used
samples of mature organizations.
Despite this strong research tradition, little is known about whether or not this
theory applies to newly created ventures in emerging industries. Stinchcombe (1965)
suggested that the relative lack of structure that characterizes new ventures is a
liability, not a benefit. He argued that this liability of newness is particularly difficult
to overcome in emerging economic sectors that lack industry norms about work
processes and organizational design. In this study, we focused on three attributes of
new venture structures: role formalization, specialization, and administrative intensity
(Pugh, Hickson, Hinings, MacDonald, Turner and Lupton, 1963; Stinchcombe, 1965)
and their association with new venture performance.
Since the seminal work of Burns and Stalker (1961), researchers have
considered the organic organizational form, characterized by a lack of formally
defined tasks and an emphasis on horizontal as opposed to vertical coordination to be
the exemplar structure for firms operating in turbulent environments. Although past
81
research supports this proposition for large, established firms, is it also true for small,
new organizations in turbulent, emerging economic sectors? In this study, we explore
the limits of this conventional wisdom by examining how structural features influence
performance during the earliest phase of organizational existence in a turbulent setting
assumed to be inhospitable to mechanistic structure.
In dynamic contexts, new ventures and large, mature organizations face
fundamentally different structural challenges (Cameron and Quinn, 1983; Gilbert,
2005, 2006; Kimberly, 1979; Shane, 2003). These differences are particularly evident
in emergent economic sectors, which are typically characterized by turbulence and
uncertainty (Aldrich, 1999; Sine and David, 2003). As a result of embedded formalized
roles and routines, functional silos, and administration by managers insulated by
multiple bureaucratic layers from the changing realities of the marketplace, large,
mature organizations often have difficulty responding to environmental turbulence
(Mintzberg, 1978). In contrast, new ventures in emerging sectors initially lack
formalized roles and routines and are small, flexible, and innovative; their employees
and founding teams have frequent interactions with customers. These firms are, in
essence, founded as a reaction to opportunities in a changing environment. Instead of
needing more flexibility, these organizations suffer from a structural “liability of
newness” (Stinchcombe, 1965).
Herein lies the puzzle. On the one hand, both theorists and practitioners
suggest that in turbulent environments, organizations should become more organic
(Burns and Stalker, 1961). On the other hand, in his classic essay, Stinchcombe
(1965) argued that one of the key reasons that new organizations in new economic
sectors are at a disadvantage visa`- vis older, established firms is their lack of
structure, which results in role ambiguity and uncertainty. High levels of uncertainty
impede individual and organizational action (David and Han, 2003; O’Toole and
Meier, 2003). Formalized organizational roles reduce work ambiguity, enable
individual focus, learning, and decision making, decrease the cost of coordination,
and increase efficiency (Perrow, 1986)- all outcomes of vital importance for new
ventures with meager resources. Moreover, Stinchcombe (1965) suggested that new
ventures in emerging sectors not only need formalization and specialization, but also
require greater managerial resources than mature firms. Whereas mature firms are often
82
impeded by intensive administration and the structural inertia of legacy bureaucracies,
new ventures need extensive managerial resources and a structural framework to
reduce uncertainty and increase organizational efficiency and responsiveness.
3.2.2 Organization Structure: Lessons from Other Innovative Organizations
In all organizations (International Fund for Agricultural Development-IFAD,
2007), new ideas that improve effectiveness and efficiency emerge naturally from
people’s desires for better solutions. However, high-performing organizations
enhance this process by carefully managing the following:
1) People’s competence and motivations. Research on innovative
organizations (Amabile and Conti, 1999) shows that primary requirements are staff
who are knowledgeable in their disciplines, who have good creative problem-solving
skills and who are intrinsically motivated. Moreover, creative thinking is an essential
element of leadership, especially when bringing about change (Puccio, Murdoch and
Mance, 2007).
2) How challenges are understood and goals set. Innovative organizations
analyze their challenges from different perspectives (Christensen, 1997) and empower
staff with a clear sense of ownership of the challenges (Van Gundy, 2005). Direct
responsibility for meeting new and complex challenges greatly motivates staff.
3) Diversity and networks among staff and with the outside world. New
solutions emerge at the intersection of disciplines, industries and approaches, because
intersections invite looking at challenges from different perspectives and applying
unobvious solutions (Johansson, 2004). Innovative organizations create teams and
networks that emphasize the diversity and cross-pollination of ideas, and they connect
staff with people outside the organization through innovation networks that link
people from different worlds and that broker new ideas. A similar brokering process
has recently led innovative businesses to begin looking at poor people as a vast,
relatively untapped market, and to develop ways of building them into their value
chains (Prahalad, 2004).
4) Rapid prototyping of new ideas. Research indicates that 90 per cent
of successful innovations fail the first time they are tried (Christensen, 1997). Rather
83
than extensively designing ideas ex ante, innovative organizations have processes that
rapidly implement, test, evaluate, revise and re-implement ideas in order to refine
them.
5) A system for retaining ideas with potential. One of the keys to
developing new ideas is to maintain a variety of half-baked and failed ideas that might
be of use in a different application (Hardington, 2003).
6) Core business and innovation processes. For innovative organizations,
innovation is not an occasional activity. They have specific processes to help them
define and redefine challenges, collect ideas from unusual sources, find unobvious
solutions, encourage creative thinking, and test and revise ideas before discarding
them. All these elements are built into core operations (Leonard-Barton and Swap,
2005).
7) The organizational environment. In innovative organizations, managers
actively model innovative thinking, recognize innovators and encourage staff to
network and to take time to think (Hardington, 2003). Moreover, systems, processes
and rewards are consistent with the focus on innovation.
3.3 Contingency Theory
3.3.1 Core Assumptions and Statements
Wiio (1979) and Goldhaber (1993) concluded that differences in innovation
effectiveness are a function both of type of organization and composition of work
force (age, sex, education, tenure). The innovation process is influenced by many
internal and external constraints from the organization and its subsystems. The
constraints determine the status of the organization of the environmental supra system
and the state of each subsystem. The innovation process is thus contingent upon
external and internal stimuli and upon the degree of freedom of states within the
system allowed by the organizational constraints. Some internal contingencies are:
structural contingencies, output, and demographic, spatiotemporal and traditional
contingencies. External contingencies are: economic, technological, legal, sociopolitical
cultural and environmental contingencies. Persons interested in organizational
innovation should consider such questions as the following. What are the contingencies
84
under which organizations’ innovative ability is best when confronting their environment?
Specifically, do different types of organizations have different absorptive capacity
needs? Do organizational internal contingencies (demographics such as age, sex,
education, seniority, management level, and amount of communication training)
affect innovation effectiveness? Are functional diversity and corporate culture better
predictors of innovation effectiveness?
3.3.2 Contingency Approach to Management
During the past decades there has been evident a new trend in the study of
organizational phenomena. Underlying this approach is the idea that the internal
functioning of organizations must be consistent with the demands of organizational
task, technology, or external environment, and the needs of its members if the
organization is to be effective. Rather than searching for the one best way to organize
under all conditions, investigators have increasingly tended to examine the
functioning of organizations in relation to the needs of their particular members and
external pressures facing them.
A contingency approach to management occurs when the behavior of one
department, individual, work group, or entire organization is dependent on its
relationship to others. Basically, this approach seems to be leading to the development
of a “contingency” theory of organization with the appropriate internal states and
processes of the organization contingent upon external requirements and member
needs.
It has never been and never will be the task of theory and science to prescribe
what should be done. Theory and science are intended as a search for fundamental
relationships, for basic techniques, and for organization of available knowledge – all,
it is hoped, based on clear concepts. How these are applied in practice depends on the
situation. Effective management is always contingency, or situational, management.
The essence of the contingency is that management practices should be
generally consistent with tasks, the external environment, the relative needs of the
members, and other contingency variables. The contingency variables that need to be
considered and their relative emphasis will depend on the general type of managerial
issues or problems being considered. In brief, one of management’s goals in using the
85
contingency approach would be to create an appropriate match-up among the
contingency variables.
The contingency approach has been used in many managerial areas by several
researchers. These include the contingency approach to organizational design
(Woodward, 1965; Thomson, 1967; Lawrence and Lorch, 1967; Galbraith, 1971), the
contingency approach to motivation (Vroom, 1964; Litwin and Stringer, 1968;
Lawler, 1974), and the contingency approach to leadership (Argyris, 1964; Fiedler,
1967). Some researchers have used a contingency approach to study the relationship
between technology and strategy (Newman, 1972; King, 1978), between information
system strategy and business strategy (Chan et al., 1997), between organizational
complexity and innovation (Damanpour, 1996), among executive judgement,
organizational congruence, and firm performance (Rackoff et al., 1985), between task
and work-unit design (Van de Ven and Delbecq,1974; Kim 1988; Umanath and Kim,
1992), among others.
This research employs a contingency approach, which seeks to understand the
interrelationships between innovation effectiveness and the various components of an
organization. When an information system acts in response to various service requests
by other organizational components, the information system’s behavior is contingent
on the demands placed upon it.
3.3.3 Contingency Rules Theory
Smith’s contingency rules theory (1984) is an example of a rules approach to
persuasion. Smith utilizes the idea of cognitive schemas, expectations about the
attributes that a given person or policy will have or expectancies about the
consequences of behaving in a particular manner. These schemata function as
contingency rules that both shape the way something is viewed and structure
behavior. Smith suggests that rules and schemata explain persuasion better than the
traditional concept of attitude. According to Smith’s contingency rules theory, rules
are used to create responses to persuasive messages. Self-evaluative rules are
associated with our self-concept and our image. Adaptive rules are those that will
apply effectively in a particular situation – the rules most likely to generate a positive
outcome. Behavioral contingency rules are contextual. In some situations, certain
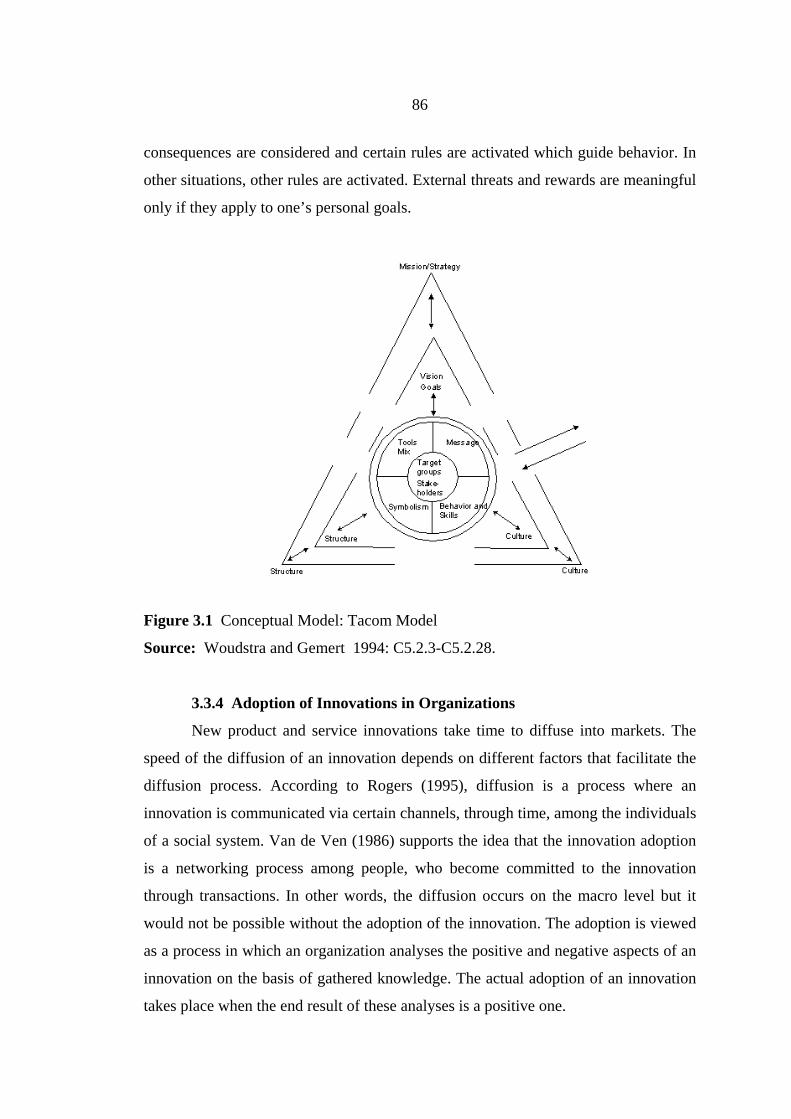
86
consequences are considered and certain rules are activated which guide behavior. In
other situations, other rules are activated. External threats and rewards are meaningful
only if they apply to one’s personal goals.
Figure 3.1 Conceptual Model: Tacom Model
Source: Woudstra and Gemert 1994: C5.2.3-C5.2.28.
3.3.4 Adoption of Innovations in Organizations
New product and service innovations take time to diffuse into markets. The
speed of the diffusion of an innovation depends on different factors that facilitate the
diffusion process. According to Rogers (1995), diffusion is a process where an
innovation is communicated via certain channels, through time, among the individuals
of a social system. Van de Ven (1986) supports the idea that the innovation adoption
is a networking process among people, who become committed to the innovation
through transactions. In other words, the diffusion occurs on the macro level but it
would not be possible without the adoption of the innovation. The adoption is viewed
as a process in which an organization analyses the positive and negative aspects of an
innovation on the basis of gathered knowledge. The actual adoption of an innovation
takes place when the end result of these analyses is a positive one.
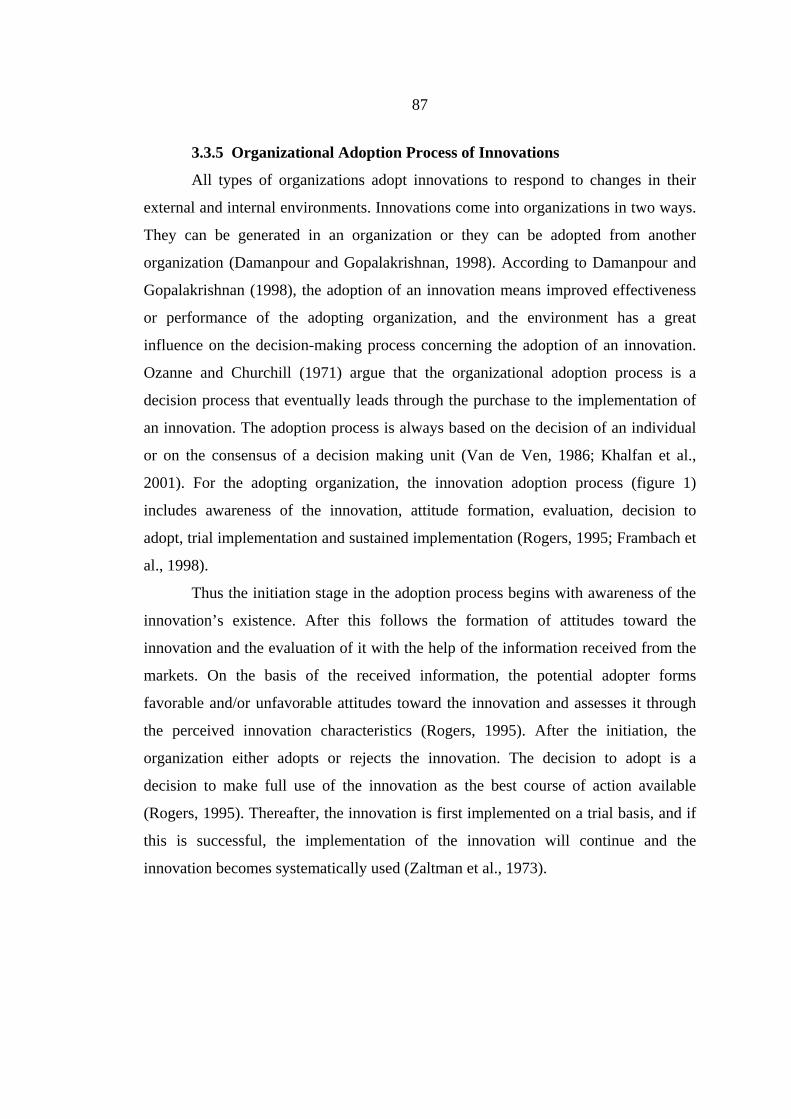
87
3.3.5 Organizational Adoption Process of Innovations
All types of organizations adopt innovations to respond to changes in their
external and internal environments. Innovations come into organizations in two ways.
They can be generated in an organization or they can be adopted from another
organization (Damanpour and Gopalakrishnan, 1998). According to Damanpour and
Gopalakrishnan (1998), the adoption of an innovation means improved effectiveness
or performance of the adopting organization, and the environment has a great
influence on the decision-making process concerning the adoption of an innovation.
Ozanne and Churchill (1971) argue that the organizational adoption process is a
decision process that eventually leads through the purchase to the implementation of
an innovation. The adoption process is always based on the decision of an individual
or on the consensus of a decision making unit (Van de Ven, 1986; Khalfan et al.,
2001). For the adopting organization, the innovation adoption process (figure 1)
includes awareness of the innovation, attitude formation, evaluation, decision to
adopt, trial implementation and sustained implementation (Rogers, 1995; Frambach et
al., 1998).
Thus the initiation stage in the adoption process begins with awareness of the
innovation’s existence. After this follows the formation of attitudes toward the
innovation and the evaluation of it with the help of the information received from the
markets. On the basis of the received information, the potential adopter forms
favorable and/or unfavorable attitudes toward the innovation and assesses it through
the perceived innovation characteristics (Rogers, 1995). After the initiation, the
organization either adopts or rejects the innovation. The decision to adopt is a
decision to make full use of the innovation as the best course of action available
(Rogers, 1995). Thereafter, the innovation is first implemented on a trial basis, and if
this is successful, the implementation of the innovation will continue and the
innovation becomes systematically used (Zaltman et al., 1973).
88
Figure 3.2 Model of Stages in the Innovation-Decision Process
Source: Rogers, 1995.
3.4 HRM and Innovation
Jørgensen, Becker and Matthews (2009) explained Human Resource Management
(HRM) may be defined broadly in terms of all management activities impacting
relationships between organization and employee (Beer et al., 1984) or more specifically
as a system of operational functions such as staffing, selection, job design, training
and (career) development, performance appraisal and compensation (Pfeffer, 1998).
Further, there is an increasing tendency to also consider more strategic level functions
such as human resource planning and forecasting (Koch and McGrath, 1996).
Although there is considerable discussion regarding the relative importance of
specific HRM practices and how they should be configured, there is general
agreement concerning the importance of the alignment between HRM practices and
organizational strategy (Lengnick-Hall and Lengnick-Hall, 1988).
Kesting, Müller, Jørgensen, and Ulhøi (2009) cited Armstrong (2006: 3) as
defining Human Resource Management (HRM) as a strategic and coherent approach
to the management of an organization’s most valued assets – the people working there
who individually and collectively contribute to the achievement of its objectives.
Generally, HRM is associated with rather broadly-defined functions such as staffing,
training and development, remuneration, job design and performance appraisal and
how these can help support improved performance. Although the initial focus in the
field of HRM was often on concrete measures of performance such as quality and
productivity (Cascio, 1991), there is currently much interest on how HRM can support
learning, change and innovation behaviors (Scarbrough and Carter, 2000).
1. Know-ledge
2. Persuasion 3. Decision
4. Imple-mentation
5. Confir-mation
89
3.5 Definition of Effectiveness and Efficiency
Effectiveness is a broad concept. It implicitly takes into consideration a range
of variables. Etzioni (1964) defines organizational effectiveness (OE) as the degree to
which an organization realizes its goals while efficiency is a more limited concept that
pertains to the internal workings of the organization. Efficiency is the amount of
resources used to produce a unit of output. Pfeffer and Salancik (1978) defines
effectiveness is an external standard applied to the output or activities of an
organization whereas efficiency is an internal standard of organizational performance.
Cameron (1986) argues that organizational effectiveness necessarily deals with values
and preferences that cannot be determined objectively.
Although there is general agreement that effectiveness is something all
organizations should seek, there is no consensus on what the concept means; and the
criteria for assessment remains unclear. This is because organizations typically pursue
multiple and often conflicting goals and also tend to differ according to the nature of
the organization and its external environment. Moreover, managers conceptualize
organization effectiveness differently; consequently, there is also disagreement over
the most appropriate strategy for attaining effectiveness. Another reason for the lack
of agreement about the nature of effectiveness is the ambiguity of the concept.
Organizational analysts often incorrectly assume that it is relatively easy to identify
the various assessment criteria, but the criteria are somewhat intangible. They depend
largely on who is doing the evaluating and the specific frame of reference. The
problems are pointed out in attempts to identify the relevant aspects of effectiveness
that can serve as useful evaluating criteria.
There is no best criterion for evaluating an organization’s effectiveness. There
is neither a single goal that everyone can agree upon nor a consensus on which goals
take precedence over others. Therefore, the concept of OE itself is subjective. It
depends on who the evaluator is and the interest they represent.
3.5.1 The Relationship between Innovation Effectiveness and Attitude
toward Future Adoption
A positive perception of the benefits of implemented innovations will then also
have knock- on effects to future innovations. Many innovation researchers ( Damanpour,
90
1991; Frambach and Schillewaert, 2002; Lehman, Greener and Simpson, 2002) have
identified positive beliefs and motivational readiness as facilitators of implementing
new innovations; much of this positive attitude will come from past experiences with
innovation. Because implementing an innovation can be accompanied by risk,
uncertainty, and expenditures of money, time and effort, organizations must perceive
the direct benefits from innovations to make them worthwhile (West, 2001). This
suggestion is supported by a study of the implementation of organizational websites
by 288 Chamber of Commerce members in the United States (Flanagin, 2000). This
study suggested that the perceived benefit from a technology was one of the best
predictors of its future adoption. Likewise, a survey of 298 companies in Hong Kong
indicated that perceived the benefit is positively related to attitude towards adoption
(Au and Enderwick, 2000).
In conclusion, the table below provides a summary of the conceptual theories.
Table 3.1 Summary of the Conceptual Theories
Conceptual Theories Characteristics
1. Resource-Based View 1.1 Resource-Based View
- Fortuin (2006) asserted that the resource-based view of the
firm (RBV) is an influential theoretical framework for understanding how competitive advantage within firms is achieved and how that advantage can be sustained over time (Schumpeter, 1934; Penrose, 1959; Wernerfelt, 1984; Prahalad and Hamel, 1990; Barney, 1991; Nelson, 1991; Peteraf, 1993; Teece et al., 1997; Scholten, 2006)
- This perspective focuses on a firm’s internal resources and how these are acquired from factor markets, e.g. the labor and financial markets
- RBV builds on two basic assumptions about the firm’s resources: (1) that they can vary significantly across firms (assumption of resource heterogeneity) and (2) that their differences can be stable (assumption of resource immobility)
91
Table 3.1 (Continued)
Conceptual Theories Characteristics
1.2 Resource-Based
View in Economics and
Management
1.3 A Resource-Based
View of the Firm’s
Capacity to Innovate
1.4 The Resource-Based
View, the Knowledge-
Based View and
Organizational Learning
Theory
- Within the Economics and Management literature, Lemaire
(2003) suggested that the resource-based view has been
gaining broad intellectual support among scholars
interested in issues related to sustainable competitive
advantage
- The resource-based view perspective is useful for studying
innovation for it adopts a dynamic approach that
emphasizes the importance of resources accumulation
- According to Kostopoulos, Spanos and Prastacos (2001),
one of the most important research questions traditionally
in the management literature has been the relationships
among innovation, firm structural characteristics (e.g.,
formalization, centralization, specialization) and industrial
environment
- From this view, innovation represents a means of
transforming an organization, whether as a response to
changes in its internal or external environment or as a
proactive action taken to influence its environment
(Damanpour, 1991)
- Vanhaverbeke, Cloodt and Van de Vrande (2008)
described the resources, competencies and knowledge
dimension of the open innovation model as,- clearly being
embedded in the resource-based view, the knowledge-
based view and the organizational learning theory of the
firm
2. Organizational Theory
2.1 Theories of Structure
and Performance
- Sine, Mitsuhashi and Kirsch (2006) elaborated upon the
theory of structure and performance, by stating that
92
Table 3.1 (Continued)
Conceptual Theories Characteristics
2.2 Organization
Structure: Lessons from
other Innovative
Organizations
- research on the formal structure, which is the structure of
an organization, is typically defined as “the sum total of the
ways in which it divides its labor into distinct tasks and
then achieves coordination among them” (Mintzberg, 1979: 2)
- Stinchcombe (1965) suggested that new ventures in
emerging sectors not only need formalization and
specialization, but also require greater managerial resources
than mature firms
- Whereas mature firms are often impeded by intensive
administration and the structural inertia of legacy
bureaucracies, new ventures need extensive managerial
resources and a structural framework to reduce uncertainty
and increase organizational efficiency and responsiveness
- In all organizations (International Fund for Agricultural
Development-IFAD, 2007), new ideas that improve
effectiveness and efficiency emerge naturally from
people’s desire for better solutions
- High-performing organizations enhance this process by
carefully managing:
(1) People’s competence and motivations
(2) How challenges are understood and goals set.
(3) Diversity and networks among staff and with the
outside world.
(4) Rapid prototyping of new ideas.
(5) A system for retaining ideas with potential.
(6) Core business and innovation processes.
(7) The organizational environment.
93
Table 3.1 (Continued)
Conceptual Theories Characteristics
3. Contingency Theory
3.1 Core Assumptions
and Statements
- Core: Wiio (1979) and Goldhaber (1993) concluded that
differences in innovation effectiveness are a function both
of type of organization and composition of work force (age,
sex, education, tenure). The innovation process is
influenced by many internal and external constraints from
the organization and its subsystems
- The innovation process is thus contingent upon external
and internal stimuli and upon the degree of freedom of
states within the system allowed by the organizational
constraints
3.2 Contingency
Approach to
Management
3.3 Adoption of
Innovations in
Organizations
3.4 Organizational
Adoption Process of
Innovations
- Over recent decades, there has been evident a new trend in
the study of organizational phenomena. Underlying this
approach is the idea that the internal functioning of
organizations must be consistent with the demands of
organizational task, technology, or external environment,
and the needs of its members if the organization is to be
effective
- Rogers (1995) argued that adoption is viewed as a process
in which an organization analyses the positive and negative
aspects of an innovation on the basis of gathered
knowledge
- The actual adoption of an innovation takes place when the
end result of these analyses is a positive one
- According to Damanpour and Gopalakrishnan (1998), the
adoption of an innovation means improved effectiveness or
performance of the adopting organization, and the
environment has a great influence on the decision-making
process of the adoption of an innovation

94
In summary, this chapter employs the conceptual theory of the resource-based
view theory and organizational contingency theory to explain the determinants of
seven contingency prediction factors, which form the constructs of the conceptual
framework and hypotheses model.
CHAPTER 4
CONCEPTUAL FRAMEWORK AND HYPOTHESES
This chapter describes the overall conceptual framework and model which are
interconnected and explained by the influential theories of both the resources-based
view and the contingency approach to the investigation, with a hypotheses model of
the determinant factors of innovation management effectiveness and the assumption
of the seven contingency prediction factors.
4.1 Conceptual Overview
The variables in this framework are drawn from an integration of the
contingency approach and the resource-based view approach of the determinants of
the organizational innovation management effectiveness as proposed by prominent
scholars (discussed in Chapters 2 and 3). The variables are conceptualized according
to the organizational environmental perspective. Innovation management is implemented
in organizations and always operates as an open system. Changes in one component
of an organization frequently have an effect on the other variables; that is to say, all
variables are interconnected. To be effective, the determinant factors must align with
the other organizational variables-innovation strategy, organization structure,
organization culture, project management, team cohesiveness, strategic leadership and
coordination and communication.
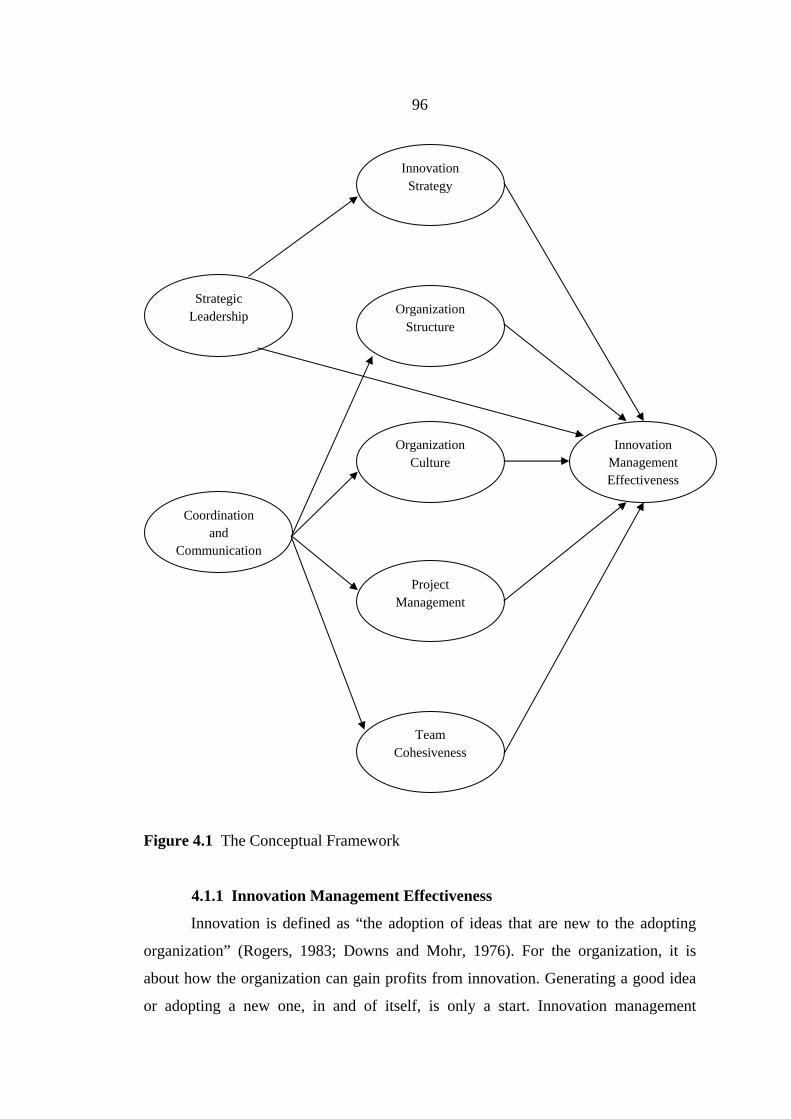
96
Figure 4.1 The Conceptual Framework
4.1.1 Innovation Management Effectiveness
Innovation is defined as “the adoption of ideas that are new to the adopting
organization” (Rogers, 1983; Downs and Mohr, 1976). For the organization, it is
about how the organization can gain profits from innovation. Generating a good idea
or adopting a new one, in and of itself, is only a start. Innovation management
Strategic Leadership
Innovation Strategy
Coordination and
Communication
Innovation Management Effectiveness
Organization Structure
Organization Culture
Project Management
Team Cohesiveness
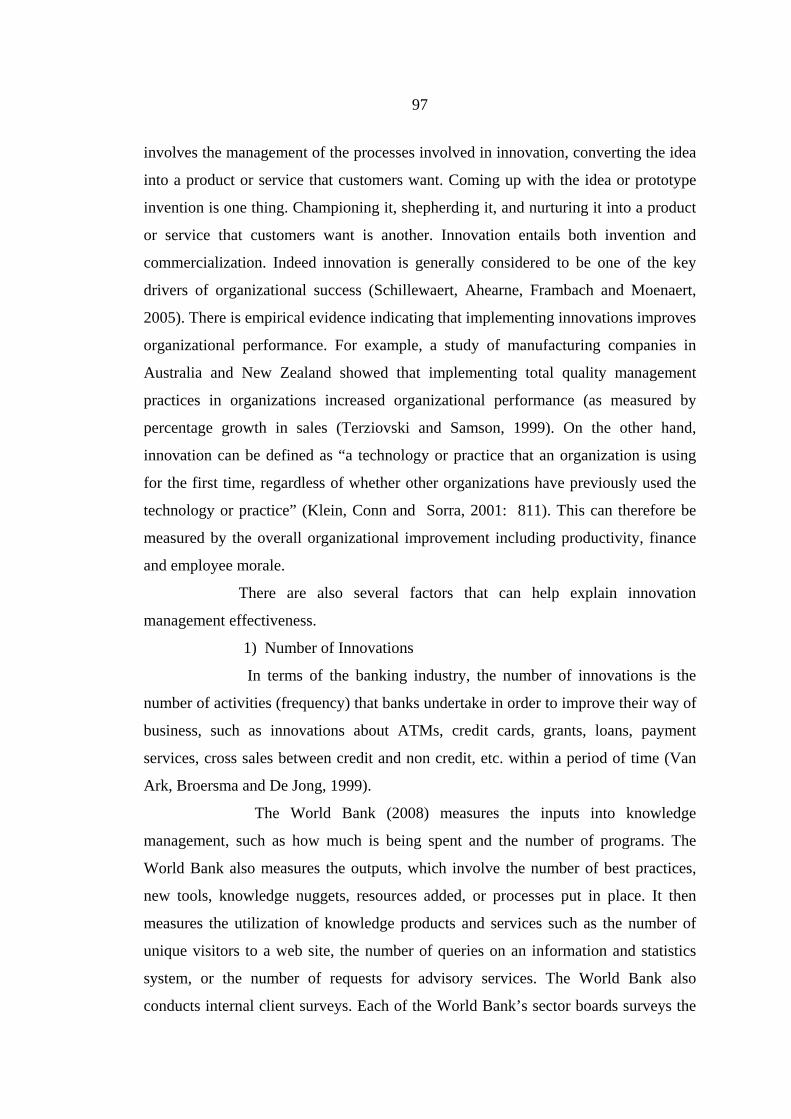
97
involves the management of the processes involved in innovation, converting the idea
into a product or service that customers want. Coming up with the idea or prototype
invention is one thing. Championing it, shepherding it, and nurturing it into a product
or service that customers want is another. Innovation entails both invention and
commercialization. Indeed innovation is generally considered to be one of the key
drivers of organizational success (Schillewaert, Ahearne, Frambach and Moenaert,
2005). There is empirical evidence indicating that implementing innovations improves
organizational performance. For example, a study of manufacturing companies in
Australia and New Zealand showed that implementing total quality management
practices in organizations increased organizational performance (as measured by
percentage growth in sales (Terziovski and Samson, 1999). On the other hand,
innovation can be defined as “a technology or practice that an organization is using
for the first time, regardless of whether other organizations have previously used the
technology or practice” (Klein, Conn and Sorra, 2001: 811). This can therefore be
measured by the overall organizational improvement including productivity, finance
and employee morale.
There are also several factors that can help explain innovation
management effectiveness.
1) Number of Innovations
In terms of the banking industry, the number of innovations is the
number of activities (frequency) that banks undertake in order to improve their way of
business, such as innovations about ATMs, credit cards, grants, loans, payment
services, cross sales between credit and non credit, etc. within a period of time (Van
Ark, Broersma and De Jong, 1999).
The World Bank (2008) measures the inputs into knowledge
management, such as how much is being spent and the number of programs. The
World Bank also measures the outputs, which involve the number of best practices,
new tools, knowledge nuggets, resources added, or processes put in place. It then
measures the utilization of knowledge products and services such as the number of
unique visitors to a web site, the number of queries on an information and statistics
system, or the number of requests for advisory services. The World Bank also
conducts internal client surveys. Each of the World Bank’s sector boards surveys the
98
community concerning what knowledge products are most effective, how often are
they visited, and the respondents’ contributions over the last year.
2) Speed of Innovation
Companies increasingly need to make the stark choice of accepting a
rapid decrease in market share or becoming better informed in order to respond to
customers’ increasing appetite for new and better solutions (Knowledge Partners,
2008).
As a result of increased global competition, products and markets that
remain without change are very rapidly becoming commoditized. It is the intense
competition that drives commoditization and downward pressure on the profit
margins.
In many companies the only way to make a healthy profit margin is to
continually innovate and bring customers new experiences and benefits. For this they
can enjoy an “early mover” premium. As business cycles continue to speed up and
therefore the life-cycles of products get shorter, organizations have to be more agile
and able to continuously innovate to respond to new changes in customers’ needs and
perceptions.
3) Return on Investment of Innovation
A performance measure is used to evaluate the effectiveness of a
company's investment in new products or services. The return on innovation
investment is calculated by comparing the profits of new products or service sales to
the research, development and other direct expenditures generated in creating these
new products or services (Investopedia, 2010).
4) Innovation Value-Added Chain
Afuah (1998) professed that the innovation value-added chain model
can explain both why an incumbent can outperform new entrants at radical
innovation, and why it may also fail at incremental innovation (Porter, 1985). It
differs from previous models in that while these other models focus on the impact of
innovation on a firm’s capabilities and competitiveness, it focuses on what the
innovation does to the competiveness and capabilities of a firm’s suppliers,
customers, and complementary innovators.
99
The innovation may have a different impact at each of the stages of the
innovation value-added chain, suggesting that an innovation that is incremental to the
manufacturer may not be to suppliers, customers, or complementary innovators. Thus
incumbents for whom an innovation is competence destroying may still do well if the
innovation is competence enhancing to their value chain, and relations with the chain
are important and difficult to establish. The implications are that a firm’s success in
exploiting an innovation may depend as much on what the innovation does to the
capabilities of the firm as on what it does to the capabilities of its innovation value-
added chain of suppliers, customers and complementary innovators.
Organizational Performance Improvement
Innovation effectiveness is defined as organizational performance
improvement which results from implementing innovations. That is, how an organization
perceives the overall organizational improvement (including factors such as productivity,
finance, and employee morale) which arises specifically from implementing innovations
(Klein et al., 2001).
4.1.2 Innovation Strategy
Ramanujam and Mensch (1985) defined innovation strategy as a timed
sequence of internally consistent and conditional resource allocation decisions that are
designed to fulfill an organization’s objectives in terms of innovation goals,
innovation resource allocation, innovation risk (overall philosophy), timing (first to
market or happy to wait) and a long term perspective. Formulating an innovation
strategy therefore is a matter of policy for those organizations that would like to
pursue a sustainable competitive advantage through innovation.
4.1.2.1 Innovation Focus
Innovation focus involves guidelines for developing innovation and
promoting innovation and goals which are effected to managerial attitude in norm
support for innovation effectiveness. These are the expectations, approval and
practical support of attempts to introduce new concept and improve the way of doing
things in the work environment. Measures are mostly qualitative in nature and explore
perceptions about the extent to which respondents recognize factors to be present or
absent (Damanpour, 1991). Innovation focus will therefore widen from incremental
improvements to system innovations.
100
4.1.3 Organization Structure
Mphahlele (2006) stated that the organization structure represents the
development of human resources in different parts of the organization for doing
specific work. Some organizational structures are more advanced in supporting
innovation than others. For example, a steeply hierarchical organization that is
overloaded with strict rules tends to stifle innovation because decision making tends
to be slow. These can be measured in terms of the degree of specific rules and
procedures and the degree of division of function.
4.1.3.1 Rules and Procedures
Centralization, the concentration of decision-making authority at the top
of the organizational hierarchy, and formalization, the degree of emphasis on
following rules and procedures in role performance, have both been shown to have a
negative impact on organizational innovation (Burns and Stalker, 1961; Damanpour,
1991). Indeed, rigidity in rules and procedures may prohibit organizational decision-
makers from seeking new sources of information (Vyakarnam and Adams, 2001).
4.1.3.2 Division of Function
Burns and Stalker (1961) put forward a contingency approach to
innovation management, later developed to include concepts of functional differentiation,
specialization and integration (Lawrence and Lorsch, 1967), which suggests that
environmental change prompts a realignment of the fit between strategy and structure.
That is, to perform effectively, an organization must be appropriately differentiated,
specialized and integrated.
4.1.4 Organization Culture
The topic of organizational culture often presents two contradictory images.
The first is of culture as “the glue that holds the organization together”, and the
second regards it as a central part of the change process (Denison, 2001: 347).
According to Read (1996: 223), post-industrial organizations of today are knowledge-
based organizations and their success depends on creativity, innovation, discovery and
inventiveness. The importance of creativity and innovation is emphasized as follows
by Zaltman et al. (West and Farr, 1990: 3-4) “The importance of new ideas cannot be
overstated. Ideas and their manifestations as practices and products are the core of
101
social change.” Measuring organization culture concerns basic cultural norms,
continuous learning support and reward and recognition that it influences creativity
and innovation.
4.1.4.1 Cultural Norms
In the midst of change, organizations and leaders are trying to create an
institutional framework in which creativity and innovation are accepted as basic
cultural norms. It has become clear that “the unwritten rules of the game” (the norms
of behavior) and shared values influence morale, performance and the application of
creativity and innovation in many different ways (Martins and Martins, 2002).
4.1.4.2 Reward and Recognition
In terms of support mechanisms, reward and recognition is a determinant
of organizational culture that influences creativity and innovation (Martins, 2000:
171). While in terms of behavior that encourages innovation, continuous learning
support is also a determinant of organizational culture that influences creativity and
innovation (Martins, 2000: 171).
4.1.5 Project Management
Project management refers to project activity in regard to the management of
innovation studies within organizations on a project-by-project basis. It can be seen
that the research streams for both project management and innovation have developed
in relative isolation from one another, and the connection between the two domains
(project and innovation) is quite often implicit (Keegan and Turner, 2002).
4.1.5.1 Innovation Support
There are several important links between projects and innovation
through three instruments as innovation support, namely context supportive for
innovation, slack resources and greater level of redundancy. In such a situation, the
risk exists that priorities may shift away from projects that are likely to create returns
in the long run, like innovation support, toward measures that promise to address
urgent and short-term challenges. In order to maintain long-term support for
innovation, there is therefore a need for better demonstrating the actual and/or
potential benefits of innovation support instruments.
102
4.1.6 Team Cohesiveness Cohesiveness within teams is determined by the desire of its individuals to
remain a part of that team because their individual needs are being met (Turner et al., 1984.). While some research would suggest that cohesiveness can eventually lead to a myopic view taken by the group through groupthink (Janis, 1972), it is still believed that the closeness brought about through cohesiveness can facilitate the members of a team working together more freely with more communication to develop more innovative ideas.
4.1.6.1 Cohesion Mullen and Copper (1994) indicated that an adequate level of cohesion
impacts the performance of innovation teams through its positive influence on communication and coordination. Langfred (1998) also used the degree to which team members identify positively with the team to measure the cohesion shown to influence team innovation.
4.1.6.2 Composition and Longevity For composition, Wallmark (1973) studied the importance of size in
research groups and found a positive correlation between group size and group productivity. This was interpreted as resulting from the greater number of possible contacts and consequent intellectual synergy. While in terms of longevity, Lovelace (1986) suggests that research scientists will be more creative if not assigned to permanent groups, and Nystrom (1979) too argues for the advantages of relatively short-lived groups, at least as far as the early stages of the innovation process are concerned.
4.1.7 Strategic Leadership The strategic leadership view argues that the strategic incentive to invest in an
innovation or the failure to exploit it as a result of destroyed competence comes only after a firm’s top management has recognized the potential of the innovation (Afuah, 1996). Top management makes the decisions to invest in an innovation, or if such decisions are made by lower level managers, they still reflect the beliefs and values of top management (Hambrick and Mason, 1984). However, it is incentive for strategic leadership to invest in an innovation or its ability to embrace and exploit the innovation as a function of the extent to which the firm’s top management recognizes the potential of an innovation is a function of its managerial logic, or view of the
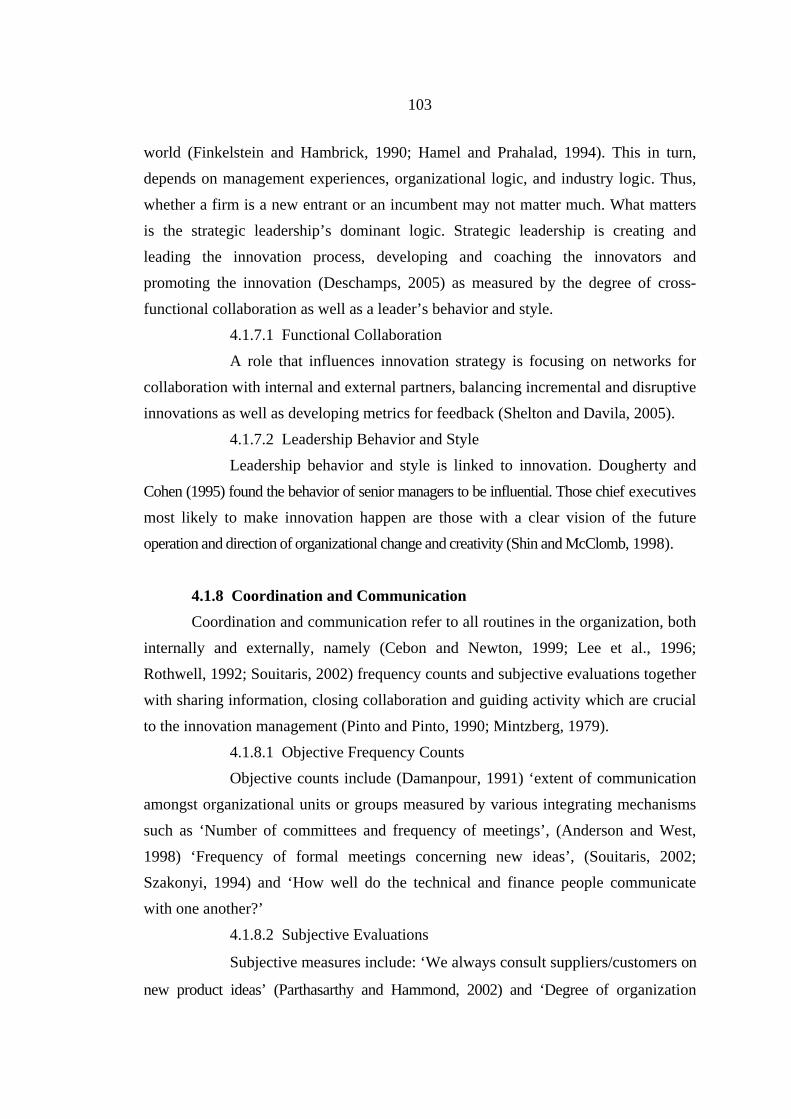
103
world (Finkelstein and Hambrick, 1990; Hamel and Prahalad, 1994). This in turn, depends on management experiences, organizational logic, and industry logic. Thus, whether a firm is a new entrant or an incumbent may not matter much. What matters is the strategic leadership’s dominant logic. Strategic leadership is creating and leading the innovation process, developing and coaching the innovators and promoting the innovation (Deschamps, 2005) as measured by the degree of cross-functional collaboration as well as a leader’s behavior and style.
4.1.7.1 Functional Collaboration A role that influences innovation strategy is focusing on networks for
collaboration with internal and external partners, balancing incremental and disruptive innovations as well as developing metrics for feedback (Shelton and Davila, 2005).
4.1.7.2 Leadership Behavior and Style Leadership behavior and style is linked to innovation. Dougherty and
Cohen (1995) found the behavior of senior managers to be influential. Those chief executives most likely to make innovation happen are those with a clear vision of the future operation and direction of organizational change and creativity (Shin and McClomb, 1998).
4.1.8 Coordination and Communication Coordination and communication refer to all routines in the organization, both
internally and externally, namely (Cebon and Newton, 1999; Lee et al., 1996; Rothwell, 1992; Souitaris, 2002) frequency counts and subjective evaluations together with sharing information, closing collaboration and guiding activity which are crucial to the innovation management (Pinto and Pinto, 1990; Mintzberg, 1979).
4.1.8.1 Objective Frequency Counts Objective counts include (Damanpour, 1991) ‘extent of communication
amongst organizational units or groups measured by various integrating mechanisms such as ‘Number of committees and frequency of meetings’, (Anderson and West, 1998) ‘Frequency of formal meetings concerning new ideas’, (Souitaris, 2002; Szakonyi, 1994) and ‘How well do the technical and finance people communicate with one another?’
4.1.8.2 Subjective Evaluations
Subjective measures include: ‘We always consult suppliers/customers on
new product ideas’ (Parthasarthy and Hammond, 2002) and ‘Degree of organization
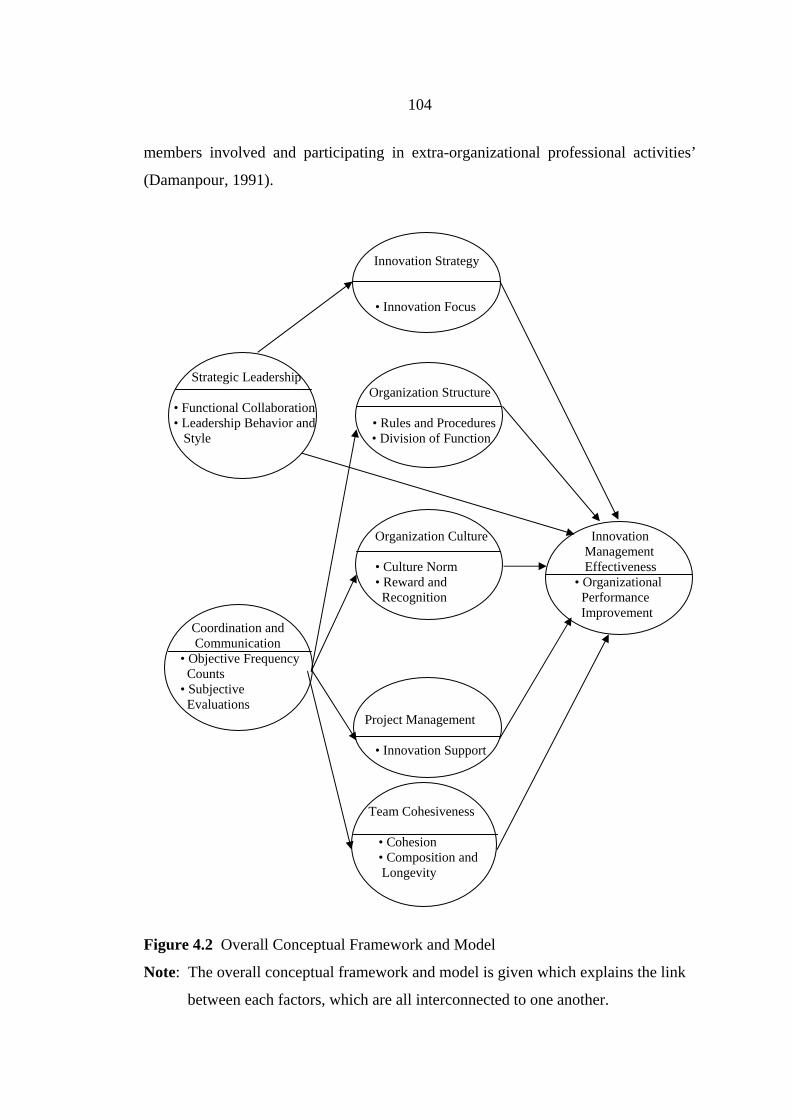
104
members involved and participating in extra-organizational professional activities’
(Damanpour, 1991).
Innovation Strategy
• Innovation Focus
Strategic Leadership
Organization Structure • Functional Collaboration • Leadership Behavior and • Rules and Procedures Style • Division of Function
Organization Culture Innovation
Management • Culture Norm Effectiveness • Reward and • Organizational Recognition Performance
Improvement Coordination and Communication
• Objective Frequency Counts • Subjective Evaluations
Project Management
• Innovation Support Team Cohesiveness
• Cohesion • Composition and Longevity
Figure 4.2 Overall Conceptual Framework and Model
Note: The overall conceptual framework and model is given which explains the link
between each factors, which are all interconnected to one another.
105
4.2 Research Hypotheses
The study is based on the investigation of the determinant factors of
innovation management effectiveness and the assumption that the seven contingency
prediction factors-innovation strategy, organization structure, organization culture,
project management, team cohesiveness, strategic leadership and coordination and
communication- determine innovation effectiveness as a result of sustaining
competitive advantage. The hypotheses are below:
H1: Innovation strategy has a positive effect on innovation management
effectiveness
H2: Organization structure has a positive effect on innovation management
effectiveness
H3: Organization culture has a positive effect on innovation management
effectiveness
H4: Project management has a positive effect on innovation management
effectiveness
H5: Team cohesiveness has a positive effect on innovation management
effectiveness
H6: Strategic leadership has a positive effect on innovation management
effectiveness
H6-1: Strategic leadership has a positive effect on innovation strategy
H7-1: Coordination and communication has a positive effect on organization
structure
H7-2: Coordination and communication has a positive effect on organization
culture
H7-3: Coordination and communication has a positive effect on project
management
H7-4: Coordination and communication has a positive effect on team
cohesiveness
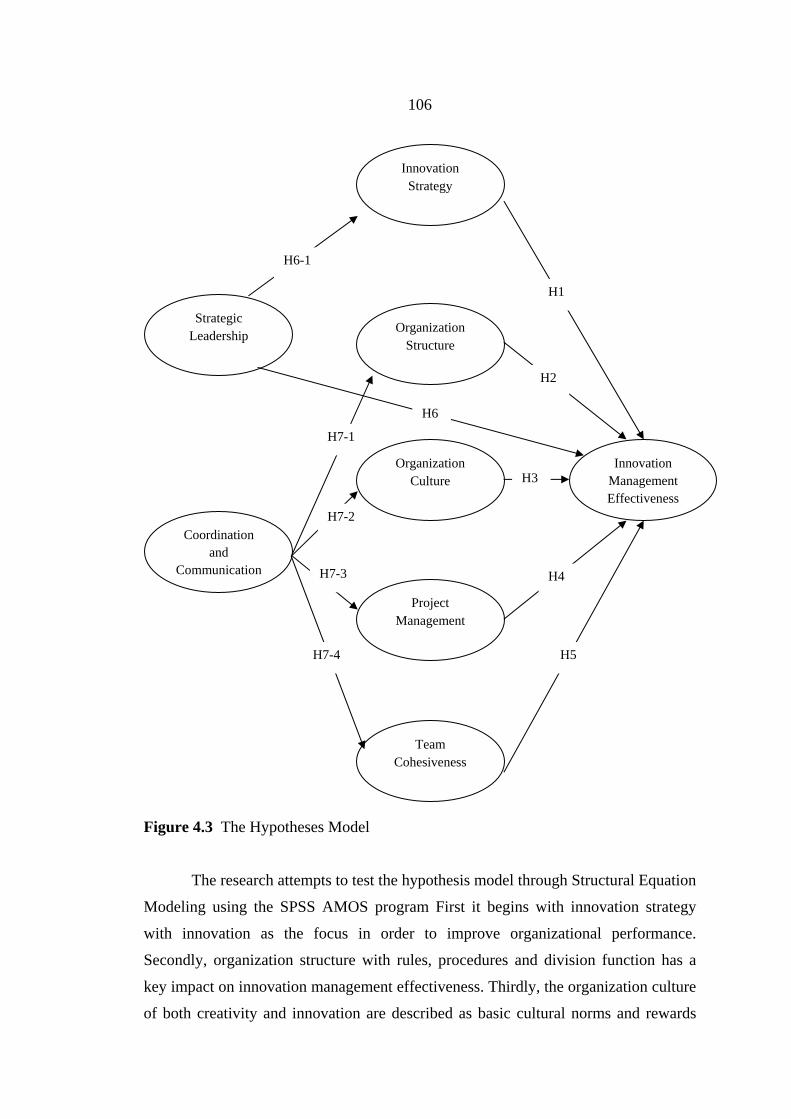
106
Figure 4.3 The Hypotheses Model
The research attempts to test the hypothesis model through Structural Equation
Modeling using the SPSS AMOS program First it begins with innovation strategy
with innovation as the focus in order to improve organizational performance.
Secondly, organization structure with rules, procedures and division function has a
key impact on innovation management effectiveness. Thirdly, the organization culture
of both creativity and innovation are described as basic cultural norms and rewards
Innovation Management Effectiveness
Organization Structure
Organization Culture
Project Management
Team Cohesiveness
Innovation Strategy
H1
H2
H3
H4
H5
Strategic Leadership
Coordination and
Communication
H6
H6-1
H7-1
H7-2
H7-3
H7-4
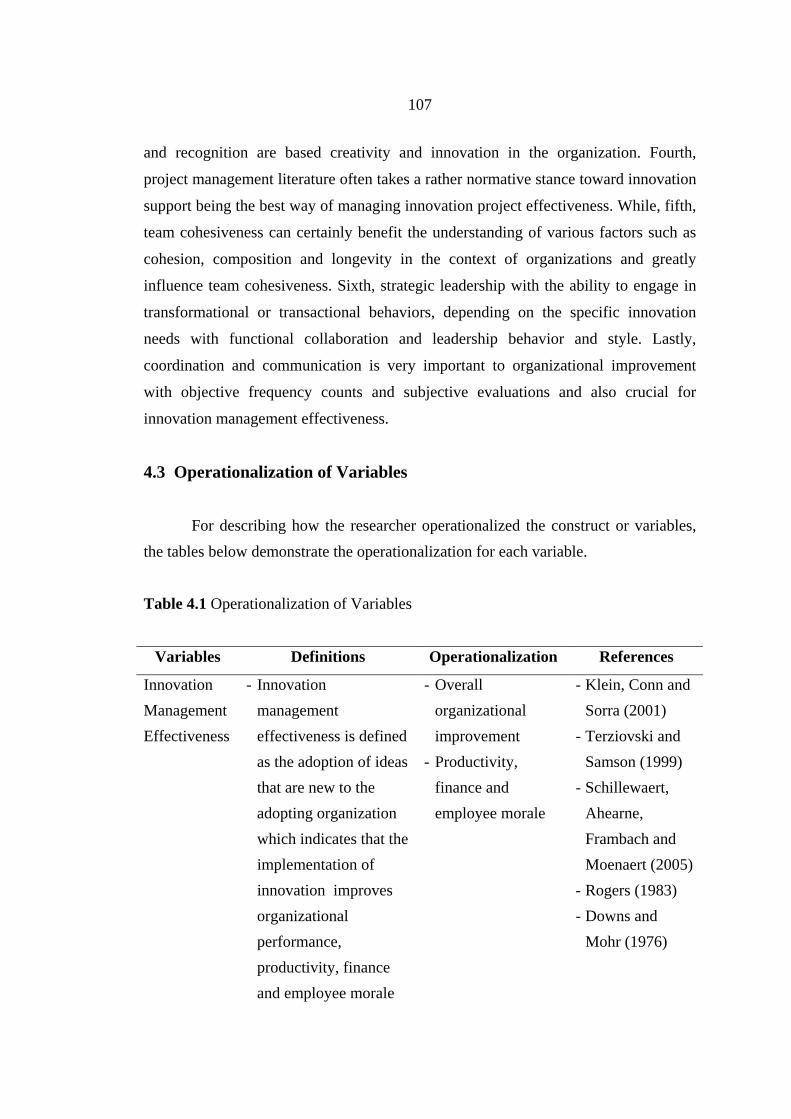
107
and recognition are based creativity and innovation in the organization. Fourth,
project management literature often takes a rather normative stance toward innovation
support being the best way of managing innovation project effectiveness. While, fifth,
team cohesiveness can certainly benefit the understanding of various factors such as
cohesion, composition and longevity in the context of organizations and greatly
influence team cohesiveness. Sixth, strategic leadership with the ability to engage in
transformational or transactional behaviors, depending on the specific innovation
needs with functional collaboration and leadership behavior and style. Lastly,
coordination and communication is very important to organizational improvement
with objective frequency counts and subjective evaluations and also crucial for
innovation management effectiveness.
4.3 Operationalization of Variables For describing how the researcher operationalized the construct or variables, the tables below demonstrate the operationalization for each variable. Table 4.1 Operationalization of Variables
Variables Definitions Operationalization References
Innovation Management Effectiveness
- Innovation management effectiveness is defined as the adoption of ideas that are new to the adopting organization which indicates that the implementation of innovation improves organizational performance, productivity, finance and employee morale
- Overall organizational improvement
- Productivity, finance and employee morale
- Klein, Conn and Sorra (2001)
- Terziovski and Samson (1999)
- Schillewaert, Ahearne, Frambach and Moenaert (2005)
- Rogers (1983) - Downs and
Mohr (1976)
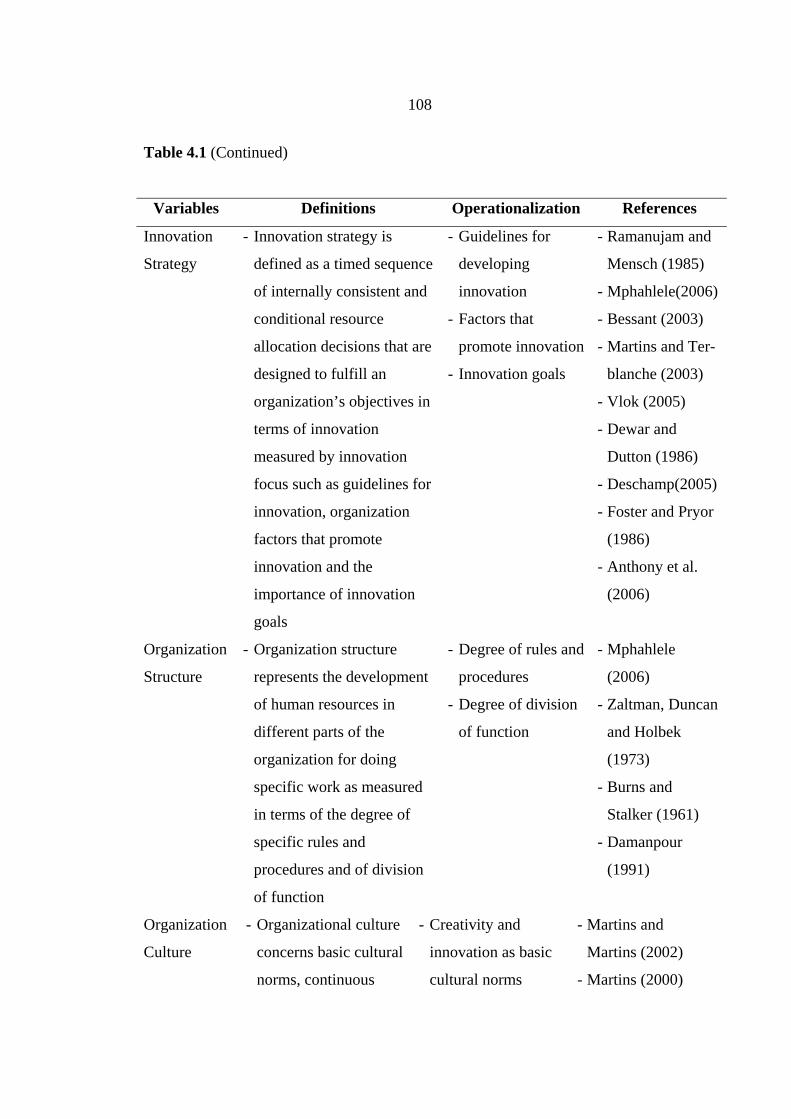
108
Table 4.1 (Continued)
Variables Definitions Operationalization References
Innovation
Strategy
- Innovation strategy is
defined as a timed sequence
of internally consistent and
conditional resource
allocation decisions that are
designed to fulfill an
organization’s objectives in
terms of innovation
measured by innovation
focus such as guidelines for
innovation, organization
factors that promote
innovation and the
importance of innovation
goals
- Guidelines for
developing
innovation
- Factors that
promote innovation
- Innovation goals
- Ramanujam and
Mensch (1985)
- Mphahlele(2006)
- Bessant (2003)
- Martins and Ter-
blanche (2003)
- Vlok (2005)
- Dewar and
Dutton (1986)
- Deschamp(2005)
- Foster and Pryor
(1986)
- Anthony et al.
(2006)
Organization
Structure
- Organization structure
represents the development
of human resources in
different parts of the
organization for doing
specific work as measured
in terms of the degree of
specific rules and
procedures and of division
of function
- Degree of rules and
procedures
- Degree of division
of function
- Mphahlele
(2006)
- Zaltman, Duncan
and Holbek
(1973)
- Burns and
Stalker (1961)
- Damanpour
(1991)
Organization
Culture
- Organizational culture
concerns basic cultural
norms, continuous
- Creativity and
innovation as basic
cultural norms
- Martins and
Martins (2002)
- Martins (2000)
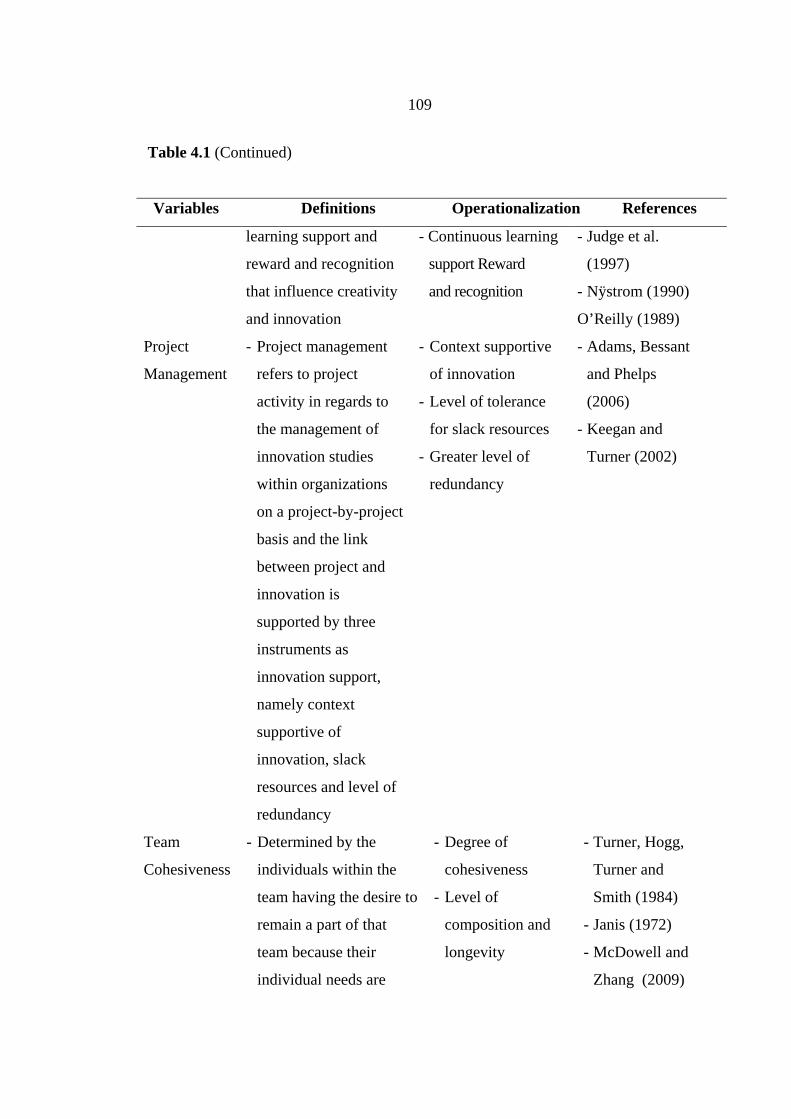
109
Table 4.1 (Continued)
Variables Definitions Operationalization References
learning support and
reward and recognition
that influence creativity
and innovation
- Continuous learning
support Reward
and recognition
- Judge et al.
(1997)
- Nÿstrom (1990)
O’Reilly (1989)
Project
Management
- Project management
refers to project
activity in regards to
the management of
innovation studies
within organizations
on a project-by-project
basis and the link
between project and
innovation is
supported by three
instruments as
innovation support,
namely context
supportive of
innovation, slack
resources and level of
redundancy
- Context supportive
of innovation
- Level of tolerance
for slack resources
- Greater level of
redundancy
- Adams, Bessant
and Phelps
(2006)
- Keegan and
Turner (2002)
Team
Cohesiveness
- Determined by the
individuals within the
team having the desire to
remain a part of that
team because their
individual needs are
- Degree of
cohesiveness
- Level of
composition and
longevity
- Turner, Hogg,
Turner and
Smith (1984)
- Janis (1972)
- McDowell and
Zhang (2009)
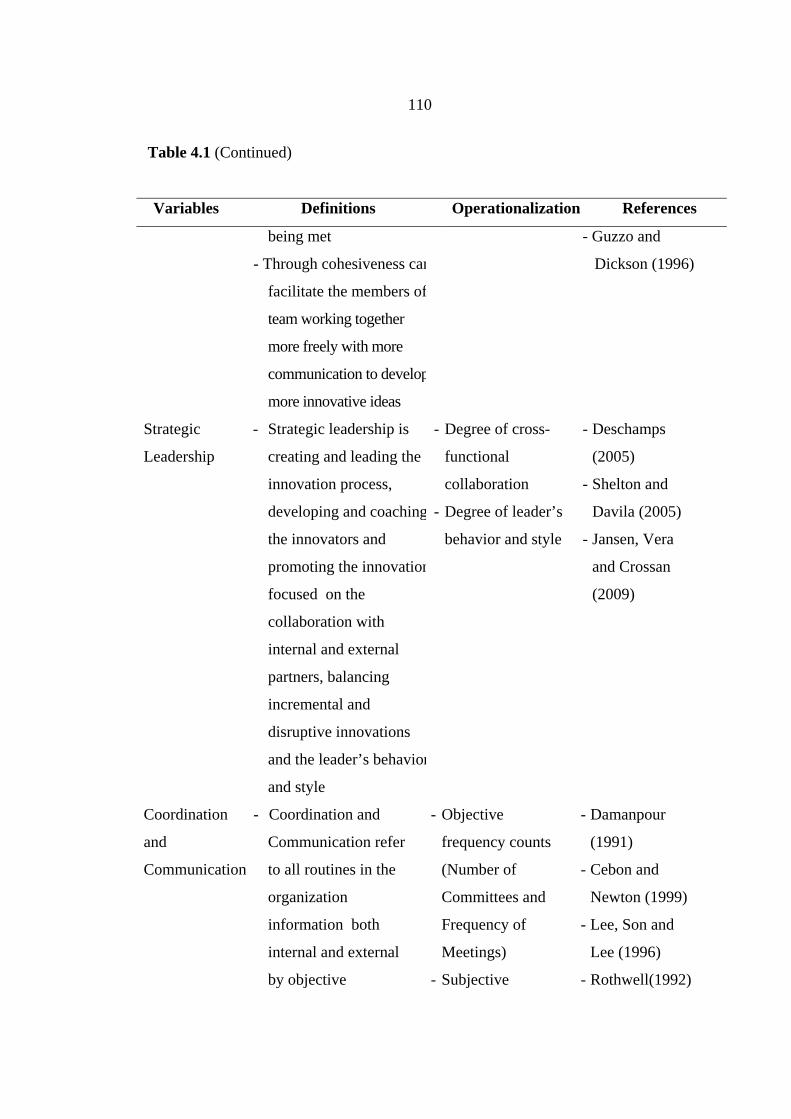
110
Table 4.1 (Continued)
Variables Definitions Operationalization References
being met
- Through cohesiveness can
facilitate the members of
team working together
more freely with more
communication to develop
more innovative ideas
- Guzzo and
Dickson (1996)
Strategic
Leadership
- Strategic leadership is
creating and leading the
innovation process,
developing and coaching
the innovators and
promoting the innovation
focused on the
collaboration with
internal and external
partners, balancing
incremental and
disruptive innovations
and the leader’s behavior
and style
- Degree of cross-
functional
collaboration
- Degree of leader’s
behavior and style
- Deschamps
(2005)
- Shelton and
Davila (2005)
- Jansen, Vera
and Crossan
(2009)
Coordination
and
Communication
- Coordination and
Communication refer
to all routines in the
organization
information both
internal and external
by objective
- Objective
frequency counts
(Number of
Committees and
Frequency of
Meetings)
- Subjective
- Damanpour
(1991)
- Cebon and
Newton (1999)
- Lee, Son and
Lee (1996)
- Rothwell(1992)
111
Table 4.1 (Continued)
Variables Definitions Operationalization References
frequency counts and
subjective evaluations
together with sharing
information, closing
collaboration and
guiding activity which
is crucial to innovation
management
consultation and
evaluations
- Souitaris(2002)
- Partgasarthy
and Hammond
(2002)
- Anderson and
West (1998)
- Szakonyi
(1994)
In conclusion, this chapter discusses the conceptual framework and hypothesis
model which are comprised of the determinants of seven contingency factors. In
addition, the researcher has proposed the number of research hypotheses to be tested
in order to understand their relationships of variables and constructs and how they can
be operationalization in terms of each variable.
CHAPTER 5
RESEARCH METHODOLOGY
This chapter describes the research methodology applied in analyzing the
relationships of the factors affecting innovation management effectiveness in the
banking industry. Prior to conducting the research, several key areas were addressed
such as the research design, units of analysis, target population, sampling and method
of analysis for the use in the data analysis. The measurement and sampling
procedures aim at improving the reliability of observations, facilitate imitation
studies, and allow generalization to a larger population.
5.1 Research Design
The primary objectives of the research are to study and test a theoretical
framework and model of seven contingency factors for explaining the output of the
factors of the determinants of organizational innovation management effectiveness in
sustaining competitive advantage.
The research study also focuses on the determinant factors, attempting to
employ the concept of alignment in contingency theory and resource-based view
theory and to explain the determinants of the seven contingency prediction factors of
innovation strategy, organization structure, organization culture, project management,
team cohesiveness, strategic leadership and coordination and communication. The
research examines whether the outputs of all these factors impact the increase in
innovation management effectiveness at both commercial and state-owned in the
selected banks.
The primary data was collected through questionnaires from the non
probability sampling population of the staff of both commercial banks (SCB and
KBank) and state-owned banks (KTB and GHB). The research methodology is also
considered critical to the success of the determinants of organizational innovation
management effectiveness.
113
5.2 Approaches of the Study
The research is based on surveys in which data were collected from a sample
of the target population through both quantitative and qualitative methods. This work
can be categorized as exploratory research- which tries to explain the relationships
between the determinants of the seven contingency prediction factors to the increasing
in innovation management effectiveness.
The qualitative research method was conducted using both secondary and
primary data of the four selected banks. Quantitative analysis was conducted through
the Statistical Package for the Social Sciences (SPSS) program adopting descriptive
analysis and independent samples t-test techniques and also the Analysis of Moment
Structures (AMOS) program adopting the structural equation modeling.
However, the research study focuses on the causal relationships among
quantitative constructs and an empirical study is conducted. Thus, the quantitative
method is the main method in this study. Other research involved the literature review
of documents and from the internet, wherever possible.
5.3 Units of Analysis
The units of analysis are the entities or objectives of the study which are
generally formed in a hierarchical order including the higher levels, such as the
organizational level, the lower level such as the individual level (Babbie, 1999). In
this research, the units of analysis are at the individual level which requires individual
to answer the questionnaires so as to find the determinants of organizational innovation
management effectiveness.
5.4 Target Population
The target population in this study is the selected employees of the four banks-
the two commercial banks Siam Commercial Bank (SCB) and Kasikorn Bank
(KBank) and the two state-owned banks Krung Thai Bank (KTB) and Government
Housing Bank (GHB), whose number of branches as shown in below.
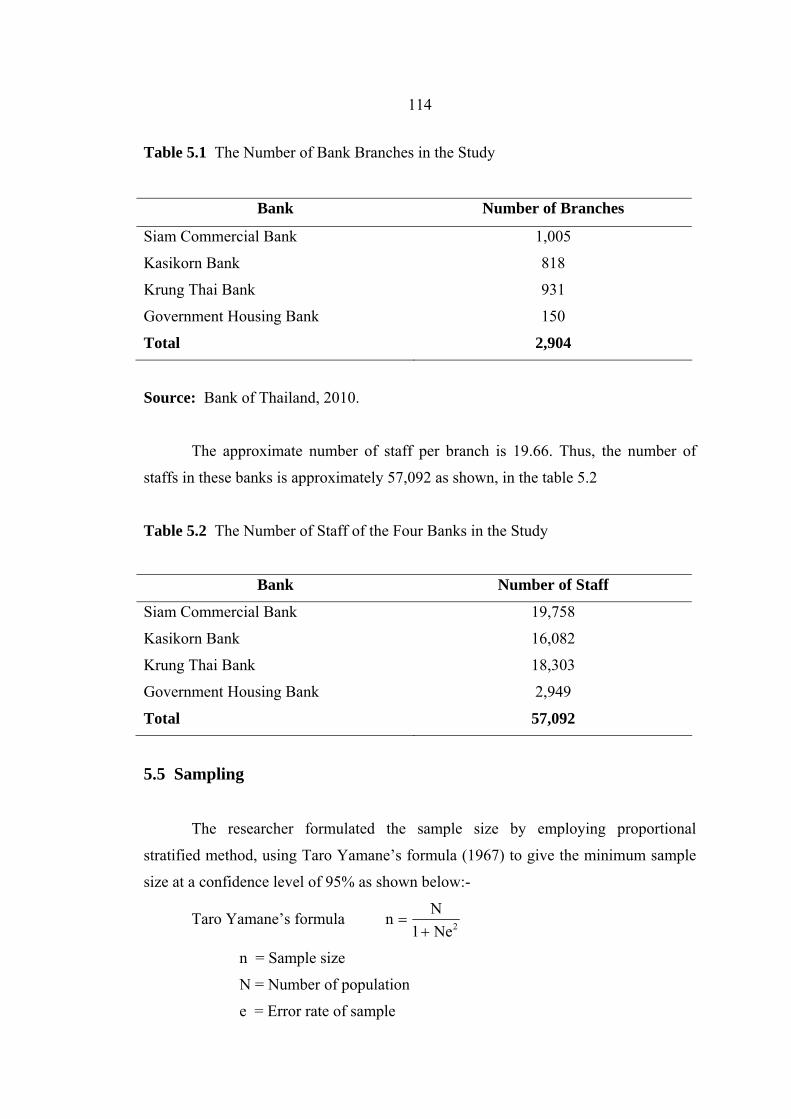
114
Table 5.1 The Number of Bank Branches in the Study
Bank Number of Branches
Siam Commercial Bank
Kasikorn Bank
Krung Thai Bank
Government Housing Bank
1,005
818
931
150
Total 2,904
Source: Bank of Thailand, 2010.
The approximate number of staff per branch is 19.66. Thus, the number of
staffs in these banks is approximately 57,092 as shown, in the table 5.2
Table 5.2 The Number of Staff of the Four Banks in the Study
Bank Number of Staff
Siam Commercial Bank
Kasikorn Bank
Krung Thai Bank
Government Housing Bank
19,758
16,082
18,303
2,949
Total 57,092
5.5 Sampling
The researcher formulated the sample size by employing proportional
stratified method, using Taro Yamane’s formula (1967) to give the minimum sample
size at a confidence level of 95% as shown below:-
Taro Yamane’s formula 2Ne1Nn
+=
n = Sample size
N = Number of population
e = Error rate of sample
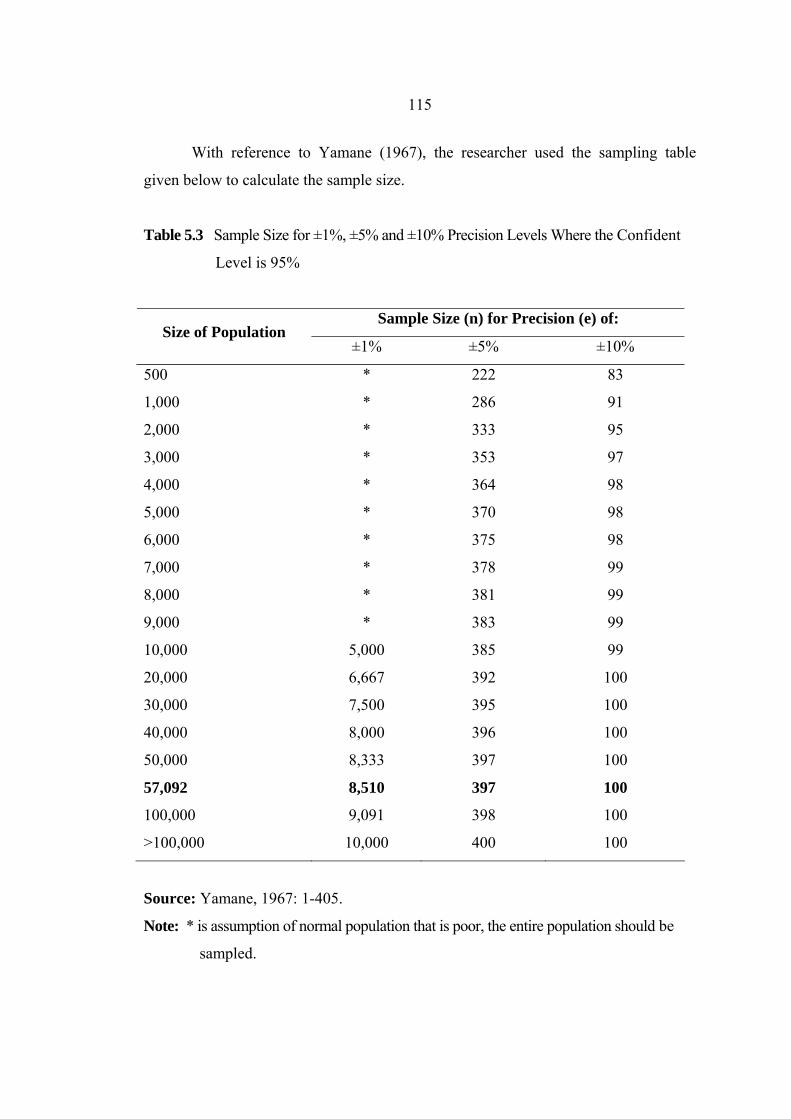
115
With reference to Yamane (1967), the researcher used the sampling table
given below to calculate the sample size.
Table 5.3 Sample Size for ±1%, ±5% and ±10% Precision Levels Where the Confident
Level is 95%
Sample Size (n) for Precision (e) of: Size of Population
±1% ±5% ±10%
500
1,000
2,000
3,000
4,000
5,000
6,000
7,000
8,000
9,000
10,000
20,000
30,000
40,000
50,000
57,092
100,000
>100,000
*
*
*
*
*
*
*
*
*
*
5,000
6,667
7,500
8,000
8,333
8,510
9,091
10,000
222
286
333
353
364
370
375
378
381
383
385
392
395
396
397
397
398
400
83
91
95
97
98
98
98
99
99
99
99
100
100
100
100
100
100
100
Source: Yamane, 1967: 1-405.
Note: * is assumption of normal population that is poor, the entire population should be
sampled.
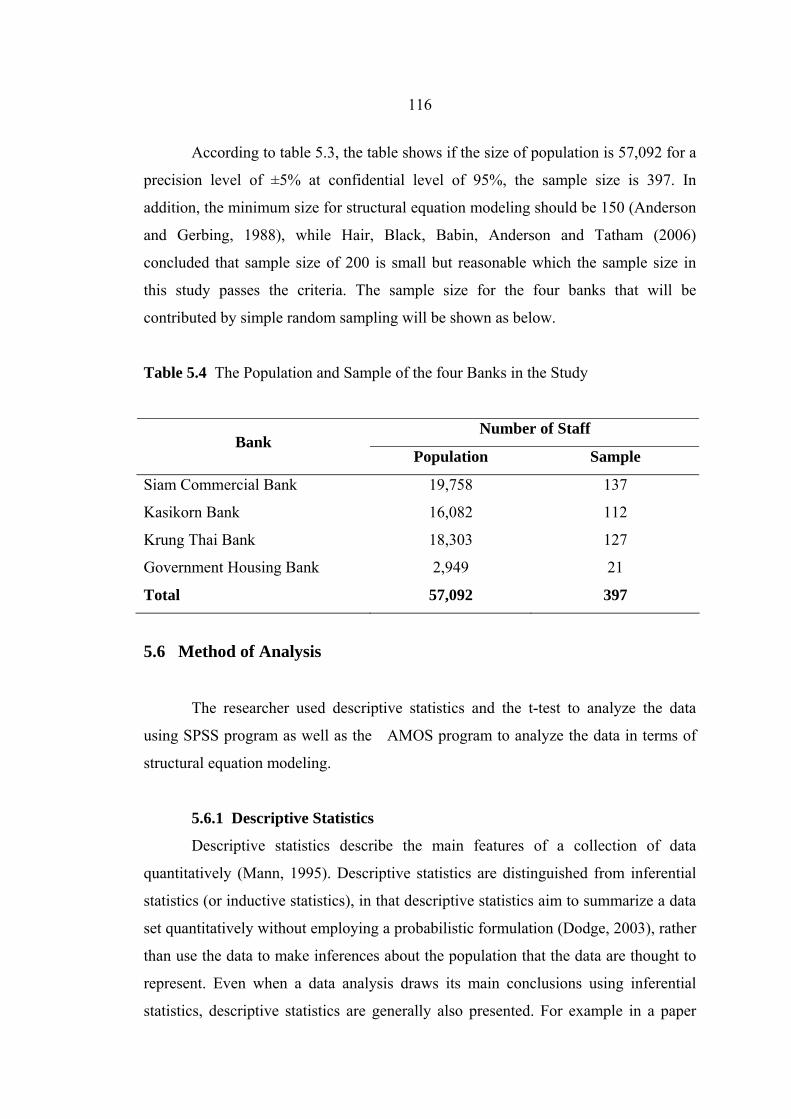
116
According to table 5.3, the table shows if the size of population is 57,092 for a
precision level of ±5% at confidential level of 95%, the sample size is 397. In
addition, the minimum size for structural equation modeling should be 150 (Anderson
and Gerbing, 1988), while Hair, Black, Babin, Anderson and Tatham (2006)
concluded that sample size of 200 is small but reasonable which the sample size in
this study passes the criteria. The sample size for the four banks that will be
contributed by simple random sampling will be shown as below.
Table 5.4 The Population and Sample of the four Banks in the Study
Number of Staff Bank
Population Sample
Siam Commercial Bank
Kasikorn Bank
Krung Thai Bank
Government Housing Bank
19,758
16,082
18,303
2,949
137
112
127
21
Total 57,092 397
5.6 Method of Analysis
The researcher used descriptive statistics and the t-test to analyze the data
using SPSS program as well as the AMOS program to analyze the data in terms of
structural equation modeling.
5.6.1 Descriptive Statistics
Descriptive statistics describe the main features of a collection of data
quantitatively (Mann, 1995). Descriptive statistics are distinguished from inferential
statistics (or inductive statistics), in that descriptive statistics aim to summarize a data
set quantitatively without employing a probabilistic formulation (Dodge, 2003), rather
than use the data to make inferences about the population that the data are thought to
represent. Even when a data analysis draws its main conclusions using inferential
statistics, descriptive statistics are generally also presented. For example in a paper
117
reporting on a study involving human subjects, there typically appears a table giving
the overall sample size, sample sizes in important subgroups (e.g., for each treatment
or exposure group), and demographic or clinical characteristics such as the average
age, the proportion of subjects of each gender, and the proportion of subjects with
related commodities.
5.6.2 Independent Samples T-Test
The t-test is the most commonly used method to evaluate the differences in
means between two groups. Theoretically, the t-test can be used even if the sample
sizes are very small (e.g., as small as 10; some researchers claim that even smaller
number are possible), as long as the variables are normally distributed within each
group and the variation of scores in the two groups is not reliably different (StatSoft,
Inc., 2010). As mentioned before, the normality assumption can be evaluated by
looking at the distribution of the data (via histograms) or by performing a normality
test. The equality of variances assumption can be verified with the F test, or the more
robust Levene's test. If these conditions are not met, then the differences in means
between two groups can be evaluated one of the nonparametric alternatives to the t-
test (StatSoft, Inc., 2010).
5.6.3 Structural Equation Modeling
Structural Equation Modeling (SEM) is a statistical technique for testing and
estimating causal relations using a combination of statistical data and qualitative
causal assumptions. This definition of SEM was articulated by the geneticist Sewall
Wright (1921), the economist Trygve Haavelmo (1943) and the cognitive scientist
Herbert Simon (1953), and formally defined by Judea Pearl (2000) using a calculus of
counterfactuals.
5.6.3.1 Fundamentals of Structural Equation Modeling
The use of SEM is predicated on a strong theoretical model by which
latent constructs are defined (measurement model) and these constructs are related to
each other through a series of dependence relationships (structural model). The
emphasis on strong theoretical support for any proposed model underlies the
confirmatory nature of most SEM applications.
118
However, many times overlooked is exactly how the proposed structural
model is translated into structural relationships and how their estimation is
interrelated. Path analysis is the process wherein the structural relationships are
expressed as direct and indirect effects in order to facilitate estimation. The importance of
understanding this process is not so that the research can understand the estimation
process, but instead to understand how model specification (and respecification)
impacts the entire set of structural relationships.
Structural Equation Models (SEM) allows both confirmatory and
exploratory modeling, which are both suited to theory testing and theory development.
Confirmatory modeling usually starts out with a hypothesis that gets represented in a
causal model. The concepts used in the model must then be operationalized to allow
testing of the relationships between the concepts in the model. The model is tested
against the obtained measurement data to determine how well the model fits the data.
The causal assumptions embedded in the model often have falsifiable implications
which can be tested against the data (Bollen and Long, 1993).
With an initial theory SEM can be used inductively by specifying a
corresponding model and using data to estimate the values of free parameters. Often
the initial hypothesis requires adjustment in light of model evidence. When SEM is
used purely for exploration, this is usually in the context of exploratory factor analysis
as in psychometric design.
Among the strengths of SEM is the ability to construct latent variables:
variables which are not measured directly, but are estimated in the model from several
measured variables each of which is predicted to 'tap into' the latent variables. This
allows the modeler to explicitly capture the unreliability of measurement in the
model, which in theory allows the structural relations between latent variables to be
accurately estimated. Factor analysis, path analysis and regression all represent
special cases of SEM.
In SEM, the qualitative causal assumptions are represented by the
missing variables in each equation, as well as vanishing covariance among some error
terms. These assumptions are testable in experimental studies and must be confirmed
judgmentally in observational studies.
119
5.6.3.2 Model Specification
When SEM is used as a confirmatory technique, the model must be
specified correctly based on the type of analysis that the researcher is attempting to
confirm. When building the correct model, the researcher uses two different kinds of
variables, namely exogenous and endogenous variables. The distinction between these
two types of variables is whether the variable regresses on another variable or not. As
in regression the dependent variable (DV) regresses on the independent variable (IV),
meaning that the DV is being predicted by the IV. In SEM terminology, other
variables regress on exogenous variables. Exogenous variables can be recognized in a
graphical version of the model, as the variables sending out arrowheads, denoting
which variable it is predicting. A variable that regresses on a variable is always an
endogenous variable, even if this same variable is also used as a variable to be
regressed on. Endogenous variables are recognized as the receivers of an arrowhead
in the model.
It is important to note that SEM is more general than regression. In
particular a variable can act as both an independent and dependent variable.
The two main components of models are distinguished in SEM: the
structural model showing potential causal dependencies between endogenous and
exogenous variables, and the measurement model showing the relations between
latent variables and their indicators. Exploratory and Confirmatory factor analysis
models, for example, contain only the measurement part, while path diagrams can be
viewed as an SEM that only has the structural part.
In specifying the pathways in a model, the modeler can posit two types
of relationships: (1) free pathways, in which hypothesized causal (in fact counterfactual)
relationships between variables are tested, and therefore are left 'free' to vary, and (2)
relationships between variables that already have an estimated relationship, usually
based on previous studies, which are 'fixed' in the model.
5.6.3.3 Estimation of Free Parameters
Parameter estimation is done by comparing the actual covariance
matrices representing the relationships between variables and the estimated
covariance matrices of the best fitting model. This is obtained through the numerical
maximization of a fit criterion as provided by maximum likelihood estimation,
120
weighted least squares or asymptotically distribution-free methods. This is often
accomplished by using a specialized SEM analysis program of which several exist.
5.6.3.4 Assessment of Fit
Assessment of fit is a basic task in SEM modeling: forming the basis for
accepting or rejecting models and, more usually, accepting one competing model over
another. The output of SEM programs includes matrices of the estimated relationships
between variables in the model. Assessment of fit essentially calculates how similar
the predicted data are to matrices containing the relationships in the actual data.
Formal statistical tests and fit indices have been developed for these
purposes. Individual parameters of the model can also be examined within the
estimated model in order to see how well the proposed model fits the driving theory.
Most, though not all, estimation methods make such tests of the model possible.
Of course as in all statistical hypothesis tests, SEM model tests are based
on the assumption that the correct and complete relevant data have been modeled. In
the SEM literature, discussion of fit has led to a variety of different recommendations
on the precise application of the various fit indices and hypothesis tests.
There are several fit indices for model assessment. With the reference to
Hair et al. (2006), Hu and Bentler (1999), MacCallum and Austin (2000), main fit
indices are used for model assessment, including Comparative Fit Index (CFI),
Normed Fit Index (NFI), Non-Normed Fit Index (NNFI), and Root Mean Square
Error of Approximation (RMSEA). Many researchers have studied fit indices to
identify if the model fits with the data and several fit indices are used, including CFI,
NFI, NNFI and RMSEA. Hair et al. (2006) compiled guidelines for setting up
acceptable fit indices. They recommended the use of three to four fit indices to show
evidence of model fit, but that to report to all of the fit indices seems to be
unnecessary. Only one absolute index should be reported. In conclusion, Hair et al.,
(2006) and Katsikea, Theodosiou, Morgan and Papavassiliou (2005) suggested a
model that provides the fit indices of CFI and RMSEA can assess model fit with the
appropriate information.
According to Schumacker (1992) and Kenny (2008), the fit indices are
shown inthe formula below:
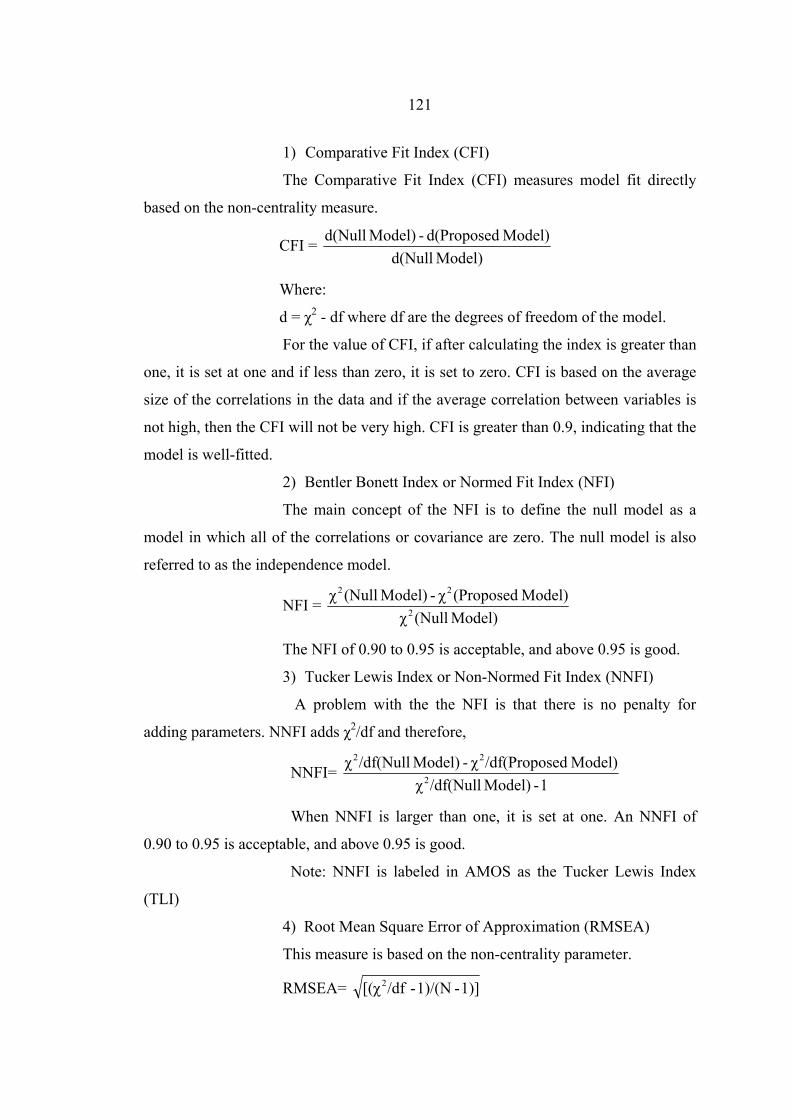
121
1) Comparative Fit Index (CFI)
The Comparative Fit Index (CFI) measures model fit directly
based on the non-centrality measure.
CFI = Model) d(Null
Model) d(Proposed - Model) d(Null
Where:
d = χ2 - df where df are the degrees of freedom of the model.
For the value of CFI, if after calculating the index is greater than
one, it is set at one and if less than zero, it is set to zero. CFI is based on the average
size of the correlations in the data and if the average correlation between variables is
not high, then the CFI will not be very high. CFI is greater than 0.9, indicating that the
model is well-fitted.
2) Bentler Bonett Index or Normed Fit Index (NFI)
The main concept of the NFI is to define the null model as a
model in which all of the correlations or covariance are zero. The null model is also
referred to as the independence model.
NFI = Model) (Nullχ
Model) (Proposedχ - Model) (Nullχ2
22
The NFI of 0.90 to 0.95 is acceptable, and above 0.95 is good.
3) Tucker Lewis Index or Non-Normed Fit Index (NNFI)
A problem with the the NFI is that there is no penalty for
adding parameters. NNFI adds χ2/df and therefore,
NNFI= 1-Model) /df(Nullχ
Model) ed/df(Proposχ - Model) /df(Nullχ2
22
When NNFI is larger than one, it is set at one. An NNFI of
0.90 to 0.95 is acceptable, and above 0.95 is good.
Note: NNFI is labeled in AMOS as the Tucker Lewis Index
(TLI)
4) Root Mean Square Error of Approximation (RMSEA)
This measure is based on the non-centrality parameter.
RMSEA= 1)] - 1)/(N - /df[(χ 2
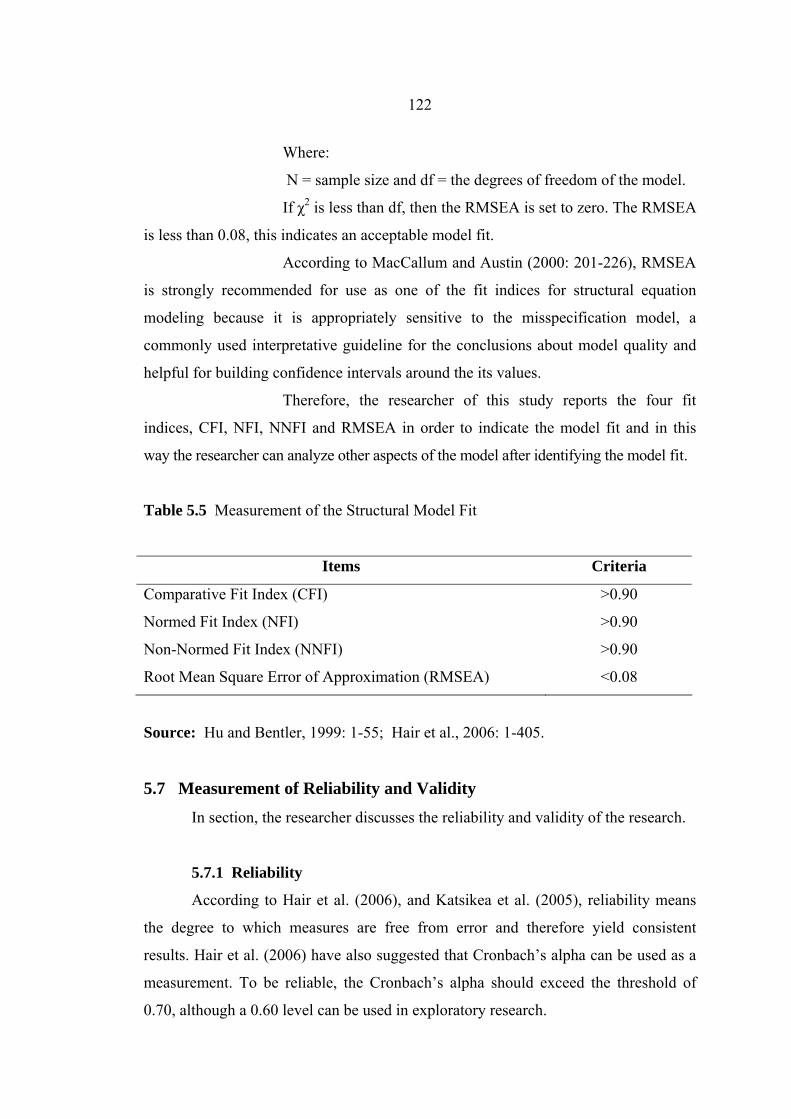
122
Where:
N = sample size and df = the degrees of freedom of the model.
If χ2 is less than df, then the RMSEA is set to zero. The RMSEA
is less than 0.08, this indicates an acceptable model fit.
According to MacCallum and Austin (2000: 201-226), RMSEA
is strongly recommended for use as one of the fit indices for structural equation
modeling because it is appropriately sensitive to the misspecification model, a
commonly used interpretative guideline for the conclusions about model quality and
helpful for building confidence intervals around the its values.
Therefore, the researcher of this study reports the four fit
indices, CFI, NFI, NNFI and RMSEA in order to indicate the model fit and in this
way the researcher can analyze other aspects of the model after identifying the model fit.
Table 5.5 Measurement of the Structural Model Fit
Items Criteria
Comparative Fit Index (CFI)
Normed Fit Index (NFI)
Non-Normed Fit Index (NNFI)
Root Mean Square Error of Approximation (RMSEA)
>0.90
>0.90
>0.90
<0.08
Source: Hu and Bentler, 1999: 1-55; Hair et al., 2006: 1-405.
5.7 Measurement of Reliability and Validity
In section, the researcher discusses the reliability and validity of the research.
5.7.1 Reliability
According to Hair et al. (2006), and Katsikea et al. (2005), reliability means
the degree to which measures are free from error and therefore yield consistent
results. Hair et al. (2006) have also suggested that Cronbach’s alpha can be used as a
measurement. To be reliable, the Cronbach’s alpha should exceed the threshold of
0.70, although a 0.60 level can be used in exploratory research.
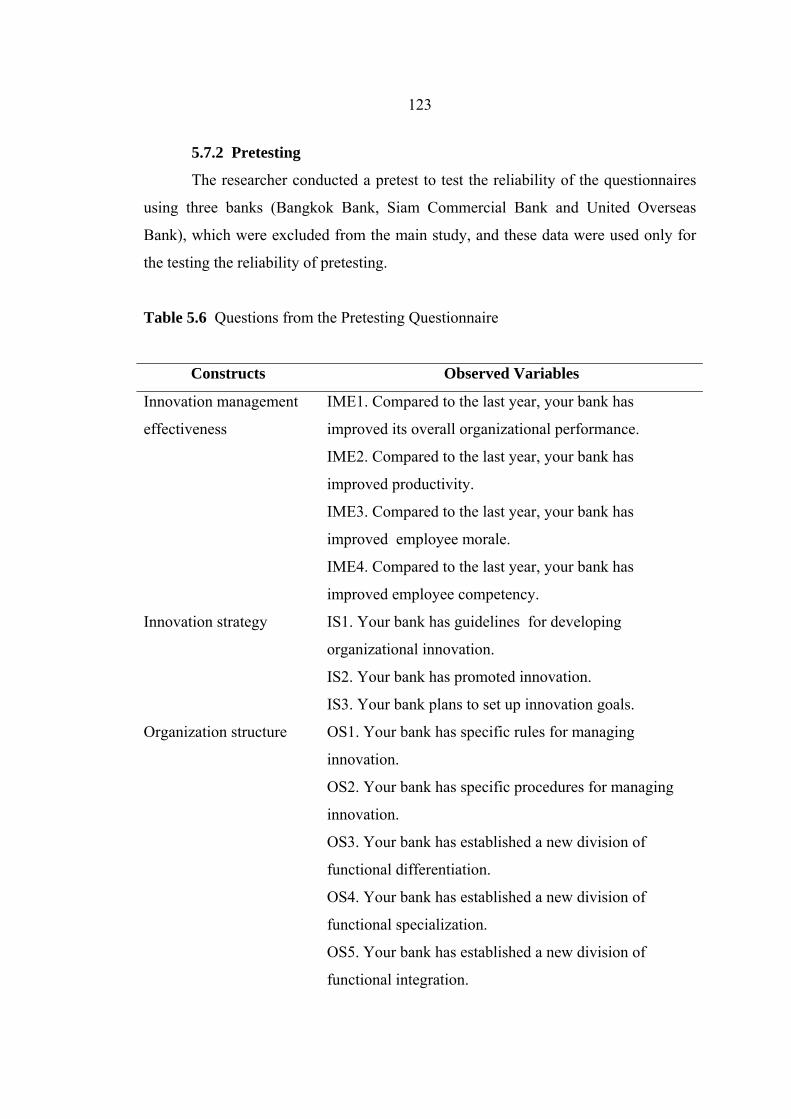
123
5.7.2 Pretesting
The researcher conducted a pretest to test the reliability of the questionnaires
using three banks (Bangkok Bank, Siam Commercial Bank and United Overseas
Bank), which were excluded from the main study, and these data were used only for
the testing the reliability of pretesting.
Table 5.6 Questions from the Pretesting Questionnaire
Constructs Observed Variables
Innovation management
effectiveness
IME1. Compared to the last year, your bank has
improved its overall organizational performance.
IME2. Compared to the last year, your bank has
improved productivity.
IME3. Compared to the last year, your bank has
improved employee morale.
IME4. Compared to the last year, your bank has
improved employee competency.
Innovation strategy IS1. Your bank has guidelines for developing
organizational innovation.
IS2. Your bank has promoted innovation.
IS3. Your bank plans to set up innovation goals.
Organization structure OS1. Your bank has specific rules for managing
innovation.
OS2. Your bank has specific procedures for managing
innovation.
OS3. Your bank has established a new division of
functional differentiation.
OS4. Your bank has established a new division of
functional specialization.
OS5. Your bank has established a new division of
functional integration.
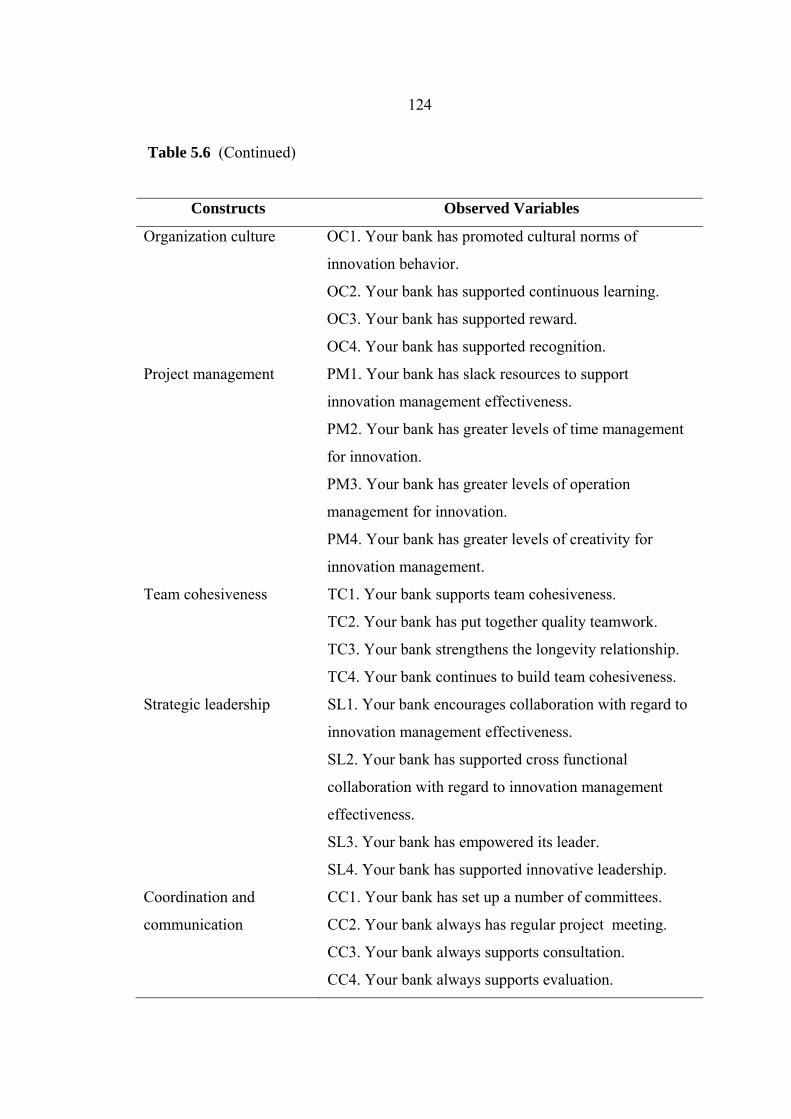
124
Table 5.6 (Continued)
Constructs Observed Variables
Organization culture OC1. Your bank has promoted cultural norms of
innovation behavior.
OC2. Your bank has supported continuous learning.
OC3. Your bank has supported reward.
OC4. Your bank has supported recognition.
Project management PM1. Your bank has slack resources to support
innovation management effectiveness.
PM2. Your bank has greater levels of time management
for innovation.
PM3. Your bank has greater levels of operation
management for innovation.
PM4. Your bank has greater levels of creativity for
innovation management.
Team cohesiveness TC1. Your bank supports team cohesiveness.
TC2. Your bank has put together quality teamwork.
TC3. Your bank strengthens the longevity relationship.
TC4. Your bank continues to build team cohesiveness.
Strategic leadership SL1. Your bank encourages collaboration with regard to
innovation management effectiveness.
SL2. Your bank has supported cross functional
collaboration with regard to innovation management
effectiveness.
SL3. Your bank has empowered its leader.
SL4. Your bank has supported innovative leadership.
Coordination and
communication
CC1. Your bank has set up a number of committees.
CC2. Your bank always has regular project meeting.
CC3. Your bank always supports consultation.
CC4. Your bank always supports evaluation.
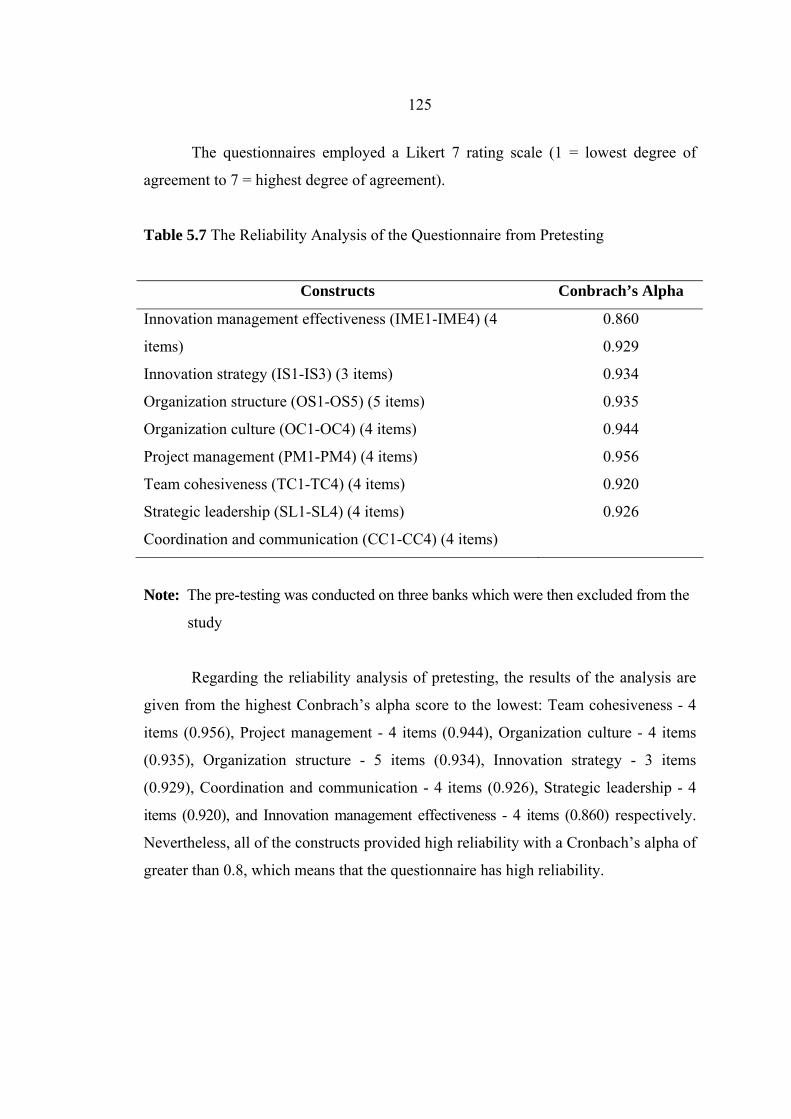
125
The questionnaires employed a Likert 7 rating scale (1 = lowest degree of
agreement to 7 = highest degree of agreement).
Table 5.7 The Reliability Analysis of the Questionnaire from Pretesting
Constructs Conbrach’s Alpha
Innovation management effectiveness (IME1-IME4) (4
items)
Innovation strategy (IS1-IS3) (3 items)
Organization structure (OS1-OS5) (5 items)
Organization culture (OC1-OC4) (4 items)
Project management (PM1-PM4) (4 items)
Team cohesiveness (TC1-TC4) (4 items)
Strategic leadership (SL1-SL4) (4 items)
Coordination and communication (CC1-CC4) (4 items)
0.860
0.929
0.934
0.935
0.944
0.956
0.920
0.926
Note: The pre-testing was conducted on three banks which were then excluded from the
study
Regarding the reliability analysis of pretesting, the results of the analysis are
given from the highest Conbrach’s alpha score to the lowest: Team cohesiveness - 4
items (0.956), Project management - 4 items (0.944), Organization culture - 4 items
(0.935), Organization structure - 5 items (0.934), Innovation strategy - 3 items
(0.929), Coordination and communication - 4 items (0.926), Strategic leadership - 4
items (0.920), and Innovation management effectiveness - 4 items (0.860) respectively.
Nevertheless, all of the constructs provided high reliability with a Cronbach’s alpha of
greater than 0.8, which means that the questionnaire has high reliability.
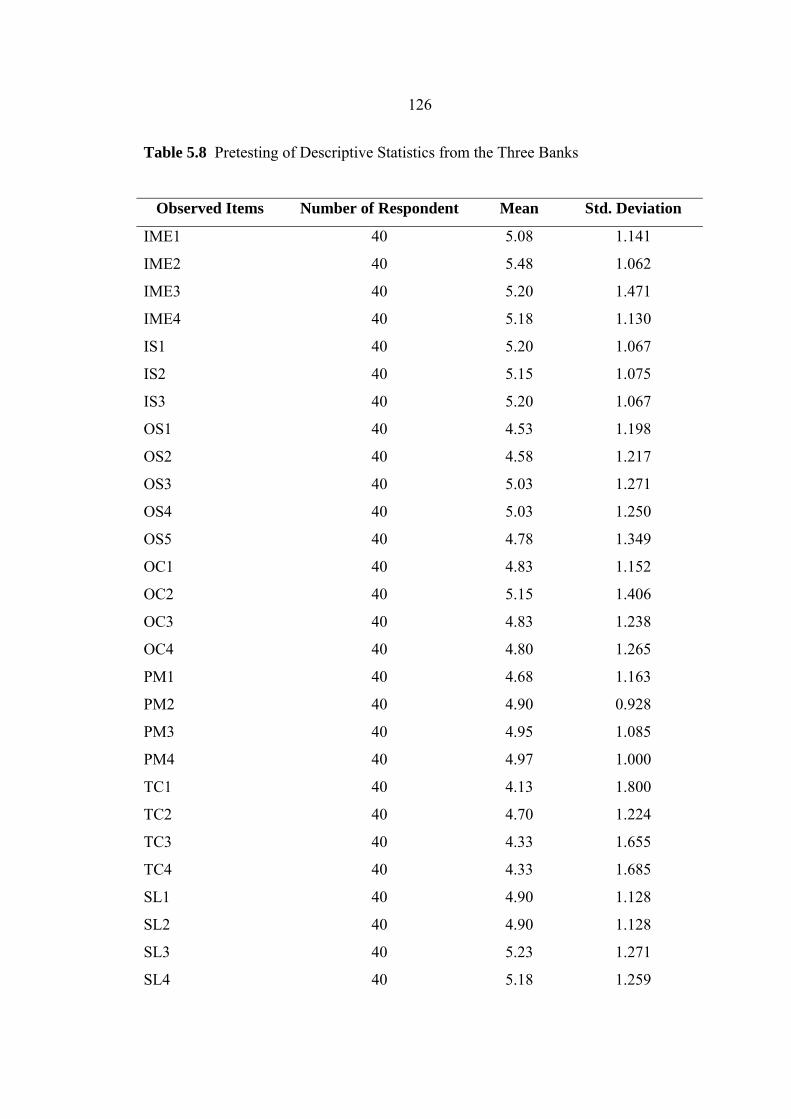
126
Table 5.8 Pretesting of Descriptive Statistics from the Three Banks
Observed Items Number of Respondent Mean Std. Deviation
IME1
IME2
IME3
IME4
IS1
IS2
IS3
OS1
OS2
OS3
OS4
OS5
OC1
OC2
OC3
OC4
PM1
PM2
PM3
PM4
TC1
TC2
TC3
TC4
40
40
40
40
40
40
40
40
40
40
40
40
40
40
40
40
40
40
40
40
40
40
40
40
5.08
5.48
5.20
5.18
5.20
5.15
5.20
4.53
4.58
5.03
5.03
4.78
4.83
5.15
4.83
4.80
4.68
4.90
4.95
4.97
4.13
4.70
4.33
4.33
1.141
1.062
1.471
1.130
1.067
1.075
1.067
1.198
1.217
1.271
1.250
1.349
1.152
1.406
1.238
1.265
1.163
0.928
1.085
1.000
1.800
1.224
1.655
1.685
SL1
SL2
SL3
SL4
40
40
40
40
4.90
4.90
5.23
5.18
1.128
1.128
1.271
1.259
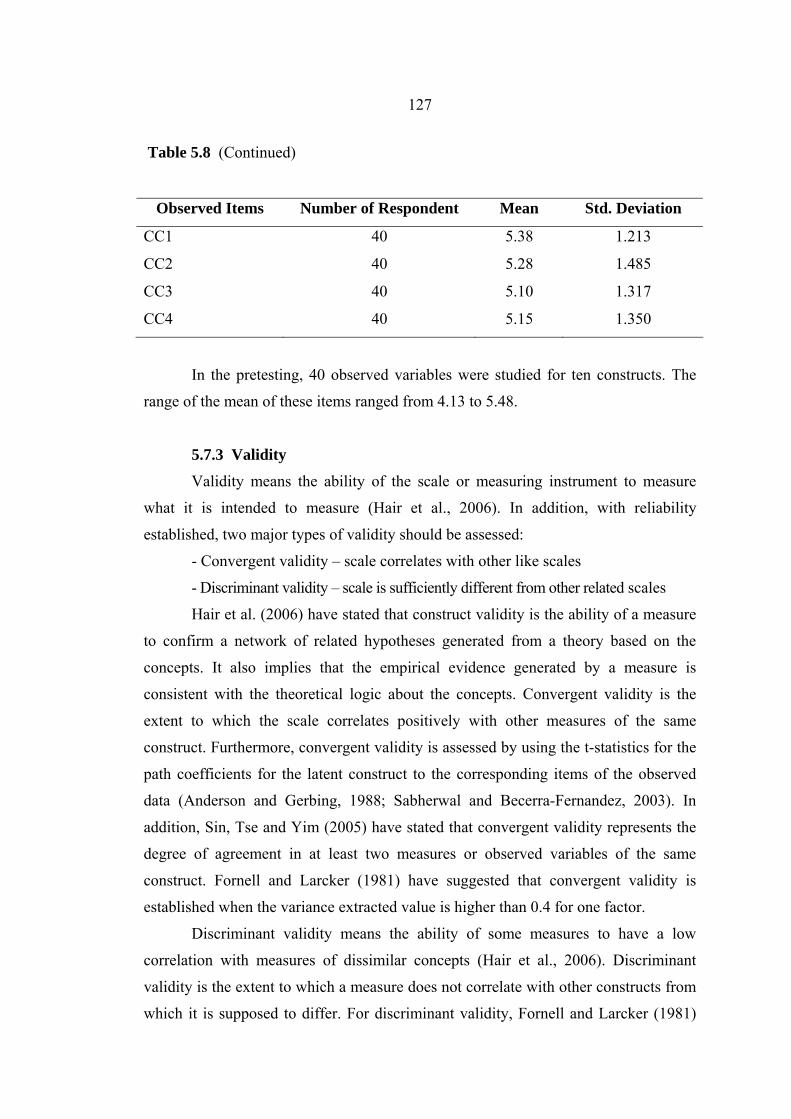
127
Table 5.8 (Continued)
Observed Items Number of Respondent Mean Std. Deviation
CC1
CC2
CC3
CC4
40
40
40
40
5.38
5.28
5.10
5.15
1.213
1.485
1.317
1.350
In the pretesting, 40 observed variables were studied for ten constructs. The
range of the mean of these items ranged from 4.13 to 5.48.
5.7.3 Validity
Validity means the ability of the scale or measuring instrument to measure
what it is intended to measure (Hair et al., 2006). In addition, with reliability
established, two major types of validity should be assessed:
- Convergent validity – scale correlates with other like scales
- Discriminant validity – scale is sufficiently different from other related scales
Hair et al. (2006) have stated that construct validity is the ability of a measure
to confirm a network of related hypotheses generated from a theory based on the
concepts. It also implies that the empirical evidence generated by a measure is
consistent with the theoretical logic about the concepts. Convergent validity is the
extent to which the scale correlates positively with other measures of the same
construct. Furthermore, convergent validity is assessed by using the t-statistics for the
path coefficients for the latent construct to the corresponding items of the observed
data (Anderson and Gerbing, 1988; Sabherwal and Becerra-Fernandez, 2003). In
addition, Sin, Tse and Yim (2005) have stated that convergent validity represents the
degree of agreement in at least two measures or observed variables of the same
construct. Fornell and Larcker (1981) have suggested that convergent validity is
established when the variance extracted value is higher than 0.4 for one factor.
Discriminant validity means the ability of some measures to have a low
correlation with measures of dissimilar concepts (Hair et al., 2006). Discriminant
validity is the extent to which a measure does not correlate with other constructs from
which it is supposed to differ. For discriminant validity, Fornell and Larcker (1981)
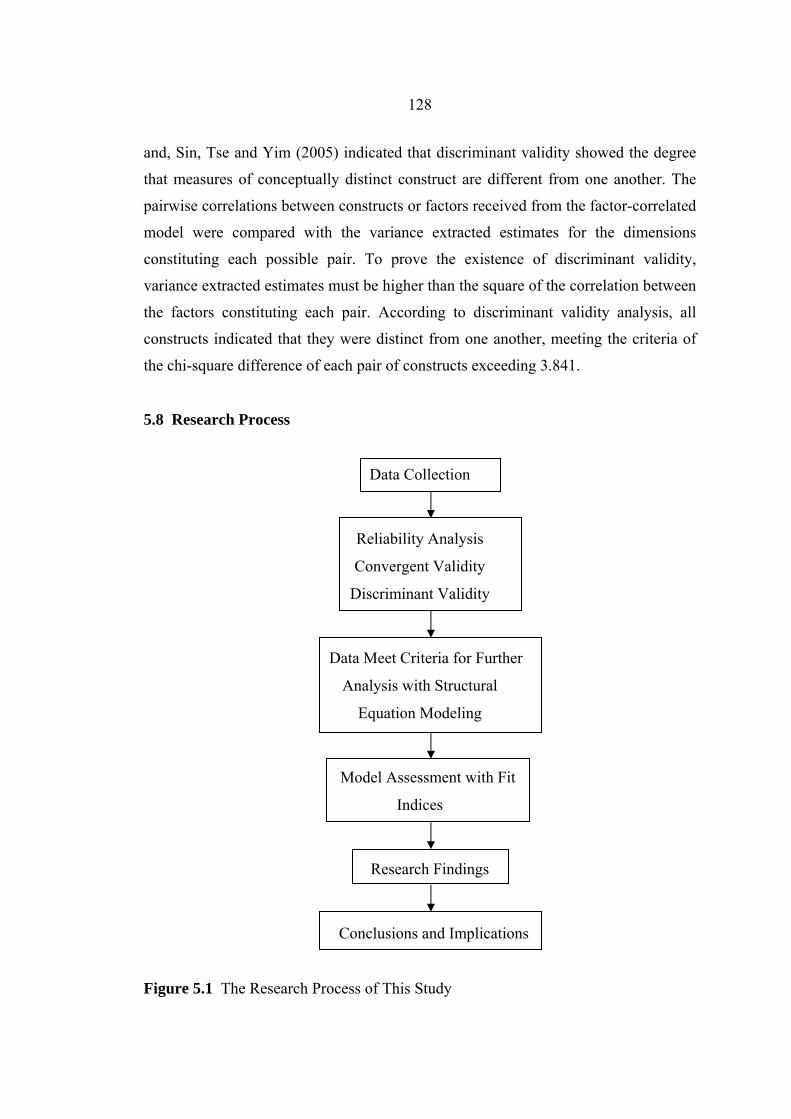
128
and, Sin, Tse and Yim (2005) indicated that discriminant validity showed the degree
that measures of conceptually distinct construct are different from one another. The
pairwise correlations between constructs or factors received from the factor-correlated
model were compared with the variance extracted estimates for the dimensions
constituting each possible pair. To prove the existence of discriminant validity,
variance extracted estimates must be higher than the square of the correlation between
the factors constituting each pair. According to discriminant validity analysis, all
constructs indicated that they were distinct from one another, meeting the criteria of
the chi-square difference of each pair of constructs exceeding 3.841.
5.8 Research Process
Data Collection
Reliability Analysis
Convergent Validity
Discriminant Validity
Data Meet Criteria for Further
Analysis with Structural
Equation Modeling
Model Assessment with Fit
Indices
Research Findings
Conclusions and Implications
Figure 5.1 The Research Process of This Study
129
In summary, this chapter discussed the research process and provided the
sampling methods with appropriate sample size for structural equation modeling
(n>200). The results of the pretesting showed that the questions in the questionnaires
provided a Cronbach’s alpha score of greater than 0.80, thereby reflecting the high
reliability of the construct. Moreover, the researcher discussed the convergent and
discriminant validity to be tested in order to ensure that the data were suitable for
further analyses with structural equation modeling (SEM). Additionally, the fit
indices, such as CFI and RMSEA, were identified and the criteria for the use of each
fit index were elaborated.
CHAPTER 6
DATA ANALYSIS
This chapter provides the results of the descriptive statistics and t-test,
including reliability analysis and structural equation model using AMOS for
convergent validity, and discriminant validity by examining whether the constructs
are suitable for further analysis. So, the researcher has developed the models with the
seven main constructs- innovation strategy, organization structure, organization
culture, project management, team cohesiveness, strategic leadership and coordination
and communication- as factors affecting innovation management effectiveness. In this
process, the models were developed in through a step-by-step process to show how
each model met the criteria of model fit. Finally, the most appropriate model was
identified to help test the research hypotheses. In the previous chapter, the researcher
showed how the results could explain and support the research hypotheses proposed.
6.1 Characteristics of the Respondents
The characteristics of the respondents in the study are important to ensure that
the questionnaires are distributed to the right group of participants who fit the correct
criteria. This section describes the main characteristics of the respondents.
The population of this study comprised commercial banks (SCB and KBank)
and state-owned banks (KTB, GHB) as explained in the previous chapter. The
participants were invited to respond to the personal data section in the questionnaire.
This form was primarily designed to obtain the background information concerning
each respondent’s gender, education, workplace (which type of bank), work experience
and work position. These data are detailed in the following tables.
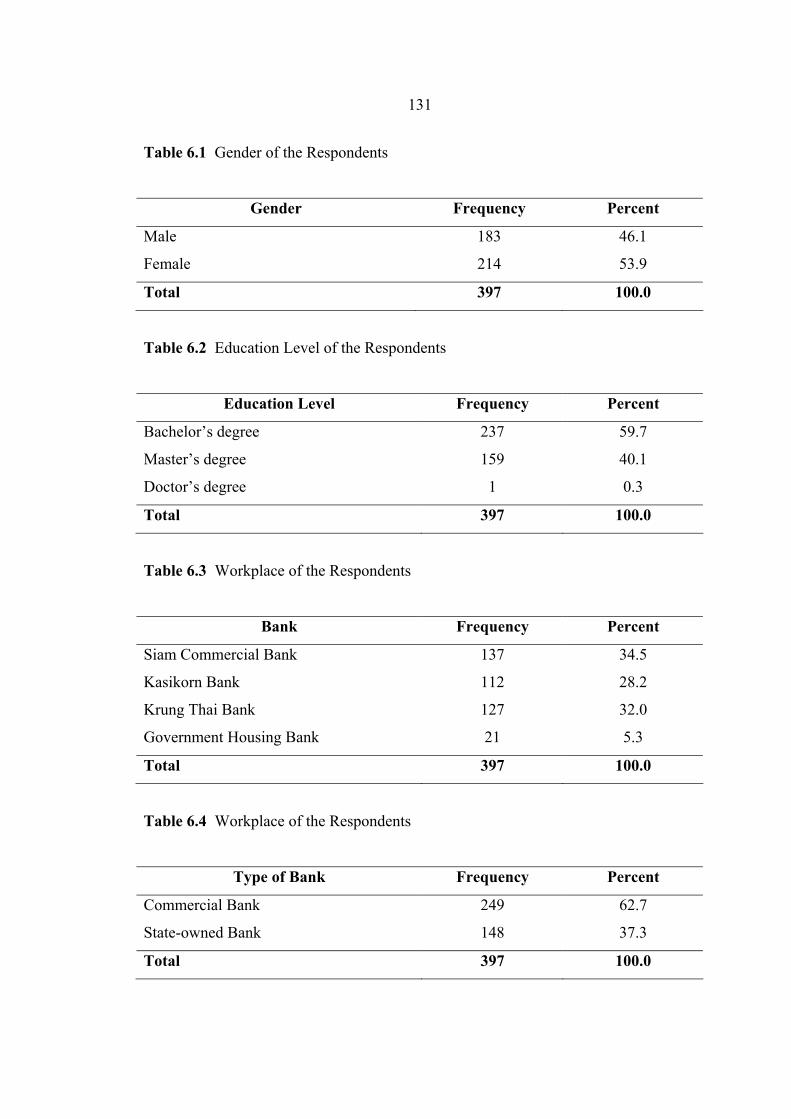
131
Table 6.1 Gender of the Respondents
Gender Frequency Percent
Male
Female
183
214
46.1
53.9
Total 397 100.0
Table 6.2 Education Level of the Respondents
Education Level Frequency Percent
Bachelor’s degree
Master’s degree
Doctor’s degree
237
159
1
59.7
40.1
0.3
Total 397 100.0
Table 6.3 Workplace of the Respondents
Bank Frequency Percent
Siam Commercial Bank
Kasikorn Bank
Krung Thai Bank
Government Housing Bank
137
112
127
21
34.5
28.2
32.0
5.3
Total 397 100.0
Table 6.4 Workplace of the Respondents
Type of Bank Frequency Percent
Commercial Bank
State-owned Bank
249
148
62.7
37.3
Total 397 100.0
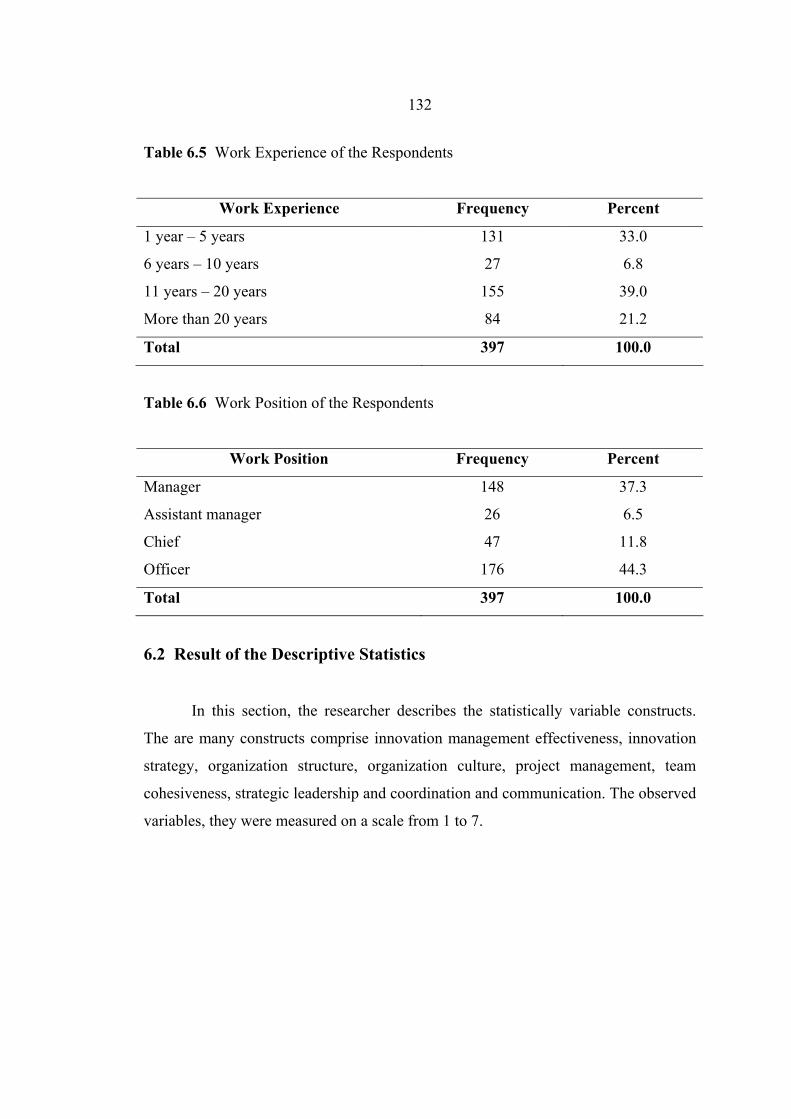
132
Table 6.5 Work Experience of the Respondents
Work Experience Frequency Percent
1 year – 5 years
6 years – 10 years
11 years – 20 years
More than 20 years
131
27
155
84
33.0
6.8
39.0
21.2
Total 397 100.0
Table 6.6 Work Position of the Respondents
Work Position Frequency Percent
Manager
Assistant manager
Chief
Officer
148
26
47
176
37.3
6.5
11.8
44.3
Total 397 100.0
6.2 Result of the Descriptive Statistics
In this section, the researcher describes the statistically variable constructs.
The are many constructs comprise innovation management effectiveness, innovation
strategy, organization structure, organization culture, project management, team
cohesiveness, strategic leadership and coordination and communication. The observed
variables, they were measured on a scale from 1 to 7.
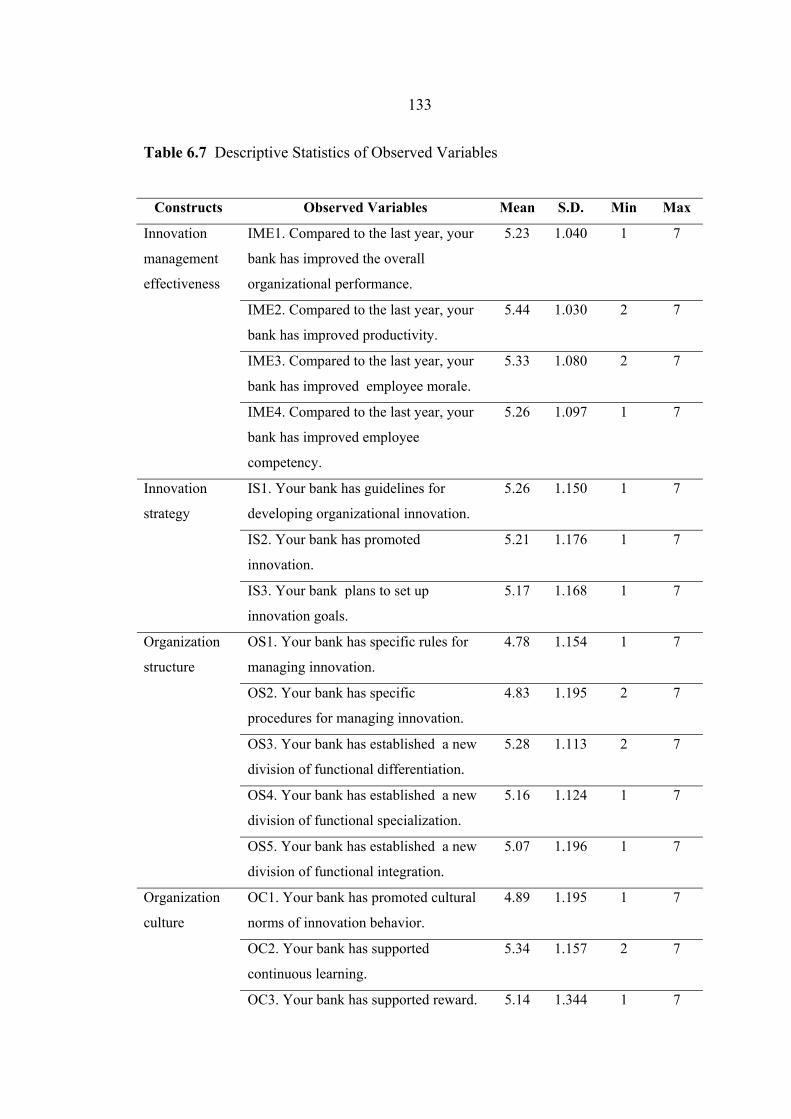
133
Table 6.7 Descriptive Statistics of Observed Variables
Constructs Observed Variables Mean S.D. Min Max
IME1. Compared to the last year, your
bank has improved the overall
organizational performance.
5.23 1.040 1 7
IME2. Compared to the last year, your
bank has improved productivity.
5.44 1.030 2 7
IME3. Compared to the last year, your
bank has improved employee morale.
5.33 1.080 2 7
Innovation
management
effectiveness
IME4. Compared to the last year, your
bank has improved employee
competency.
5.26 1.097 1 7
IS1. Your bank has guidelines for
developing organizational innovation.
5.26 1.150 1 7
IS2. Your bank has promoted
innovation.
5.21 1.176 1 7
Innovation
strategy
IS3. Your bank plans to set up
innovation goals.
5.17 1.168 1 7
OS1. Your bank has specific rules for
managing innovation.
4.78 1.154 1 7
OS2. Your bank has specific
procedures for managing innovation.
4.83 1.195 2 7
OS3. Your bank has established a new
division of functional differentiation.
5.28 1.113 2 7
OS4. Your bank has established a new
division of functional specialization.
5.16 1.124 1 7
Organization
structure
OS5. Your bank has established a new
division of functional integration.
5.07 1.196 1 7
OC1. Your bank has promoted cultural
norms of innovation behavior.
4.89 1.195 1 7
OC2. Your bank has supported
continuous learning.
5.34 1.157 2 7
Organization
culture
OC3. Your bank has supported reward. 5.14 1.344 1 7
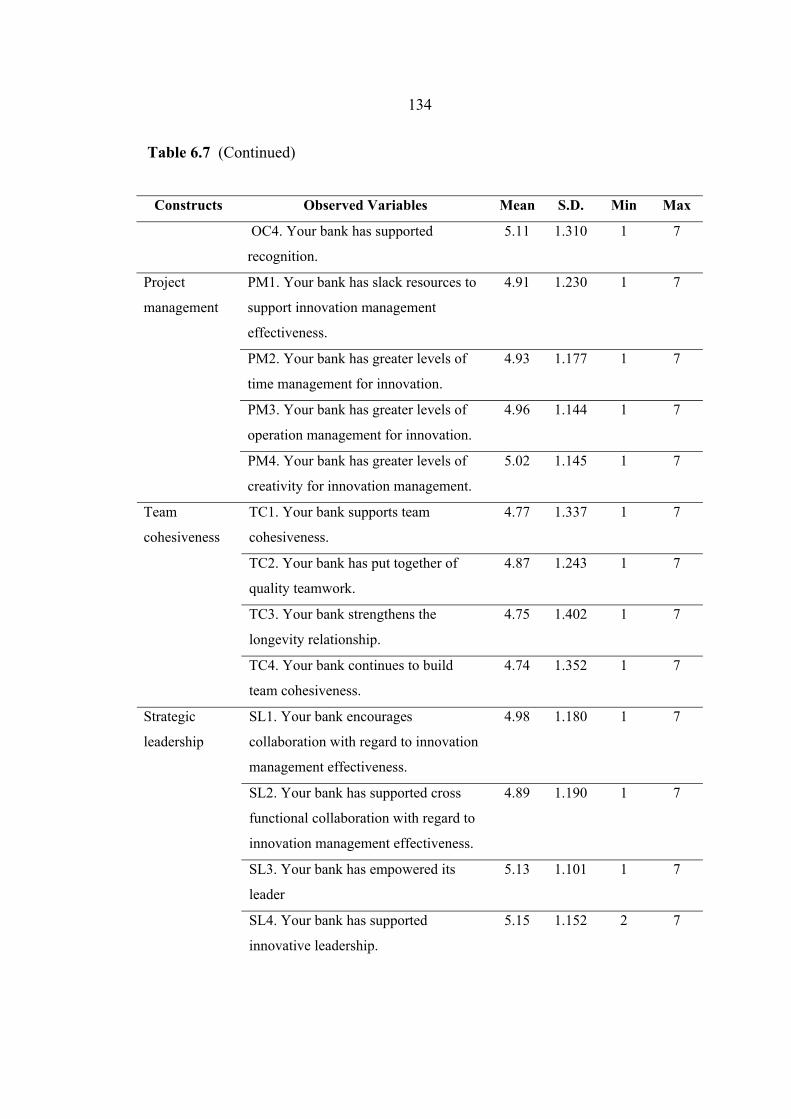
134
Table 6.7 (Continued)
Constructs Observed Variables Mean S.D. Min Max
OC4. Your bank has supported
recognition.
5.11 1.310 1 7
PM1. Your bank has slack resources to
support innovation management
effectiveness.
4.91 1.230 1 7
PM2. Your bank has greater levels of
time management for innovation.
4.93 1.177 1 7
PM3. Your bank has greater levels of
operation management for innovation.
4.96 1.144 1 7
Project
management
PM4. Your bank has greater levels of
creativity for innovation management.
5.02 1.145 1 7
TC1. Your bank supports team
cohesiveness.
4.77 1.337 1 7
TC2. Your bank has put together of
quality teamwork.
4.87 1.243 1 7
TC3. Your bank strengthens the
longevity relationship.
4.75 1.402 1 7
Team
cohesiveness
TC4. Your bank continues to build
team cohesiveness.
4.74 1.352 1 7
SL1. Your bank encourages
collaboration with regard to innovation
management effectiveness.
4.98 1.180 1 7
SL2. Your bank has supported cross
functional collaboration with regard to
innovation management effectiveness.
4.89 1.190 1 7
SL3. Your bank has empowered its
leader
5.13 1.101 1 7
Strategic
leadership
SL4. Your bank has supported
innovative leadership.
5.15 1.152 2 7
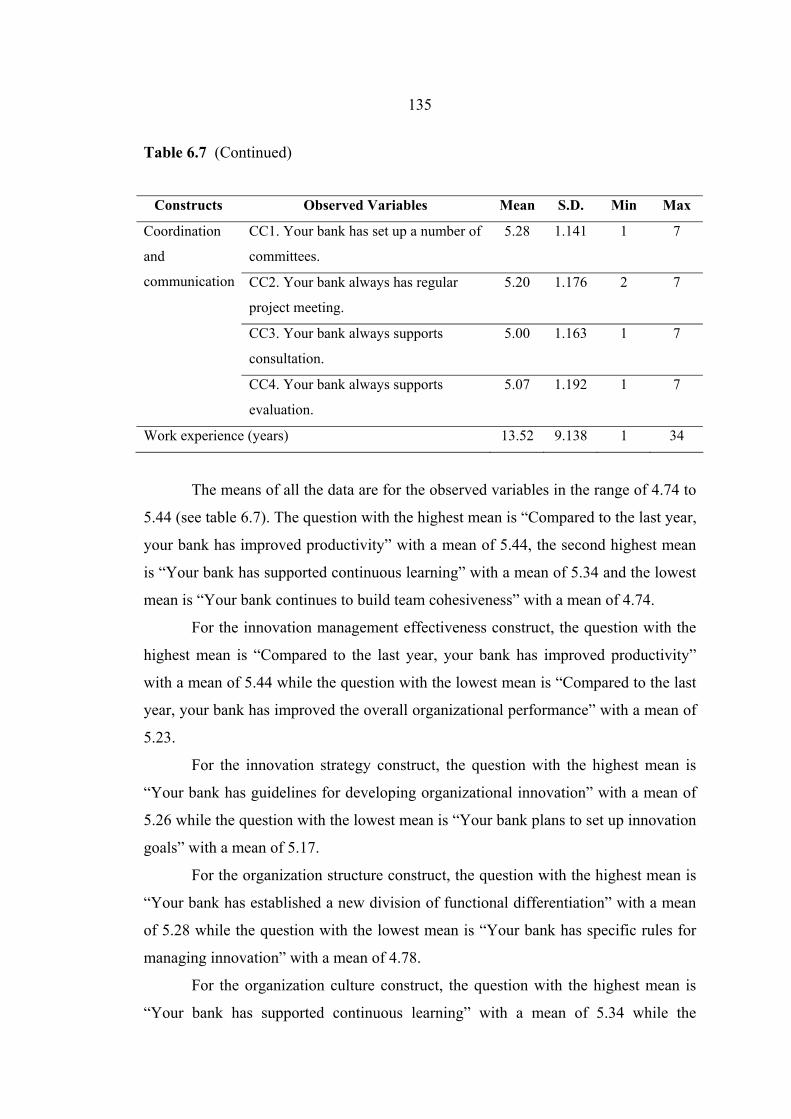
135
Table 6.7 (Continued)
Constructs Observed Variables Mean S.D. Min Max
CC1. Your bank has set up a number of
committees.
5.28 1.141 1 7
CC2. Your bank always has regular
project meeting.
5.20 1.176 2 7
CC3. Your bank always supports
consultation.
5.00 1.163 1 7
Coordination
and
communication
CC4. Your bank always supports
evaluation.
5.07 1.192 1 7
Work experience (years) 13.52 9.138 1 34
The means of all the data are for the observed variables in the range of 4.74 to
5.44 (see table 6.7). The question with the highest mean is “Compared to the last year,
your bank has improved productivity” with a mean of 5.44, the second highest mean
is “Your bank has supported continuous learning” with a mean of 5.34 and the lowest
mean is “Your bank continues to build team cohesiveness” with a mean of 4.74.
For the innovation management effectiveness construct, the question with the
highest mean is “Compared to the last year, your bank has improved productivity”
with a mean of 5.44 while the question with the lowest mean is “Compared to the last
year, your bank has improved the overall organizational performance” with a mean of
5.23.
For the innovation strategy construct, the question with the highest mean is
“Your bank has guidelines for developing organizational innovation” with a mean of
5.26 while the question with the lowest mean is “Your bank plans to set up innovation
goals” with a mean of 5.17.
For the organization structure construct, the question with the highest mean is
“Your bank has established a new division of functional differentiation” with a mean
of 5.28 while the question with the lowest mean is “Your bank has specific rules for
managing innovation” with a mean of 4.78.
For the organization culture construct, the question with the highest mean is
“Your bank has supported continuous learning” with a mean of 5.34 while the
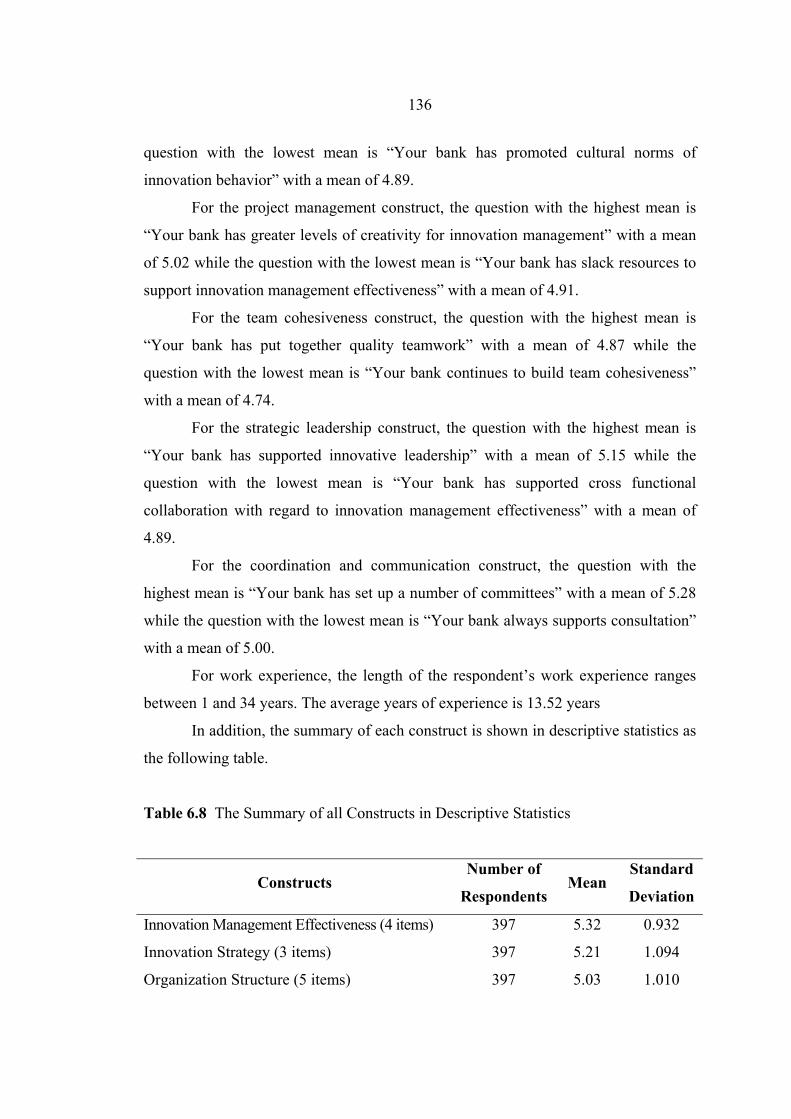
136
question with the lowest mean is “Your bank has promoted cultural norms of
innovation behavior” with a mean of 4.89.
For the project management construct, the question with the highest mean is
“Your bank has greater levels of creativity for innovation management” with a mean
of 5.02 while the question with the lowest mean is “Your bank has slack resources to
support innovation management effectiveness” with a mean of 4.91.
For the team cohesiveness construct, the question with the highest mean is
“Your bank has put together quality teamwork” with a mean of 4.87 while the
question with the lowest mean is “Your bank continues to build team cohesiveness”
with a mean of 4.74.
For the strategic leadership construct, the question with the highest mean is
“Your bank has supported innovative leadership” with a mean of 5.15 while the
question with the lowest mean is “Your bank has supported cross functional
collaboration with regard to innovation management effectiveness” with a mean of
4.89.
For the coordination and communication construct, the question with the
highest mean is “Your bank has set up a number of committees” with a mean of 5.28
while the question with the lowest mean is “Your bank always supports consultation”
with a mean of 5.00.
For work experience, the length of the respondent’s work experience ranges
between 1 and 34 years. The average years of experience is 13.52 years
In addition, the summary of each construct is shown in descriptive statistics as
the following table.
Table 6.8 The Summary of all Constructs in Descriptive Statistics
Constructs Number of
RespondentsMean
Standard
Deviation
Innovation Management Effectiveness (4 items)
Innovation Strategy (3 items)
Organization Structure (5 items)
397
397
397
5.32
5.21
5.03
0.932
1.094
1.010
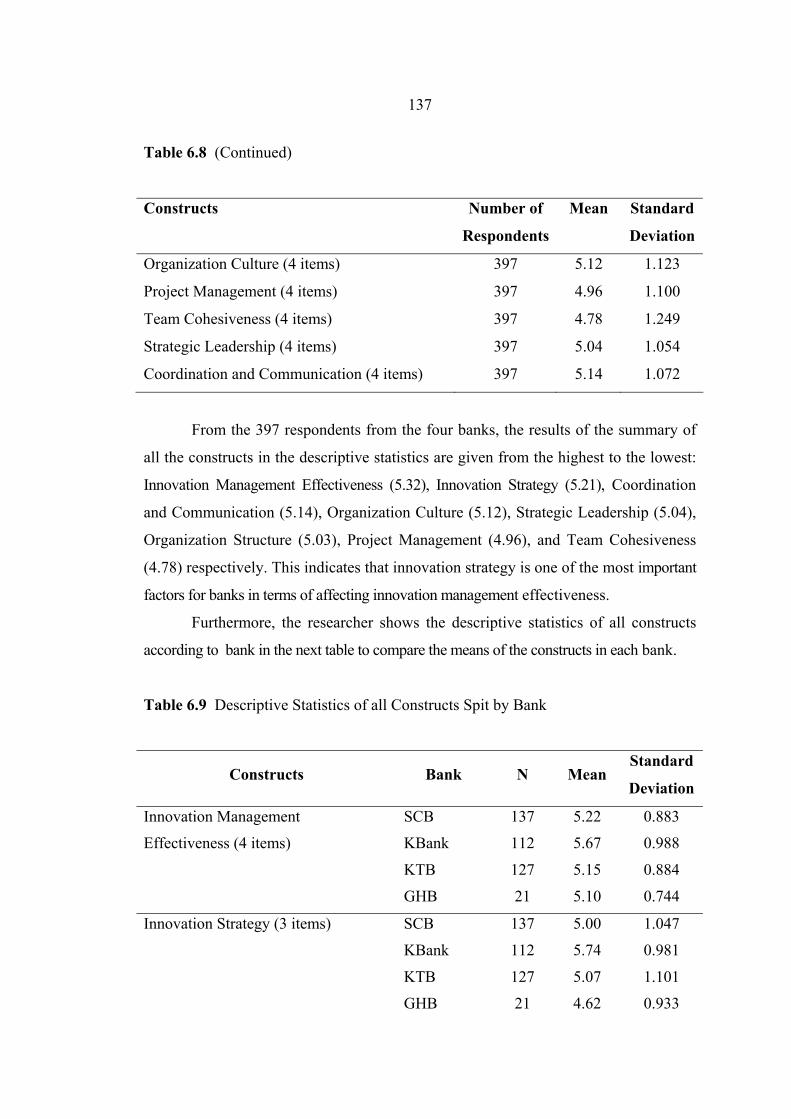
137
Table 6.8 (Continued)
Constructs Number of
Respondents
Mean Standard
Deviation
Organization Culture (4 items)
Project Management (4 items)
Team Cohesiveness (4 items)
Strategic Leadership (4 items)
Coordination and Communication (4 items)
397
397
397
397
397
5.12
4.96
4.78
5.04
5.14
1.123
1.100
1.249
1.054
1.072
From the 397 respondents from the four banks, the results of the summary of
all the constructs in the descriptive statistics are given from the highest to the lowest:
Innovation Management Effectiveness (5.32), Innovation Strategy (5.21), Coordination
and Communication (5.14), Organization Culture (5.12), Strategic Leadership (5.04),
Organization Structure (5.03), Project Management (4.96), and Team Cohesiveness
(4.78) respectively. This indicates that innovation strategy is one of the most important
factors for banks in terms of affecting innovation management effectiveness.
Furthermore, the researcher shows the descriptive statistics of all constructs
according to bank in the next table to compare the means of the constructs in each bank.
Table 6.9 Descriptive Statistics of all Constructs Spit by Bank
Constructs Bank N Mean Standard
Deviation
Innovation Management
Effectiveness (4 items)
SCB
KBank
KTB
GHB
137
112
127
21
5.22
5.67
5.15
5.10
0.883
0.988
0.884
0.744
Innovation Strategy (3 items) SCB
KBank
KTB
GHB
137
112
127
21
5.00
5.74
5.07
4.62
1.047
0.981
1.101
0.933
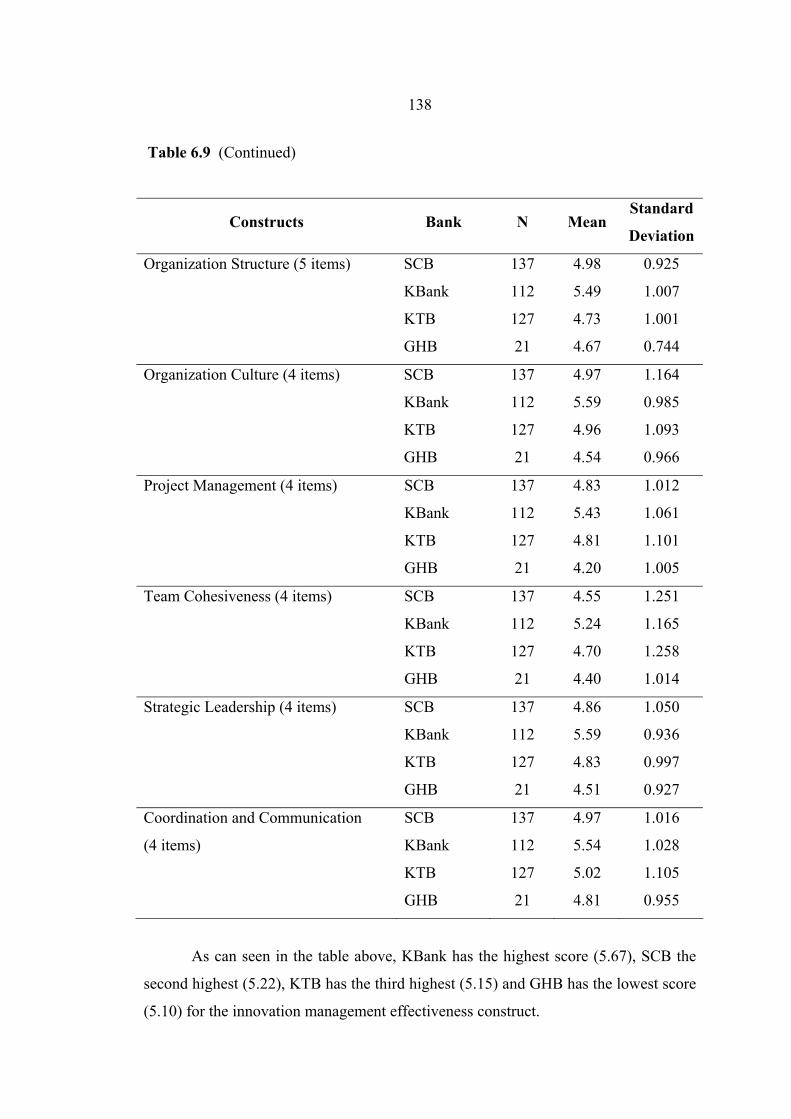
138
Table 6.9 (Continued)
Constructs Bank N Mean Standard
Deviation
Organization Structure (5 items) SCB
KBank
KTB
GHB
137
112
127
21
4.98
5.49
4.73
4.67
0.925
1.007
1.001
0.744
Organization Culture (4 items) SCB
KBank
KTB
GHB
137
112
127
21
4.97
5.59
4.96
4.54
1.164
0.985
1.093
0.966
Project Management (4 items) SCB
KBank
KTB
GHB
137
112
127
21
4.83
5.43
4.81
4.20
1.012
1.061
1.101
1.005
Team Cohesiveness (4 items) SCB
KBank
KTB
GHB
137
112
127
21
4.55
5.24
4.70
4.40
1.251
1.165
1.258
1.014
Strategic Leadership (4 items) SCB
KBank
KTB
GHB
137
112
127
21
4.86
5.59
4.83
4.51
1.050
0.936
0.997
0.927
Coordination and Communication
(4 items)
SCB
KBank
KTB
GHB
137
112
127
21
4.97
5.54
5.02
4.81
1.016
1.028
1.105
0.955
As can seen in the table above, KBank has the highest score (5.67), SCB the
second highest (5.22), KTB has the third highest (5.15) and GHB has the lowest score
(5.10) for the innovation management effectiveness construct.
139
For the innovation strategy construct, KBank (5.74), KTB (5.07), SCB (5.00)
and GHB (4.62) have the highest to lowest scores respectively.
For organization structure construct, KBank (5.49), SCB (4.98), KTB (4.73)
and GHB (4.67) have the highest to the lowest score respectively.
For the organization culture construct, KBank (5.59), SCB (4.97), KTB (4.96)
and GHB (4.54) have the highest to lowest scores respectively.
For the project management construct, KBank (5.43), SCB (4.83), KTB (4.81)
and GHB (4.20) have the highest to lowest scores respectively.
For the team cohesiveness construct, KBank (5.24), KTB (4.70), SCB (4.55)
and GHB (4.40) have the highest to lowest scores respectively.
For the strategic leadership construct, KBank (5.59), SCB (4.86), KTB (4.83)
and GHB (4.51) have the highest to lowest scores respectively.
For the coordination and communication construct, KBank (5.54), KTB
(5.02), SCB (4.97) and GHB (4.81) have the highest to lowest scores respectively.
6.3 Comparison of Means
There are several techniques available to achieve this objective through the
comparison of the means of independent groups. In this section, the researcher makes
a comparison of means by studying two factors. A t-test was used to identify the
differences among the two types of bank.
6.3.1 Comparison of Means by Type of Bank
In this study, the selected banks comprised both types of bank, that is to say
commercial and state-owned banks. The commercial banks group consisted of Siam
Commercial Bank and Kasikorn Bank while the state-owned banks group consisted of
Krung Thai Bank and Government Housing Bank. The researcher compared all the
constructs between commercial and state-owned banks
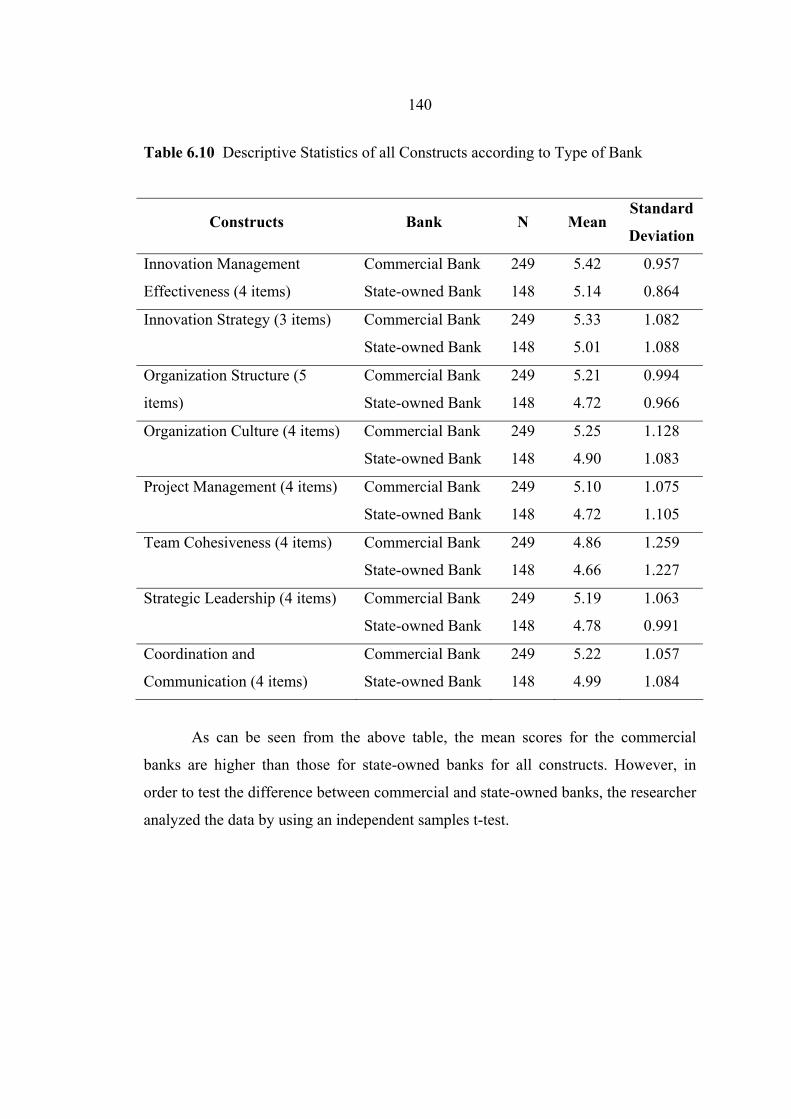
140
Table 6.10 Descriptive Statistics of all Constructs according to Type of Bank
Constructs Bank N Mean Standard
Deviation
Innovation Management
Effectiveness (4 items)
Commercial Bank
State-owned Bank
249
148
5.42
5.14
0.957
0.864
Innovation Strategy (3 items) Commercial Bank
State-owned Bank
249
148
5.33
5.01
1.082
1.088
Organization Structure (5
items)
Commercial Bank
State-owned Bank
249
148
5.21
4.72
0.994
0.966
Organization Culture (4 items) Commercial Bank
State-owned Bank
249
148
5.25
4.90
1.128
1.083
Project Management (4 items) Commercial Bank
State-owned Bank
249
148
5.10
4.72
1.075
1.105
Team Cohesiveness (4 items) Commercial Bank
State-owned Bank
249
148
4.86
4.66
1.259
1.227
Strategic Leadership (4 items) Commercial Bank
State-owned Bank
249
148
5.19
4.78
1.063
0.991
Coordination and
Communication (4 items)
Commercial Bank
State-owned Bank
249
148
5.22
4.99
1.057
1.084
As can be seen from the above table, the mean scores for the commercial
banks are higher than those for state-owned banks for all constructs. However, in
order to test the difference between commercial and state-owned banks, the researcher
analyzed the data by using an independent samples t-test.
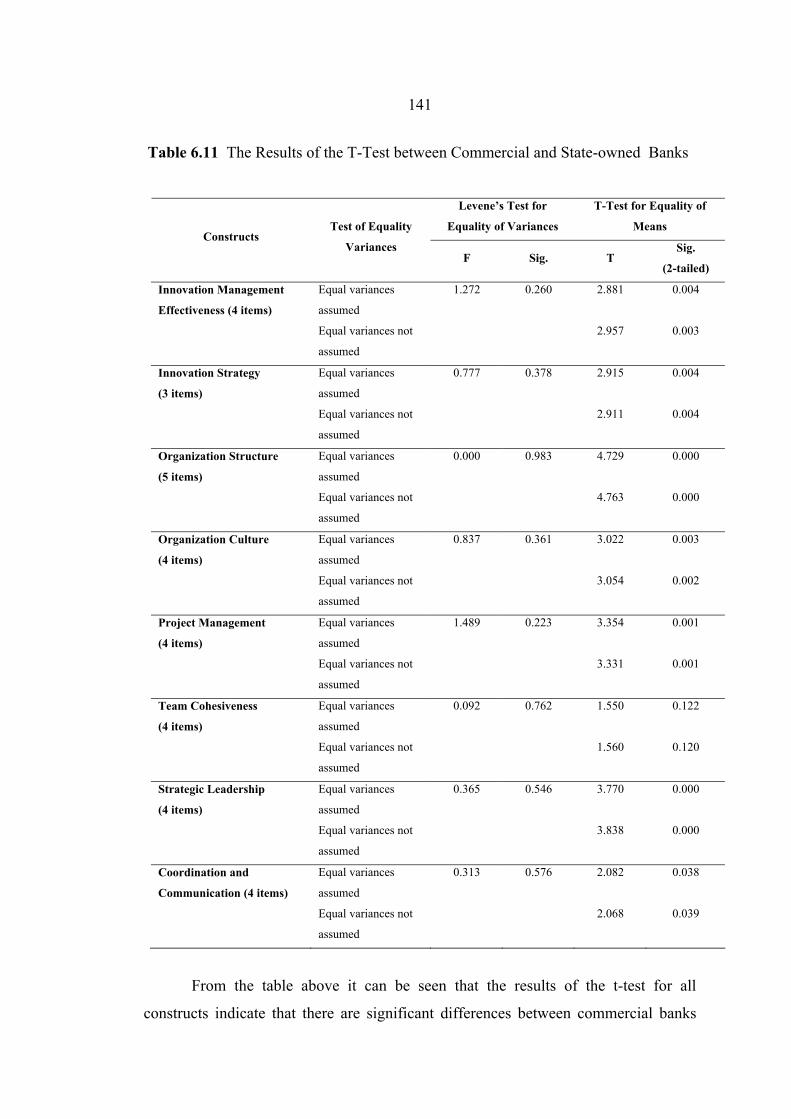
141
Table 6.11 The Results of the T-Test between Commercial and State-owned Banks
Levene’s Test for
Equality of Variances
T-Test for Equality of
Means Constructs
Test of Equality
Variances F Sig. T
Sig.
(2-tailed)
Innovation Management
Effectiveness (4 items)
Equal variances
assumed
Equal variances not
assumed
1.272 0.260 2.881
2.957
0.004
0.003
Innovation Strategy
(3 items)
Equal variances
assumed
Equal variances not
assumed
0.777 0.378 2.915
2.911
0.004
0.004
Organization Structure
(5 items)
Equal variances
assumed
Equal variances not
assumed
0.000 0.983 4.729
4.763
0.000
0.000
Organization Culture
(4 items)
Equal variances
assumed
Equal variances not
assumed
0.837 0.361 3.022
3.054
0.003
0.002
Project Management
(4 items)
Equal variances
assumed
Equal variances not
assumed
1.489 0.223 3.354
3.331
0.001
0.001
Team Cohesiveness
(4 items)
Equal variances
assumed
Equal variances not
assumed
0.092 0.762 1.550
1.560
0.122
0.120
Strategic Leadership
(4 items)
Equal variances
assumed
Equal variances not
assumed
0.365 0.546 3.770
3.838
0.000
0.000
Coordination and
Communication (4 items)
Equal variances
assumed
Equal variances not
assumed
0.313 0.576 2.082
2.068
0.038
0.039
From the table above it can be seen that the results of the t-test for all
constructs indicate that there are significant differences between commercial banks
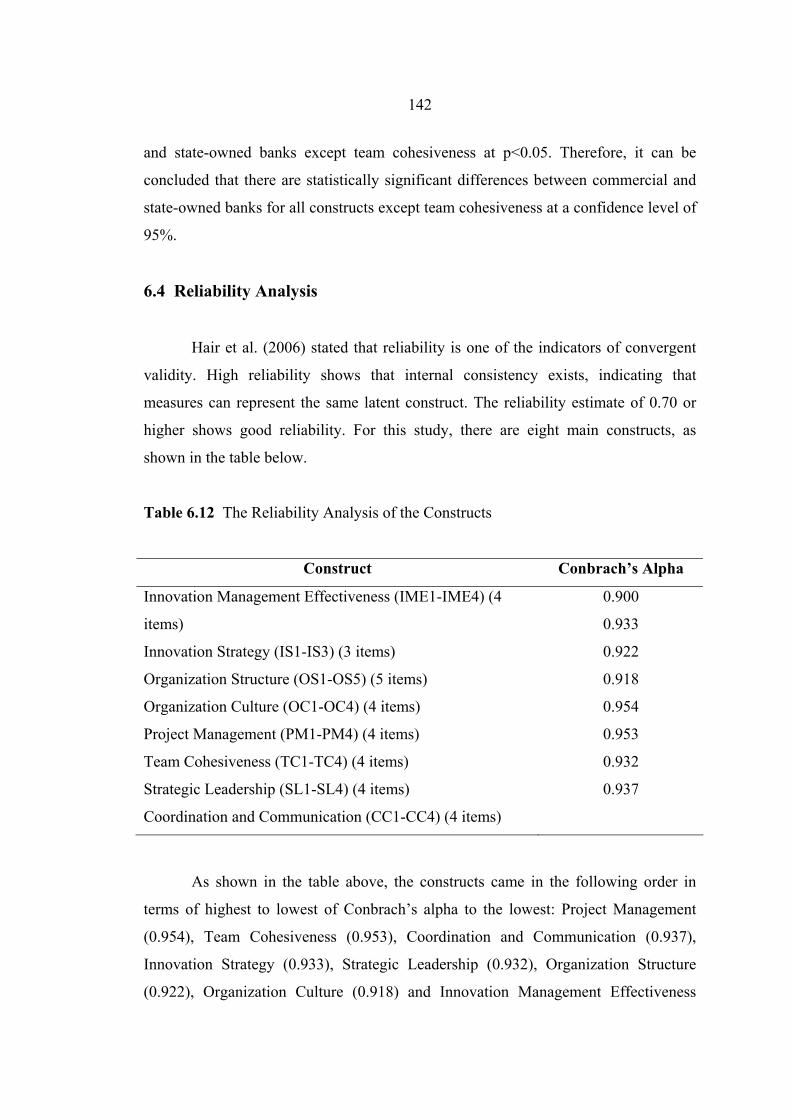
142
and state-owned banks except team cohesiveness at p<0.05. Therefore, it can be
concluded that there are statistically significant differences between commercial and
state-owned banks for all constructs except team cohesiveness at a confidence level of
95%.
6.4 Reliability Analysis
Hair et al. (2006) stated that reliability is one of the indicators of convergent
validity. High reliability shows that internal consistency exists, indicating that
measures can represent the same latent construct. The reliability estimate of 0.70 or
higher shows good reliability. For this study, there are eight main constructs, as
shown in the table below.
Table 6.12 The Reliability Analysis of the Constructs
Construct Conbrach’s Alpha
Innovation Management Effectiveness (IME1-IME4) (4
items)
Innovation Strategy (IS1-IS3) (3 items)
Organization Structure (OS1-OS5) (5 items)
Organization Culture (OC1-OC4) (4 items)
Project Management (PM1-PM4) (4 items)
Team Cohesiveness (TC1-TC4) (4 items)
Strategic Leadership (SL1-SL4) (4 items)
Coordination and Communication (CC1-CC4) (4 items)
0.900
0.933
0.922
0.918
0.954
0.953
0.932
0.937
As shown in the table above, the constructs came in the following order in
terms of highest to lowest of Conbrach’s alpha to the lowest: Project Management
(0.954), Team Cohesiveness (0.953), Coordination and Communication (0.937),
Innovation Strategy (0.933), Strategic Leadership (0.932), Organization Structure
(0.922), Organization Culture (0.918) and Innovation Management Effectiveness
143
(0.900). These scores indicates that all constructs are highly reliable because the
Cronbach’s alpha scores of all eight constructs are higher than 0.8.
6.5 Validity
6.5.1 Convergent Validity
According to Hair et al. (2006), convergent validity means the ability of some
measures to have convergent validity when they are highly correlated with different
measures of similar constructs. In other words, convergent validity is the extent to
which the scale correlates positively with other measures of the same construct. The
results shown as convergent validity are tested by evaluating the magnitude of factor
loadings of observed variables on the proposed constructs or latent variables.
Anderson and Gerbing (1988) have suggested that good convergent validity exists
when the standardized factor loadings of each item exceeds 0.40 (Lin and Germain,
2003) and all t-values are higher than the significant level (i.e. t-value is higher than 2).
In this study, the construct measurement model was tested for convergent
validity as follows:-.
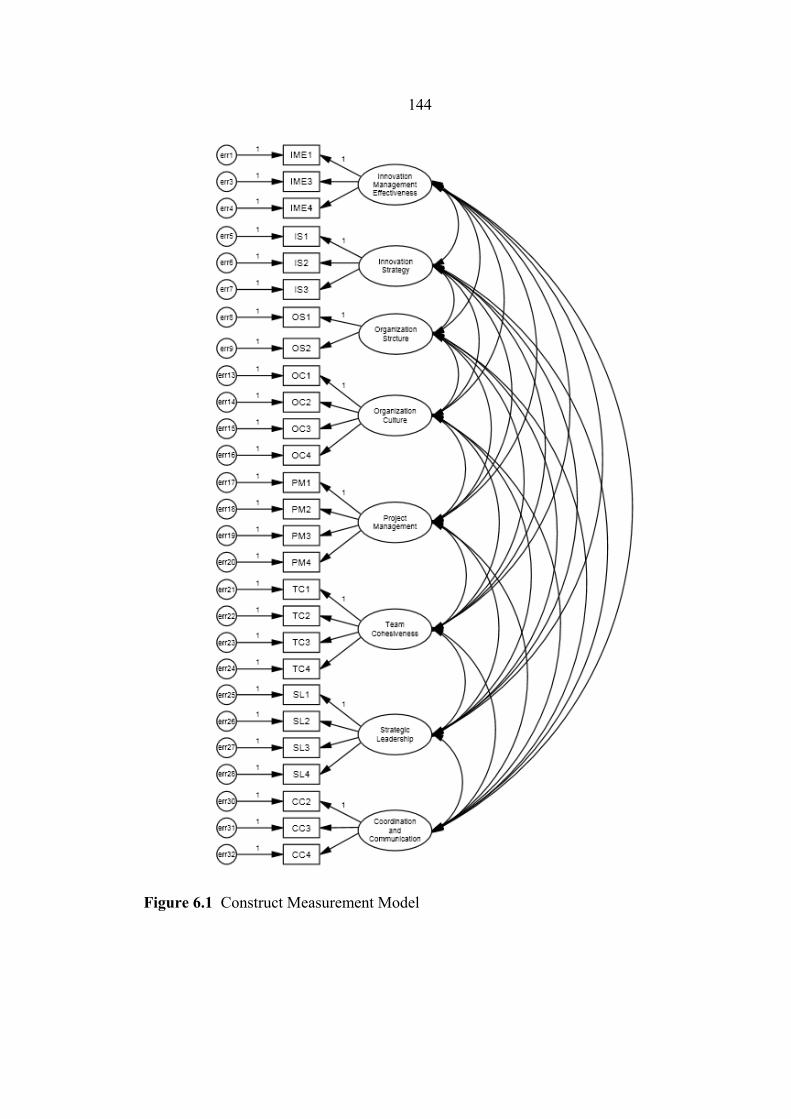
144
Figure 6.1 Construct Measurement Model
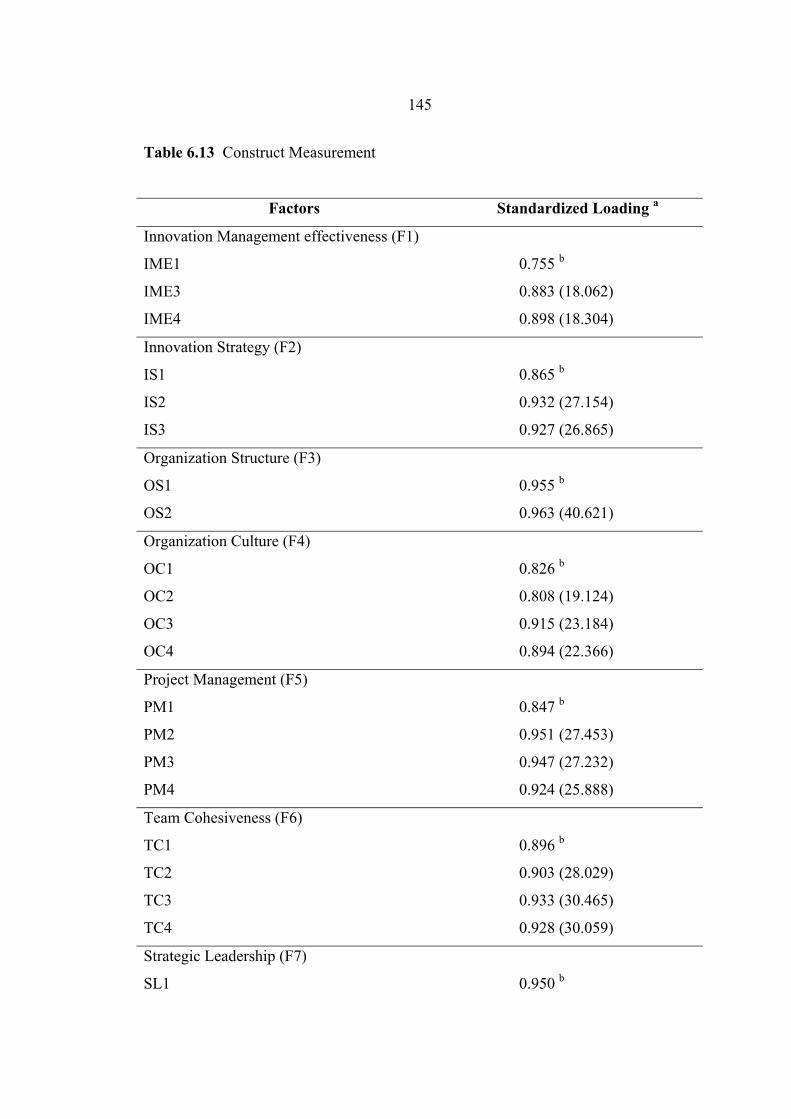
145
Table 6.13 Construct Measurement
Factors Standardized Loading a
Innovation Management effectiveness (F1)
IME1
IME3
IME4
0.755 b
0.883 (18.062)
0.898 (18.304)
Innovation Strategy (F2)
IS1
IS2
IS3
0.865 b
0.932 (27.154)
0.927 (26.865)
Organization Structure (F3)
OS1
OS2
0.955 b
0.963 (40.621)
Organization Culture (F4)
OC1
OC2
OC3
OC4
0.826 b
0.808 (19.124)
0.915 (23.184)
0.894 (22.366)
Project Management (F5)
PM1
PM2
PM3
PM4
0.847 b
0.951 (27.453)
0.947 (27.232)
0.924 (25.888)
Team Cohesiveness (F6)
TC1
TC2
TC3
TC4
0.896 b
0.903 (28.029)
0.933 (30.465)
0.928 (30.059)
Strategic Leadership (F7)
SL1
0.950 b
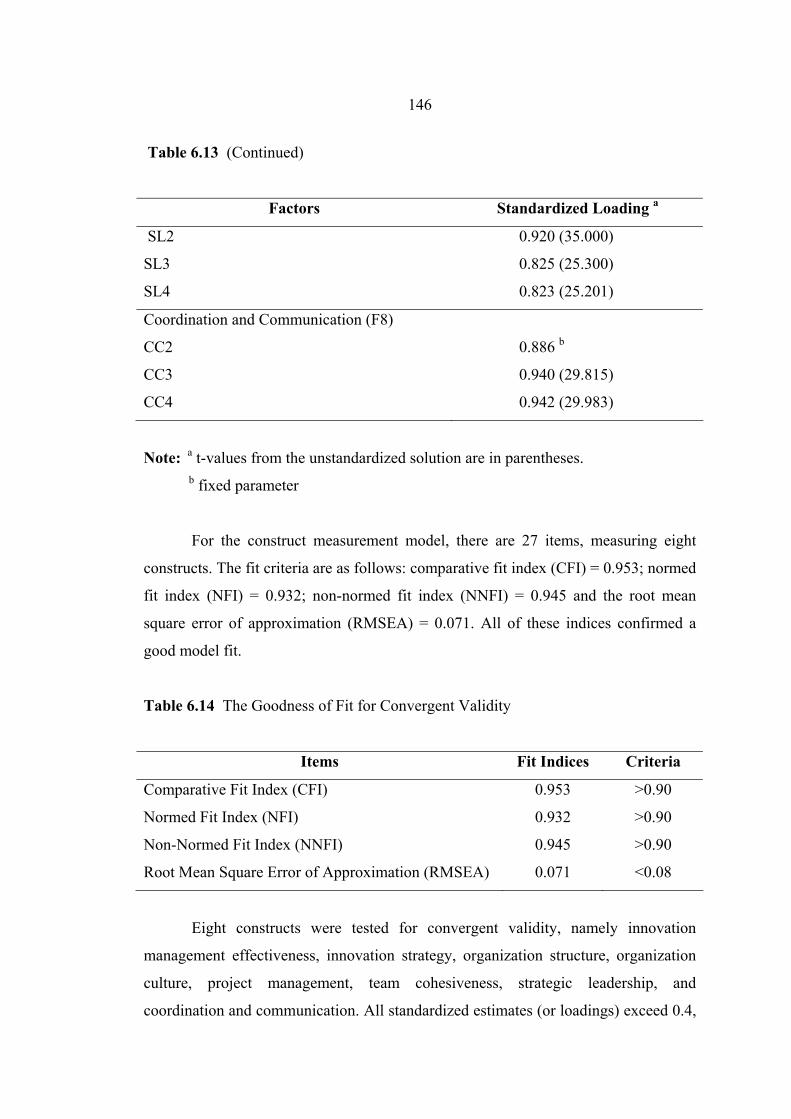
146
Table 6.13 (Continued)
Factors Standardized Loading a
SL2
SL3
SL4
0.920 (35.000)
0.825 (25.300)
0.823 (25.201)
Coordination and Communication (F8)
CC2
CC3
CC4
0.886 b
0.940 (29.815)
0.942 (29.983)
Note: a t-values from the unstandardized solution are in parentheses. b fixed parameter
For the construct measurement model, there are 27 items, measuring eight
constructs. The fit criteria are as follows: comparative fit index (CFI) = 0.953; normed
fit index (NFI) = 0.932; non-normed fit index (NNFI) = 0.945 and the root mean
square error of approximation (RMSEA) = 0.071. All of these indices confirmed a
good model fit.
Table 6.14 The Goodness of Fit for Convergent Validity
Items Fit Indices Criteria
Comparative Fit Index (CFI)
Normed Fit Index (NFI)
Non-Normed Fit Index (NNFI)
Root Mean Square Error of Approximation (RMSEA)
0.953
0.932
0.945
0.071
>0.90
>0.90
>0.90
<0.08
Eight constructs were tested for convergent validity, namely innovation
management effectiveness, innovation strategy, organization structure, organization
culture, project management, team cohesiveness, strategic leadership, and
coordination and communication. All standardized estimates (or loadings) exceed 0.4,
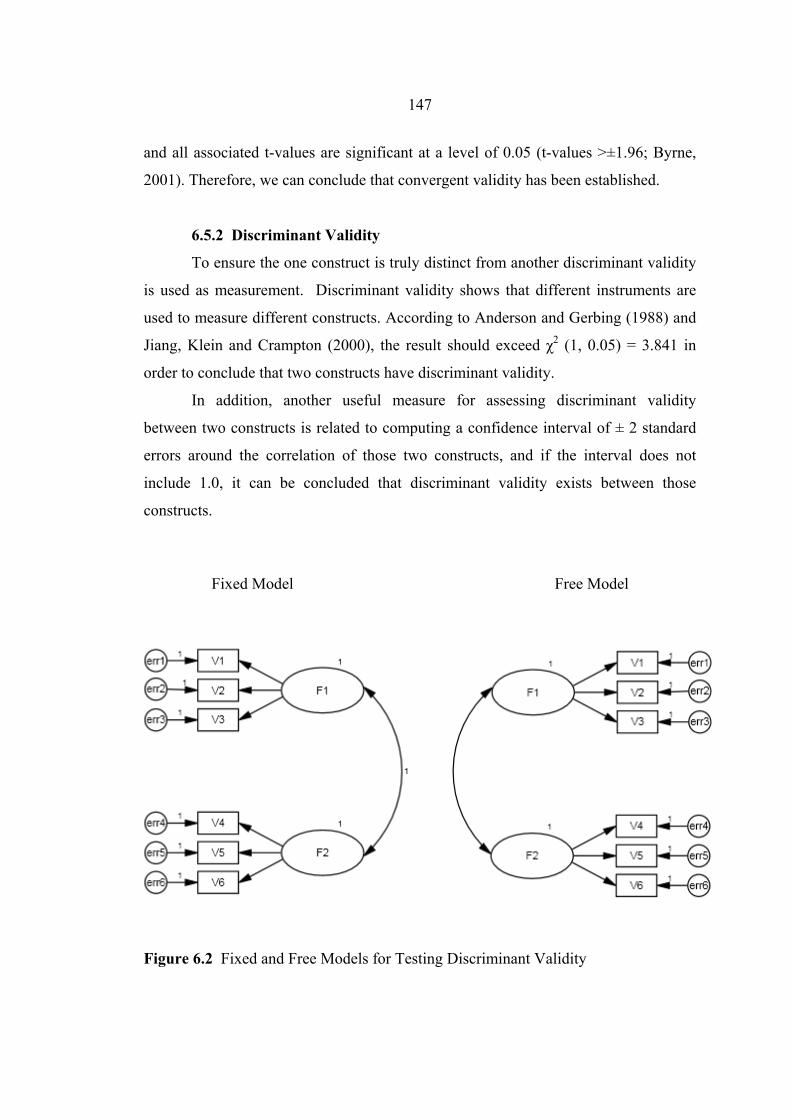
147
and all associated t-values are significant at a level of 0.05 (t-values >±1.96; Byrne,
2001). Therefore, we can conclude that convergent validity has been established.
6.5.2 Discriminant Validity
To ensure the one construct is truly distinct from another discriminant validity
is used as measurement. Discriminant validity shows that different instruments are
used to measure different constructs. According to Anderson and Gerbing (1988) and
Jiang, Klein and Crampton (2000), the result should exceed χ2 (1, 0.05) = 3.841 in
order to conclude that two constructs have discriminant validity.
In addition, another useful measure for assessing discriminant validity
between two constructs is related to computing a confidence interval of ± 2 standard
errors around the correlation of those two constructs, and if the interval does not
include 1.0, it can be concluded that discriminant validity exists between those
constructs.
Fixed Model Free Model
Figure 6.2 Fixed and Free Models for Testing Discriminant Validity
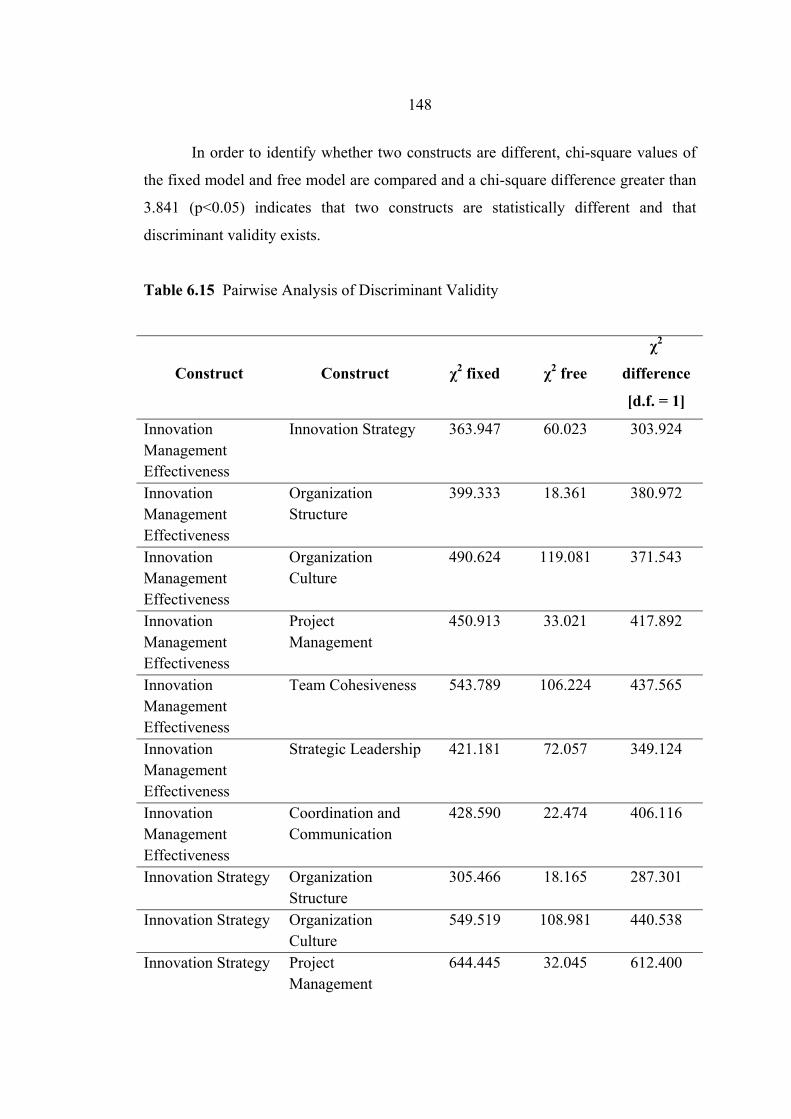
148
In order to identify whether two constructs are different, chi-square values of
the fixed model and free model are compared and a chi-square difference greater than
3.841 (p<0.05) indicates that two constructs are statistically different and that
discriminant validity exists.
Table 6.15 Pairwise Analysis of Discriminant Validity
Construct Construct χ2 fixed χ2 free
χ2
difference
[d.f. = 1]
Innovation Management Effectiveness
Innovation Strategy 363.947 60.023 303.924
Innovation Management Effectiveness
Organization Structure
399.333 18.361 380.972
Innovation Management Effectiveness
Organization Culture
490.624 119.081 371.543
Innovation Management Effectiveness
Project Management
450.913 33.021 417.892
Innovation Management Effectiveness
Team Cohesiveness 543.789 106.224 437.565
Innovation Management Effectiveness
Strategic Leadership 421.181 72.057 349.124
Innovation Management Effectiveness
Coordination and Communication
428.590 22.474 406.116
Innovation Strategy Organization Structure
305.466 18.165 287.301
Innovation Strategy Organization Culture
549.519 108.981 440.538
Innovation Strategy Project Management
644.445 32.045 612.400
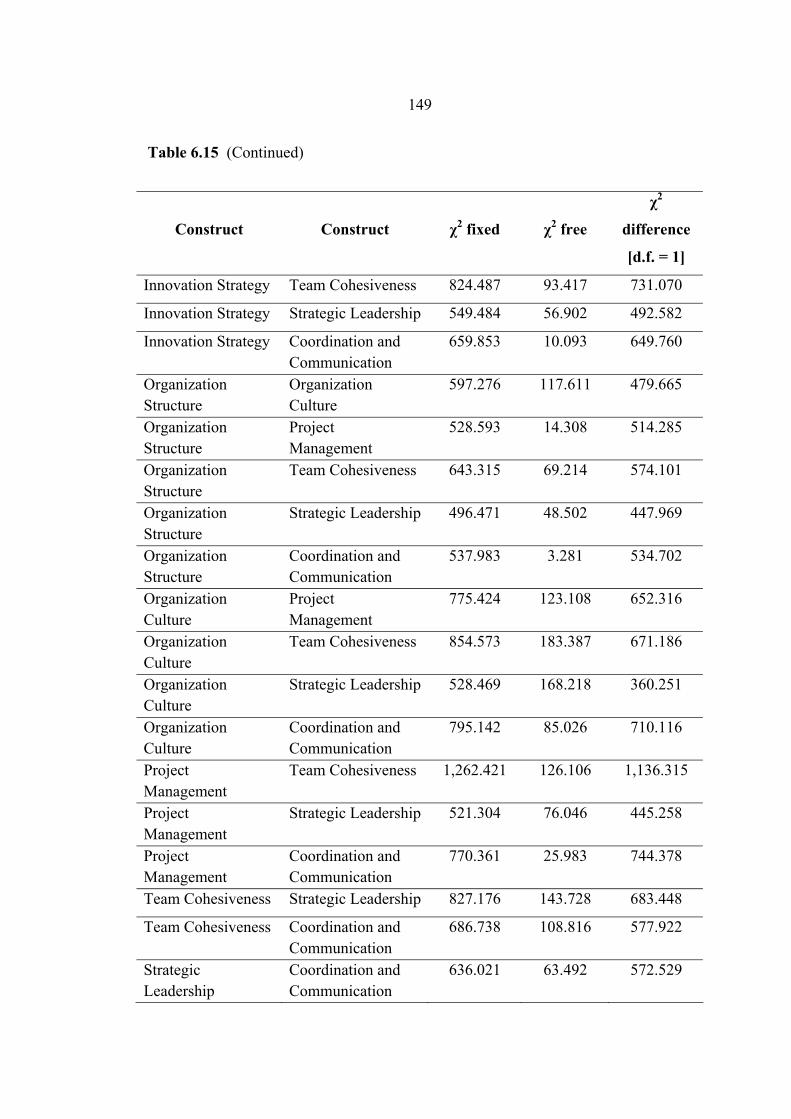
149
Table 6.15 (Continued)
Construct Construct χ2 fixed χ2 free
χ2
difference
[d.f. = 1]
Innovation Strategy Team Cohesiveness 824.487 93.417 731.070
Innovation Strategy Strategic Leadership 549.484 56.902 492.582
Innovation Strategy Coordination and Communication
659.853 10.093 649.760
Organization Structure
Organization Culture
597.276 117.611 479.665
Organization Structure
Project Management
528.593 14.308 514.285
Organization Structure
Team Cohesiveness 643.315 69.214 574.101
Organization Structure
Strategic Leadership 496.471 48.502 447.969
Organization Structure
Coordination and Communication
537.983 3.281 534.702
Organization Culture
Project Management
775.424 123.108 652.316
Organization Culture
Team Cohesiveness 854.573 183.387 671.186
Organization Culture
Strategic Leadership 528.469 168.218 360.251
Organization Culture
Coordination and Communication
795.142 85.026 710.116
Project Management
Team Cohesiveness 1,262.421 126.106 1,136.315
Project Management
Strategic Leadership 521.304 76.046 445.258
Project Management
Coordination and Communication
770.361 25.983 744.378
Team Cohesiveness Strategic Leadership 827.176 143.728 683.448
Team Cohesiveness Coordination and Communication
686.738 108.816 577.922
Strategic Leadership
Coordination and Communication
636.021 63.492 572.529
150
According to the discriminant validity analysis, all constructs indicate that
they are distinct from one another, meeting the criteria of the chi-square difference of
each pair of constructs exceeding 3.841. In addition, the highest χ2 difference is
1,136.315 for project management and team cohesiveness, and the lowest χ2
difference is 287.301 for innovation strategy and organization structure.
For these reasons, each construct is tested and there was sufficient evidence to
indicate that each construct was distinct from one another (Katsikea et al., 2005).
6.6 Model Assessment
One of the main goals for using confirmatory factor analysis is to identify how
well the observed data fit the proposed model of the researcher. However, there is no
one absolute statistical significance test for assessing the goodness-of-fit of the model
to the observed data of researchers. It is crucial to use multiple criteria and to assess
model fit on the basis of several measures or criteria simultaneously.
In this study, the data were analyzed by using structural equation modeling
(SEM) and the confirmatory factor analysis (CFA) technique. The researcher
analyzed the data with SPSS AMOS 18.0. With the research questions proposed,
structural equation modeling and confirmatory factor analysis were chosen as the
most appropriate methods because they offered the most appropriate and most
efficient estimation technique (Hair et al., 2006). In addition, ERLS (elliptical
reweighted least squares) was applied because this method minimizes the problems
occurring from data skewness and kurtosis, and this method has been shown to
provide unbiased parameter estimates for both normal and non-normal data (Sharma,
Durvasula and Dillon, 1989) because the data distribution was found to deviate from
the normal distribution. Sharma, Durvasula and Dillon (1989) further stated that
ERLS for non-normal data are equivalent in performance to the Maximum Likelihood
(ML) estimation. Moreover, compared with all other elliptical estimation techniques,
ERLS was superior in performance. This ERLS method has an advantage over
Maximum Likelihood (ML) in that it is less constrained by the normality assumptions
of the data (Browne, 1984). Moreover, with normal data conditions, ERLS performs
as well as ML, but it performs better than the ML procedure when data are non-
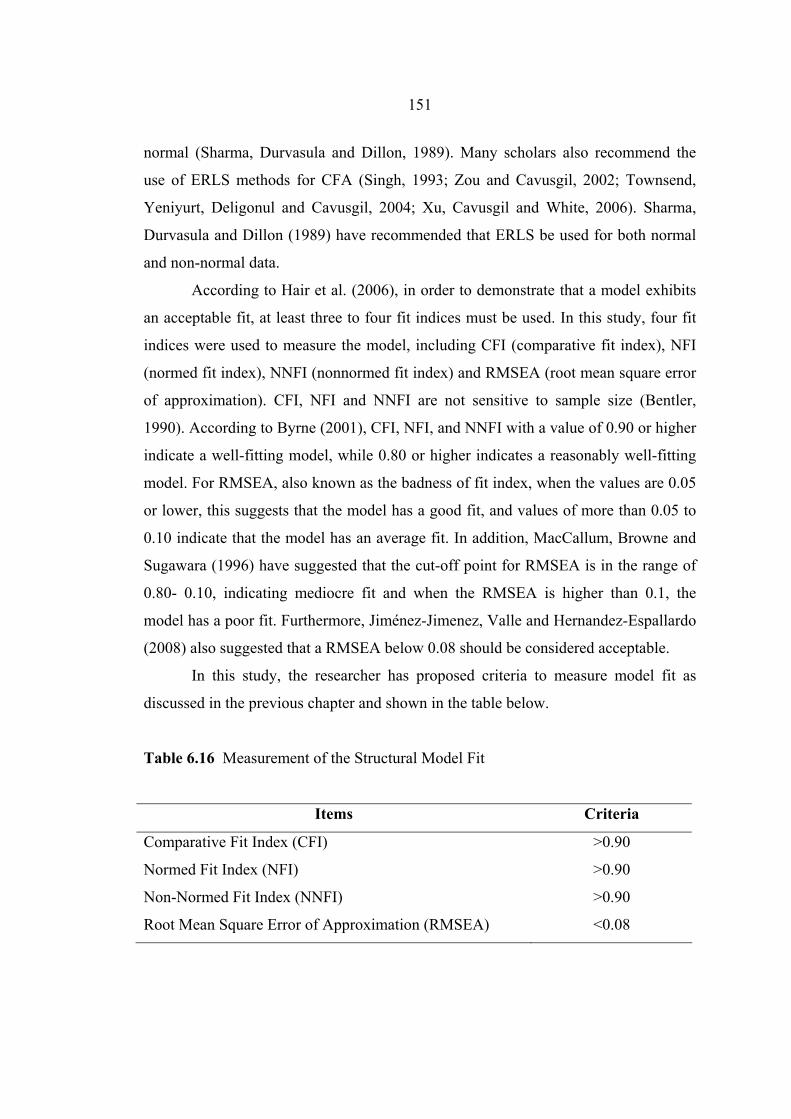
151
normal (Sharma, Durvasula and Dillon, 1989). Many scholars also recommend the
use of ERLS methods for CFA (Singh, 1993; Zou and Cavusgil, 2002; Townsend,
Yeniyurt, Deligonul and Cavusgil, 2004; Xu, Cavusgil and White, 2006). Sharma,
Durvasula and Dillon (1989) have recommended that ERLS be used for both normal
and non-normal data.
According to Hair et al. (2006), in order to demonstrate that a model exhibits
an acceptable fit, at least three to four fit indices must be used. In this study, four fit
indices were used to measure the model, including CFI (comparative fit index), NFI
(normed fit index), NNFI (nonnormed fit index) and RMSEA (root mean square error
of approximation). CFI, NFI and NNFI are not sensitive to sample size (Bentler,
1990). According to Byrne (2001), CFI, NFI, and NNFI with a value of 0.90 or higher
indicate a well-fitting model, while 0.80 or higher indicates a reasonably well-fitting
model. For RMSEA, also known as the badness of fit index, when the values are 0.05
or lower, this suggests that the model has a good fit, and values of more than 0.05 to
0.10 indicate that the model has an average fit. In addition, MacCallum, Browne and
Sugawara (1996) have suggested that the cut-off point for RMSEA is in the range of
0.80- 0.10, indicating mediocre fit and when the RMSEA is higher than 0.1, the
model has a poor fit. Furthermore, Jiménez-Jimenez, Valle and Hernandez-Espallardo
(2008) also suggested that a RMSEA below 0.08 should be considered acceptable.
In this study, the researcher has proposed criteria to measure model fit as
discussed in the previous chapter and shown in the table below.
Table 6.16 Measurement of the Structural Model Fit
Items Criteria
Comparative Fit Index (CFI)
Normed Fit Index (NFI)
Non-Normed Fit Index (NNFI)
Root Mean Square Error of Approximation (RMSEA)
>0.90
>0.90
>0.90
<0.08
152
Tests of Proposed Models
The researcher has developed the models in steps, as follows:
1) In the first proposed model of innovation strategy, organization structure,
organization culture, project management, team cohesiveness and strategic leadership
(six factors) are in the path of innovation management effectiveness.
2) In the second proposed model of innovation strategy, organization culture,
project management and team cohesiveness (four factors) are in the path of innovation
management effectiveness, strategic leadership is in the path of innovation strategy
and the other coordination and communication is in the path of team cohesiveness.
3) In the third proposed model of innovation strategy, organization culture,
project management, team cohesiveness, organization type and manager position and
strategic leadership are in the path of innovation strategy and coordination and
communication. are also in the path of team cohesiveness.
6.6.1 Proposed Model 1
The first proposed model of innovation strategy, organization structure,
organization culture, project management, team cohesiveness and strategic leadership
(six factors) are in the path of innovation management effectiveness.
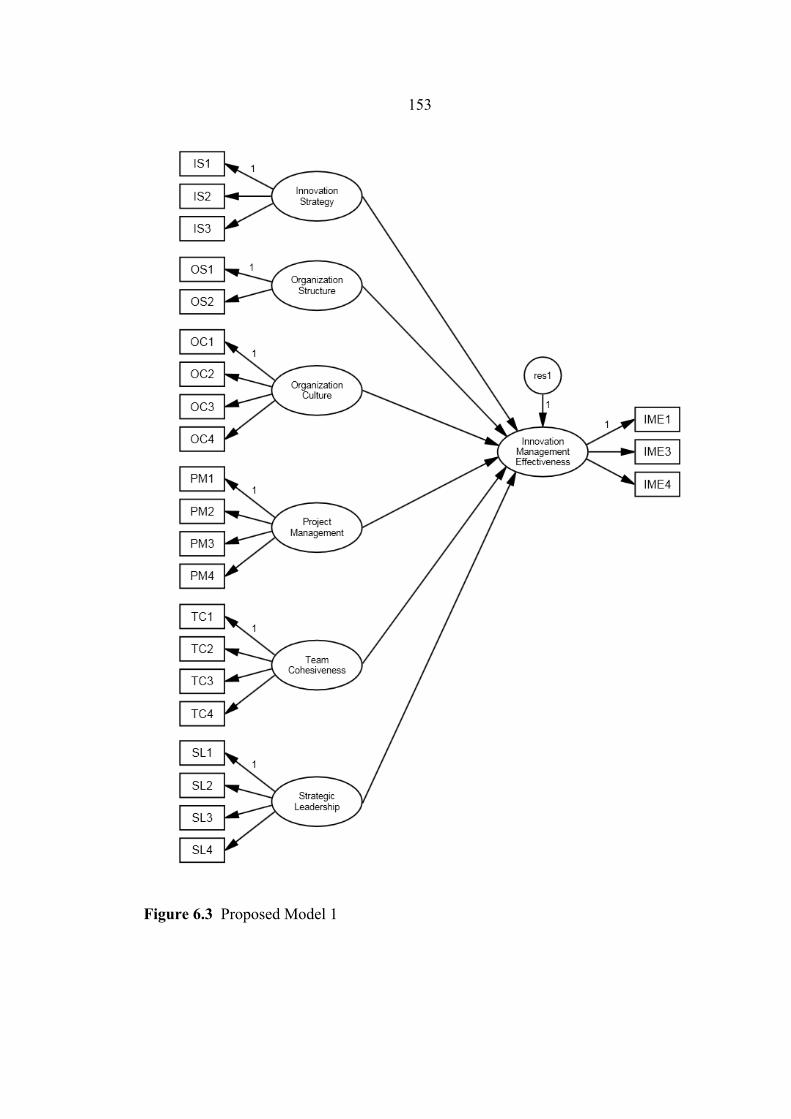
153
Figure 6.3 Proposed Model 1
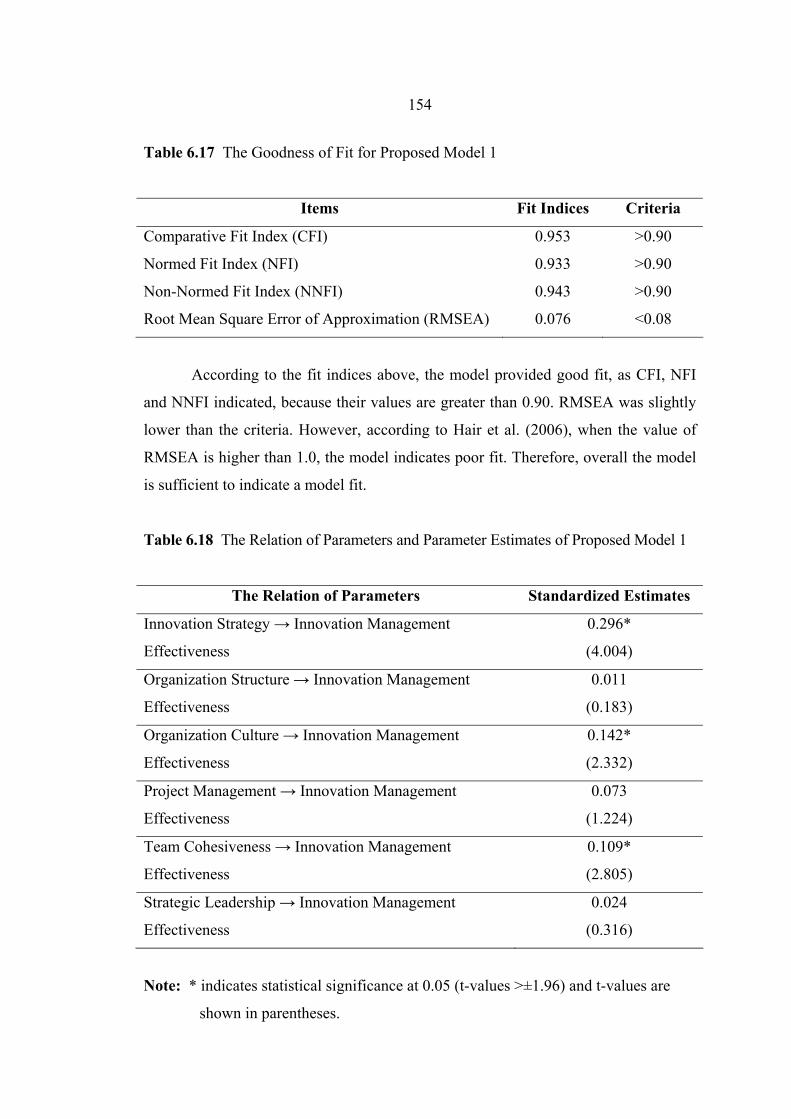
154
Table 6.17 The Goodness of Fit for Proposed Model 1
Items Fit Indices Criteria
Comparative Fit Index (CFI)
Normed Fit Index (NFI)
Non-Normed Fit Index (NNFI)
Root Mean Square Error of Approximation (RMSEA)
0.953
0.933
0.943
0.076
>0.90
>0.90
>0.90
<0.08
According to the fit indices above, the model provided good fit, as CFI, NFI
and NNFI indicated, because their values are greater than 0.90. RMSEA was slightly
lower than the criteria. However, according to Hair et al. (2006), when the value of
RMSEA is higher than 1.0, the model indicates poor fit. Therefore, overall the model
is sufficient to indicate a model fit.
Table 6.18 The Relation of Parameters and Parameter Estimates of Proposed Model 1
The Relation of Parameters Standardized Estimates
Innovation Strategy → Innovation Management
Effectiveness
0.296*
(4.004)
Organization Structure → Innovation Management
Effectiveness
0.011
(0.183)
Organization Culture → Innovation Management
Effectiveness
0.142*
(2.332)
Project Management → Innovation Management
Effectiveness
0.073
(1.224)
Team Cohesiveness → Innovation Management
Effectiveness
0.109*
(2.805)
Strategic Leadership → Innovation Management
Effectiveness
0.024
(0.316)
Note: * indicates statistical significance at 0.05 (t-values >±1.96) and t-values are
shown in parentheses.
155
The results show that in respective order innovation strategy (path coefficient
= 0.296 and t-value = 4.004), organization culture (path coefficient = 0.142 and t-
value = 2.332) and team cohesiveness (path coefficient = 0.109 and t-value = 2.805)
have statistically significant positive effect on innovation management effectiveness,
while there were no statistically significant effects of organization structure (path
coefficient = 0.011 and t-value = 0.183), strategic leadership (path coefficient = 0.024
and t-value = 0.316) and project management (path coefficient = 0.073 and t-value =
1.224) on innovation management effectiveness, respectively.
6.6.1.1 Testing of Research Hypotheses
According to the framework in the previous chapter, the researcher
proposed research hypotheses and the results of the hypotheses testing are as follows:
Theoretical Aspect (Proposed Model 1)
1) Innovation Strategy
H1: Innovation strategy has a positive effect on innovation
management effectiveness
This hypothesis is supported in that innovation strategy has a
positive effect on innovation management effectiveness with a path coefficient of
0.296 and t-value of 4.004. This indicates that higher innovation strategy leads to a
higher degree of innovation management effectiveness. As suggested in the literature,
the relationship of innovation strategy is a positive one with innovation management
effectiveness. This result supported the work of Mphahlele (2006), Martins and
Terblanche (2003), Vlok (2005) and Dewar and Dutton (1986).
2) Organization Structure
H2: Organization structure has a positive effect on innovation
management effectiveness
This hypothesis is not supported in that organization structure
has a positive effect on innovation management effectiveness with a path coefficient
of 0.011 and t-value of 0.183. This indicates that organization structure has no
statistical effect on innovation management effectiveness. However, the work of
Mphahlele (2006), Burns and Stalker (1961), Zaltman, Duncan and Holbek (1973)
and Hage and Aiken (1970) supported the assertion that relationship of organization
156
structure is positive with innovation management effectiveness as suggested in the
literature.
3) Organization Culture
H3: Organization culture has a positive effect on innovation
management effectiveness
This hypothesis is supported in that organization culture has a
positive effect on innovation management effectiveness with a path coefficient of
0.142 and t-value of 2.332. This indicates that higher organization culture leads to a
higher degree of innovation management effectiveness. As suggested in the literature,
the relationship of organization culture has a positive effect on with innovation
management effectiveness. This result supports the work of Martins and Martins
(2002), Martins (2000) and Adams, Bessant and Phelps (2006).
4) Project Management
H4: Project management has a positive effect on innovation
management effectiveness
This hypothesis is not supported in that project management
has a positive effect on innovation management effectiveness with a path coefficient
of 0.073 and t-value of 1.224. This indicates that project management has no
statistical effect on innovation management effectiveness. However, the work of
Adams, Bessant and Phelps (2006), Globe et al. (1973) and Keegan and Turner (2002)
which supported the relationship of project management as being positive with
innovation management effectiveness as suggested in the literature.
5) Team Cohesiveness
H5: Team cohesiveness has a positive effect on innovation
management effectiveness
This hypothesis is supported in that team cohesiveness has a
positive effect on innovation management effectiveness with a path coefficient =
0.109 and t-value = 2.805. This indicates that higher team cohesiveness leads to a
higher degree of innovation management effectiveness. As suggested in the literature,
the relationship of team cohesiveness is positive with innovation management
effectiveness. This result supports the work of Mullen and Cooper (1994), Langfred
(1998) and Guzzo and Dickson (1996).
157
6) Strategic Leadership
H6: Strategic leadership has a positive effect on innovation
management effectiveness
This hypothesis is not supported in that strategic leadership has
a positive effect on innovation management effectiveness with a path coefficient of
0.024 and t-value of 0.316. This indicates that strategic leadership has no statistical
effect on innovation management effectiveness. However, the work of Foster and
Pryor (1986), Rothwell (1994) and Kanter (1985) supported the relationship of
strategic leadership as being positive one with innovation management effectiveness
as suggested in the literature.
In conclusion, from the testing of the hypotheses on Proposed Model 1
above, the path coefficients of innovation strategy, organization culture, team
cohesiveness have a positive influence on innovation management effectiveness.
However, the level of impact on the relationship among the constructs
is different. The three constructs of innovation strategy, organization culture and team
cohesiveness and their relationships to innovation management effectiveness indicates
that innovation strategy with a path coefficient of 0.296 has the highest statistically
positive impact on innovation management effectiveness followed by organization
culture with a path coefficient of 0.142 and team cohesiveness with a path coefficient
of 0.109. On the other hand, the three constructs of organization structure, project
management and strategic leadership have a positive influence on innovation
management effectiveness but the lack of statistical no significance indicates that
organization structure with path of coefficient of 0.011, strategic leadership with path
of coefficient of 0.024 and project management with a path coefficient of 0.073 have
no statistically positive impact on innovation management effectiveness, respectively.
From the implication point of view, Proposed Model 1 can be
explained by the strategic innovation process rather than resources-based view and
organizational theory. From the theoretical aspect, innovation strategy is one of the
key strategic implementation while organization culture also plays a key role in terms
of the development of culture norm and the building of team cohesiveness under the
organization climate of creativity and innovation behavior.
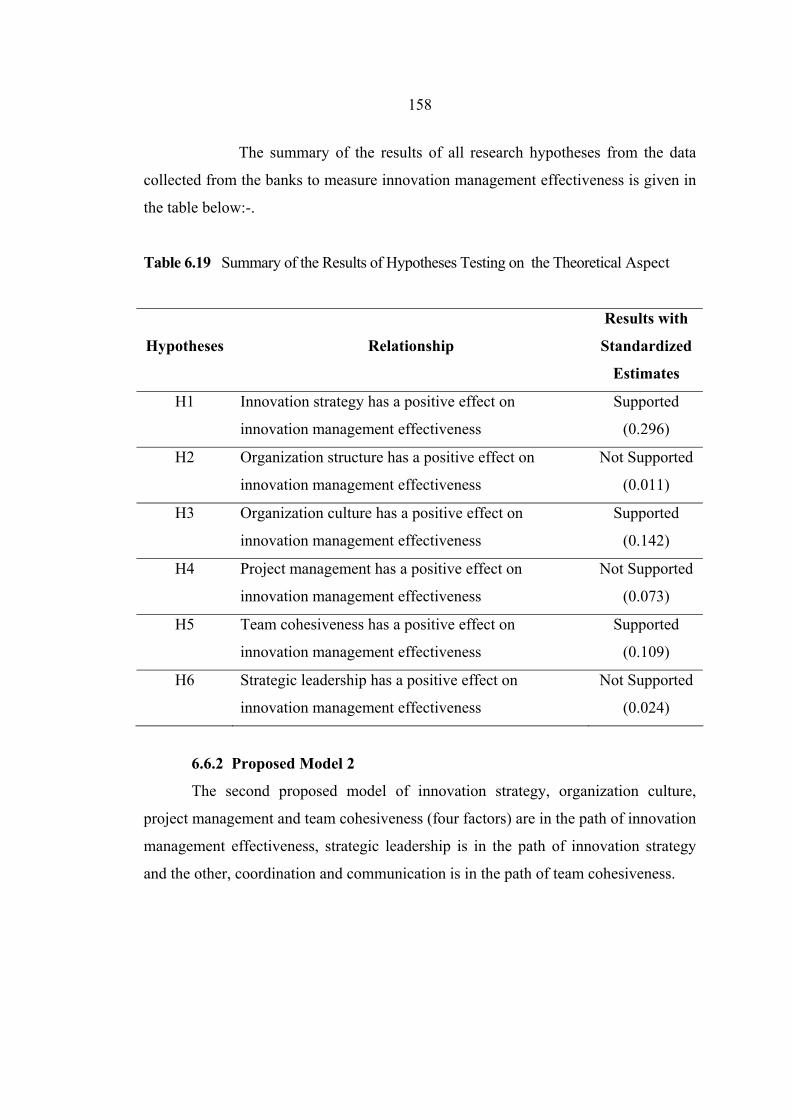
158
The summary of the results of all research hypotheses from the data
collected from the banks to measure innovation management effectiveness is given in
the table below:-.
Table 6.19 Summary of the Results of Hypotheses Testing on the Theoretical Aspect
Hypotheses Relationship
Results with
Standardized
Estimates
H1 Innovation strategy has a positive effect on
innovation management effectiveness
Supported
(0.296)
H2 Organization structure has a positive effect on
innovation management effectiveness
Not Supported
(0.011)
H3 Organization culture has a positive effect on
innovation management effectiveness
Supported
(0.142)
H4 Project management has a positive effect on
innovation management effectiveness
Not Supported
(0.073)
H5 Team cohesiveness has a positive effect on
innovation management effectiveness
Supported
(0.109)
H6 Strategic leadership has a positive effect on
innovation management effectiveness
Not Supported
(0.024)
6.6.2 Proposed Model 2
The second proposed model of innovation strategy, organization culture,
project management and team cohesiveness (four factors) are in the path of innovation
management effectiveness, strategic leadership is in the path of innovation strategy
and the other, coordination and communication is in the path of team cohesiveness.
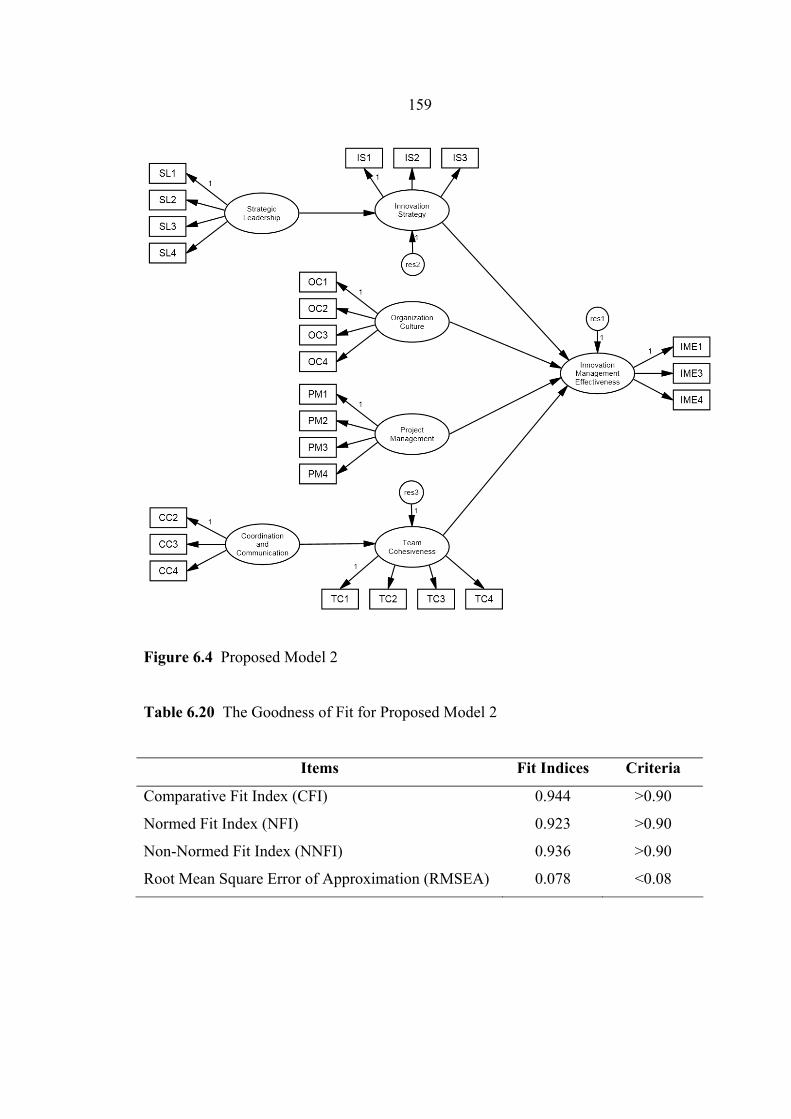
159
Figure 6.4 Proposed Model 2
Table 6.20 The Goodness of Fit for Proposed Model 2
Items Fit Indices Criteria
Comparative Fit Index (CFI)
Normed Fit Index (NFI)
Non-Normed Fit Index (NNFI)
Root Mean Square Error of Approximation (RMSEA)
0.944
0.923
0.936
0.078
>0.90
>0.90
>0.90
<0.08
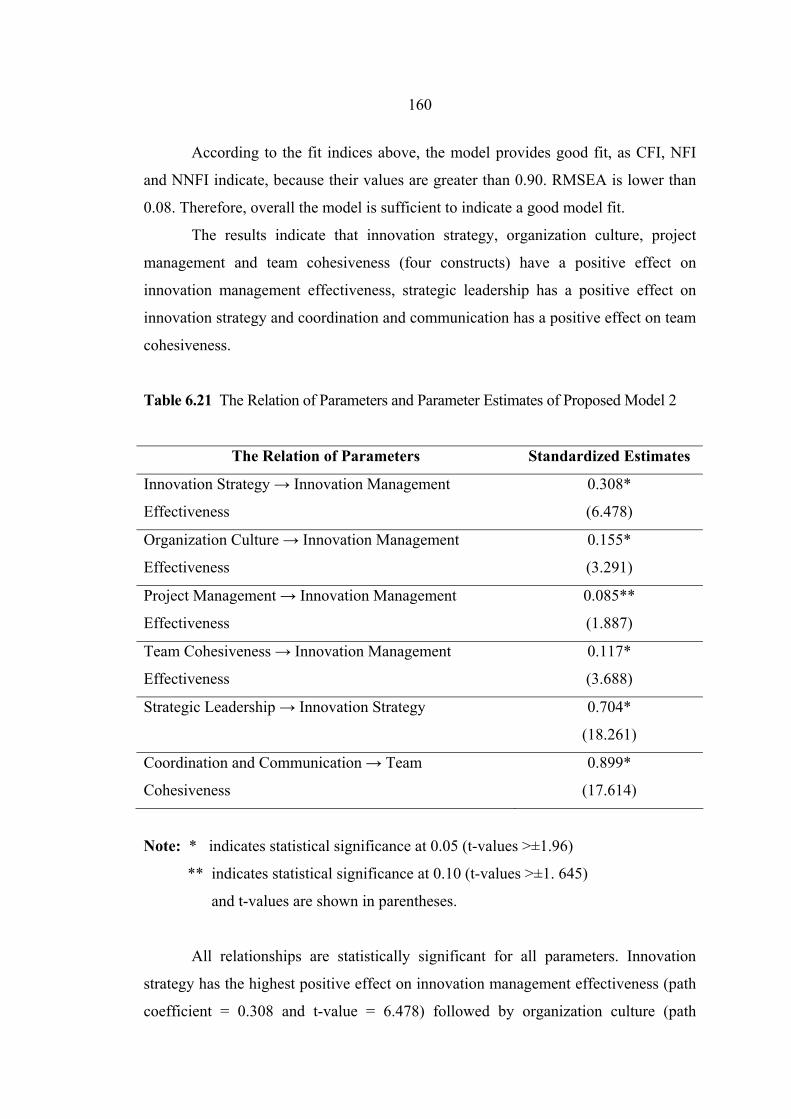
160
According to the fit indices above, the model provides good fit, as CFI, NFI
and NNFI indicate, because their values are greater than 0.90. RMSEA is lower than
0.08. Therefore, overall the model is sufficient to indicate a good model fit.
The results indicate that innovation strategy, organization culture, project
management and team cohesiveness (four constructs) have a positive effect on
innovation management effectiveness, strategic leadership has a positive effect on
innovation strategy and coordination and communication has a positive effect on team
cohesiveness.
Table 6.21 The Relation of Parameters and Parameter Estimates of Proposed Model 2
The Relation of Parameters Standardized Estimates
Innovation Strategy → Innovation Management
Effectiveness
0.308*
(6.478)
Organization Culture → Innovation Management
Effectiveness
0.155*
(3.291)
Project Management → Innovation Management
Effectiveness
0.085**
(1.887)
Team Cohesiveness → Innovation Management
Effectiveness
0.117*
(3.688)
Strategic Leadership → Innovation Strategy 0.704*
(18.261)
Coordination and Communication → Team
Cohesiveness
0.899*
(17.614)
Note: * indicates statistical significance at 0.05 (t-values >±1.96)
** indicates statistical significance at 0.10 (t-values >±1. 645)
and t-values are shown in parentheses.
All relationships are statistically significant for all parameters. Innovation
strategy has the highest positive effect on innovation management effectiveness (path
coefficient = 0.308 and t-value = 6.478) followed by organization culture (path
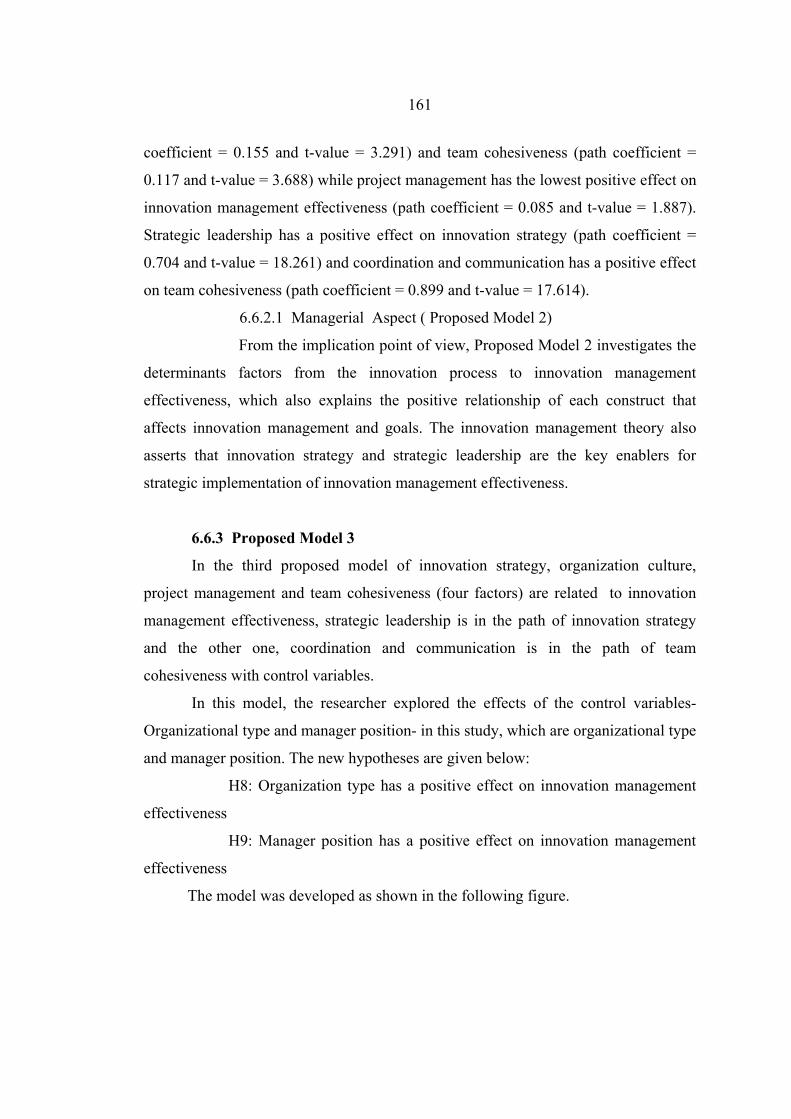
161
coefficient = 0.155 and t-value = 3.291) and team cohesiveness (path coefficient =
0.117 and t-value = 3.688) while project management has the lowest positive effect on
innovation management effectiveness (path coefficient = 0.085 and t-value = 1.887).
Strategic leadership has a positive effect on innovation strategy (path coefficient =
0.704 and t-value = 18.261) and coordination and communication has a positive effect
on team cohesiveness (path coefficient = 0.899 and t-value = 17.614).
6.6.2.1 Managerial Aspect ( Proposed Model 2)
From the implication point of view, Proposed Model 2 investigates the
determinants factors from the innovation process to innovation management
effectiveness, which also explains the positive relationship of each construct that
affects innovation management and goals. The innovation management theory also
asserts that innovation strategy and strategic leadership are the key enablers for
strategic implementation of innovation management effectiveness.
6.6.3 Proposed Model 3
In the third proposed model of innovation strategy, organization culture,
project management and team cohesiveness (four factors) are related to innovation
management effectiveness, strategic leadership is in the path of innovation strategy
and the other one, coordination and communication is in the path of team
cohesiveness with control variables.
In this model, the researcher explored the effects of the control variables-
Organizational type and manager position- in this study, which are organizational type
and manager position. The new hypotheses are given below:
H8: Organization type has a positive effect on innovation management
effectiveness
H9: Manager position has a positive effect on innovation management
effectiveness
The model was developed as shown in the following figure.
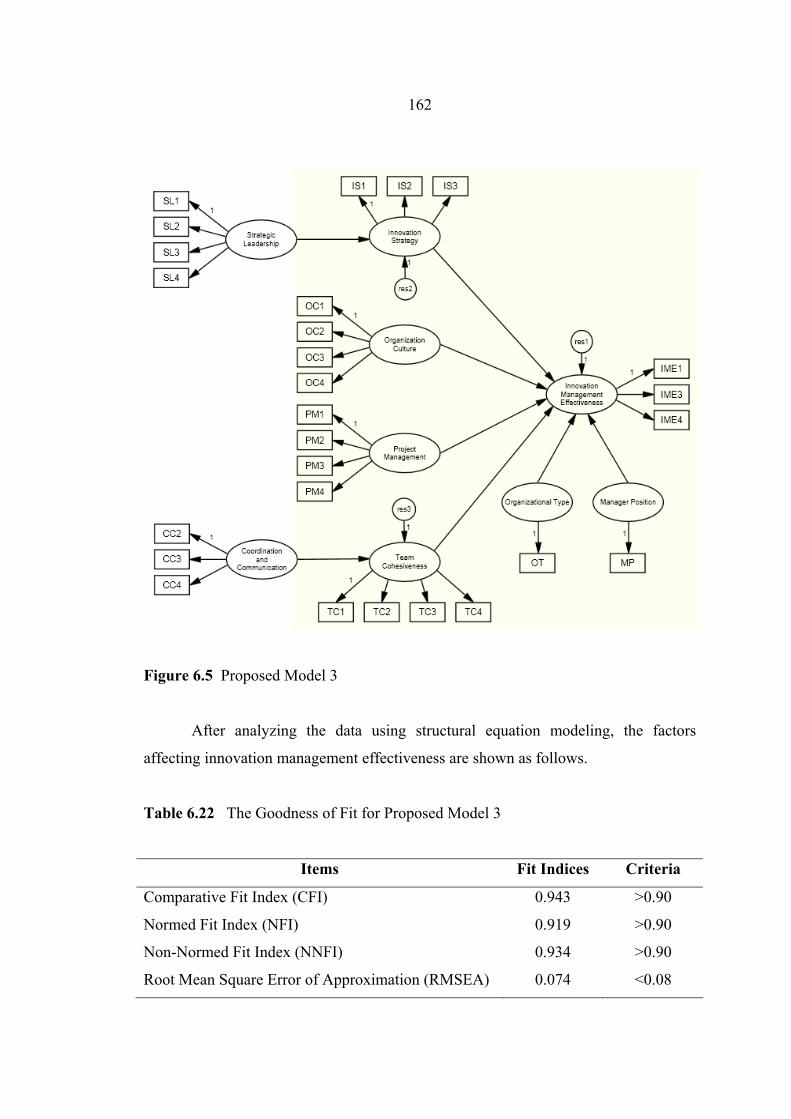
162
Figure 6.5 Proposed Model 3
After analyzing the data using structural equation modeling, the factors
affecting innovation management effectiveness are shown as follows.
Table 6.22 The Goodness of Fit for Proposed Model 3
Items Fit Indices Criteria
Comparative Fit Index (CFI)
Normed Fit Index (NFI)
Non-Normed Fit Index (NNFI)
Root Mean Square Error of Approximation (RMSEA)
0.943
0.919
0.934
0.074
>0.90
>0.90
>0.90
<0.08
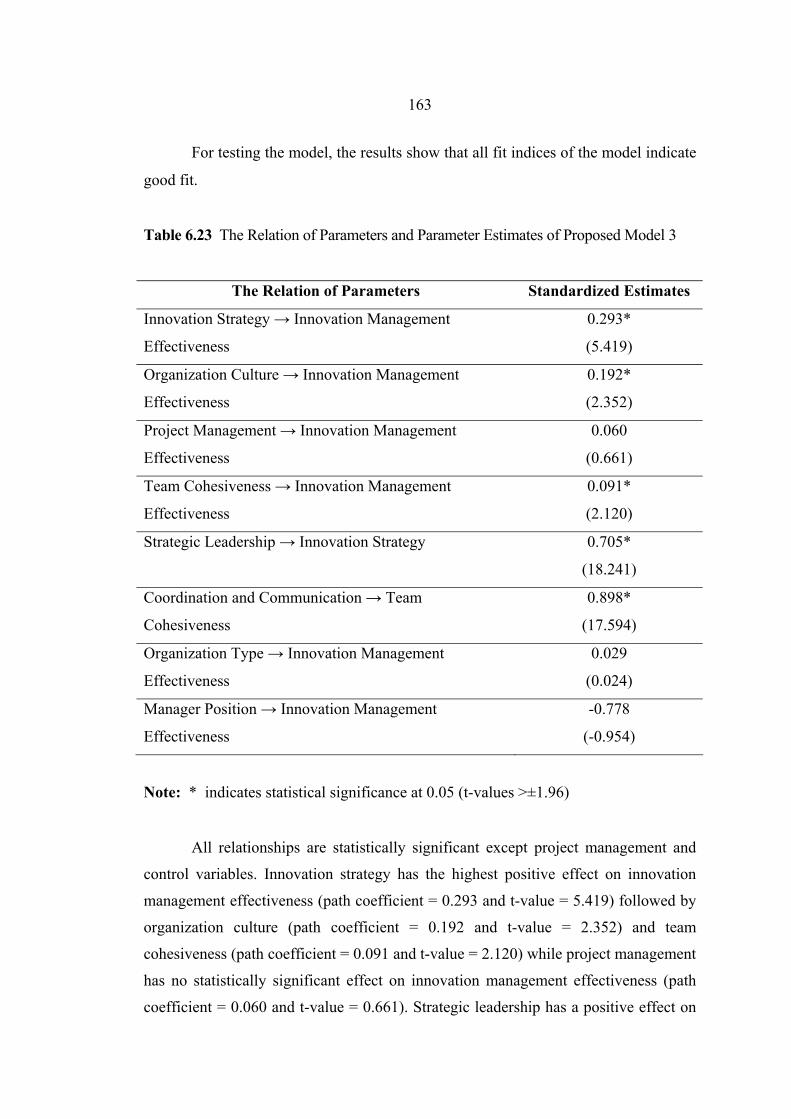
163
For testing the model, the results show that all fit indices of the model indicate
good fit.
Table 6.23 The Relation of Parameters and Parameter Estimates of Proposed Model 3
The Relation of Parameters Standardized Estimates
Innovation Strategy → Innovation Management
Effectiveness
0.293*
(5.419)
Organization Culture → Innovation Management
Effectiveness
0.192*
(2.352)
Project Management → Innovation Management
Effectiveness
0.060
(0.661)
Team Cohesiveness → Innovation Management
Effectiveness
0.091*
(2.120)
Strategic Leadership → Innovation Strategy 0.705*
(18.241)
Coordination and Communication → Team
Cohesiveness
0.898*
(17.594)
Organization Type → Innovation Management
Effectiveness
0.029
(0.024)
Manager Position → Innovation Management
Effectiveness
-0.778
(-0.954)
Note: * indicates statistical significance at 0.05 (t-values >±1.96)
All relationships are statistically significant except project management and
control variables. Innovation strategy has the highest positive effect on innovation
management effectiveness (path coefficient = 0.293 and t-value = 5.419) followed by
organization culture (path coefficient = 0.192 and t-value = 2.352) and team
cohesiveness (path coefficient = 0.091 and t-value = 2.120) while project management
has no statistically significant effect on innovation management effectiveness (path
coefficient = 0.060 and t-value = 0.661). Strategic leadership has a positive effect on
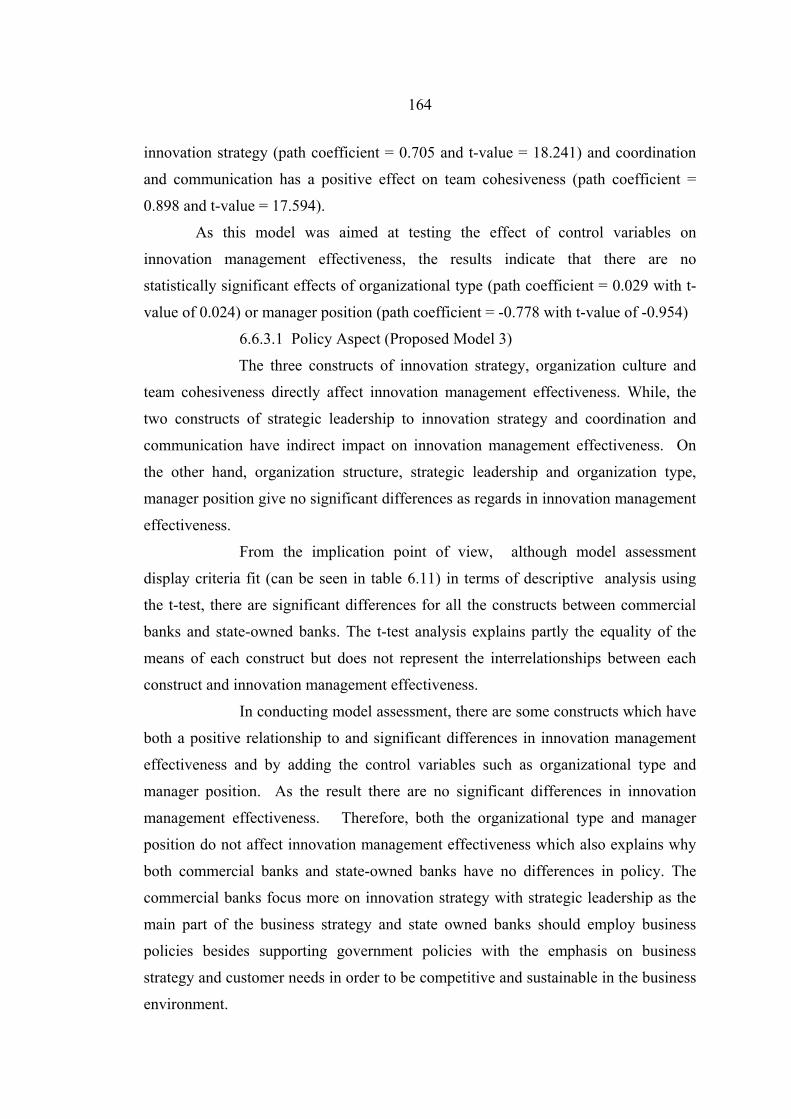
164
innovation strategy (path coefficient = 0.705 and t-value = 18.241) and coordination
and communication has a positive effect on team cohesiveness (path coefficient =
0.898 and t-value = 17.594).
As this model was aimed at testing the effect of control variables on
innovation management effectiveness, the results indicate that there are no
statistically significant effects of organizational type (path coefficient = 0.029 with t-
value of 0.024) or manager position (path coefficient = -0.778 with t-value of -0.954)
6.6.3.1 Policy Aspect (Proposed Model 3)
The three constructs of innovation strategy, organization culture and
team cohesiveness directly affect innovation management effectiveness. While, the
two constructs of strategic leadership to innovation strategy and coordination and
communication have indirect impact on innovation management effectiveness. On
the other hand, organization structure, strategic leadership and organization type,
manager position give no significant differences as regards in innovation management
effectiveness.
From the implication point of view, although model assessment
display criteria fit (can be seen in table 6.11) in terms of descriptive analysis using
the t-test, there are significant differences for all the constructs between commercial
banks and state-owned banks. The t-test analysis explains partly the equality of the
means of each construct but does not represent the interrelationships between each
construct and innovation management effectiveness.
In conducting model assessment, there are some constructs which have
both a positive relationship to and significant differences in innovation management
effectiveness and by adding the control variables such as organizational type and
manager position. As the result there are no significant differences in innovation
management effectiveness. Therefore, both the organizational type and manager
position do not affect innovation management effectiveness which also explains why
both commercial banks and state-owned banks have no differences in policy. The
commercial banks focus more on innovation strategy with strategic leadership as the
main part of the business strategy and state owned banks should employ business
policies besides supporting government policies with the emphasis on business
strategy and customer needs in order to be competitive and sustainable in the business
environment.
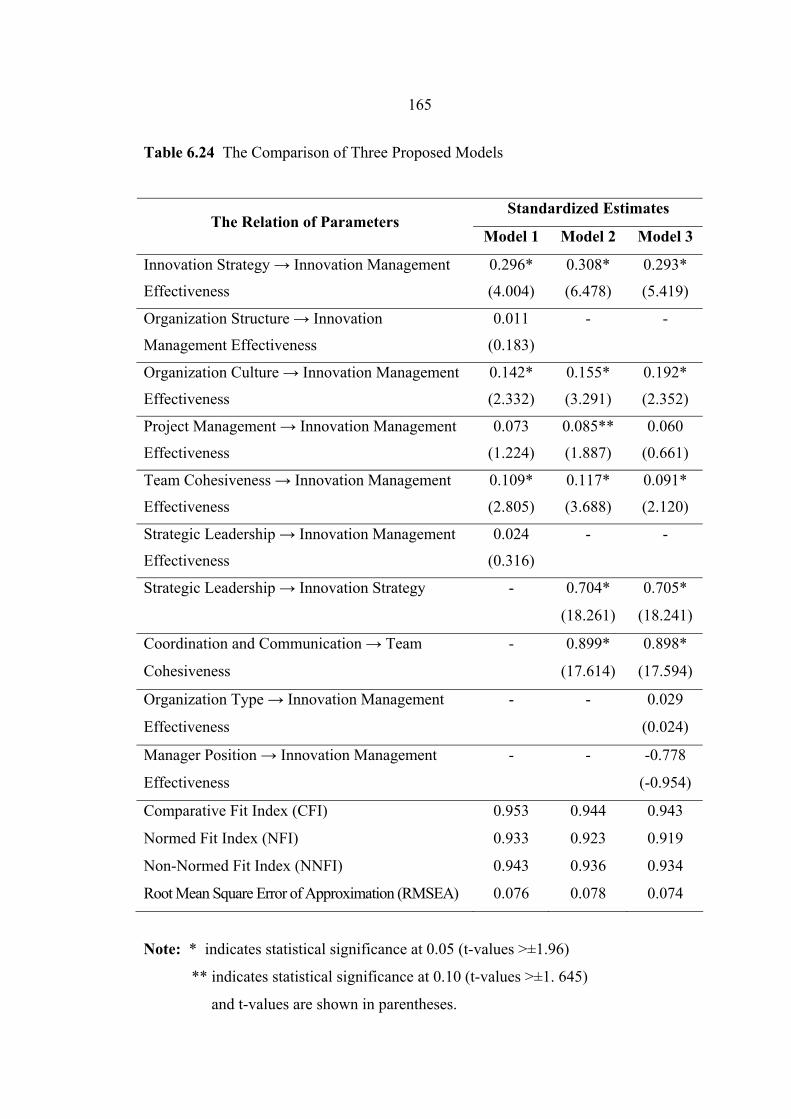
165
Table 6.24 The Comparison of Three Proposed Models
Standardized Estimates The Relation of Parameters
Model 1 Model 2 Model 3
Innovation Strategy → Innovation Management
Effectiveness
0.296*
(4.004)
0.308*
(6.478)
0.293*
(5.419)
Organization Structure → Innovation
Management Effectiveness
0.011
(0.183)
- -
Organization Culture → Innovation Management
Effectiveness
0.142*
(2.332)
0.155*
(3.291)
0.192*
(2.352)
Project Management → Innovation Management
Effectiveness
0.073
(1.224)
0.085**
(1.887)
0.060
(0.661)
Team Cohesiveness → Innovation Management
Effectiveness
0.109*
(2.805)
0.117*
(3.688)
0.091*
(2.120)
Strategic Leadership → Innovation Management
Effectiveness
0.024
(0.316)
- -
Strategic Leadership → Innovation Strategy - 0.704*
(18.261)
0.705*
(18.241)
Coordination and Communication → Team
Cohesiveness
- 0.899*
(17.614)
0.898*
(17.594)
Organization Type → Innovation Management
Effectiveness
- - 0.029
(0.024)
Manager Position → Innovation Management
Effectiveness
- - -0.778
(-0.954)
Comparative Fit Index (CFI)
Normed Fit Index (NFI)
Non-Normed Fit Index (NNFI)
Root Mean Square Error of Approximation (RMSEA)
0.953
0.933
0.943
0.076
0.944
0.923
0.936
0.078
0.943
0.919
0.934
0.074
Note: * indicates statistical significance at 0.05 (t-values >±1.96)
** indicates statistical significance at 0.10 (t-values >±1. 645)
and t-values are shown in parentheses.
166
From the three models discussed above, there are only three constructs
in Proposed Model 1 in theoretical aspect, which are innovation strategy, organization
culture and team cohesiveness, that directly affect innovation management
effectiveness. As for the managerial aspect, the chosen model used to test the research
hypotheses is Proposed Model 2. However, Proposed Model 3 with the control
variables of organization type (commercial banks and state-owned banks) and
manager position (manager and non- manager) have no statistically significant effect
on innovation management effectiveness. Therefore, from the statistical standpoint,
the researcher will attempt to compare the best fits of Proposed Model 1,2,3 as the
comparison models in order to test the research hypotheses.
In conclusion, this chapter described the data characteristics and
characteristics of the respondents. A reliability analysis of the constructs in the study
and Cronbach’s alpha were provided to confirm the reliability of each construct. In
addition, the researcher tested convergent and discriminant validity before conducting
model assessment in order to prove that the constructs met the criteria for both
validities. Furthermore, the researcher conducted structural equation modeling for the
three Proposed Models. All models satisfactorily only met the criteria of fit indices,
including CFI, NFI, NNFI, and RMSEA. However, there were variation in the
significant differences in all three models, Finally, the results from the theoretical
model testing were used to respond to the research hypotheses which were clearly
supported by the findings of this empirical study while Proposed Model 2- the
Managerial model- explained innovation management theory which perceives both
innovation strategy innovation process and strategic leadership as affecting innovation
management effectiveness.
CHAPTER 7
DISCUSSION, CONCLUSIONS AND IMPLICATIONS
7.1 Discussion
In this chapter, the researcher will discuss all of, the important aspects covered
by the study, its objectives, conclusions as well as its contribution and policy
implications. The researcher also proposes recommendations together with the
limitations of the study and suggestions for further studies in the future.
As the result of the study, innovation management theory is used to explain
the conceptual framework and hypotheses model. It mainly emphasizes innovation
strategy, process, strategic leadership, coordination and communication and project
management. The main aim is to generate the value creation both innovation approach
and process management as well as support operation management efficiency.
As a result of the study, there are three types of conclusion to be drawn-
theoretical, managerial and policy conclusions. The conceptual theory on innovation
management theory mainly explains the constructs that affect innovation management
effectiveness while the resource-based view can partly explain the organization
culture based on cultural norms and empowerment. During the study, many
constructs were introduced to measure their reliability and validity regarding
innovation management effectiveness. The hypotheses are tested with empirical data
in order to understand how the data fit with the conceptual framework. It is also
important that the researcher decides to introduce additional theories of innovation
management theory in order to have both theoretical and managerial explanations of
innovation management effectiveness.
168
7.2 Conclusions of the Study
7.2.1 Theoretical Conclusions
7.2.1.1 The Theoretical Model
The theoretical model was selected to develop and to support the
conceptual framework for investigating the determinants of organizational innovation
management effectiveness with the main objective to describe the determinants of six
prediction factors of innovation strategy, organization structure, organization culture,
project management, team cohesiveness and strategic leadership. However, the
results of the study show that there are only three constructs which have positive
influences on innovation management effectiveness. Through the literature review
also describes the significant of each contingency factor that has positive influence to
the innovation management effectiveness.
First, innovation strategy with a path coefficient of 0.296 is defined as a
timed sequence of internally consistent and conditional resource allocation decisions
that are designed to fulfill an organization’s objectives in terms of innovation goals,
innovation resource allocation, innovation risk (overall philosophy), timing (first to
market or happy to wait) and a long term perspective (Ramanujam and Mensch,
1985). Innovation strategy is related to organizational factors that promote innovation
management effectiveness (Mphahlele, 2006; Martins and Terblanche, 2003; Vlok,
2005; Dewar and Dutton, 1986). Then, organization structure represents the development
of human resources in different parts of the organization for doing specific work
(Mphahlele, 2006).
Third, organization culture with a path coefficient of 0.142 partly
explains how to give employees incentives through reward and recognition (Nystrom
(1990) and O’Reilly (1989) as part of the innovation process Organization culture
influences innovation management effectiveness (Martins and Martins, 2002; Martins,
2000; Adams, Bessant and Phelps, 2006).
Forth, team cohesiveness with a path coefficient of 0.109 is determined
by the individuals within the team having the desire to remain a part of that team
because their individual needs are being met (Turner et al., 1984.). It is still believed
that the closeness brought about through cohesiveness can facilitate the members of a
169
team working together more freely with more communication to develop more
innovative ideas. Team cohesiveness has influenced on innovation management
effectiveness (Mullen and Cooper, 1994; Langfred, 1998; Guzzo and Dickson, 1996).
Lastly, strategic leadership is creating and leading the innovation process, developing
and coaching the innovators and promote the innovation (Deschamps, 2005).
However, there remained three constructs- organization structure with a
path coefficient of 0.011, project management with a path coefficient of 0.073 and
strategic leadership with a path of coefficient of 0.024- that have no significant affect
innovation management effectiveness.
From the theoretical point of view, the contingency factors can be
explained by innovation management theory (Criag, 1995; Dougherty and Hardy,
1996; Hatch and Mowery, 1988 ) which also addresses the relationships among the
three prediction factors that positively affect the innovation management effectiveness.
Through the previous literature review, only the resource-based view can
partly explain the relationship of firm characteristics to organization culture (Martins,
2002) while the innovation management theory will mainly support the evidence of
the study on innovation strategy (Ramanujam and Mensh, 1985), and strategic
leadership (Deschamps, 2005) and how innovation process is integrated in all the
constructs that affect innovation management effectiveness.
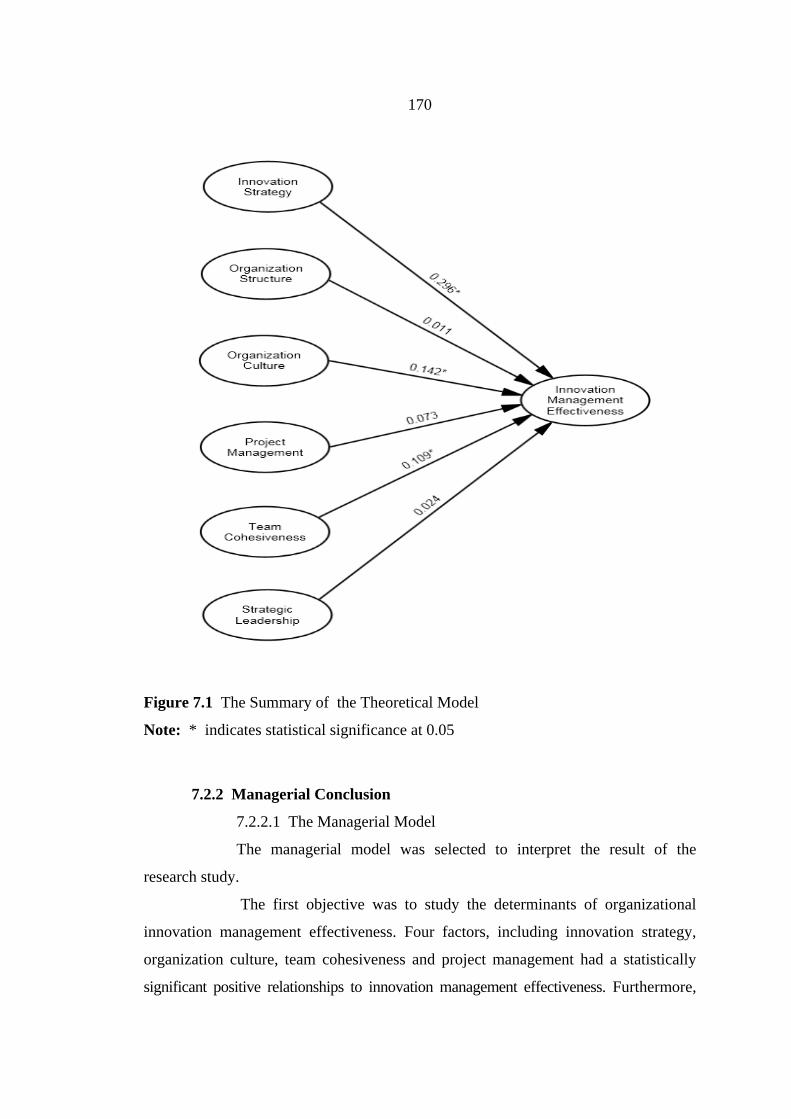
170
Figure 7.1 The Summary of the Theoretical Model
Note: * indicates statistical significance at 0.05
7.2.2 Managerial Conclusion
7.2.2.1 The Managerial Model
The managerial model was selected to interpret the result of the
research study.
The first objective was to study the determinants of organizational
innovation management effectiveness. Four factors, including innovation strategy,
organization culture, team cohesiveness and project management had a statistically
significant positive relationships to innovation management effectiveness. Furthermore,
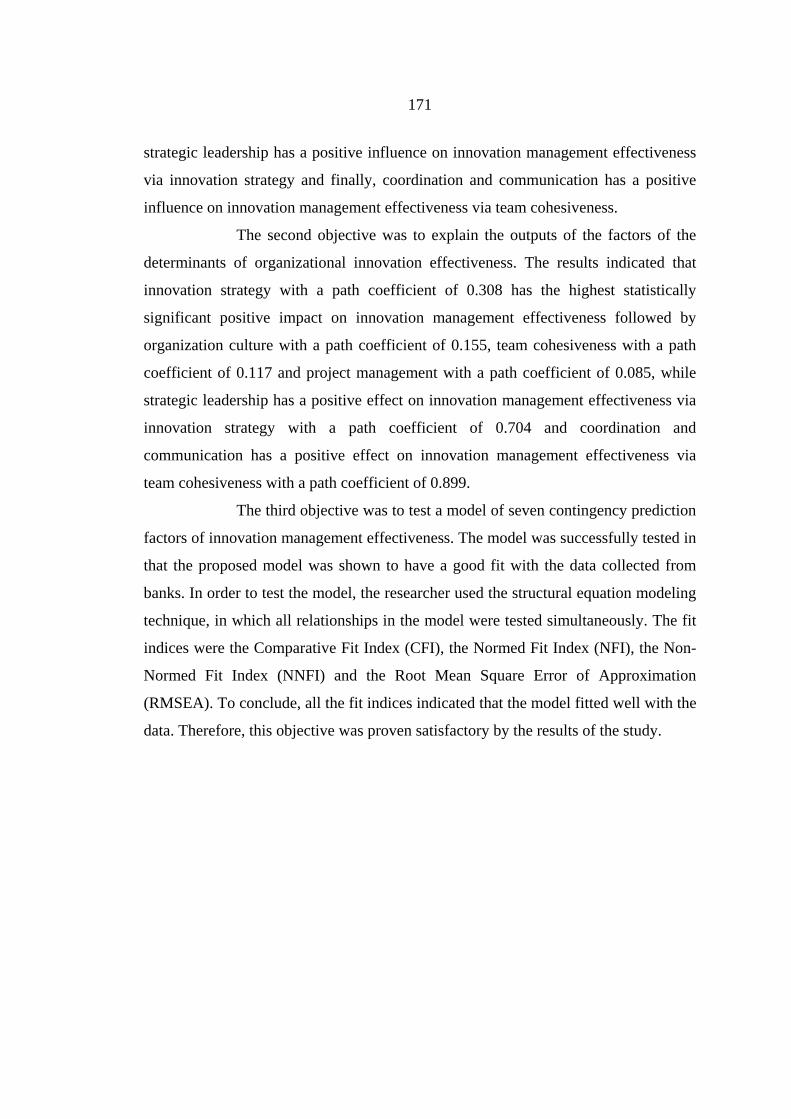
171
strategic leadership has a positive influence on innovation management effectiveness
via innovation strategy and finally, coordination and communication has a positive
influence on innovation management effectiveness via team cohesiveness.
The second objective was to explain the outputs of the factors of the
determinants of organizational innovation effectiveness. The results indicated that
innovation strategy with a path coefficient of 0.308 has the highest statistically
significant positive impact on innovation management effectiveness followed by
organization culture with a path coefficient of 0.155, team cohesiveness with a path
coefficient of 0.117 and project management with a path coefficient of 0.085, while
strategic leadership has a positive effect on innovation management effectiveness via
innovation strategy with a path coefficient of 0.704 and coordination and
communication has a positive effect on innovation management effectiveness via
team cohesiveness with a path coefficient of 0.899.
The third objective was to test a model of seven contingency prediction
factors of innovation management effectiveness. The model was successfully tested in
that the proposed model was shown to have a good fit with the data collected from
banks. In order to test the model, the researcher used the structural equation modeling
technique, in which all relationships in the model were tested simultaneously. The fit
indices were the Comparative Fit Index (CFI), the Normed Fit Index (NFI), the Non-
Normed Fit Index (NNFI) and the Root Mean Square Error of Approximation
(RMSEA). To conclude, all the fit indices indicated that the model fitted well with the
data. Therefore, this objective was proven satisfactory by the results of the study.
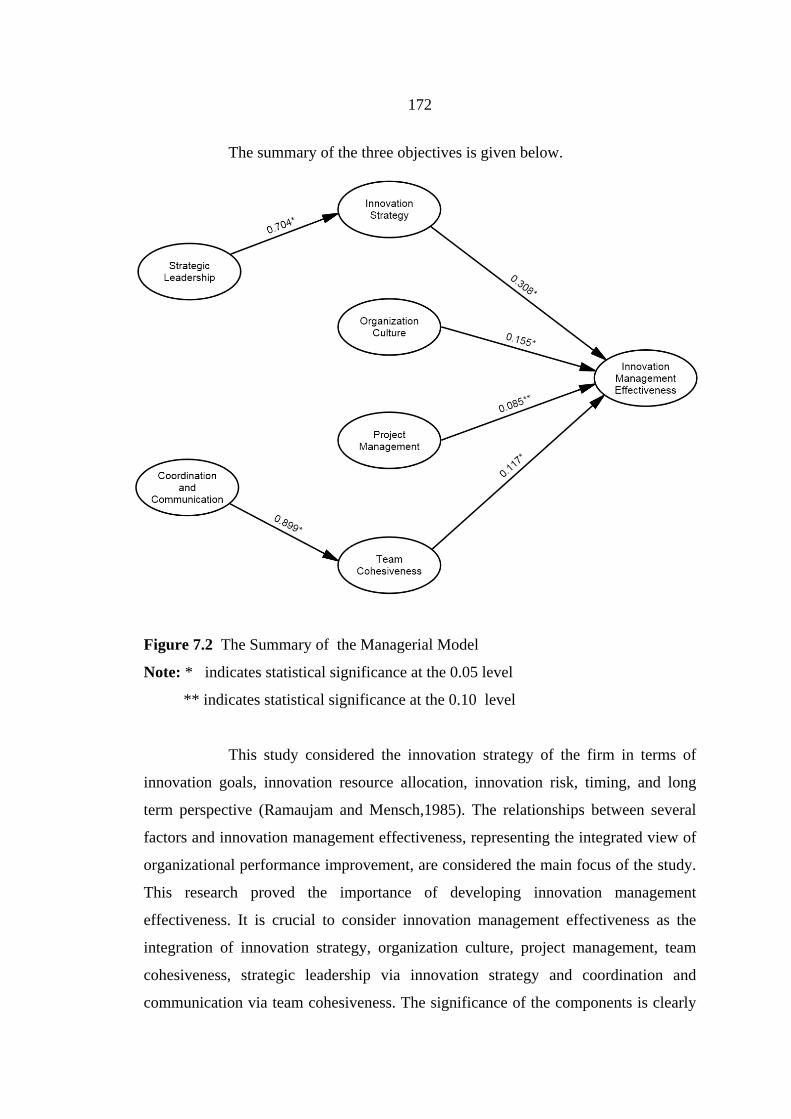
172
The summary of the three objectives is given below.
Figure 7.2 The Summary of the Managerial Model
Note: * indicates statistical significance at the 0.05 level
** indicates statistical significance at the 0.10 level
This study considered the innovation strategy of the firm in terms of
innovation goals, innovation resource allocation, innovation risk, timing, and long
term perspective (Ramaujam and Mensch,1985). The relationships between several
factors and innovation management effectiveness, representing the integrated view of
organizational performance improvement, are considered the main focus of the study.
This research proved the importance of developing innovation management
effectiveness. It is crucial to consider innovation management effectiveness as the
integration of innovation strategy, organization culture, project management, team
cohesiveness, strategic leadership via innovation strategy and coordination and
communication via team cohesiveness. The significance of the components is clearly
173
identified in that an organization can achieve higher innovation management
effectiveness in many aspects, such as through the development of innovation strategy
and strategic leadership, improved coordination and communication, the overall
organizational culture and performance and by building employee morale,
competency and team cohesiveness as shown in this study.
7.2.3.1 The Policy Model
The policy model was selected to test the significant differences between
organizational type (commercial banks and state-owned banks) and manager
position(manager and non-manager) using dummy variables by running on AMOS
program. There are no significant differences on innovation management effectiveness by
organizational type with a path coefficient of 0.029 and manager position with path
coefficient of -0.778 respectively.
The result also shows that innovation strategy with a path coefficient of
0.293 has the highest positive influence on the innovation management effectiveness,
while second is organization culture with a path coefficient of 0.192 followed by
team cohesiveness with path coefficient of 0.091. The strategic leadership with a
path coefficient of 0.705 has a positive effect to innovation management effectiveness
via innovation strategy , while second is coordination and communication with a path
coefficient of 0.898 has a positive impact on innovation management via team
cohesiveness. However, project management with a path coefficient of 0.060 has no
significant differences as the result of statistically adding control variables.
From the policy view point, commercial banks and state-owned banks
has no significant impact to innovation management effectiveness in term of
organization type and manager position which also implies that state-owned banks
should adopt business policies in order to stay competitive with commercial banks. In
addition, with the different goals between state-owned enterprises and private firms,
business policy plays important roles in terms of decision making in organizations in
order to be more competitive as a firm. Although state owned enterprises are expected
to cooperate with the government to achieve certain political roles including adopting
government policies and adapting to the market environment at the same time they
actually serve many shareholders and pursue multiple goals.
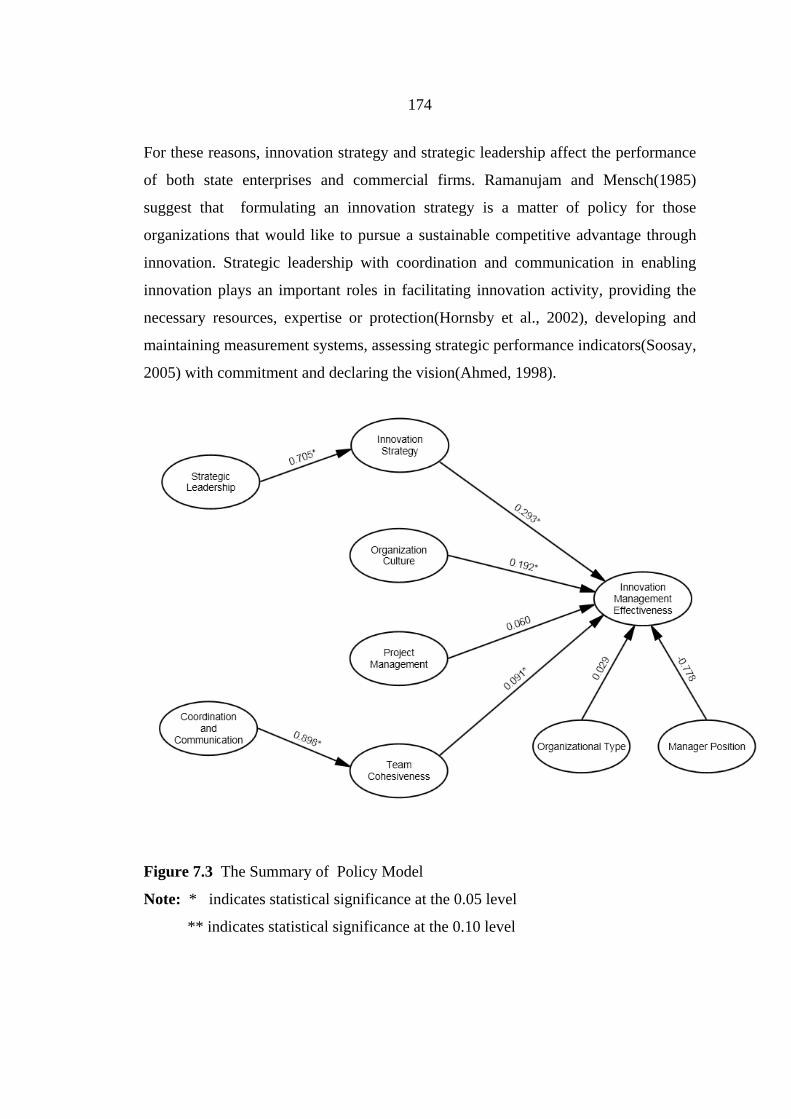
174
For these reasons, innovation strategy and strategic leadership affect the performance
of both state enterprises and commercial firms. Ramanujam and Mensch(1985)
suggest that formulating an innovation strategy is a matter of policy for those
organizations that would like to pursue a sustainable competitive advantage through
innovation. Strategic leadership with coordination and communication in enabling
innovation plays an important roles in facilitating innovation activity, providing the
necessary resources, expertise or protection(Hornsby et al., 2002), developing and
maintaining measurement systems, assessing strategic performance indicators(Soosay,
2005) with commitment and declaring the vision(Ahmed, 1998).
Figure 7.3 The Summary of Policy Model
Note: * indicates statistical significance at the 0.05 level
** indicates statistical significance at the 0.10 level
175
7.3 Contributions of the Study
As the results of the study show that the theoretical contributions of this work
were greatly significant in developing the study in the areas of innovation
management theory though merely supportive of the resource-based view and
organizational contingency theory to some extent. However, one of the most
important aspects of the research is to contribution to the theory and the field of study.
In terms of theoretical contribution, this study has made the following a fundamental
strong contribution.
7.3.1 Theoretical Contribution
This study has expanded the determinants of organizational innovation
management effectiveness and provided more understanding about innovation in the
Thai banking industry. This research has supported the determinants of innovation
management effectiveness to better clarify and understand innovation. It has achieved
the following:
1) Provided empirical data regarding the measurement of innovation
management effectiveness in the social science aspect.
2) Document innovation management effectiveness within the context
of Thai culture; and limited the variables suitable for the characteristics of bank that
can define the variables affecting innovation management effectiveness.
3) Detailed the phenomenon of innovation management effectiveness in
the Thai banking industry, specifically in the areas of the determinants of organizational
innovation management effectiveness. The study has also contributed to the body of
research based on empirical innovation in organizations or banks by attempting to
identify the critical factors affecting innovation management effectiveness.
4) Provided a model of innovation management effectiveness implementation
that treats the phenomena as if they were simply dependent variables with all
constructs relatively interconnected in social science. This is important for enabling
the development of more appropriate systems for selecting and developing innovation
management effectiveness.
176
7.3.2 Theoretical Contribution on Innovation Management Theory
Within this line of reasoning, the study provides evidence that further explains
innovation management theory’s contribution to innovation management effectiveness
mainly in the area of improving organizations’ capacity to innovate. Tim Craig (1995)
provides innovation management theory by using bureaucratic method to foster
innovation, requiring a flexible process in order to free creativity and having the
discipline in transforming ideas into a market product which may be more important
than just a novelty. Nile W.Hatch and David C.Mowery(1998) offered the innovation
theory of the relationship between process innovation and learning by doing which
are two main factors affecting superior performance in the introduction of new
process and factors that influence the rate of improvement. Willaim Q. Judge, Gerald
E. Fryxell and Robert S. Dooley (1997) investigated what kind of workplace culture is
conducive to creativity and how managers can create and maintain an innovative
culture. Charlan Jeanne Nemeth(1997) also pointed out that managing innovation is to
encourage innovation and the creative process. Although firms tend to promote strong
cohesion, in terms of the theoretical approach firms attempt to overcome some of the
inhibitions that make employees reluctant to engage in creative dissent and research
shows the formidable pressure employees of the firm face toward conformity.
The theory also confirms the positive relationship between innovation strategy
and innovation management effectiveness. For example, Ramanujam and Mensch
(1985) defined innovation as a timed sequence of internally consistent and conditional
resource allocation decisions designed to fulfill the objectives of organizational
innovation and stated that innovation strategy has a positive effect on innovation
management effectiveness. Mphahlele (2006) found that innovation strategy was
related to organizational factors that promoted innovation. Mintzberg (1978)
confirmed that the strategic posture enhances bank innovativeness by entrepreneurial
assessment. Furthermore, there is an interrelationship between strategic leadership
and innovation strategy. The provision of leadership makes innovation happen via a
strong vision (Pinto and Prescott, 1988) for innovation, a long-term commitment to
innovation and a clear allocation of resources (Cooper et al., 2004). Dougherty and
Cohen (1995) found the behavior of senior managers to be influential in making
innovation happen with a clear vision of the future operation and direction of
organizational change and creativity (Shin and McClomb, 1998).
177
7.4 Managerial Contribution and Implications
7.4.1 Managerial Contribution
The results of study reveal that there are various factors that have statistical
significance in affecting innovation management effectiveness. The following is the
summary of the contributions:-
1) Practitioners of organizational innovation can utilize the research
results to refine their own contribution to the organization. Some of the ways they can
contribute is through the consideration of the innovation management effectiveness
building. This is important both to research and the information surrounding competitive
advantage.
2) The results of the study provided information to directors and
managers in the banking industry regarding decision making on the establishment of
innovation management effectiveness within the Thai banking industry.
3) Team leaders of the banking industry and human resources and
organizational development specialists who support bank structures benefit from the
information on how to facilitate innovation management effectiveness and provide the
best support innovation management efforts.
4) Banks should also aim at formulating innovation strategy, creating
organization culture norms and supporting continuous learning and empowerment,
building up team work cohesiveness and strengthening longevity while managing
the structure of the organization with rules, procedures and hierarchy of authority. At
the same time to ensure innovation management effectiveness, they need to manage
the link between innovation project and project management with enhanced
coordination and communication quality.
7.4.2 Implications
Internal Bank Policy
The Differences in Bank Policy between Commercial Banks and State
Owned Banks in innovation management effectiveness
The commercial banks(SCB and KBank) have placed emphasis on the
commercial financial services in every segments from the multi-corporate business,
178
retail business to medium and small business with policies aimed at achieving their
own visions, goals and objectives towards the shareholders and customers, providing
the best possible solutions and most comprehensive and diversified products and
services. From the result of the study on descriptive statistics, the determinants of the
contingency factors reveals that KBank has the highest score in every construct,
particularly innovation strategy and strategic leadership while SCB is ranked second.
The managerial model also reveals that the model fit and significance difference of
the innovation strategy, strategic leadership, organization culture, team cohesiveness,
communication and coordination to innovation management effectiveness. Therefore,
the commercial banks (SCB and KBank) will continue to formulate the business
policy and employ innovation strategy with strategic leadership and aim at increasing
profit through innovation projects and improving their competitive advantages in the
market environment.
While the state-owned banks (KTB and GHB) have the policies to
fulfill their own operation objectives and steer the economy as directed by the
government and continue to provide financial services to the commercial, low end
housing, government and state enterprise sectors. The research also found that state-
owned banks have also a policies to embrace their vision of being stable financial
institutions for saving and national economic and social development, especially as
regards the grassroots economy However, KTB is the state-owned bank with one of
the largest commercial customer bases in Thailand, that not only supports government
policy but also mainly does business in the commercial sector. While GHB has policy
mainly on government projects, it also supports low and middle class families who
would like to have low cost budget housing. Because the results of the study show no
significance in between organization types -commercial banks and state-owned
banks- they should therefore put emphasis on business policy and formulate business
strategy by implementing innovation strategy at the core of contributing more in
diversified innovative products and services and being competitive.
7.5 Recommendations
Overall, the main recommendation of the research in innovation strategy is to
put additional efforts based on the right understanding of customer needs in each
179
segment via the stage-gate process of new product development. In identifying
customer needs is a key to unleashing customer innovation (Seybold, 2006) are to:
1) Find lead users who are already closing the gap between how they
do things today and what they’d ideally like to be able to do and commercialize their
innovation.
2) Empower your lead customers with co-design tools and innovation
toolkits so they can design their own solutions, innovating as they goKaplan and
Norton( 2004) introduced a formal stage-gate process that specifically identifies a
series of development stages through which a new product must pass as it moves from
an initial concept to a fully defined product ready for release to large-scale production.
The critical importance of strategic leadership and high levels of employee
engagement, as posited by Kotter(1996), leads change with the eight stage process
establishing a sense of urgency, creating the guiding coalition, developing in vision
and strategy, communicating the change vision, empowering employees for broad-
based action, generating short-term wins, consolidating gains and producing more
change with anchoring new approaches in the culture. Those two priorities drive the
bank’s human sigma and culminate in managing innovation effectiveness as a result
of sustainable growth and profit, and competitive advantage.
Lastly, a bank must forge an innovation management effectiveness that is
aligned with its overall innovation strategy with strategic leadership by choosing the
project implementation with the best value propositions by improving the
organization culture, managing the operation system and process efficiently so it does
not waste time or resources and commercialize innovations well, with everyone
working together as a team (Jaruzelski et al., 2005) and improving coordination
(Mintzberg, 1979) with communication and participation as critical factors in
innovation (Johnson et al., 2001).
7.6 Limitations of the Study
The results and findings of this research are clearly valuable regarding the
theoretical aspects. However, several limitations exist and the details are as follows.
First, this research is a cross-sectional study, using data from questionnaires and
180
collected from bank representatives at one point in time; therefore the relationship of
constructs from this study should be considered and applied with caution, and future
studies may consider longitudinal study in order to confirm the results of this study.
Second, the area of study is the banking industry. The generalizability of the
results may be limited. Moreover, the research was conducted only within Thailand
and in the Bangkok area. Therefore, future studies may apply the same questionnaires
in other cultures or geographical areas in order to confirm the results. Additionally,
cross-industry research is also recommended for future research to help improve the
generalizability of the research findings. Third, there are uncertain situations with
time constraints and unpredictable factors associated with these risks during the
dissertation study.
7.7 Future Directions of Research Study
This research and its findings provide a number of directions for future
research as follows.
1) The research results clearly shows the effect of the causal variables
on innovation management effectiveness. It is the merit of the present study that it
has provided evidence that confirms these theses by combining a cross-sectional and a
longitudinal approach for the improvement of innovation management effectiveness.
2) The cross-sectional approach with the research should expand on the
number of local banks in Thailand under the conceptual framework and hypotheses
model, taking more on the qualitative approach with more interviews with high level
management which would be beneficial for a better understanding of the antecedents
of innovation management effectiveness.
3) A longitudinal approach could be taken to test the research model
with comparison between banks in Thailand and banks in other foreign countries for
causal explanations of innovation management effectiveness.
4) This research model should also be empirically tested in the different
environments in cluster industry sectors to determine its predictive validity in
alternate settings.
181
5) Taking into account the large contextual variation between industries,
the comparison has showed surprisingly consistent results. Consequently, the results
may be generalized for innovation management effectiveness at large.
In conclusion, this chapter has summarized the findings that directly answer
both the significance and the objectives of the study by providing the discussion,
conclusions, contribution and implications with recommendation as well as the
limitations of the study and suggested future directions of research study.
BIBLIOGRAPHY
Abbey, A. and Dickson, J. 1983. R&D Work Climate and Innovation in Semi-
Conductors. Academy of Management Journal. 26: 362–368.
Abernathy, W.J. and Clark, K.B. 1985. Innovation: Mapping the Winds of Creative
Destruction. Research Policy. 14: 3−22.
Adams, R.; Bessant, J. and Phelps, R. 2006. Innovation Management Measurement:
A Review. International Journal of Management Reviews. 8 (1): 21-47.
Afuah, A. 2003. Innovation Management: Strategies, Implementation and
Profits. New York: Oxford University Press.
Agrell, A. and Gustafson, R. 1994. The Team Climate Inventory (TCI) and Group
Innovation: A Psychometric Test on a Swedish Sample of Work Groups.
Journal of Occupational and Organizational Psychology. 67: 143–151.
Ahmed, P.K. 1998. Culture and Climate for Innovation. European Journal of
Innovation Management. 1 (1): 30-43.
Aiken, M. and Hage, J. 1971. The Organic Organization and Innovation. Sociology.
5: 63-82.
Aiken, M.; Bacharach, S. and French, J. 1980. Organizational Structure, Work
Process, and Proposal Making in Administrative Bureaucracies. Academy
of Management Journal. 23 (4): 631–652.
Aldrich, H. 1999. Organizations Evolving. London: Sage.
Alegre-Vidal, J.; Lapiedra-Alcami, R. and Chiva-Gomez, R. 2004. Linking
Operations Strategy and Product Innovation: An Empirical Study of
Spanish Ceramic Tile Producers. Research Policy. 33: 829–839.
Amabile, T.M. 1983. The Social Psychology of Creativity. New York: Springer-
Verlag.
Amabile, T.M. and Conti, R. 1999. Changes in the Work Environment for Creativity
during Downsizing. The Academy of Management Journal. 42(6):
630-640.
183
Amabile, T.M.; Conti, R.; Coon, H.; Lazenby, J. and Herron, M. 1996. Assessing the
Work Environment for Creativity. Academy of Management Journal.
39: 1154–1185.
Amason, A.C. 1996. Distinguishing the Effects of Functional and Dysfunction
Conflict on Strategic Decision Making: Resolving a Paradox for Top
Management Teams. Academic of Management Journal. 39 (5): 123-
148.
Anbari, F.R. 2005. Innovation, Project Management, and Six Sigma. Current
Topics in Management. M.A. Rahim and R. T. Golembiewski, eds. New
Brunswick, NJ: Transaction Publishers. Pp. 101-116.
Anderson, J.C. and Gerbing, D.W. 1988. Structural Equation Modeling in Practice:
A Review and Recommended Two-Step Approach. Psychological
Bulletin. 103 (3): 411-423.
Anderson, N. R. and King, N. 1993. Innovation in Organizations. In International
Review of Industrial and Organizational Psychology. C.L. Cooper and
I.T. Robertson, eds. Chichester: Wiley. Pp. 1-34.
Anderson, N.R. and West, M.A. 1996. The Team Climate Inventory: Development
of the TCI and its Applications in Teambuilding for Innovativeness.
European Journal of Work and Organizational Psychology. 5: 53–66.
Anderson, N.R. and West, M.A. 1998. Measuring Climate for Work Group
Innovation: Development and Validation of the Team Climate Inventory.
Journal of Organizational Behavior. 19: 235–258.
Angle, H.L. 1989. Psychology and Organizational Innovation. In Research on the
Management of Innovation: The Minnesota Studies. A. H. Van deVen,
H. L. Angle and M. S. Poole, eds. New York: Harper and Row. Pp. 135-
170.
Annukka, V. 2008. Organisational Factors Affecting IT Innovation Adoption in
the Finnish Early Child-Hood Education. Proceedings of the 16th
European Conference on Information Systems (ECIS 2008), June 9-11,
Galway, Ireland.
Anthony, S.D.; Eyring, M. and Gibson, L. 2006. Mapping Your Innovation Strategy.
Harvard Business Review. May: 104-113.
184
Argyris, C. 1964. Integrating the Individual and the Organization. New York:
Wiley.
Au, A.K.M. and Enderwick, P. 2000. A Cognitive Model on Attitude towards
Technology Adoption. Journal of Managerial Psychology. 15 (4): 266.
Babbie,E.R. 1999. The Practice of Social Research. Belmont, CA:Wadsworth.
Baker, K.A. 2002. Chapter 14. Innovation. Retrieved July 8, 2010 from
http://www.au.af.mil/au/awc/awcgate/doe/benchmark/ch14.pdf
Balkundi, F.; Kilduff, M.; Barsness, Z.I. and Judd, M. 2007. Demographic
Antecedents and Performance Consequences of Structural Holes in Work
Teams. Journal of Organizational Behavior. 28: 241-260.
Bank of Thailand. 2010. Number of Bank Branches.
http://www.bot.or.th/English/Statistics/Financiallnsitutions/
CommercialBank/Pages/StatNumberof Branches.aspx.
Barney, J.B. 1986. Strategic Factor Markets: Expectations, Luck, and Business
Strategy. Management Science. 21: 1231-1241.
Barney, J.B. 1991. Firm Resources and Sustained Competitive Advantage. Journal
of Management. 17: 99-120.
Barney, J.B. and Wright, P.M. 1998. On Becoming a Strategic Partner: The Role of
Human Resources in Gaining Competitive Advantage. Human Resource
Management. 37: 31-46.
Bass, B.M. 1998. Transformational Leadership: Industry, Military and
Educational Impact. Mahwah, NJ: Lawrence Erlbaum Associates.
Baysinger, B.D. and Hoskisson, R.E. 1989. Diversification Strategy and RandD
Intensity in Large Multi-Product Firms. Academy of Management
Journal. 32: 310-332.
Becker, S.W. and Whisler, T.L. 1973. The Innovative Organization: A Selective
View of Current Theory and Research. Creating and Marketing New
Products. G. Wills, R. Hayhurst and D. Midgley, eds. London: Crosby
Lockwood Staples.
Beer, M.; Lawrence, P.R.; Mills, D.Q. and Walton, R.E. 1984. Managing Human
Assets. New York: Free Press.
185
Bentler, P.M. 1990. Comparative Fit Indexes in Structural Models. Psychological
Bulletin. 107 (2): 238-246.
Bessant, J. 2003. High Involvement Innovation: Building and Sustaining
Competitive Advantage through Continuous Change. Chichester:
Wiley.
Betts, M. and Lansley, P. 1995. International Journal of Project Management: A
Review of the First Ten Years. International Journal of Project
Management. 12 (4): 207-217.
Bierly, P. and A. Chakrabarti. 1996. Generic Knowledge Strategies in the U.S.
Pharmaceutical Industry. Strategic Management Journal. 17 (Winter):
123-135.
Boisot, M.H. 1995. Is your Firm a Creative Destroyer? Competitive Learning and
Knowledge Flows in the Technological Strategies of Firms. Research
Policy. 24: 489-506.
Bollen, K.A. and Long, S.J. 1993. Testing Structural Equation Models. London:
Sage.
Bonner, B. L.; Baumann, M.R. and Dalal, R.S. 2002. The Effects of Member
Expertise on Team Decision-Making and Performance. Organizational
Behavior and Human Decision Process. 88: 719‐736.
Bowen, D.E. and Schneider, B. 1988. Services Marketing and Management:
Implications for Organizational Behavior. Research in Organizational
Behavior. 10: 43-80.
Bowers, M.R. 1986. The New Product Development Process: A Suggested Model
for Banks. Journal of Retail Banking. 8: 19-24.
De Brentani, U. 1989. Success and Failure in New Industrial Services. Journal of
Product Innovation Management. 6: 239-258.
De Brentani, U. 1991. Success Factors in Developing New Business Services.
European Journal of Marketing. 24 (2): 33-59.
De Brentani, U. 1993a. The Effect of Customization and Customer Contact on the
Factors Determining Success and Failure of New Industrial Services.
Perspectives on Marketing Management. M.J. Baker, ed. New York:
Wiley. Pp. 275-298.
186
De Brentani, U. 1993b. The New Product Process in Financial Services: Strategy for
Success. International Journal of Bank Marketing. 11 (3): 15-22.
De Brentani, U. 1995. New Industrial Service Development: Scenarios for Success
and Failure. Journal of Business Research. 32: 93-103.
De Brentani, U. and Cooper, R.G. 1992. Developing Successful New Financial
Services for Businesses. Industrial Marketing Management. 21: 231-
241.
Brown, S.L. and Eisenhardt, K.M. 1997. The Art of Continuous Change: Linking
Complexity Theory and Time-Paced Evolution in Relentlessly Shifting
Organizations. Administrative Science Quarterly. 42: 1–34.
Browne, M. 1984. Asymptotically Distribution-Free Methods for the Analysis of
Covariances Structures. British Journal of Mathematical and
Statistical Psychology. 37 (1): 62–83.
Bryne, B.M. 2001. Structural Equation Modeling with AMOS: Basic Concepts,
Applications, and Programming. New Jersey: Lawrence Erlbaum
Associates.
Burnett, N. 1997. Gender Economics Courses in Liberal Arts Colleges. Journal of
Economic Education. 28: 369– 377.
Burns, T.R. and Stalker, G.M. 1961. The Management of Innovation. London:
Tavistock.
Calatone, R.J.; Cavusgil, S.T. and Zhao, Y. 2002. Learning Orientation, Firm
Innovation Capability, and Firm Performance. Industrial Marketing
Management Science. 32 (1): 87-112.
Caldwell, D.F. and O'Reilly, C.A. 2003. The Determinants of Team-Based
Innovation in Organizations. Small Group Research. 34: 497−517.
Cameron, K.S. 1986. A Study of Organizational Effectiveness and its Predictors.
Management Science. 32(1): 87-112.
Cameron, K.S. and Quinn, R.E. 1983. Organizational Life Cycle and Shifting
Criteria of Effectiveness: Some Preliminary Evidence. Management
Science. 29: 33–51.
Del Canto, J.G. and Gonzalez, I.S. 1999. A Resource-Based Analysis of the Factors
Determining a Firm’s RandD Activities. Research Policy. 28: 891-905.
187
Carson, J.B.; Tesluk, P.E. and Marrone, J.A. 2007. Shared Leadership in Teams: An
Investigation of Antecedent Conditions and Performance. Academy of
Management Journal. 50: 1217-1234.
Cascio, W.F. 1991. Costing Human Resources: The Financial Impact of
Behavior in Organizations. Boston: Kent.
Cebon, P. and Newton, P. 1999. Innovation in Firms: Towards a Framework for
Indicator Development. Melbourne Business School Working Paper 99-
9. Melbourne: Melbourne Business School.
Chan, Y. E.; Huff, S. L.; Barclay, D.W. and Copeland, D.G. 1997. Business Strategy
Orientation, Information Systems Orientation and Strategic Alignment.
Information Systems Research. 8 (2): 125-150.
Chandler, A.D. 1962. Strategy and Structure: Chapters in the History of the
Industrial Enterprise. Cambridge Mass: MIT Press.
Chiesa, V. and Masella, C. 1994. Searching for an Effective Measure of R&D
Performance. In Proceedings, 2nd International Product Development
Management Conference. Gothenburg, Sweden, 30–31 May. Brussels:
European Institute for Advanced Studies in Management.
Chiesa, V.; Coughlan, P. and Voss, A. 1996. Development of a Technical Innovation
Audit. Journal of Product Innovation Management. 13: 105–136.
Christensen, C.M. 1997. The Innovator’s Dilemma. Boston: Harvard Business
School Press.
Clark, K. and Wheelwright, S. 1992. Organizing and Leading "Heavyweight"
Development Teams. California Management Review. Spring: 9-28.
Collins, C.J. and Smith, K.G. 2006. Knowledge Exchange and Combination: The
Role of Human Resource Practices in the Performance of High
Technology Firms. Academy of Management Journal. 49: 544-560.
Collis, D.J. 1991. A Resource Based Analysis of Global Competition: The Case of
the Bearings Industry. Strategic Management Journal. 12: 49-68.
Conner, K. and Prahalad, C.K. 1996. A Resource-Based Theory of the Firm:
Knowledge Versus Opportunism. Organization Science. 7: 477-501.
Cooper, R.G. 1984. The Strategy–Performance Link in Product Innovation. R&D
Management. 14: 247–259.
188
Cooper, R.G. 1990. Stage-Gate Systems: A New Tool for Managing New Products.
Business Horizons. 33: 44–56.
Cooper, R.G. 2001. Winning at New Products: Accelerating the Process from
Idea to Launch. Cambridge, MA: Perseus.
Cooper, R.G. and De Brentani, U. 1991. New Industrial Financial Services: What
Distinguishes the Winners. Journal of Product Innovation
Management. 8: 75-90.
Cooper, R.G. and Kleinschmidt, E.J. 1990. New Product Success Factors: A
Comparison of ‘Kills’ Versus Successes and Failures. R&D Management.
20: 47–64.
Cooper, R.G.; Edgett, S.J. and Kleinschmidt, E.J. 2004. Benchmarking Best NPD
Practices. Research-Technology Management. 47: 50–59.
Cooper, R.G.; Easingwood, C.J.; Edgett, S.; Kleinschmidt, E.J. and Storey, C. 1994.
What Distinguishes the Top Performing New Products in Financial
Services. Journal of Product Innovation Management. 11: 281-299.
Coughlan, P.; Chiesa, V. and Voss, C. 1994. Evaluating Leadership as an Enabler of
Innovation. In Proceedings, 2nd International Product Development
Management Conference. Gothenburg, Sweden, 30–31 May. Brussels:
European Institute for Advanced Studies in Management.
Covin, J.G. and Slevin, D.P. 1989. Strategic Management of Small Firms in Hostile
and Benign Environments. Strategic Management Journal. 10: 75–88.
Cowell, D.W. 1988. New Service Development. Journal of Marketing
Management. 3 (3): 296-312.
Craig, A. and Hart, S. 1992. Where to Now in New Product Development
Research?. European Journal of Marketing. 26 (11): 3-36.
Craig, T. 1995. Achieving Innovation Through Bureaucracy: Lessons from the
Japanese Brewing Industry. California Management Review. 8(Fall):
38.
Crawford, L.; Pollack, J. and England, D. 2006. Uncovering the Trends in Project
Management: Journal Emphasis over the Last 10 Years. International
Journal of Project Management. 24 (2): 175-184.
189
Daft, R.L. 1992. Organization Theory and Design. West St. Paul, MN: South-
Western Cengage Learning.
Dailey, R.C. 1978. The Role of Team and Task Characteristics in RandD Team
Collaborative Problem Solving and Productivity. Management Science.
24 (15): 1579-1588.
Damanpour, F. 1991. Organizational Innovation: A Meta-Analysis of Effects of
Determinants and Moderators. Academy of Management Journal. 34:
555−590.
Damanpour, F. 1992. Organizational Size and Innovation. Organization Studies.
13: 375-402.
Damanpour, F. 1996. Organizational Complexity and Innovation: Developing and
Testing Multiple Contingency Models. Management Science. 42: 693–
716.
Damanpour, F. and Gopalakrishnan, S. 1998. Theories of Organizational Structure
and Innovation Adoption: The Role of Environmental Change. Journal of
Engineering and Technology Management. 15: 1-24.
David, R. and Han, S. 2003. A Systematic Assessment of the Empirical Support for
Transaction Cost Economics. Strategic Management Journal. 25: 39–58.
Deal, T.E. and Kennedy, A.A. 1982. Corporate Cultures: The Sites and Rituals of
Corporate Life. Reading, MS: Addison-Wesley.
Decarolis, D. and Deeds, D.L. 1999. The Impact of Stocks and Flows of
Organizational Knowledge on Firm Performance: An Empirical
Investigation of the Biotechnology Industry. Strategic Management
Journal. 20: 953-968.
Denison, D.R. 1996. What is the Difference between Organizational Culture and
Organizational Climate? A Native’s Point of View on a Decade of
Paradigm Wars. The Academy of Management Review. 21 (3): 619-
654.
Denison, D.R. 2001. Organisational Culture: Can it Be a Key Lever for Driving
Organisational Change? The International Handbook of
Organizational Culture and Climate. C.L. Cooper, S. Cartwright and
P.C. Earley, eds. New York: Wiley.
190
Denison, D. R.; Hooijberg, R. and Quinn, R. E. 1995. Paradox and Performance:
Toward a Theory of Behavioral Complexity in Managerial Leadership.
Organization Science. 6: 524−540.
Deschamp, J.P. 2005. Different Leadership Skills for Different Innovation
Strategies. Strategy and Leadership. 33(5): 31-38.
Dewar, R.D. and Dutton, J.E. 1986. The Adoption of Radical and Incremental
Innovations: An Empirical Analysis. Management Science. 32(11):
1422-1433.
Dierickx, I. and Cool, K. 1989. Asset Stock Accumulation and Sustainability of
Competitive Advantage. Management Science. 35 (12): 1504-1511.
Dodge, Y. 2003. The Oxford Dictionary of Statistical Terms. London: Oxford
University Press.
Dosi, G. 1988. Sources, Procedures, and Microeconomic Effects of Innovation.
Journal of Economic Literature. 26: 1120-1171.
Dosi, G.; Freeman, C.; Nelson, R.R.; Silverberg, G. and Soete, L. (Eds.). 1988.
Technical Change and Economic Theory. London: Pinter.
Dougherty, D. and Cohen, M. 1995. Product Innovation in Mature Firms. In
Redesigning the Firm. E. Bowman and B. Kogut, eds. New York:
Oxford University Press. Pp.87-115.
Dougherty, D. and Hardy, C. 1996. Sustained Product Innovation in Large, Mature
Organizations: Overcoming Innovation-to-Organization Problems.
Academy of Management Journal. 39 (5): 1120–1153.
Dougherty, D. and Takacs, C. H. 2004. Team Play: Heedful Interrelating as the
Boundary for Innovation. Long Range Planning. 37: 569-590.
Downs and Mohr. 1979. Toward a Theory of Innovation. Administration and
Society. 10 (4): 379-408.
Drew, S. 1994. Business Re-engineering in Financial Services. London: Pitman
Publishing.
Drucker, P. 1973. Management: Tasks, Responsibilities, Practices. New York:
Harper and Row Publishers.
Drucker, P. 2001. Leading for Innovation. San Francisco: Jossey-Bass.
191
Duncan, R.B. 1976. The Ambidextrous Organization: Designing Dual Structures
Firm Innovation. The Management of Organization: Strategy and
Implementation. R. H. Kilmann, L.R. Pondy, D.P. Slevin, eds. New
York: North-Holland. Pp. 167-188.
Durkheim, E. 1997. The Division of Labor in Society. Tr. by W. D. Halls. New
York: Free Press.
Dyer, B. and Song, X.M. 1998. Innovation Strategy and Sanctioned Conflict: A New
Edge in Innovation? Journal of Product Innovation Management. 15:
505–519.
Dyer, J.H. and Singh, H. 1998. The Relational View: Cooperative Strategy and
Sources of Interorganizational Competitive Advantage. Academy of
Management Review. 23 (4): 660-679.
Earley, P.C. 1994. Self or Team? Cultural Effects of Training on Self-Efficacy and
Performance. Administrative Science Quarterly. 39: 89-117.
Easingwood, C.J. 1986. New Product Development for Service Companies.
Journal of Product Innovation Management. 4: 264-275.
Easingwood, C.J. and Percival, J. 1990. Evaluation of New Financial Services.
International Journal of Bank Marketing. 8 (6): 3-8.
Easingwood, C.J. and Storey, C. 1991. Success Factors for New Consumer Financial
Services. International Journal of Bank Marketing. 1: 3-10.
Easingwood, C.J. and Storey, C. 1993. Marketplace Success Factors for New
Financial Services. The Journal of Services Marketing. 7 (1): 41-54.
Edgett, S. and Jones, S. 1991. New Product Development in the Financial Services
Industry: A Case Study. Journal of Marketing Management. 7: 271-
284.
Edvardsson, B. and Olsson, J. 1996. Key Concepts for New Service Development.
The Service Industries Journal. 16 (2): 140-164.
Ekvall, G. 1996. Organizational Climate for Creativity and Innovation. European
Journal of Work and Organizational Psychology. 5: 105–123.
Ennew, C.T. and Wright, M. 1990. Retail Banks and Organizational Change:
Evidence from the UK. International Journal of Bank Marketing. 8
(1): 4-9.
192
Ensley, M.D.; Hmieleski, K.M. and Pearce, C.L. 2006. The Importance of Vertical
and Shared Leadership within New Venture Top Management Teams:
Implications for the Performance of Startups. The Leadership
Quarterly. 17: 217−231.
Ensley, M. D.; Pearce, C. L. and Hmieleski, K. 2006. The Moderating Effect of
Environmental Dynamism on the Relationship between Entrepreneur
Leadership Behavior and New Venture Performance. Journal of Business
Venturing. 21 (2): 243−263.
Ernst, H. 2002. Success Factors of New Product Development: A Review of the
Empirical Literature. International Journal of Management Reviews.
4: 1–40.
Etzioni, A. 1964. Modern Organizations. Englewood Cliffs, NJ: Prentice Hall.
Fagerberg, J. 2004. Innovation: A Guide to the Literature. The Oxford Handbook
of Innovations. J. Fagerberg, D.C. Mowery and R.R. Nelson, R.R., eds.
Oxford: Oxford University Press.
Fagerberg, J. and Verspagen, B. 2009. Innovation Studies – The Emerging Structure
of a New Scientific Field. Research Policy. 38(2): 218-233.
Farris, G.F. 1973. The Technical Supervisor: Beyond the Peter Principle. Technical
Review. 75(5), April.
Farrukh, C.; Phaal, R.; Probert, D.; Gregory, M. and Wright, J. 2000. Developing a
Process for the Relative Valuation of R&D Programmes. R&D
Management. 30: 43–53.
Fiedler, F.E. 1967. A Theory of Leadership Effectiveness. New York: McGraw-
Hill.
Filipczak, B. 1997. It Takes All Kinds: Creativity in the Work Force. Training. 34
(5): 32-40.
Filippov, S. and Mooi, H. 2009. Innovation Project Management: A Research
Agenda. Presented at the 6th International Conference for Innovation and
Management (ICIM2009), São Paulo, Brazil, 8-10 December 2009.
Flanagin, A.J. 2000. Social Pressures on Organizational Website Adoption. Human
Communication Research. 26 (4): 618.
193
Fornell, C. and Larcker, D. F. 1981. Structural Equation Models with Unobservable
Variables and Measurement Error: Algebra and Statistics. Journal of
Marketing Research. 18 (3): 382-388.
Fortuin, F.T.J.M. 2006. Aligning Innovation to Business Strategy. Combining
Cross-Industry and Longitudinal Perspectives on Strategic Alignment
in Leading Technology-Based Companies. Doctoral dissertation,
Wageningen University.
Foster, W.K. and Pryor, A.K. 1986. The Strategic Management of Innovation.
Journal of Business Strategy. 7(1): 38-42.
Frambach, R.T.; Barkema, H.G.; Nooteboom, B. and Wedel, M. 1998. Adoption of a
Service Innovation in the Business Market: An Empirical Test of Supply-
Side Variables. Journal of Business Research. 41: 161-174.
Frambach, R.T. and Schillewaert, N. 2002. Organizational Innovation Adoption: A
Multilevel Framework of Determinants and Opportunities for Future
Research. Journal of Business Research. 55: 163-176.
Freeman, C. 1982. The Economics of Industrial Innovation. London: Pinter.
Freeman, C. and Soete, L. 1997. The Economics of Industrial Innovation. 3rd ed.
London: Pinter.
French, W.L. and Bell, C.H. 1995. Organizational Development: Behavioural
Science Interventions for Organizational Improvement. 5th ed.
Englewood Cliffs, NJ: Prentice Hall.
Galbraith, J. R. 1971. Matrix Organization Designs: How to Combine Functional
and Project Form. Business Horizons. 14(February): 29-40.
Gatignon, H. and Xuereb, J.M. 1997. Strategic Orientation of the Firm and New
Product Performance. Journal of Marketing Research. 34: 77-90.
Geisler, E. 1995. An Integrated Cost–Performance Model of Research-and-
Development Evaluation. Omega – International Journal of
Management Science. 23: 281–294.
Gersick, C.J.G. 1989. Marking Time: Predict Table Transitions in Task Groups.
Academy of Management Journal. 32(September): 274-309.
Geschka, H. 1983. Creativity Techniques in Product Planning and Development: A
View from West Germany. R&D Management. 13: 169-183.
194
Ghemawat, P. 1991. Commitment: The Dynamics of Strategy. New York: Free
Press.
Gilbert, C. 2005. Unbundling the Structure of Inertia: Resource Versus Routine
Rigidity. Academy of Management Journal. 48: 741–763.
Gilbert, C. 2006. Change in the Presence of Residual Fit: Can Competing Frames
Coexist? Organization Science. 17(1): 150-167.
Gibson, C.B. and Birkinshaw, J. 2004. The Antecedents, Consequences, and
Mediating Role of Organizational Ambidexterity. Academy of
Management Journal. 47: 209−226.
Ginsburg, A. and Venkatraman, N. 1985. Contingency Perspectives of
Organizational Strategy: A Critical Review of the Empirical Research.
Academy of Management Review. 10: 421-434.
Globe, S.; Levy, G.W. and Schwartz, C.M. 1973. Key Factors and Events in the
Innovation Process. Research Management. 16: 8–15.
Glor, E.D. 1997. Encouraging Public Sector Innovation. Optimum. 27 (2): 41-48.
Goldhaber, G.M. 1993. Organizational Communication. 6th ed. Madison, Wis:
Brown and Benchmark.
Grant, J.H. and King, W.R. 1984. The Logic of Strategic Planning. Boston: Little,
Brown.
Grant, R.M. 1996. Toward a Knowledge-based Theory of the Firm. Strategic
Management Journal. 17: 109-122.
Grant, R.M. and Ch. Baden-Fuller. 2004. A Knowledge Accessing Theory of
Strategic Alliances. Journal of Management Studies. 41(1): 61-84.
Grden-Ellson, N. 1986. Key Factors in New Product Success: Three Case Studies.
Journal of Retail Banking. 8 (1/2): 25-28.
Griffin, A. and Page, A.L. 1993. An Interim Report on Measuring Product
Development Success and Failure. Journal of Product Innovation
Management. 10: 291-308.
Grover, V.; Goslar, M. and Segars, A. 1995. Adopters of Telecommunications
Initiatives: A Profile of Progressive US Corporations. International
Journal of Information Management. 15: 33-46.
195
Gulati, R. and Sytch, M. 2007. Dependence Asymmetry and Joint Dependence in
Interorganizational Relationships: Effects of Embeddedness on a
Manufacturer’s Performance in Procurement Relationships.
Administrative Science Quarterly. 52: 32–69.
Guzzo, R.A. and Dickson, M.W. 1996. Teams in Organizations: Recent Research on
Performance and Effectiveness. Annual Review of Psychology. 47:307-
338.
Hackman, J.R. 1992. Team Influences on Individuals in Organizations. In
Handbook of Industrial and Organizational Psychology. Vol. 3. M.D.
Dunnette and L.M. Hough, eds. Palo Alto: Consulting Psychologists
Press.
Hage, J. and Aiken, M. 1967. Relationship of Centralization to Other Structural
Properties. Administrative Science Quarterly. 12(2): 72-92.
Hage, J. and Aiken, M. 1970. Social Change in Complex Organisations. New
York: Random House.
Hair, J. F.; Black, W. C.; Babin, B. J.; Anderson, R. E. and Tatham, R. L. 2006.
Multivariate Data Analysis. 6th ed. Englewood Cliffs,NJ: Prentice Hall.
Harris, R. and Trainor, M. 1995. Innovations and RandD in Northern Ireland
Manufacturing: A Schumpeterian Approach. Regional Studies. 29 (7):
593-604.
Halawi, L.; Aronson, J. and McCarthy, R. 2005. Resource-Based View of
Knowledge Management for Competitive Advantage. The Electronic
Journal of Knowledge Management. 3(2): 75-86.
Hamel, G. 2000. Leading the Revolution. Boston: Harvard Business School Press.
Hammer, M. and Champy, J. 1994. Reengineering the Corporation: A Manifesto
for Business Revolution. New York: Harperbusiness.
Han, J.K.; Kim, N. and Srivastava, R.K. 1998. Market Orientation and
Organizational Performance: Is Innovation a Missing Link? Journal of
Marketing. 62: 30-45.
Hardington, A. 2003. How Breakthroughs Happen. Boston: Harvard Business
School Press.
196
Hatch, Nile W. and Mowery, David C. 1998. Process Innovation and Learning by
Doing in Semiconductor Manaufacturing. Management Science.
44(November): 1461-1477.
Hauser, J.R. and Zettelmeyer, F. 1997. Metrics to Evaluate R, D&E. Research-
Technology Management. 40: 32–38.
Helfat, C. 1997. Know-How and Asset Complementarity and Dynamic Capability
Accumulation: The Case of R&D. Strategic Management Journal. 18:
339-360.
Helfat, C.E. and Peteraf, M.A. 2003. The Dynamic Resource-Based View:
Capability Lifecycles. Strategic Management Journal. 24: 997–1010.
Henderson R. and Cockburn, H. 1994. Measuring Competence? Exploring Firm
Effects on Pharmaceutical Research. Strategic Management Journal.
15: 63-84.
Hitt, M.A.; Bierman, L.; Shimizu, K. and Kochlar, R. 2001. Direct and Moderating
Effects of Human Capital on Strategy and Performance in Professional
Service Firms: A Resource-Based Perspective. Academy of
Management Journal. 44: 13-28.
De Hoogh, A. H. B.; Den Hartog, D. N. and Koopman, P. L. 2005. Linking the Big
Five-Factors of Personality to Charismatic and Transactional Leadership;
Perceived Dynamic Work Environment as a Moderator. Journal of
Organizational Behavior. 26 (7): 839−865.
Hope Hailey, V. 2001. Breaking the mould? Innovation as a Strategy for Corporate
Renewal. International Journal of Human Resource Management.
12: 1126–1140.
Hopkins, W.E. and Hopkins, S.A. 2002. Effects of Cultural Recomposition on Team
Interaction Processes. Academy of Management Review. 27: 541-553.
Hornsby, J.S.; Kuratko, D.F.; Shaker, A. and Zahra, S.A. 2002. Middle Managers’
Perception of the Internal Environment for Corporate Entrepreneurship:
Assessing a Measurement Scale. Journal of Business Venturing. 17:
253-273.
Howell, J.M. and Avolio, B.J. 1993. Transformational Leadership, Transactional
Leadership, Locus of Control, and Support for Innovation: Key Predictors
197
of Consolidated-Business-Unit-Performance. Journal of Applied
Psychology. 78: 891−902.
Howell, J.M. and Higgins, C. A. 1990. Champions of Technological Innovation.
Administrative Science Quarterly. 35: 317−325.
Hsu, M.H.; Chen, I.Y.; Chiu, C.M. and Ju, T. 2005. Exploring the Antecedents of
Team Performance in Collaborative Learning of Computer Software.
Computer & Education. 48:70-718.
Hu, L. and Bentler, P.M. 1999. Cutoff Criteria for Fit Indexes in Covariance
Structure Analysis: Conventional Criteria Versus New Alternatives.
Structural Equation Modeling: A Multidisciplinary Journal. 6 (1): 1-
55.
Huber, G.P. 1991. Organizational Learning: The Contributing Processes and
Literatures. Organization Science. 2: 71-87.
Hudson, M.; Smart, A. and Bourne, M. 2001. Theory and Practice in SME
Performance Measurement Systems. International Journal of
Operations and Production Management. 21 (8): 1096-1115.
Huff, S.L. and Munro, M.C. 1985. Information Technology Assessment and
Adoption: A Field Study. MIS Quarterly. (December): 327-338.
Huiban, J.P. and Bouhsina, Z. 1998. Innovation and Quality If the Labor Factor: An
Empirical Investigation in the French Food Industry. Small Business
Economics. 10: 389-400.
Hull, F. and Hage, J. 1982. Organizing for Innovation: Beyond Burns and Stalker's
Organic Type. Sociology. 16: 564-577.
Iansiti M.; Clark K. 1994. Integration and Dynamic Capability: Evidence from
Product Developments in Automobiles and Mainframe Computers.
Industrial and Corporate Change. 3: 557-605.
IFAD. 2007. Innovation Strategy. Retrieved October 27, 2010
http://www.ifad.org/pub/policy/innovation/e.pdf
Investopedia. 2010. Financial Directory. Retrieved October 27, 2010
http://www.investopedia.com
198
Ireland, D.R.; Kuratko, D.F. and Covin, J. 2003. Antecedents, Elements and
Consequences of Corporate Entrepreneurship Strategy. Academy of
Management. Best Conference Paper, ENT: L1-L6.
Irons, K. 1994. Managing Service Companies: Strategies for Success.
Wokingham: Addison-Wesley.
Janis, I.L. 1972. Victims of Groupthink. Boston: Houghton Mifflin.
Janis, I.L. 1982. Group Think. 2nd ed. Boston: Houghton Mifflin.
Jansen, J.J.P.; Van den Bosch, F. A. J. and Volberda, H. W. 2006. Exploratory
Innovation, Exploitative Innovation, and Performance: Effects of
Organizational Antecedents and Environmental Moderators.
Management Science. 52: 1661−1674.
Jansen, J.J.P.; Vera, D. and Crossan, M. 2009. Strategic Leadership for Exploration
and Exploitation: The Moderating Role of Environmental Dynamism. The
Leadership Quarterly. 20: 5–18.
Jaruzelski, B.; Dehoff, K. and Bordia, R. 2005. Money Isn't Everything. Strategy +
Business. (Winter): 54-67.
Jenkins, S.; Forbes, S.; Durrani, T.S. and Banerjee, S.K. 1997. Managing the Product
Development Process 1. An Assessment. International Journal of
Technology Management. 13: 359–378.
Jiang, J. J.; Klein, G. and Crampton, S. M. 2000. A Note on SERVQUAL Reliability
and Validity in Information System Service Quality Measurement.
Decision Sciences. 31 (3): 725 – 744.
Jiminez-Jiminez, D. and Sanz-Valle, R. 2005. Innovation and Human Resource
Management Fit: An Empirical Study. International Journal of
Manpower. 26(4): 364-398.
Jiménez-Jimenez, D.; Valle, R.S. and Hernandez-Espallardo, M. 2008. Fostering
Innovation. European Journal of Innovation Management. 11(3): 389-
412.
Johansson, F. 2004. The Medici Effect: Breakthrough Insights at the
Intersection of Ideas, Concepts, and Cultures. Boston: Harvard
Business School Press.
199
Johne, F.A. and Harborne, P. 1985. How Large Commercial Banks Manage Product
Innovation. International Journal of Bank Marketing. 3 (1): 54-70.
Johne, F.A. and Storey, C. 1998. New Service Development: A Review of the
Literature and Annotated Bibliography. European Journal of Marketing.
32 (3/4): 184-251.
Johnson, J.D.; Donohue, W.A.; Atkin, C.K. and Johnson, S. 2001. Communication,
Involvement, and Perceived Innovativeness: Tests of a Model with two
Contrasting Innovations. Group and Organization Management. 26:
24-42.
Johnson, M.M. 1996. Finding Creativity in a Technical Organization. Research
Technology Management. 3a (5): 9-11.
Jonach, Ronald S. and Sommerlatte, T. 1999. The Innovation Premium: How the
Next-Generation Companies are Achieving Peak Performance and
Profitability. Reading, MA: Perseus Books.
Jørgensen, F.; Becker, K. and Matthews, J. 2009. Human Resource Management
and Innovation: What are Knowledge Intensive Firms Doing?
Retrieved October 28, 2010 from http://eprints.qut.edu.au/27157/1/
CINet_09_-_Jorgensen.pdf.
Jørgensen, F.; Hyland, P. and Kofoed Lise, B. 2008. Examining the Role of Human
Resource Management in Continuous Improvement. International
Journal of Technology Management. 42 (1-2): 127-142.
Judge, W.Q.; Fryxell, G.E. and Dooley, R.S. 1997. The New Task of R and D
Management: Creating Goal-Directed Communities for Innovation.
California Management Review. 39 (3): 72-85.
Jung, D.I.; Chow, C. and Wu, A. 2003. The Role of Transformational Leadership in
Enhancing Organizational Innovation: Hypotheses and some Preliminary
Findings. The Leadership Quarterly. 14: 525−544.
Kale, P. and Singh, H. 1999. Alliance Capability and Success: A Knowledge-
Based Approach. Working paper. Philadelphia: Wharton School,
University of Pennsylvania.
200
Kale, P.; Dyer, J.H. and Singh, H. 2002. Alliance Capability, Stock Market
Response, and Long Term Alliance Success: The Role of the Alliance
Function. Strategic Management Journal. 23 (8): 747-767.
Kanji, G.K. and Sá, P.M.E. 2002. Kanji’s Business Scorecard. Total Quality
Management. 13(1): 13-27.
Kanter, R.M. 1983. The Change Masters: Corporate Enterepreneurs at Work.
London: Allen and Unwin.
Kanter, R.M. 1985. Supporting Innovation and Venture Development in Established
Companies. Journal of Business Venturing. 1: 47-60.
Kaplan, R.S. and Norton, D.P. 1996a. The Balanced Scorecard. Boston: Harvard
Business Press.
Kaplan, R.S. and Norton, D.P. 1996b. Using the Balanced Scorecard as a Strategic
Management System. Harvard Business Review. 74 (1): 75-86.
Kasikorn Bank. 2010. Staffs and Outlets – Kasikorn Bank. Retrieved November
5, 2010 from http://www.kasikornbank.com/EN/AboutUs/Pages/Staffs
Outlets.aspx.
Kast, F.E. and Rosenzweig, J.E. 1985. Organization and Management: A Systems
and Contingency Approach. 4th ed. New York: McGraw-Hill.
Katsikea, E.S.; Theodosiou, M.; Morgan, R.E. and Papavassiliou, N. 2005. Export
Market Expansion Strategies of Direct-Selling Small and Medium-Sized
Firms: Implications for Export Sales Management Activities. Journal of
International Marketing. 13 (2): 57-92.
Katz, R. 1982. The Effects of Group Longevity on Project Communication and
Performance. Adminstrative Science Quarterly. 27: 81-104.
Keegan, A. and Turner, J.R. 2002. The Management of Innovation in Project-Based
Firms. Long Range Planning. 35 (4): 367-388.
Keller, R.T. 1986. Predictors of Performance of Project Groups in R&D
Organizations. Academy of Management Journal. 29 (4): 715–726.
Kellogg, K.C.; Orlikowski, W. J. and Yates, J. 2006. Life in the Trading Zone:
Structuring Coordination across Boundaries in Postbureaucratic
Organizations. Organization Science. 17: 22-44.
201
Kenny, D.A. 2008. Measuring Model Fit. Retrieved November 23, 2010 from
http://davidakenny.net/cm/fit.htm.
Kessler, E.H. and Chakrabarti, A.K. 1999. Speeding Up the Pace of New Product
Development. Journal of Product Innovation Management. 16: 231-
247.
Kesting, P.; Müller, S.; Jørgensen, F. and Ulhøi, J. 2009. HRM Implications for
Network Collaboration of Small and Medium Sized Companies: What
We Know and What We Still Have to Find Out? Retrieved October 28,
2010 from http://research.asb.dk/fbspretrieve/9107/CINet2009_Kesting_
et_al.pdf.
Khalfan, M.M.A.; Anumba, C.J.; Siemieniuch, C.E. and Sinclair, M.A. 2001.
Readiness Assessment of the Construction Supply Chain for Concurrent
Engineering. European Journal of Purchasing and Supply
Management. 7: 141-153.
Kim, K.K. 1988. Organizational Coordination and Performance in Hospital
Accounting Information Systems: An Empirical Investigation. The
Accounting Review. 63: 472–489.
Kimberly, J. and Evanisko, M. 1981. Organizational Innovation: The Influence of
Individual, Organizational and Confextual Factors on Hospital Adoption
of Technical and Administrative Innovations. Academy of Management
Journal. 24: 689-713.
Kimberly, J.R. 1979. Issues in the Creation of Organizations: Initiation, Innovation,
and Institutionalization. Academy of Management Journal. 22: 437–
457.
Kimberly, J.R. 1981. Managerial Innovation. Handbook of Organizational
Design. P.C. Nystromand and W.H. Starbuck, eds. Oxford, UK: Oxford
University Press.
King, N. 1992. Modelling the Innovation Process: An Empirical Comparison of
Approaches. Journal of Occupational and Organizational Psychology.
65: 89–100.
King, N. and Anderson, N.R. 1990. Workgroup Innovation. In Innovation and
Creativity at Work. M.A. West and J.L. Farr, eds. Chichester: Wiley.
202
King, W.R. 1978. Strategic Planning for Management Informations Systems. MIS
Quarterly. 2 (1): 27-37.
Kirton, M.J. 1976. Adaptors and Innovators: A Description and Measure. Journal
of Applied Psychology. 61: 622–629.
Klein, K.J.; Conn, A.B. and Sorra, J S. 2001. Implementing Computerized
Technology: An Organization Analysis. Journal of Applied Psychology.
86(5): 811-824.
Kloppenberg, T. and Opfer, W.A. 2002. The Current State of Project Management
Research: Trends, Interpretations and Predictions. Project Management
Journal. 33(2): 5-19.
Koch, M.J. and McGrath, R. 1996. Improving Labor Productivity: Human Resource
Management Policies do Matter. Strategic Management Journal. 17(5):
335-354.
Kogut, B. and Zander, U. 1996. What Firms Do? Coordination, Identify, and
Learning. Organization Science. 7: 502-518.
Koput, K. 1997. A Chaotic Model of Innovative Search: Some Answers, Many
Questions. Organization Science. 8: 528–542.
Kostopoulos, K.; Spanos, Y. and Prastacos, G.P. 2002. The Resource-Based View
of the Firm and Innovation: Identification of Critical Linkages. 2nd
European Academy of Management Conference, Stockholm, May.
Kotter, J.P. 1996. Leading Change. Boston: Harvard Business School Press.
Kratzer, J. 2004. Stimulating the Potential: Creative Performance and
Communication in Innovative Teams. Stimulating the Potential. 13 (1):
63-71.
Kreitner, R. and Kinicki, A. 1995. Organizational Behaviour. 3rd ed. Chicago:
Irwin.
Kuratko, D.F.; Ireland, R.D. and Hornsby, J.S. 2001. Improving Firm Performance
through Entrepreneurial Actions: Acordia’s Corporate Entrepreneurship
Strategy. Academy of Management Executive. 15 (4): 60-71.
Kurtzberg, T. R. and Amabile, T. M. 2001. From Guilford to Creative Synergy:
Opening the Black Box of Team-Level Creativity. Creativity Research
Journal. 13: 285-294.
203
Kwak, Y.H. and Anbari, F.T. 2009. Analyzing Project Management Research:
Perspectives from Top Management Journals. International Journal of
Project Management. 27 (5): 435-446.
Langfred, C.W. 1998. Is Group Cohesiveness a Double-Edged Sword? An
Investigation of the Effects of Cohesiveness on Performance. Small
Group Research. 29 (1): 124-143.
Lawler, E. E., III. 1974. For a More Effective Organization – Match the Job to the
Man. Organizational Dynamics. 3 (1): 19-29.
Lawrence, P.R. and Lorsch, J.W. 1967. Organization and Environment. Harvard,
MA: Harvard University Press.
Leavitt, C. and Walton, J. 1975. Development of a Scale for Innovativeness.
Advances in Consumer Research. 2:545-554.
Lee, C.; Lee, K. and Pennings, J.M. 2001. Internal Capabilities, External Networks,
and Performance: A Study on Technology-Based Ventures. Strategic
Management Journal. 22: 615-640.
Lee, M.; Son, B. and Lee, H. 1996. Measuring R&D Effectiveness in Korean
Companies. Research-Technology Management. 39: 28–31.
De Leede, J. and Looise, J.K. 2005. Innovation and HRM: Towards an Integrated
Framework. Creativity and Innovation Management. 14 (2): 108-117.
Lehman, W.E.K.; Greener, J.M. and Simpson, D.D. 2002. Assessing Organizational
Readiness for Change. Journal of Substance Abuse Treatment. 22 (4):
197-209.
Lemaire, P. 2003. An Empirical Study on Functional Diversity and Innovation in
SMEs. Master’s thesis, National University of Singapore.
Lengnick-Hall, C. A. and Lengnick-Hall, M.L. 1988. Strategic Human Resources
Management: A Review of the Literature and a Proposed Typology.
Academy of Management Review. 13 (3): 454-470.
Leonard-Barton, D. 1995. Wellsprings of Knowledge: Building and Sustaining
the Sources of Innovation. Boston: Harvard Business School Press.
Leonard-Barton, D. and Swap, W.C. 2005. When Sparks Fly: Harnessing the
Power of Group Creativity. Boston: Harvard Business School Press.
204
Leung, A.S.M. 2008. Interpersonal Conflict and Resolution Strategies; An
Examination of Hong Kong Employees. Team Performance
Management. 14: 165-178.
Levitt, B. and March, J.G. 1988. Organizational Learning. Annual Review of
Sociology. 14: 319-340.
Li, H.Y. and Atuahene-Gima, K. 2001. Product Innovation Strategy and the
Performance of New Technology Ventures in China. Academy of
Management Journal. 44: 1123–1134.
Liao, J.; Welsch, H. and Stoica, M. 2003. Organizational Absorptive Capacity and
Responsiveness: An Empirical Investigation of Growth-Oriented SMEs.
Entrepreneurship Theory and Practice. 28: 63–86.
Lievens, A. and Moenaert, R. 1994. Communication as a Critical Determinant of
New Service Success and Failure. In Marketing: Its Dynamics and
Challenges. J. Bloemer, J. Lemmink and H. Kasper, eds. Proceedings
23rd EMAC Conference, Maastricht, 17-20 May. Pp. 1373-1378.
Lievens, A.; Moenaert, R.K. and S'Jegers, R. 1999. Linking Communication to
Innovation Success in the Financial Services Industry: A Case Study
Analysis. International Journal of Services Industries Management.
10(1): 23-47.
Liker, J.K. 2003. The Toyota Way. New York: McGraw-Hill.
Lin, X. and Germain, R. 2003. Product Quality Orientation and Its Performance
Implications in Chinese State-Owned Enterprises. Journal of
International Marketing. 11 (2): 59–78.
Litwin, G.H. and Stringer, R.A, Jr. 1968. Motivation and Organizational Climate.
Cambridge, MA: Harvard University Press.
Liyanage, S.; Greenfield, P.F. and Don, R. 1999. Towards a Fourth Generation of
R&D Management Model-Research Networks in Knowledge
Management. International Journal of Technology Management. 18:
372-393.
Löh, H. and Katzy, B. 2008. Project Management and Communication Patterns
in Innovation Projects. Retrieved October 28, 2010 from
http://www.cwe- projects.eu/pub/bscw.cgi/d1257575/Löh, Katzy - Project
205
Management and Communication Patterns in Innovation Projects -
RaDMa Conference 2008.pdf.
Lokshin, B.; Van Gils, A. and Bauer, E. 2009. Crafting Firm Competencies to
Improve Innovative Performance. European Management Journal. 27
(3): 187-196.
Lovelace, R.F. 1986. Stimulating Creativity through Managerial Intervention. R&D
Management. 16: 161-174.
Lundvall, B.-Å., ed. 1992. National Systems of Innovation: Towards a Theory of
Innovation and Interactive Learning. London: Pinter.
MacCallum, R.C. and Austin, J.T. 2000. Applications of Structural Equation
Modeling in Psychological Research. Annual Review of Psychology.
(51): 201-226.
MacCallum, R.C.; Browne, M.W. and Sugawara, H.M. 1996. Power Analysis and
Determination of Sample Size for Covariance Structure Modeling.
Psychological Methods. 1 (2): 130- 149.
McDowell, W.C. and Zhang, L. 2009. Mediating Effects of Potency on Team
Cohesiveness and Team Innovation. Journal of Organizational
Leadership and Business. (Summer): 1-11.
McLean, L.D. 2005. Organizational Culture’s Influence on Creativity and
Innovation: A Review of the Literature and Implications for Human
Resource Development. Advances in Developing Human Resources.
7 (May): 226-246.
Macmillan, I.C. and McCaffery, M.L. 1984. Strategy for Financial Services: Cashing
in on Competitive Inertia. Journal of Business Strategy. 4 (3): 58-65.
Madhavan, R. and Grover, R. 1998. From Embedded Knowledge to Embodied
Knowledge: New Product Development as Knowledge Management.
Journal of Marketing. 62: 1-12.
Mann, P.S. 1995. Introductory Statistics. 2nd ed. New Jersey: Wiley.
Mansfield, E. 1961. Technical Change and the Rate of Imitation. Econometrica.
29: 741-766.
Manz, C.C.; Bastien, D.T.; Hostager, T.J. and Shapiro, G.L. 1989. Leadership and
Innovation: A Longitudinal Process View. In Research on the
206
Management of Innovation: The Minnesota Studies. A.H. Van de Ven,
H. Angle, M.S. Poole, eds. New York: Harper and Row. Pp. 1-712.
March, J. G. 1991. Exploration and Exploitation in Organizational Learning.
Organization Science. 2: 71−87.
Martins, E.C. 2000. Die Invloed van Organisasiekultuur op Kreatiwiteit en
Innovasie in ‘n Universiteitsbiblioteek/The Influence of Organisational
Culture on Creativity and Innovation in a University Library.
Unpublished Master’s thesis, University of South Africa, Pretoria.
Martins, E. and Martins. N. 2002. An Organizational Culture Model to Promote
Creativity and Innovation. Journal of Industrial Psychology. 28 (4): 58-
65.
Martins, E.C. and Terblanche, F. 2003. Building Organizational Culture That
Stimulates Creativity and Innovation. European Journal of Innovation
Management. 6(1): 64-74.
Martins, N. 1989. Organisasiekultuur in ‘n Finansiële Instelling/Organisational
Culture in a Financial Institution. Doctoral dissertation, University of
South Africa, Pretoria.
Mathisen, G.E. and Einarsen, S. 2004. A Review of Instruments Assessing Creative
and Innovative Environments within Organizations. Creativity Research
Journal. 16: 119–140.
Maull, R. and Childe, S. 1994. Business Process Re-Engineering: An Example from
the Banking Sector. International Journal of Service Industry
Management. 5 (3): 26-34.
Merton, R. 1949. Social Theory and Social Structure. Toronto: Collier-Macmillan.
Michael, H. and Champy, J. 1994. Reengineering the Corporation: A Manifesto
for Business Revolution. New York: Harperbusiness.
Michela, J.L. and Burke, W.W. 2000. Organizational Culture and Climate in
Transformations for Quality and Innovation. Handbook of
Organisational Culture and Climate. N.M. Ashkanasy, C.P.P.
Wilderom and M.F. Peterson, eds. California: Sage. Pp. 225-244.
Miles, R.E. and Snow, C.C. 1978. Organizational Strategy, Structure and
Process. New York: McGraw-Hill.
207
Miles, R.E. and Snow, C.C. 1984. Fit, Failure, and the Hall of Fame. California
Management Review. 26: 10-28.
Miller, D. and Friesen, P.H. 1982. Innovation in Conservative and Entrepreneurial
Firms: Two Models of Strategic Momentum. Strategic Management
Journal. 3: 1–25.
Miller, D. and Shamsie, J. 1996. The Resource-Based View in Two Environments:
The Hollywood Film Studios from 1936 to 1965. Academy of
Management Journal. 39: 519-543.
Mintzberg, H. 1978. Patterns in Strategy Formation. Management Science. 24:
934–948.
Mintzberg, H. 1979. The Structuring of Organizations: a Synthesis of the
Research. Englewood Cliffs, N.J: Prentice-Hall.
Mintzberg, H. 2004. Managers not MBAs: A Hard Look at the Soft Practice of
Management and Management Development. San Francisco, CA:
Berrett-Koehler Publishers.
Mitchell, V.L. and Zmud, R.W. 1999. The Effects of Coupling IT and Work Process
Strategies in Redesign Projects. Organization Science. 10: 424-438.
Mitroff, I. 1987. Business Not As Usual: Rethinking Our Individual, Corporate
and Industrial Strategies for Global Competition. London: Jossey-
Bass.
Moch, M.K. and Morse, E.V. 1977. Size, Centralization and Organizational
Adoption of Innovations. American Sociological Review. 42: 716-725.
Mohammed-Salleh, A. and Easingwood, C. 1993. Why European Financial
Institutions do not Test-Market New Consumer Products. International
Journal of Bank Marketing. 11 (3): 23-27.
Morgan, R.E.; Cronin, E. and Severn, M. 1995. Innovation in Banking: New
Structures and Systems. Long Range Planning. 28 (3): 91-100.
Morone, J. and Berg, D. 1993. Management of Technology in the Service Sector:
Practices in the Banking Industry. The Journal of High Technology
Management Research. 4 (1): 123-137.
208
Mostafa, M. 2005. Factors Affecting Organizational Creativity and Innovativeness in
Egyptian Business Organizations: An Empirical Investigation. Journal of
Management Development. 24 (1): 7-33.
Mphahlele, I. 2006. Developing an Innovation Strategy Scorecard. Master’s
thesis, University of Pretoria.
Mullen, B. and Copper, C. 1994. The Relation between Group Cohesiveness and
Performance: An Integration. Psychological Bulletin. 115 (3): 210-227.
Nelson, R.R. 1991. Why Do Firms Differ, and How does it Matter? Strategic
Management Journal. 12(Winter Special Issue): 61-74.
Nelson, R.R. and Winter, S.G. 1977. In Search of a Useful Theory of Innovation.
Research Policy. 6(1): 36-76.
Nelson, R.R. and Winter, S.G. 1982. An Evolutionary Theory of Economic
Change. Cambridge, MA: Harvard University Press.
Nermien, Al-Ali. 2003. Comprehensive Intellectual Capital Management: Step-
by-Step. New York: Wiley.
Newman, W. 1972. Cultural Assumptions Underlying U.S. Management Concepts.
Management in International Context. J.L. Massie and J. Luytzes, eds.
New York: Harper and Row.
Nicholson, N. and West, M.A. 1988. Managerial Job Change: Men and Women
in Transition. Cambridge: Cambridge University Press.
Nilakanta, S. and Scamell, R.W. 1990. The Effect of Information Sources and
Communication Channels on the Diffusion of Innovation in a Data Base
Development Environment. Management Science. 36 (1): 24-40.
Nonaka, I. 1991. The Knowledge Creating Company. Harvard Business Review.
69: 96-104.
Nonaka, I. 1994. A Dynamic Theory of Organizational Knowledge Creation.
Organization Science. 5: 14-37.
Nystrom, H. 1979. Creativity and Innovation. New York: Wiley.
Nÿstrom, H. 1990. Organizational Innovation. In Innovation and Creativity at
Work: Psychological and Organizational Strategies. M.A. West and
J.L. Farr, eds. Chichester: Wiley. Pp. 143-161.
209
O’Brien, J.P. 2003. The Capital Structure Implications of Pursuing a Strategy of
Innovation. Strategic Management Journal. 24: 415–431.
O’Reilly, C. 1989. Corporations Culture and Commitment: Motivation and Social
Control in Organizations. California Management Review.
31(Summer): 9-25.
O’Reilly, C.A. and Tushman, M.L. 1997. Using Culture for Strategic Advantage:
Promoting Innovation through Social Control. In Managing Strategic
Innovation and Change: A Collection of Readings. M.L. Tushman and
P. Anderson, eds. New York: Oxford University Press. Pp. 200–216.
O’Rilley III, C.A. and Tushman, M.L. 2004. The Ambidextrous Organization.
Harvard Business Review. (April): 74-81.
O’Toole, L. J. and Meier, K. J. 2003. Bureaucracy and Uncertainty. In Uncertainty
in American Politics. B. C. Burden, ed. Cambridge, U.K.: Cambridge
University Press. Pp. 98–117.
Oldham, G. R. and Cummings, A. 1996. Employee Creativity: Personal and
Contextual Factors at Work. Academy of Management Journal. 39 (3):
607-655.
Omta, S.W.F. and Folstar, P. 2005. Integration of Innovation in the Corporate
Strategy of Agri-food Companies, Innovation in Agri-Food Systems.
Wageningen: Wageningen Academic Publishers. Pp. 223-246.
Ozanne, U.B. and Churchill, G.A. 1971. Five Dimensions of the Industrial Adoption
Process. Journal of Marketing Research. 8: 322-328.
Pahl, G.; Beitz, W. and Feldhusen, J. 2004. Konstruktionslehre. Berlin: Springer.
Parthasarthy, R. and Hammond, J. 2002. Product Innovation Input and Outcome:
Moderating Effects of the Innovation Process. Journal of Engineering
and Technology Management. 19: 75–91.
Payne, Y. 1990. The Effectiveness of Research Teams: A Review. In Innovation
and Creativity at Work. M.A. West and J.L. Farr, eds. Chichester:
Wiley.
Pearl, J. 2000. Causality: Models, Reasoning, and Inference. Cambridge:
Cambridge University Press.
210
Pelz, D.C. and Andrews, F.M. 1976. Productive Climates for Research and
Development. Ann Arbor, MI: Institute for Social Research, University
of Michigan.
Penrose, E.T. 1959. The Theory of the Growth of the Firm. New York: Oxford
University Press.
Perrow, C. 1986. Complex Organizations: A Critical Essay. 3rd ed. New York:
Random House.
Peteraf, M. 1993. The Cornerstones of Competitive Advantage: A Resource-Based
View. Strategic Management Journal. 14(3): 179-191.
Pfeffer, J. 1998. The Human Equation. Boston, MA: Harvard Business School
Press.
Pfeffer, J. and Salancik, G. R. 1978. The External Control of Organizations: A
Resource Dependence Perspective. New York: Harper and Row.
Philip, R.L. 2009. Innovation and Financial Globalisation. Paper provided by
IIISdp 299.
Pienaar, H. 1994. Die Kreatiewe en Innoverende Universiteitsbiblioteek/The
Creative and Innovation University Library. DPhil-thesis, University
of Pretoria.
Pinchot, E. and Pinchot, G. 1996. Five Drivers for Innovation. Executive
Excellence. 13(1): 9-10.
Pinto, J.K. and Prescott, J.E. 1988. Changes in Critical Success Factors over the
Stages in the Project Life Cycle. Journal of Management. 14: 5–18.
Pinto, M.B. and Pinto, J.K. 1990. Project Team Communication and Cross-
Functional Cooperation in New Program Development. Journal Product
Innovation Management. 7 (6): 200-212.
Porntida Visaetsilapanonta. 2006. Factors Affecting the Team Innovation of
Research and Development Projects in Thailand. Doctoral dissertation,
Mahidol University.
Prahalad, C.K. 2004. The Fortune at the Bottom of the Pyramid: Eradicating
Poverty through Profits. Upper Saddle River, NJ: Pearson Prentice Hall.
Prahalad, C.K. and Hamel, G. 1990. The Core Competence of the Corporation.
Harvard Business Review. 68: 79-91.
211
Prescott, M. and Conger, S. 1995. Diffusion of Innovation Theory: Borrowing,
Extensions and Modifications from IT Researchers. Retrieved
November 10, 2010 from DATABASE for Advances in Information
Systems.
Project Management Institute. 2004. A Guide to the Project Management Body of
Knowledge (PMBOK guide). 3rd ed. Newtown Square, PA: Project
Management Institute.
Puccio, G.; Murdoch, M. and Mance, M. 2007. Creative Leadership – Skills that
Drive Change. Thousand Oaks, CA: Sage.
Pugh, D.S.; Hickson, D.J.; Hinings, C.R. and Turner, C. 1969. The Context of
Organization Structures. Administrative Science Quarterly. 14: 91–
114.
Pugh, D. S.; Hickson, D. J.; Hinings, C. R.; MacDonald, K. M.; Turner, C. and
Lupton, T. 1963. A Conceptual Scheme for Organizational Analysis.
Administrative Science Quarterly. 8: 289–315.
Rackoff, N.; Wiseman, C. and Ullrich, W.A. 1985. Information Systems for
Competitive Advantage: Implementation of a Planning Process. MIS
Quarterly. 9(4): 112-124.
Ramanujam, V. and Mensch, G.O. 1985. Improving the Strategy–Innovation Link.
Journal of Product Innovation Management. 2: 213–223.
Read, W.H. 1996. Managing the Knowledge-Based Organization: Five Principles
Every Manager Can Use. Technology Analysis and Strategic
Management. 8(3): 223-232.
Reidenbach, R.E. and Moak, D.L. 1986. Exploring Retail Bank Performance and
New Product Development: A Profile of Industry Practices. Journal of
Product Innovation Management. 3: 187-194.
Richard, O.; McMillan, A.; Chadwick, K. and Dwyer, S. 2003. Employing an
Innovation Strategy in Racially Diverse Workforces – Effects on Firm
Performance. Group and Organization Management. 28: 107–126.
Roach, I. and Sager, C. 2000. Enabling Innovation: Leadership, Tasks and Tools.
Annual Quality Congress. 54(May): 289-293.
Robertson, T.S. and Gatignon, H. 1986. Competitive Effects on Technology
Diffusion. Journal of Marketing. 50: 1-12.
212
Roehrich, G. 2002. Consumer Innovativeness: Concepts and Measurements.
Journal of Business Research. 57: 671-677.
Rogers, E.M. 1983. Diffusion of Innovations. New York: Free Press.
Rogers, E.M. 1995. Diffusion of Innovations. 4th ed. New York: Free Press.
Rothrock, L.; Cohen, A.; Yin, J.; Thiruvengada, H. and Nahum-Shani, I. 2009.
Analysis of Team Performance in a Dynamic Task Environment. Applied
Ergonomics. 40: 699-706.
Rothwell, R. 1992. Successful Industrial Innovation: Critical Factors for the 1990s.
R&D Management. 22: 221–239.
Rothwell, R. 1994. Towards the Fifth-Generation Process. International Marketing
Review. 11(1): 7-31.
Rumelt, R.P. 1987. Theory, Strategy, and Entrepreneurship. In The Competitive
Challenge - Strategies for Industrial Innovation and Renewal. D.J.
Teece, ed. Cambridge Mass: Ballinger. Pp. 137-158.
Russel, R.D. 1999. Developing a Process Model of Entrepreneurial Systems: A
Cognitive Mapping Approach. Entrepreneurship: Theory and Practice.
23(3): 65-84.
Russel, R.D. and Russel, C.J. 1992. An Examination of the Effects of Organizational
Norms, Organizational Structure, and Environmental Uncertainly on
Entrepreneurial Strategy. Journal of Management. 18 (4): 639-657.
Sabherwal, R. and Becerra, F. 2003. An Empirical Study of the Effect of Knowledge
Management Processes at Individual, Group and Organizational Levels.
Decision Science. 34 (2): 225-260.
Saleh, S.D. and Wang, C.K. 1993. The Management of Innovation – Strategy,
Structure, and Organizational Climate. IEEE Transactions on
Engineering Management. 40: 14–21.
Savvides, S.C. Organisational Structure and Innovation. Retrieved October 27,
2010 from http://www.riskease.com/downloads/OSI.doc.
Sawang, S. and Unsworth, K. 2006. An Empirical Study: The Role of Financial
and Nonfinancial Performance Measurement and Perceived
Innovation Effectiveness. Paper Presented at the 2006 IEEE International
Conference on Management of Innovation and Technology, Singapore.
213
Scarbrough, H. and Carter, C. 2000. Investigating Knowledge Management,
Research, Report. London: Institute of Personnel and Development.
Scarbrough, H. and Lannon, R. 1988a. The Management of Innovation in the
Financial Services Sector: A Case Study. Journal of Marketing
Management. 5 (1): 51-62.
Scarbrough, H. and Lannon, R. 1988b. The Successful Exploitation of New
Technology in Banking. Journal of General Management. 13 (3):
38-51.
Schillewaert, N.; Ahearne, M.; Frambach, R. and Moenaert, R.K. 2005. The
Adoption of Information Technology in the Sales Force. Industrial
Marketing Management. 34 (4): 323-336.
Scholten, V.F. 2006. The Early Growth of Academic Spin-offs. Doctoral
dissertation, Wageningen University.
Schuler, R. S. and Jackson, S. E. 1987. Linking Competitive Strategies with Human
Resource Management Practices. Academy of Management Executive.
1(3): 207-220.
Schumacker, R.E. 1992. Goodness of Fit Criteria in Structural Equation Models.
Conference of the Annual Meeting of the American Educational Research
Association, San Francisco, April 20-24.
Schumpeter, J.A. 1934. Theory of Economic Development. Cambridge, Mass:
Harvard University Press.
Schuster, F.E. 1986. The Proven Connection between People and Profits. New
York: Wiley.
Senge, P.; Kleiner, A.; Roberts, C.; Ross, R.; Roth, G. and Smith, B. 1999. The
Dance of Change: The Challenges of Sustaining Momentum in
Learning Organizations. London: Nicholas Brealy.
Sethi, R; Smith, D.C. and Park, C.W. 2001. Cross-Functional Product Development
Teams, Creativity, and the Innovativeness of New Consumer Products.
Journal of Marketing Research. 38: 73-85.
SeyBold , P.B. 2006. Outside Innovation. New York: HarperCollins.
Shalley, C.E. et al. 2004. The Effects of Personal and Contextual Characteristics on
Creativity: Where Should We Go from Here. Journal of Management.
30(6): 933-958.
214
Shamir, B.; House, R. J. and Arthur, M. B. 1993. The Motivational Effects of
Charismatic Leadership: A Self-Concept Based Theory. Organization
Science. 4: 577−594.
Shane, S. 2003. A General Theory of Entrepreneurship: The Individual
Opportunity Nexus. Northampton, MA: Edward Elgar.
Shane, S.; Venkataraman, S. and MacMillan, I. 1995. Cultural Differences in
Innovation Championing Strategies. Journal of Management. 21: 931–
952.
Sharma, S.; Durvasula, S. and Dillon, W. R. 1989. Some Results on the Behavior of
Alternate Covariance Structure Estimation Procedures in the Presence of
Non-Normal Data. Journal of Marketing Research. 26 (2): 214-221.
Shaughnessy, T.W. 1988. Organizational Culture in Libraries: Some Management
Perspectives. Journal of Library Administration. 9 (3): 5-10.
Shelton, R. and Davila, T. 2005. The Seven Rules of Innovation. Optimize. 4(8): 51-
54.
Shepard, H.A. 1967. Innovation-Resisting and Innovation Producing Organizations.
Journal of Business. 40: 470–477.
Shin, J. and McClomb, G.E. 1998. Top Executive Leadership and Organizational
Innovation: An Empirical Investigation of Nonprofit Human Service
Organizations (HSOS). Administration in Social Work. 22: 1–21.
Shipton, H.; Fay, D.; West, M.A.; Patterson, M. and Birdi, K. 2005. Managing
People to Promote Innovation. Creativity and Innovation Management.
14 (2): 118-128.
Shipton, H.; West, M. A.; Dawson, J.; Birdi, K. and Malcolm, P. 2006. HRM as a
Predictor of Innovation. Human Resource Management Journal. 16(1):
3-27.
Shuen, A. 1994. Technology Sourcing and Learning Strategies in the
Semiconductor Industry. Doctoral dissertation, University of California,
Berkeley.
Simon, H.A. 1953. Causal Ordering and Identifiability. In Studies in Econometric
Method. W.C. Hood and T.C. Koopmans, eds. New York: Wiley.
Pp. 49–74.
215
Sin, L.Y.M.; Tse, A.C.B. and Yim, F.H.K. 2005. CRM: Conceptualization and Scale
Development. European Journal of Marketing. 39 (11/12): 1264-1290.
Sine, W.D. and David, R. 2003. Environmental Jolts, Institutional Change, and the
Creation of Entrepreneurial Opportunity in the U.S. Electric Power
Industry. Research Policy. 32: 185–207.
Sine, W.D.; Mitsuhashi, H. and Kirsch, D.A. 2006. Revisiting Burns and Stalker:
Formal Structure and New Venture Performance in Emerging Economic
Sectors. Academy of Management Journal. 49 (1): 121–132.
Singh, J. 1993. Boundary Role Ambiguity: Facets, Determinants, and Impacts.
Journal of Marketing. 57 (April): 11–31.
Smith, M.J. 1984. Contingency Rules Theory, Context, and Compliance Behaviors.
Human Communication Research. 10 (Summer): 489-512.
Snell, S.A.; Youndt, M.A. and Wright, P.M. 1996. Establishing a Framework for
Research in Strategic Human Resource Management: Merging Resource-
Based Theory and Organizational Learning. In Research in Personnel
and Human Resource Management. Vol. 14. G.R. Ferris and K.M.
Rowland, eds. Greenwich, CT: JAI Press. Pp. 61-90.
Song, X.M. and Parry, M.E. 1997. The Determinants of Japanese New Product
Success. Journal of Marketing Research. 34: 64-76.
Soosay, C.A. 2005. An Empirical Study of Individual Competencies in Distribution
Centres to Enable Continuous Innovation. Creativity and Innovation
Management. 14(3): 299-310.
Sosik, J. L.; Avolio, B. J. and Kahai, S. S. 1997. Effects of Leadership Style and
Anonymity on Group Potency and Effectiveness in a Group Decision
Support System Environment. Journal of Applied Psychology. 82:
89−103.
Souitaris, V. 2002. Firm-Specific Competencies Determining Technological
Innovation: A Survey in Greece. R&D Management. 32: 61–77.
Spender, J.C. 1989. Industry Recipes: The Nature and Sources of Managerial
Judgment. Oxford: Blackwell.
Stankiewicsz, R. 1979. The Effectiveness of Research Groups in Six Countries. In
Scientific Productivity. F.M. Andrews, ed. Cambridge: Cambridge
University Press. Pp. 121-154.
216
StatSoft, Inc. 2010. Electronic Statistics Textbook. Retrieved November 8, 2010
from http://www.statsoft.com/textbook/.
Stinchcombe, A. 1965. Social Structure and Organizations. In Handbook of
Organizations. J. March, ed. Chicago: Rand McNally. Pp. 142-193.
Stokholm, M. 2005. Design Compass. Improving Interdisciplinary Communication
on Design. In Design Matters: Design to Improve Life. A.M.
Gregersen, S. Amland and U. Hovgaard Ramlau, eds. Copenhagen: Danish
Design Centre. Pp. 54-57.
Storey, C. and Easingwood, C. 1993. The Impact of the New Product Development
Project on the Success of Financial Services. The Service Industries
Journal. 13 (3): 40-54.
Subramanian, A. and Nilakanta, S. 1996. Organizational Innovativeness: Exploring
the Relationship Between Organizational Determinants of Innovation,
Types of Innovations, and Measures of Organizational Performance.
Omega. 24: 631-647.
Sundbo, J. 1997. Management of Innovation in Services. Service Industries
Journal. 17: 432–455.
Szakonyi, R. 1994. Measuring R&D Effectiveness I. Research-Technology
Management. 37: 27–32.
Taggar, S. 2002. Individual Creativity and Team Ability to Utilize Individual
Creative Resources: A Multilevel Model. Academy of Management
Journal. 17: 432-455.
Teece, D.J. and Pisano, G. 1994. The Dynamic Capabilities of Firms: An
Introduction. Industrial and Corporate Change. 3: 537-556.
Teece, D.J.; Pisano, G. and Scheun, A. 1997. Dynamic Capabilities and Strategic
Management. Strategic Management Journal. 18 (7): 509-533.
Terziovski, M. and Samson, D. 1999. The Link between Total Quality Management
Practice and Organisational Performance. The International Journal of
Quality and Reliability Management. 16 (3): 226.
Tesluk, P.E. and Mathieu, J. E. 1999. Overcoming Roadblocks to Effectiveness:
Incorporating Management of Performance Barriers into Models of Work
Team Effectiveness. Journal of Applied Psychology. 84: 200-217.
217
Tesluk, P.E.; Faar, J.L. and Klein, S.R. 1997. Influences of Organizational Culture
and Climate on Individual Creativity. The Journal of Creative Behavior.
31 (1): 21-41.
Themistocleous, G. and Wearne, S.H. 2000. Project Management Topic Coverage in
Journals. International Journal of Project Management. 31 (2): 7-11.
Thomson, J.D. 1967. Organizations in Action: Social Science Bases of
Administrative Theory. New York: McGraw-Hill.
Tidd, J.; Bessant, J. and Pavitt, K. 1997. Managing Innovation: Integrating
Technological, Market and Organizational Change. Chichester: Wiley.
Tierney, P. and Farmer, S.M. 2002. Creative Self-Efficacy: Its Potential Antecedents
and Relationship to Creative Performance. Academy of Management
Journal. 45: 1137-1148.
Tipping, J. and Zeffren, E. 1995. Assessing the Value of Your Technology.
Research–Technology Management. 38: 22–40.
Townsend, J.D.; Yeniyurt, S.; Deligonul, Z.S. and Cavusgil, S.T. 2004. Exploring
the Marketing Program Antecedents of Performance in a Global Company.
Journal of International Marketing. 12 (4): 1–24.
Treadwell, T. et al. 2001. The Group Cohesion Scale-Revised: Reliability and
Validity. Action Method. 3(1): 3-11.
Turner, J.C.; Hogg, M.A.; Turner, P.J. and Smith, P.M. 1984. Failure and Defeat as
Determinants of Team Cohesiveness. British Journal of Social
Psychology. 23: 97-111.
Tushman, M.L. and O’Reilly III, C.A. 1997. Winning through Innovation: A
Practical Guide to Leading Organizational Change and Renewal.
Boston, MA: Harvard Business School Press.
Ulrich, K. T. and Eppinger, S. D. 2003. Product Design and Development. 3rd
International Edition. New York: McGraw -Hill.
Umanath, N. and Kim, K. 1992. Task-Structure Relationship of an Information
Systems Development Subunit: A Consequence Perspective. Decision
Sciences. 23: 819–838.
Van de Ven, A. and Delbecq, A. 1974. A Task Contingent Model of Work-Unit
Structure. Administrative Science Quarterly. 19: 183-197.
218
Van de Ven, A.H. 1986. Central Problems in the Management of Innovation.
Management Science. 32: 590-607.
Van Gundy, A.B. 2005. The Care and Framing of Strategic Innovation
Challenges. Retrieved October 10, 2000 from http://www.jpb.com/
creative/ VanGundyFrameInnov.pdf.
Van Looy, B.; Martens, T. and Debackere, K. 2005. Organizing for Continuous
Innovation: On the Sustainability of Ambidextrous Organizations.
Creativity and Innovation Management. 14 (3): 208-220.
Vanhaverbeke, W.; Cloodt, M. and Van de Vrande, V. 2008. Connecting Absorptive
Capacity and Open Innovation. In Proceedings of the 20th ISPIM
Conference. K.R.E. Huizingh, S. Conn, M. Torkkeli and I. Bitran, eds.
Held in Vienna, Austria, 21-24 June 2009.
Vera, D. and Crossan, M. 2004. Strategic Leadership and Organizational Learning.
Academy of Management Review. 29: 222−240.
Verdú Jover, A.J.; Lloréns Montes, J.F. and García Morales, V.J. 2005. Flexibility,
Fit and Innovative Capacity: An Empirical Examination. International
Journal of Technology Management. 30 (1-2): 131-146.
Verhaeghe, A. and Kfir, R. 2002. Managing Innovation in a Knowledge Intensive
Technology Organisation (KITO). R & D Management. 32 (5): 409-417.
Verona G. 1999. A Resource-Based View of Product Development. Academy of
Management Review. 24: 132-142.
Veryzer, R.W. 1998. Discontinuous Innovation and the New Product Development
Process. Journal of Product Innovation Management. 15: 304–321.
Vianen, A.E.M. and De Dreu, C.K.W. 2001. Personality in Teams: Its Relationship
to Social Cohesion, Task Cohesion and Team Performance. European
Journal of Work and Organizational Psychology. 10 (2): 97-120.
Vlok, A. 2005. Innovation: How Management Can Improve throughput by
Understanding the Flow. Management Today. (September): 15-17.
Volberda, H.W. 1992. Organizational Flexibility Change and Preservation.
Doctoral dissertation, University of Groningen, Groningen, The
Netherlands.
Volberda, H.W. 1996. Towards the Flexible Form: How to Remain Vital in
Hypercompetitive Environments. Organizational Science. 7: 359–374.
219
Von Hippel, E. 1988. The Sources of Innovation. Oxford: Oxford University
Press.
Voss, C.; Chase, R. and Roth, A. 1999. International Service Study. Decision Line.
(May): 4–7.
Vroom, V.H. 1964. Work and Motivation. New York: Wiley.
Vroom, V.H. and Jago, A.G. 1988. The New Leadership: Managing Participation
in Organizations. Englewood Cliffs, NJ: Prentice Hall.
Vyakarnam, S. and Adams, R.J. 2001. Institutional Barriers to Enterprise Support:
an Empirical Study. Environment and Planning C: Government and
Policy. 19: 335–353.
Waldman, D.A., and Yammarino, F.J. 1999. CEO Charismatic Leadership: Levels-
of-Management and Levels-of-Analysis Effects. Academy of
Management Review. 24: 266−285.
Waldman, D.A.; Ramirez, G.G.; House, R.J. and Puranam, P. 2001. Does
Leadership Matter? CEO Leadership Attributes and Profitability under
Conditions of Perceived Environmental Uncertainty. Academy of
Management Journal. 44: 134−143.
Wallmark, J.T. 1973. The Increase in Efficiency with the Size of Research Teams.
Transaction on Engineering Management. 3: 80-86.
Wally, S. and Baum, J. R. 1994. Personal and Structural Determinants of the Pace of
Strategic Decision Making. Academy of Management Journal. 37:
932–956.
Weber, M. 1947. The Theory of Social and Economic Organization. Tr. by A. M.
Henderson and T. Parsons. New York: Oxford.
Weick, K. E. and Roberts, K. H. 1993. Collective Mind in Organizations: Heedful
Interrelating on Flight Decks. Administrative Science Quarterly. 38:
357-381.
Wernerfelt, B. 1984. A Resource-Based View of the Firm. Strategic Management
Journal. 5: 171-180.
West, J. 2001. The Mystery of Innovation: Aligning the Triangle of Technology,
Institutions and Organization. Australian Journal of Management. 26:
21-43.
220
West, M.A. 1990. The Social Psychology of Innovation in Groups. In Innovation
and Creativity at Work: Psychological and Organizational Strategies.
M.A. West and J.L. Farr, eds. Chichester: Wiley. Pp. 309–333.
West, M.A. and Anderson, N.R. 1996. Innovation in Top Management Teams.
Journal of Applied Psychology. 81: 680–693.
West, M.A. and Farr, J.L. (Eds) 1990. Innovation and Creativity at Work:
Psychological and Organizational Strategies. Chichester: Wiley.
West, M.A. and Wallace, M. 1988. Innovation in Primary Health Care Teams: The
Effects of Roles and Climates. Bulletin of the British Psychological
Society. Abstracts: 23.
West, M.A. and Wallace, M. 1991. Innovation in Health Care Teams. European
Journal of Social Psychology. 21(5): 303-315.
Wheelwright, S. and Clark, K. 1992. Revolutionizing Product Development,
Quantum Leaps in Speed, Efficiency, and Quality. New York: Free
Press.
White, A. 2002. Enabling Factors in the Front End of the Innovation Process. In
Proceedings, 9th International Product Development Management
Conference Sophia Antipolis. Brussels: European Institute for Advanced
Studies in Management. Pp. 879–887.
Wiio, O.A. 1979. Contingencies of Organizational Communication. Helsinki:
The Helsinki School of Economics. B-30.
Wilson, J.Q. 1963. Innovation in Organisation: Notes towards a theory. In
Approaches to Organisational Design. Pennsylvania: University of
Pittsburgh Press.
Wolfe, R.A. 1994. Organizational Innovation: Review, Critique and Suggested
Research Directions. Journal of Management Studies. 31: 405–431.
Woodman, R.W.; Sawyer, J. E. and Griffin, R.W. 1993. Toward a Theory of
Organizational Creativity. Academy of Management Review. 18: 293-
321.
Woodward, J. 1965. Industrial Organization: Theory and Practice. Oxford:
Oxford University Press.
221
Woudstra, E. and Van Gemert, L. 1994. Planning van de interme communicatie: een
kadar. Handbook Interme Communicatie. (C5.2.3-C5.2.28) J Jaspers
e.a., eds. Houten: Bohn Stafleu Van Loghum.
Wright, P.; Dunford, B. and Snell, S. 2001. Human Resources and the Resource
Based View of the Firm. Journal of Management. 27: 701-721.
Wright, S.S. 1921. Correlation and Causation. Journal of Agricultural Research.
20: 557–585.
Xu, S.; Cavusgil, S. T. and White, J. C. 2006. The Impact of Strategic Fit Among
Strategy, Structure, and Processes on Multinational Corporation
Performance: A Multimethod Assessment. Journal of International
Marketing. 14(2): 1–31.
Yamane, T. 1967. Elementary Sampling Theory. Englewood Cliff, NJ: Prentice-
Hall.
Zaltman, G.; Duncan, R. and Holbek, J. 1973. Innovations and Organizations.
New York: Wiley.
Zou, S. and Cavusgil, S. T. 2002. The GMS: A Broad Conceptualization of Global
Marketing Strategy and Its Effect on Firm Performance. Journal of
Marketing. 66: 40–56.

APPENDICES

APPENDIX A
COVER LETTER

ที่ ศธ 0526.02/ คณะรัฐประศาสนศาสตร สถาบันบัณฑิตพัฒนบริหารศาสตร
คลองจั่น บางกะป กทม. 10240
วันที่ 30 ตุลาคม 2553
เรื่อง ขอความอนุเคราะหขอมูล เรียน
ดวย นายภาณุ ลิมมานนท นักศึกษาระดับปริญญาเอก หลักสูตรปรัชญาดุษฎีบัณฑิต (การบริหารการพัฒนา) หลักสูตรนานาชาติ คณะรัฐประศาสนศาสตร สถาบันบัณฑิตพัฒน บริหารศาสตร กําลังอยูระหวางการจัดทําวิทยานิพนธ เรื่อง ปจจัยที่มีผลกระทบตอประสิทธิภาพของการจัดการนวัตกรรมขององคกรในกลุมธนาคารภาครัฐและเอกชน (The Determinants of Organizational Innovation Management Effectiveness in Thai Banking Industry) โดยมี รองศาสตราจรย ดร. จินดาลักษณ วัฒนสินธุ เปนที่ปรึกษาวิทยานิพนธหลัก ในการทํางานวิจัยเฉพาะกรณีครั้งน้ี ผลการวิจัยจะกอใหเกิดประโยชนทางดานวิชาการเพ่ือใชประกอบการศึกษาเก่ียวกับการบริหารการพัฒนา นวัตกรรมขององคกรอยางมีประสิทธิภาพโดยพิจารณาวามีปจจัยที่สําคัญใดบางที่ชวยสงเสริมศักยภาพขององคกรและขีดสมรรถนะของบุคลากรในเชิงสรางสรรคอันมีผลตอการเพ่ิมประสิทธิภาพและประสิทธิผลในที่สุด หากหนวยงานของทานตองการติดตอกับนักศึกษา ขอความกรุณาติดตอโดยตรงที่หมายเลขโทรศัพท 081-614-9363 หรือผูประสานงานในการเก็บขอมูล นางสาว วราภรณ สีระคุณ หมายเลขโทรศัพท 086-344-2697 คณะรัฐประศาสนศาสตร หวังเปนอยางยิ่งวาจะไดรับความอนุเคราะหจากทานเปนอยางดี จึงขอขอบคุณมา ณ โอกาสน้ี ขอแสดงความนับถือ
รองศาสตราจารย ทิพวรรณ หลอสุวรรณรัตน
คณบดีคณะรัฐประศาสนศาสตร หลักสูตรปริญญาเอก โทรศัพท/โทรสาร 02 374 4977

APPENDIX B
SURVEY QUESTIONNAIRE
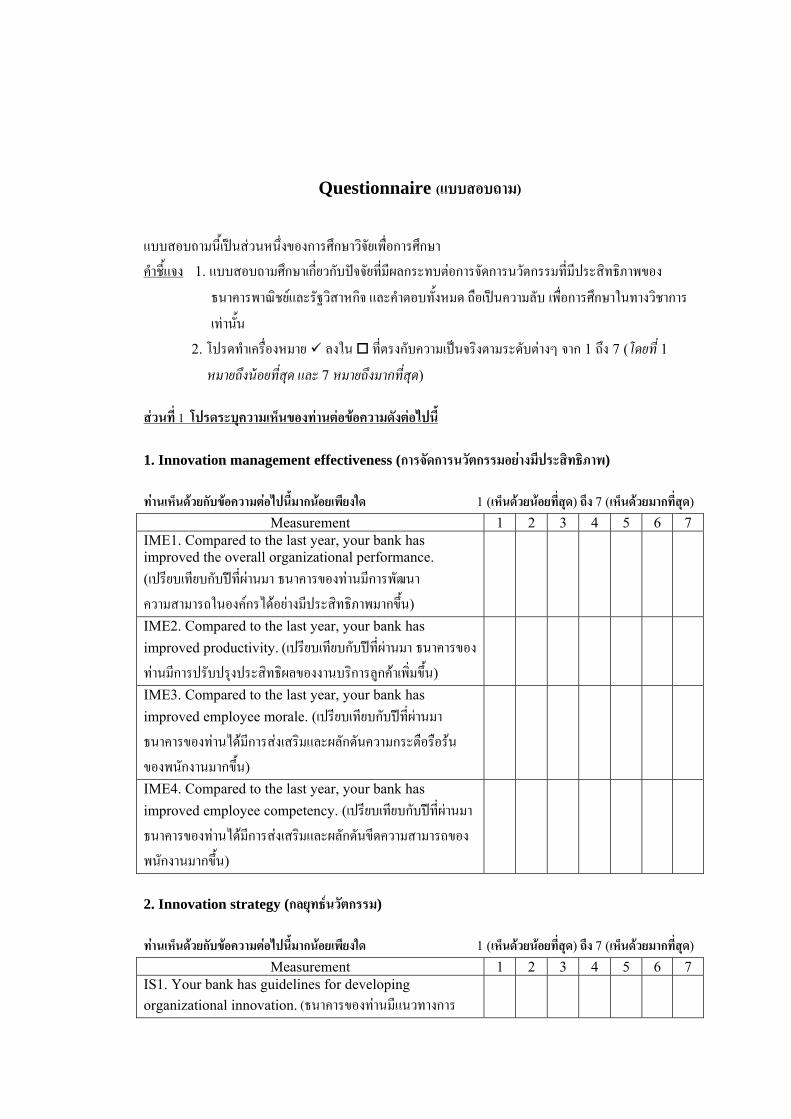
Questionnaire (แบบสอบถาม)
แบบสอบถามน้ีเป นส วนหน่ึงของการศึกษาวิจัยเพ่ือการศึกษา คําช้ีแจง 1. แบบสอบถามศึกษาเก่ียวกับปจจัยที่มีผลกระทบตอการจัดการนวัตกรรมที่มีประสิทธิภาพของ
ธนาคารพาณิชยและรัฐวิสาหกิจ และคําตอบทั้งหมด ถือเป นความลับ เพ่ือการศึกษาในทางวิชาการ
เท าน้ัน
2. โปรดทําเคร่ืองหมาย ลงใน ที่ตรงกับความเปนจริงตามระดับตางๆ จาก 1 ถึง 7 (โดยที ่1
หมายถึงน อยที่สุด และ 7 หมายถึงมากที่สุด) ส วนท่ี 1 โปรดระบุความเห็นของท านต อขอความดังต อไปน้ี 1. Innovation management effectiveness (การจัดการนวัตกรรมอยางมีประสิทธิภาพ) ทานเห็นดวยกับขอความตอไปนี้มากนอยเพียงใด 1 (เห็นดวยนอยที่สุด) ถึง 7 (เห็นดวยมากที่สุด)
Measurement 1 2 3 4 5 6 7 IME1. Compared to the last year, your bank has improved the overall organizational performance. (เปรียบเทียบกับป ที่ผานมา ธนาคารของทานมีการพัฒนาความสามารถในองคกรไดอยางมีประสิทธิภาพมากขึ้น)
IME2. Compared to the last year, your bank has improved productivity. (เปรียบเทียบกับป ที่ผานมา ธนาคารของทานมีการปรับปรุงประสิทธิผลของงานบริการลูกคาเพ่ิมขึ้น)
IME3. Compared to the last year, your bank has improved employee morale. (เปรียบเทียบกับป ที่ผ านมา ธนาคารของทานไดมีการสงเสริมและผลักดันความกระตือรือรนของพนักงานมากขึ้น)
IME4. Compared to the last year, your bank has improved employee competency. (เปรียบเทียบกับป ที่ผ านมา ธนาคารของทานไดมีการสงเสริมและผลักดันขีดความสามารถของพนักงานมากขึ้น)
2. Innovation strategy (กลยุทธนวัตกรรม) ทานเห็นดวยกับขอความตอไปนี้มากนอยเพียงใด 1 (เห็นดวยนอยที่สุด) ถึง 7 (เห็นดวยมากที่สุด)
Measurement 1 2 3 4 5 6 7 IS1. Your bank has guidelines for developing organizational innovation. (ธนาคารของทานมีแนวทางการ
227
พัฒนาการจัดการนวัตกรรมในองคกร) Measurement 1 2 3 4 5 6 7
IS2. Your bank has promoted innovation. (ธนาคารของทานไดมีการสงเสริมการจัดการนวัตกรรม)
IS3. Your bank plans to set up innovation goals. (ธนาคารของทานไดมีการวางแผนที่จะกําหนดเปาหมายการจัดการนวัตกรรม)
3. Forming organization structure to innovation management effectiveness (มีการจัดการโครงสรางขององคกรท่ีมีผลตอการจัดการนวัตกรรมอยางมีประสิทธิภาพ) ทานเห็นดวยกับขอความตอไปนี้มากนอยเพียงใด 1 (เห็นดวยนอยที่สุด) ถึง 7 (เห็นดวยมากที่สุด)
Measurement 1 2 3 4 5 6 7 OS1. Your bank has specific rules for managing innovation. (ธนาคารของทานไดมีการกําหนดกฎเกณฑในการจัดการนวัตกรรมโดยเฉพาะ)
OS2. Your bank has specific procedures for managing innovation. (ธนาคารของทานไดมีการกําหนดขั้นตอนในการจัดการนวัตกรรมโดยเฉพาะ)
OS3. Your bank has established a new division of functional differentiation. (ธนาคารของทานไดมีการจัดแบงหนวยงานใหมตามลักษณะความแตกตางของฟงกช่ัน)
OS4. Your bank has established a new division of functional specialization. (ธนาคารของทานไดมีการจัดแบงหนวยงานใหมตามลักษณะความเช่ียวชาญของฟงกช่ัน)
OS5. Your bank has established a new division of functional integration. (ธนาคารของทานไดมีการจัดแบงหนวยงานใหมตามลักษณะการบูรณาการของฟงกช่ัน)
4. Organization culture to innovation management effectiveness (วัฒนกรรมขององคกรท่ีมีผลตอการบริหารนวัตกรรมท่ีมีประสิทธิภาพ) ทานเห็นดวยกับขอความตอไปนี้มากนอยเพียงใด 1 (เห็นดวยนอยที่สุด) ถึง 7 (เห็นดวยมากที่สุด)
Measurement 1 2 3 4 5 6 7 OC1. Your bank has promoted cultural norms of innovation behavior. (ธนาคารของทานมีการสนับสนุนสงเสริมพนักงานที่มีพฤติกรรมในเชิงนวัตกรรม)
Measurement 1 2 3 4 5 6 7 OC2. Your bank has supported continuous learning.
228
(ธนาคารของทานสนับสนุนใหมีการเรียนรูสิ่งใหมๆเสมอ) OC3. Your bank has supported reward. (ธนาคารของทานมีการสนับสนุนใหรางวัลแกพนักงานผูที่มีผลงานสรางสรรค)
OC4. Your bank has supported recognition. (ธนาคารของทานมีการสนับสนุนใหคําชมเชยแกพนักงานผูที่มีผลงานสรางสรรค)
5. Project management to innovation management effectiveness (การจัดการโครงการที่มีผลตอการบริหารนวัตกรรมที่มีประสิทธิภาพ) ทานเห็นดวยกับขอความตอไปนี้มากนอยเพียงใด 1 (เห็นดวยนอยที่สุด) ถึง 7 (เห็นดวยมากที่สุด)
Measurement 1 2 3 4 5 6 7 PM1. Your bank has slack resources to support innovation management effectiveness. (ธนาคารของทานมีทรัพยากรท่ีเพียงพอในการสนับสนุนในการบริหารโครงการจัดการนวัตกรรมอยางมีประสิทธิภาพ)
PM2. Your bank has greater levels of time management for innovation. (ธนาคารของทานมีกําลังและความสามารถมากขึ้นในการจัดสรรระยะเวลาในโครงการจัดการนวัตกรรม)
PM3. Your bank has greater levels of operation management for innovation. (ธนาคารของทานมีกําลังและความสามารถมากขึ้นในการจัดสรรการดําเนินงานในโครงการจัดการนวัตกรรม)
PM4. Your bank has greater levels of creativity for innovation management. (ธนาคารของทานมีกําลังและความสามารถมากขึ้นในการจัดสรรความคิดสรางสรรคในโครงการจัดการนวัตกรรม)
6. Team cohesiveness to innovation management effectiveness (ความผูกพันท่ีเหนียวแนนในทีมท่ีมีผลตอการบริหารนวัตกรรมที่มีประสิทธิภาพ) ทานเห็นดวยกับขอความตอไปนี้มากนอยเพียงใด 1 (เห็นดวยนอยที่สุด) ถึง 7 (เห็นดวยมากที่สุด)
Measurement 1 2 3 4 5 6 7 TC1. Your bank supports team cohesiveness. (ธนาคารของทานสนับสนุนใหพนักงานมีความผูกพันที่เหนียวแนนตอการทํางาน)
Measurement 1 2 3 4 5 6 7 TC2. Your bank has put together quality teamwork.
229
(ธนาคารของทานมีการวางองคประกอบของทีมงานที่มีคุณภาพ) TC3. Your bank strengthens the longevity relationship. (ธนาคารของทานมีการสรางความเขมแข็งในความสมานฉันทที่แนบแนนยาวนาน)
TC4. Your bank continues to build up team cohesiveness. (ธนาคารของทานมีสรางความผูกพันที่เหนียวแนนในทีมงานอยางตอเน่ือง)
7. Strategic leadership to innovation management effectiveness (ความเปนผูนําทางกลยุทธท่ีมีผลตอการบริหารนวัตกรรมที่มีประสิทธิภาพ) ทานเห็นดวยกับขอความตอไปนี้มากนอยเพียงใด 1 (เห็นดวยนอยที่สุด) ถึง 7 (เห็นดวยมากที่สุด)
Measurement 1 2 3 4 5 6 7 SL1. Your bank has encourage collaboration with regard to innovation management effectiveness. (ธนาคารของทานมีความรวมมือในการสนับสนุนการบริหารจัดการนวัตกรรมอยางมีประสิทธิภาพ)
SL2. Your bank has supported cross functional collaboration with regard to innovation management effectiveness. (ธนาคารของทานมีการสนับสนุนความรวมมือตางฝายตางฟงกช่ันในการบริหารจัดการนวัตกรรมอยางมีประสิทธิภาพ)
SL3. Your bank has empowered its leader. (ธนาคารของทานใหการสนับสนุนพฤติกรรมความเปนผูนํา)
SL4. Your bank has supported innovative leadership. (ธนาคารของทานใหการสนับสนุนบทบาทความเปนผูนําในเชิงสรางสรรค)
8. Coordination and communication to innovation management effectiveness (การประสานงานและการติดตอสื่อสารท่ีมีผลตอการบริหารนวัตกรรมที่มีประสิทธิภาพ) ทานเห็นดวยกับขอความตอไปนี้มากนอยเพียงใด 1 (เห็นดวยนอยที่สุด) ถึง 7 (เห็นดวยมากที่สุด)
Measurement 1 2 3 4 5 6 7 CC1. Your bank has set up a number of committees. (ธนาคารของทานมีการจัดต้ังคณะทํางานโครงการ)
CC2. Your bank always has regular of project meeting. (ธนาคารของทานมีการนัดประชุมโครงการอยางสม่ําเสมอ)
Measurement 1 2 3 4 5 6 7 CC3. Your bank always supports consultation. (ธนาคารของทานสนับสนุนการรับคําปรึกษาในโครงการอยางสมํ่าเสมอ)
230
CC4. Your bank always supports evaluation. (ธนาคารของทานสนับสนุนการประเมินผลโครงการอยางสมํ่าเสมอ)
ส วนท่ี 2 ข อมูลท่ัวไปของสาขาธนาคาร โปรดกรอกข อมูลในช องว างท่ีกําหนด หรือ เติมเคร่ืองหมาย ลงในช อง
ขอมูลสวนตัว 1. เพศ � ชาย � หญิง 2. ระดับการศึกษา � ปริญญาตรี � ปรญิญาโท � ปริญญาเอก
ข อมูลของธนาคาร 1. ช่ือธนาคาร ธนาคาร_____________________
2. ระยะเวลาที่ท านทํางานในธนาคารแห งน้ี ____________________ ป ี
3. ตําแหน งงานของท านในธนาคารแหงน้ี
� ผู จัดการ � รองผู จัดการ � หัวหนาฝายงาน � อื่นๆ(โปรดระบ)ุ________________________________
ขอขอบคุณเปนอยางสูงในความรวมมือของท าน
BIOGRAPHY
NAME Phanu Limmanont
ACADEMIC BACKGROUND M.B.A (Marketing), North Texas
State University, Denton, Texas,
U.S.A.
B.A.(Economics), Thammasat
University, Bangkok, Thailand.
PRESENT POSITION Managing Director
Pharinas Co.,Ltd, 50 Sukhumvit 62,
Banjak, Prakanong, Bangkok,
Thailand.
EXPERIENCE 27 years in Modern Management
and Strategic Plan Management
10 years in training and Consulting
5 years in research and development