
The determinants of box office performance in the film ... determinants of box office... · The...
13
S.Afr.J.Bus.Manage.2013,44(3) 47 The determinants of box office performance in the film industry revisited N.A. Pangarker and E.v.d.M. Smit* University of Stellenbosch Business School, PO Box 610, Bellville 7535, Republic of South Africa [email protected] The film industry is a significant player in the global economy. It calls for significant up-front investments with the result that analysts, studios and investors alike are interested in predicting box office success as part of financial risk management. This study utilises global box office revenue in assessing the effects of eight explanatory variables, identified from previous studies, in the explanation of revenue. Nearly three decades after the seminal study the extension of the original methodology to global rather than USA data, still confirms production cost, releases by major studios, award nominations and sequels to successful films as the key drivers of global box office revenue. The evidence further suggests that in the modern global context, the film genre, the release date around holidays and positive critical reviews play a less significant role than in the original investigation. *To whom all correspondence should be addressed. Introduction The film industry is a significant contributor to the world economy. Worldwide box office revenue for all films released during 2010 was estimated at $31.8 billion. In the United States of America (USA) alone, the industry is a major employer, supporting over 2.2 million jobs, and paying over $137 billion in total wages in 2009. Direct jobs in the film industry in the USA generated $40.5 billion in wages, with an average salary 26% higher than the national average. Jobs in the core business of production, marketing, manufacturing and distribution of films were estimated at 272 000 in 2009 (Motion Picture Association of America (MPAA), 2011). From as early as the mid-1960’s analysts, studios, and investors alike have been researching which variables contribute to the commercial success of films. The body of knowledge regarding the significance and importance of variables which influence box office revenue, is still maturing. This article continues the quest by developing a model to predict the financial success of films by examining the significance of various explanatory variables in forecasting global box office revenue of films. 1 It is unique insofar, to the authors’ knowledge, it is the first attempt at utilising global box office revenues for films as a 1 The words “film”, “feature film”, “movie” and “motion picture” are used interchangeably. This work is based on the research supported in part by the National Research Foundation of South Africa (Grant specific unique reference number (UID) 85617; proxy for the success of films. All previous studies sourced have used domestic box office data for the USA market only. The article is structured as follows. Section 2 consists of a literature review focusing on existing research examining which variables, if any, determine the box office success of films. Section 3 sets out the research methodology by defining the sample, the dependent variables, the independent variables and the statistical model. Section 4 contains a discussion on the key research findings informed and relate the findings to previous literature on the subject, whereafter Section 5 concludes with a summary of the main findings, recommendations and conclusions. Literature review A survey of the research on which factors influence the success of films and their measurement reveals that the majority of studies to date were based on data derived from the performance of films produced and released theatrically in the USA. The first multiple regression model used to predict the financial success of films was developed by Litman (1983) who was inspired by the statement of Jack Valenti, former president of the MPAA, quoted as saying: “no one, absolutely no one can tell you what a film is going to do in the marketplace”. Litman was set on testing this conventional wisdom. He referred to three crucial decision making areas that seemed important in determining the success of a film. The three areas were the creative sphere, the scheduling and release pattern, and the marketing effort. Factors which he considered important in the creative sphere included the story, which he felt had to be genuine,
Transcript of The determinants of box office performance in the film ... determinants of box office... · The...

S.Afr.J.Bus.Manage.2013,44(3) 47
The determinants of box office performance in the film industry revisited
N.A. Pangarker and E.v.d.M. Smit*
University of Stellenbosch Business School,
PO Box 610, Bellville 7535, Republic of South Africa
The film industry is a significant player in the global economy. It calls for significant up-front investments with the
result that analysts, studios and investors alike are interested in predicting box office success as part of financial risk
management.
This study utilises global box office revenue in assessing the effects of eight explanatory variables, identified from
previous studies, in the explanation of revenue. Nearly three decades after the seminal study the extension of the
original methodology to global rather than USA data, still confirms production cost, releases by major studios, award
nominations and sequels to successful films as the key drivers of global box office revenue. The evidence further
suggests that in the modern global context, the film genre, the release date around holidays and positive critical reviews
play a less significant role than in the original investigation.
*To whom all correspondence should be addressed.
Introduction
The film industry is a significant contributor to the world
economy. Worldwide box office revenue for all films
released during 2010 was estimated at $31.8 billion. In the
United States of America (USA) alone, the industry is a
major employer, supporting over 2.2 million jobs, and
paying over $137 billion in total wages in 2009. Direct jobs
in the film industry in the USA generated $40.5 billion in
wages, with an average salary 26% higher than the national
average. Jobs in the core business of production, marketing,
manufacturing and distribution of films were estimated at
272 000 in 2009 (Motion Picture Association of America
(MPAA), 2011).
From as early as the mid-1960’s analysts, studios, and
investors alike have been researching which variables
contribute to the commercial success of films. The body of
knowledge regarding the significance and importance of
variables which influence box office revenue, is still
maturing. This article continues the quest by developing a
model to predict the financial success of films by examining
the significance of various explanatory variables in
forecasting global box office revenue of films.1
It is unique insofar, to the authors’ knowledge, it is the first
attempt at utilising global box office revenues for films as a
1 The words “film”, “feature film”, “movie” and “motion picture” are
used interchangeably. This work is based on the research supported
in part by the National Research Foundation of South Africa (Grant
specific unique reference number (UID) 85617;
proxy for the success of films. All previous studies sourced
have used domestic box office data for the USA market
only.
The article is structured as follows. Section 2 consists of a
literature review focusing on existing research examining
which variables, if any, determine the box office success of
films. Section 3 sets out the research methodology by
defining the sample, the dependent variables, the
independent variables and the statistical model. Section 4
contains a discussion on the key research findings informed
and relate the findings to previous literature on the subject,
whereafter Section 5 concludes with a summary of the main
findings, recommendations and conclusions.
Literature review
A survey of the research on which factors influence the
success of films and their measurement reveals that the
majority of studies to date were based on data derived from
the performance of films produced and released theatrically
in the USA.
The first multiple regression model used to predict the
financial success of films was developed by Litman (1983)
who was inspired by the statement of Jack Valenti, former
president of the MPAA, quoted as saying: “no one,
absolutely no one can tell you what a film is going to do in
the marketplace”. Litman was set on testing this
conventional wisdom. He referred to three crucial decision
making areas that seemed important in determining the
success of a film. The three areas were the creative sphere,
the scheduling and release pattern, and the marketing effort.
Factors which he considered important in the creative sphere
included the story, which he felt had to be genuine,
48 S.Afr.J.Bus.Manage.2013,44(3)
believable, and timely. One may judge by the films released
in recent years, that the genuine and believable attributes are
not that important anymore. An examination of the top ten
highest grossing films ever released indicated that nine were
science-fiction, animation, or superhero films. The highest
grossing film to date is Avatar, which grossed $2,7 billion
and is a science fiction film. The only exception on the
highest grossing film list was Titanic, based on a true story,
that grossed $1,8 billion (Box Office Mojo, 2012).
Other factors which Litman (1983) viewed as important in
the creative sphere were the cast, director, production
budget, and rating. In the scheduling and release phase,
Litman viewed it important for an independent producer to
engage a major distributor for a film release, because they
have greater bargaining power, more substantial financial
resources, preferential access to theatres, reputations of
delivering high quality products, and extensive distribution
networks. Litman also stated that there were periods of peak
audience for film attendance and that these periods were
around Christmas and New Year, summer, and Easter.
Evidence from the Indian film industry, which produces the
highest number of films annually, indicate that there may be
truth in the seasonality phenomenon as film releases in India
are often concentrated around certain holidays.
Litman (1983) highlighted the media campaign as a key
component of the marketing effort. He argued that after the
film was released, word-of-mouth replaced the advertising
campaign, and if word-of-mouth was negative, additional
advertising would be totally ineffective. He introduced the
role of critics and their role as influencers and explored the
role of Academy Awards and their ability to motivate
audiences to watch films.
To test the theories of film success, Litman set up a multiple
regression model with dependent variable, as a proxy for
revenue, theatrical rentals accruing to the distributor. The
first independent variables included were binary variables
representing genre. The genres were science-fiction, drama,
action-adventure, comedy and musical. The second set of
independent variables were binaries for ratings by the
MPAA. The third measure of content involved a binary
variable for whether there was any superstar in the cast. The
fourth independent variable was a variable for the
production cost of each film. As expected, production costs
were the most difficult to find, as even today production
costs are not entirely accurately reported by the industry.
The production costs were also adjusted for inflation. The
fifth independent variable he used was a binary variable for
whether the film was distributed by a major company or an
independent distributor. The sixth independent variables
were binary variables for what he believed to be the three
peak release periods namely, Christmas, Easter, and
summer. Two binary variables were included for an
Academy Award nomination and an Academy Award won.
The last independent variable used by Litman attempted to
capture the impact of critics’ reviews. He used the star rating
assigned by a daily newspaper as a measure of capturing this
factor. A higher star rating signalled a higher critical
acclaim.
Litman ran several tests to eliminate those independent
variables that had no significant impact on the dependent
variable. The variables that were eliminated included
ratings, the superstar factor and the binary variables for
summer and Easter releases. All genres except science
fiction and horror were eliminated as insignificant.
Production costs were positively correlated with rentals and
the power of critics’ reviews was also significant. Science
fiction and horror films were extremely popular and so were
films distributed by major distributors. The Christmas
release variable, Academy Award nominations and
Academy Awards won were all significant. Litman’s
ground-breaking research laid the foundation for many
studies that followed over the next two decades.
De Vany and Walls (1999) embarked on a study using a
sample of over 2 000 films. They proposed that filmmakers
operated under vague and uncertain knowledge of
probabilities of outcomes that “no one knows anything”.
According to them, the mean box office revenue was
dominated by a few blockbuster films and the probability
distribution of box office outcomes had infinite variance.
The distribution of box office revenue according to them
was a member of the class of distributions known as Levy
stable distributions and film revenues diverged over all
possible outcomes. De Vany and Walls (1999) suggested
that the average of motion picture revenues depended almost
entirely on a few extreme revenue outcomes in the upper tail
whose chances were extremely small. They were steadfast in
their opinion that there were no formulas for success in
Hollywood. They contended that producers could make
strategic choices in booking screens, budgets, and cast that
could improve their chance of success, but after a film
opened, the audience decided its fate. They stated that the
exchange of information among a large number of
individuals (the audience) interacting personally, unleashed
a dynamic that was complex and unpredictable and even an
expensive marketing campaign could not direct that
information cascade. That assertion may be valid, especially
in current circumstances where social networking has
become a critically important and extremely fast medium of
disseminating information. De Vany and Walls (1999) were
of the view that:
films were complex products that were difficult to make
well;
nobody knew whether they would like a film until they had
seen it;
films were once-off unique products and their shelf-lives
were only a few weeks;
films entered and exited the market on a continuing basis;
and
most films only had a week or two to capture the audience’s
imagination.
De Vany and Walls (1999) modelled film revenues as
probability distributions. Amongst the variables which they
considered as probability altering variables were sequels,
genres, ratings, stars, budgets and opening screens. They
also considered individual stars and how much power they
had to move the box office revenue probability distribution
toward more favourable outcomes.

S.Afr.J.Bus.Manage.2013,44(3) 49
Table 1: Highest grossing films released worldwide
No Title Gross Revenue in
US$ ’ billion
Year of Release
1 Avatar 2,782 2009
2 Titanic 1,843 1997
3 Harry Potter and the Deathly Hallows – Part 2 1,328 2011
4 Transformers: Dark of the moon 1,123 2011
5 The Lord of the Rings: The Return of the King 1,119 2003
6 Pirates of the Caribbean: Dead Man’s Chest 1,066 2006
7 Toy Story 3 1,063 2010
8 Pirates of the Caribbean: On Stranger Tides 1,043 2011
9 Alice in Wonderland 1,024 2010
10 The Dark Night 1,001 2008
Source: Box Office Mojo (2012)
The mean revenue in their sample was $17 million, and this
was much larger than the median of $6.9 million. The mean
was in the 71st percentile of the revenue distribution, an
indication of an extremely rightward skew. Films without
stars had a median gross revenue of $20.9 million while
films with stars had a median gross revenue of about $38.2
million. Their results showed that the distribution of
production costs was highly skewed, but not as skewed as
the revenue distribution. Their mean production cost was
$11.8 million and this was in the 62nd
percentile. Median
production costs varied from $1.9 million for documentaries
to $17.4 million for science-fiction films. Films without
stars had a median production cost of $9.7 million compared
to films with stars that had a median production cost of
$22.8 million. De Vany and Walls (1999:298) deduced that
large budgets and big stars could create the biggest of flops,
whilst smaller budget films with no star presence could
become big successes. Most of the films in their sample
were unprofitable.
Their paper attempted to explain star power, and found that
most films with very large gross returns, in fact had no stars,
had low revenues and tiny budgets. They proposed that one
of the ways that star power might work was by virtue of
getting it released on many screens at the opening, thus
increasing initial revenue. Another way they suggested that
stars may have had a positive impact on a film was by
bringing a level of performance to the film that raised it
above the ordinary. They found only 19 stars to have a
significant impact on the hit probability. Their research
confirmed that no star could guarantee a hit, and that they all
faced infinite variance of the Levy distribution, so they each
had a measure of risk associated with them. Stars also
exhibited sizeable standard errors of their estimated hit
coefficients. Stars like Michelle Pfeiffer, Jodie Foster, and
Sandra Bullock had high standard errors, implying that their
positive impact was more variable. The smallest standard
error was attributed to Tom Hanks (0.357), though his hit
impact was smaller than Tom Cruise whose estimated hit
coefficient was 2.011. According to them stars only
increased the odds of favourable events that were highly
improbable.
De Vany and Walls (2002 & 2004) further asserted that the
studio model of risk management, whereby studios need to
draw a film project out of so many available, lacked
foundation in theory and evidence. They claimed that in
such highly competitive situations, experience and learning,
which were predictors of success on average, were not
closely related to outcomes because success depended on
something different – getting an extreme draw in a small
sample. They were of the opinion that one cannot under
those circumstances, extrapolate success into the future and
that the film business encouraged selective learning based
on extreme events. They also asserted that studios attributed
success to ability and failure to bad luck, and that affected
the way they approached risk in the industry.
De Vany and Walls (1999:314) stated that past success gave
studio executives an “illusion of control”, but reiterated that
one was unable to link success to causal factors and viewed
the film industry as having complicated stochastic
dynamics, where there was no simple form of causality.
They stated that the probability that a film would reach an
extreme outcome in the upper tail, which was required for it
to be profitable, was small. They concluded that forecasts
were meaningless because the possibilities did not converge
on a mean; they diverged over the entire outcome space with
an infinite variance and they suggested that the strategy of
choosing a portfolio of films could be the preferred method,
rather than selecting individual film projects.
Sawhney and Eliashberg (1996) developed a parsimonious
model for forecasting gross box-office revenue based on
early box office data. Their model was intended to assist
film exhibitors (theatres) in managing their exhibition
capacity and in negotiating exhibition licence agreements
with the distributors by allowing them to predict box-office
potential based on early box-office results. They drew upon
queuing theory framework to conceptualise the customer’s
film adoption process in two steps, namely the “time to
decide” to see the new film, and the “time to act” on the
adoption decision. These two steps were modelled as two
independent stochastic processes. They made some
important observations about the characteristics of the film
industry including that:
most revenues are derived from new films;
the shelf life of a typical film was less than 15 weeks in a
theatre release;
hundreds of films were launched every year;
demand for a new film was highly uncertain; and
it was difficult for a consumer to evaluate a film unless they
have actually seen it.

50 S.Afr.J.Bus.Manage.2013,44(3)
Their model had the ability to forecast box office attendance
with little or no revenue data. This was done by using an
adaptive approach where the model was updated as data
becomes available after one week, two weeks, and three
weeks of release. Their approach to generating sales
forecasts with no data was conducted by performing a meta-
analysis of parameter estimates of related and similar
products. In this process, the model parameters for several
existing products whose sales histories were available were
related to the attributes of the product which revenue they
were trying to forecast. This relationship was used to predict
the parameter estimates and consequently the sales for the
new product. The film industry afforded a unique
opportunity to run such an analysis since historic sales data
for most films released were publicly available. By their
own admission they stated that their model had limitations,
which if relaxed, could refine the accuracy of the model.
These two limitations were that the “time to decide” and
“time to act” processes were independent, and that adoption
process parameters were stationary. By relaxing these, one
would require much more data which would make the model
much more complex than the existing one. The advantage of
conducting a cross sectional analysis as they did was that the
life cycle of a film was relatively short, which eliminated
the need to account for major changes in macroeconomic
factors and consumer tastes, thus maintaining the accuracy
of such analysis.
Ravid (1999) explored the role of stars and other potential
informational signals in the film industry. He presented two
alternative explanations for the roles of stars in films. His
first hypothesis maintained that stars essentially captured
most of their value added in a film. Essentially this meant
that star salaries reflected their market value. According to
Ravid, this “rent capture hypothesis” indicated that stars
very quickly adjusted their fees to reflect their value. He
cited the example that John Travolta who earned only
$150 000 for his role in the film Pulp Fiction, had increased
his fee to $10 million after the success of that film.
According to film industry website thenumbers.com, Pulp
Fiction was produced at a cost of $8 million and its
worldwide box office revenue amounted to $212 million
(The Numbers, 2012). Ravid also cited the example of
Alicia Silverstone, who earned $250 000 for her role in the
film Clueless, increasing her fee to $5 million immediately
thereafter.
His second hypothesis states that informed insiders signal
project quality by hiring expensive stars. His reasoning for
this was based on the role of studio executives whose
careers depended on the success of the films they produced.
With a very high probability of being fired if a film was
unsuccessful, a commitment to a star could be a high-risk
proposition for a studio executive with a risk averse profile.
An early commitment to such a star could act as a signalling
device about the quality of the project to the studio or
outside financiers. The executive would be interested in the
current effect of the signal because his/her current
compensation would probably be linked to the current
project he or she was involved with.
Ravid tested these hypothesis using a sample of 200 films
released between 1991 and early 1993. A comparison of the
means in his study suggested that films with stars brought in
higher revenue. The results of his regression models
showed that the most significant independent variable was
the budget. This meant that films that were more expensive
generated higher revenue. The other significant variable was
the number of reviews the film received. It is interesting to
note that when he increased the number of independent
variables in his regression model, stars were not correlated
with revenues any more, in fact the coefficients became
negative. Sequels and highly visible films also contributed
to revenues. Total revenue was also found to increase if the
film was rated family friendly (i.e. G or PG). Ravid is one of
the few authors who also used rate of return as a dependent
variable, as opposed to just revenue. His results indicated
that big budgets did not contribute to profitability, and in
fact contributed to losses (the correlation coefficient was
negative).
The research by the authors reviewed above, collectively
present the foundations of research attempting to explain the
determinants of box office revenue. Other authors have
contributed extensions to the landmark research presented
above. Smith and Smith (1986) analysed a sample of films
produced from the 1950’s to the 1970’s. They found that the
total number of awards a film received influenced the
revenue of a film. This is consistent with the study by
Nelson, Donahue, Waldman and Wheaton (2001) who
quantified the value of an Academy Award nomination.
They estimated an Academy Award nomination could add
$4.8 million to the box office revenue of a film whilst an
Academy Award won could add $12 million to box office
revenue. This is consistent with Litman (1983) who
estimated the value of an Academy Award nomination of
$7.34 million and the value of an Academy Award won to
be $16 million. Dodds and Holbrook (1988) examined the
impact of the Academy Awards before and after the awards
ceremony. They found the value of a best actor nomination
to be $6.5 million, best actress nomination to be $7 million,
and best picture nomination to be $7.9 million. Post the
awards they found the value of a best actor award won to be
$8.3 million and the value of a best picture award to be $27
million. Smith and Smith (1986) stated that the power of the
Academy Award variable was not constant and could
change over time and in fact could have a positive or
negative effect on the financial results of a film depending
on the time period. One may conclude from the research
above that an Academy Award nomination or won would
have an impact on the box office revenue of a film.
Eliashberg and Shugan (1997) studied the roles of critics
and critics’ reviews. They identified the role of a critic as
one of influencer or predictor. Their results indicated that a
critic could influence the box office success of a film.
According to them, the influencer role in particular would
have an impact on box office revenue. The predictor role
was possible but not as statistically significant as the
influencer role. According to Reinstein and Snyder (2000)
only a few critics had the power to influence consumer
demand and thereby box office revenue. Wallace,
Seigerman, and Holbrook (1993) stated that a highly rated
film would continue to gain at the box office for every extra
positive review it received.

S.Afr.J.Bus.Manage.2013,44(3) 51
Austin (1984) studied MPAA ratings with the hope of
finding a correlation between ratings and film attendance.
He found no significant relationship between film ratings
and audience attendance. Prag and Casavant (1994) found
that PG-13 and R rated films did not perform better at the
box office.
A number of studies revolved around trying to find a
relationship between genre and box office success. Anast
(1967) found a negative relationship between action
adventure films and revenue and a positive one between
violence and eroticism and revenue. Litman (1983), as
mentioned earlier, found a positive relationship for science
fiction films and revenue. In Sawnhey and Eliashberg’s
(1996) research based on “time to act” and “time to decide”,
they found with the drama genre, audiences’ reaction time
was slower and with the action genre their time to react was
faster. Prag and Casavant (1994) found a negative
relationship between the drama genre and revenue.
Neelamegham and Chinatagunta (1999) used a Bayesian
model to predict film attendance in domestic and
international markets. They found that the thriller genre was
most popular and romance was least popular. As these
studies were conducted using sample data over various time
periods ranging over many decades, it would not be
unexpected to find a changing relationship between genre
and revenue, as audience tastes would have changed over
the decades.
Some of the studies referred to the seasonality and success
of films. Both Litman (1983) and Einav (2001) found a
positive correlation between films released over Christmas
and revenue. Sochay (1994) found evidence that summer
months (in the northern hemisphere) were better to release
films, contrary to Litman’s view. Einav also presented
evidence that summer releases had a positive correlation
with revenue. Radas and Shugan (1998) found that peak
season releases performed better at the box office.
A study by Terry, Butler and De’Armond (2005) used a
sample of 505 films released during the period 2001 – 2003.
The study was unique because their data set used a cross
section of films, and unlike other studies was not limited to
data of high profile films only. They filtered their universal
sample down to films that opened in 25 or more theatres.
This eliminated less than 80 films from their universal
sample. Their model used domestic gross box office revenue
as the dependent variable and concluded that the critical
approval variable was positive and statistically significant
and that a 10 per cent increase in critical approval would add
$7 million to box office revenue. The holiday variable in
their model was not statistically significant. Their finding
around a holiday release was inconsistent with other studies.
They attribute this unexpected finding to the fact that certain
major blockbuster films in their data set were released a few
weeks before the traditional holiday period. The R rating
variable was found to be negative and statistically
significant. The negative coefficient was $12.5 million.
Terry et al. (1995) are in the minority of researchers who
included a variable indicating whether the film was a sequel.
The coefficient for sequel was a positive $36 million. The
action genre variable was positive in their model but the
children’s genre was negative. According to their model, the
Academy Award nomination was significant and worth
more than $6 million per nomination. The number of
theatres in which the film was released was positive and
statistically significant thus films released in more theatres
could be expected to perform better at the box office. The
budget variable in their model was positive and statistically
significant implying that films with big budgets performed
better at the box office. One of the avenues for future
research which they identified was to expand the definition
of worldwide success by focusing on global box office
revenue.
From the literature review it can be concluded that there are
no final answers when determining which factors contribute
to box office success. The various models have yielded
contradictory evidence depending on the attributes of the
datasets used. For ease of reference, the literature leads to
the following hypotheses regarding variables impacting on
box office success:
certain film genres;
MPAA ratings;
the size of the budget;
major studio involvement;
Academy Award nominations or awards;
timing of release; and
critics’ reviews
Research methodology
Sampling
The current research was based on the work of Litman
(1983), also using a multiple regression model. What makes
this model unique is that, where other studies used domestic
box office sales (as reported for the USA region only) as the
dependent variable, this model used global box office
revenue as the dependent variable. It was identified in the
study of Terry et al. (2005) as an important avenue for
future research. The current study used more recent data in
an effort to determine whether the independent variables
selected possessed any explanatory power with respect to
forecasting international box office revenue for films
released in the USA and abroad over the two year period
2009 to 2010.
The primary data used in this study were extracted from the
OpusData database. OpusData is a subscription-based
service that collects, and makes available, data on the USA
film industry. The data population started with an extraction
of all films released in the US during the years 2009 and
2010. In 2009, 618 films were released in the US and in
2010, 645 films were released giving a total population size
of 1 263 films. The sample was paired down to eliminate
missing data, particularly budget data, also referred to as
production cost. The data was then further filtered to
exclude films that were not released in the international
market. The uniqueness of this study is that it used global
box office revenue as the dependent variable. Foreign
language films were also eliminated. The final sample
contained a total of 289 films.
52 S.Afr.J.Bus.Manage.2013,44(3)
Although certain studies used data of only successful films
or the top 100 films, this sample contained both financially
successful and unsuccessful films. Information on critics
and Academy Awards were not available in the OpusData
database. The website metacritic.com was used to retrieve
critic information (Metracritic, 2012). Metacritic aggregates
reviews from the most influential and recognised film
critics, which it then combines in a single score called a
metascore. The information on Academy Awards was
retrieved from the AMPAS database website (AMPAS,
2012) and manually added to the dataset for each film.
The data
Dependent variable
The dependent variable used in this model is the global box
office revenue earned by each film expressed in US Dollars.
This data was extracted from OpusData which had a
separate total for domestic (US) and international box office
for each film. The two totals were aggregated for each film
and generated a total value for global box office revenue.
These values were not adjusted for inflation because:
the period for which data was collected was only two years
(2009-2010);
films ran at the box office for less than three months; and
the international box office includes earnings from countries
outside of the US, and the actual value per country was
not available making inflation adjustments difficult.
Independent variables
Production cost
The first independent variable is a variable for the
production cost of the film. This was obtained from the
OpusData database. Where the production cost was not
available, the film was excluded from the sample. The
production cost was quoted in US Dollars. The production
cost did not include advertising and marketing costs as these
are commonly incurred by the releasing studio and not by
the producers of the film.
Genre
The assumption was made that action/adventure and drama
genres are the most popular. Each film extracted from
OpusData was classified according to genre. In the sample,
69 films were in the action/adventure genre and 81 were in
the drama genre. Two separate variables were created for
genre. A dummy binary variable with the value of 1 was
assigned to action adventure and a dummy binary variable
of 1 was assigned to the drama genre.
Release company
Prior research by Litman (1983) indicated that films
released by a major company (also referred to as a major
studio or major distributor) performed better at the box
office. A dummy binary variable with the value of 1 was
assigned to every release by a major company.
Holiday release
A holiday release was defined as a film released over
Christmas, Easter, or the summer holidays (in the northern
hemisphere). It was expected that films released over
holiday periods would perform better at the box office. Each
film’s release date was extracted from the OpusData
database. A dummy binary variable was then assigned to the
release period based on whether it fell in the holiday period.
A value of 1 was assigned to a holiday release.
Academy Award
The number of Academy Award nominations a film
received was extracted from the AMPAS awards database
and manually added to the sample data. Each film in the
sample was thus assigned a numerical value, ranging from 0
for the films in the sample that had no nominations to 12 for
the film The King’s Speech thatreceived 12 nominations, the
highest number of nominations in the sample.
Critics’ rating
Critics’ rating was the approval rating assigned to a film by
a group of critics. This data was retrieved from
Metracritic.com. Metacritic aggregates all reviews by
professional film critics into a single number ranging from 0
to 100. The higher the number, the more positive reviews a
film received. The highest rating in the sample was 95 for
the film The Social Network, and the lowest rating was 18
for The Nutcracker in 3D.
Sequel
Very few studies have looked at the effect of a film being a
sequel in a series of films. It was assumed that sequels could
perform well at the box office as consumers would be
familiar with what to expect, having watched a previous
film in the series. The sequel data was retrieved from the
OpusData database. A dummy binary variable of 1 was
assigned if a film was a sequel.
The model
The empirical model used to examine the determinants of
global box office revenue for films is specified as:
Revenue = β0 + β1ProductionCosti + β2Actioni +
β3Dramai + β4Majori + β5Holidayi + β6Awardi +
β7Critici + β8Sequeli + ei … (1)
where
Revenue is global box office revenue earned by a film in US
Dollars
ProductionCost is the total production budget in US Dollars
Action is the dummy variable indicating an action genre
film
Drama is the dummy variable indicating a drama genre film
Major is the dummy variable indicating a release by a major
company
Holiday is the dummy variable indicating a release during
the holiday period
Award is the number of Academy Award nominations a film
received
Critic is the approval rating for a film

S.Afr.J.Bus.Manage.2013,44(3) 53
Sequel is the dummy variable indicating the film is a sequel
to a previous release
e indicates the regression error
The equation was estimated using a stepwise procedure.
Findings
Data analysis
Average global box office revenue was $154 million, with a
minimum of $117 270 for the film Freakonomics and $2,7
billion for the film Avatar. To date Avatar was also the
highest grossing film ever produced. This broad range is
probably the most significant feature of the film industry.
The average production cost was $52 million, with a
minimum of $1,3 million for the film The Girlfriend
Experience and a maximum of $260 million for the film
Tangled. Action films constituted 24 per cent of all films in
the sample, whilst drama films constituted 28 per cent of
films in the sample. Of all the films in the sample, 63 per
cent were released by a major studio, and 36 per cent were
released during a holiday period. The maximum number of
Award nominations received was the film The King’s
Speech with twelve nominations. The Average critical rating
was 54 per cent with a standard deviation of 17 per cent. Of
all the films in the sample, approximately ten per cent were
sequels.
A simple correlation test of the correlation coefficients
between the global box office revenue and the explanatory
variables was conducted. The results thereof are tabulated in
Table 2.
Table 2: Correlation matrix of independent and dependent variables
Ln Revenue Ln Production Cost Action Drama Major Holiday Award Critic Sequel
Ln (Revenue) 1,000
Ln (Production cost) 0,735* 1,000
Action 0,363* 0,490* 1,000
Drama -0,230* -0,285* -0,349* 1,000
Major 0,485* 0,439* 0,194* -0,160* 1,000
Holiday 0,132* 0,104 0,041 -0,094 0,152* 1,000
Award 0,231* 0,049 0,043 0,152* -0,031 0,087 1,000
Critic -0,023 -0,204* 0,010 0,293* -0,084 0,019 0,470* 1,000
Sequel 0,337* 0,242 0,182* -0,111 0,143* 0,031 -0,023 -0,087 1,000
*Significant at the 0.05 level
Table 2 shows a strong positive relationship between budget
and revenue, indicated by the correlation coefficient of
0,735. This was expected and is consistent with the findings
of Litman (1983) and Terry et al. (2005). This coefficient
also exhibited the greatest correlation with revenue when
compared to the remainder explanatory variables. The
correlation coefficient for the action genre with revenue was
0.363. This was contrary to the findings of Litman (1983)
who reported a coefficient of -0,199, but consistent with
Terry et al. (2005) who reported a positive relationship.
The correlation matrix shows a negative relationship
between drama genre and revenue with a correlation
coefficient of -0,230. This confirms the observations of Prag
and Casavant (1994) that there was a negative relationship
between the drama genre and revenue. The correlation
coefficient between distribution by a major studio and
revenue was 0,485. This was consistent with the findings of
Litman (1983). The correlation coefficient between holiday
release and revenue was weakly positive. The author
expected a stronger relationship between these two as all the
literature indicated a positive relationship between holiday
releases and revenue. The correlation coefficient between an
award nomination and revenue was 0,231. This was
expected as films that were nominated for Academy Awards
would perform better at the box office. This finding was
consistent with all the literature examined in this study. The
coefficient which surprised was the one reflecting a negative
relationship between critics’ review and revenue. It was
anticipated that this would be positive, as films that received
more positive reviews were expected to perform better at the
box office based on the reviews. All the literature reviewed
on the subject matter indicated a positive relationship
between critics’ reviews and revenue.
The correlation coefficient between sequels and revenue was
positive at 0,337. This was expected as audiences would be
fairly familiar with a previous film in a series and therefore
make a more informed decision about watching a film.
Furthermore, it is expected that a producer would only
embark on making a sequel if its predecessor was a hit film,
and on that basis the producer would expect the sequel to
perform well at the box office.
The stepwise regression results for the model presented by
Equation 1 is summarised in Table 3. The model employed a
log form correcting for obvious outliers that existed in the
sample as a result of blockbusters. The dependent variable
(revenue) and independent variable (production cost) were
transformed into log form. A stepwise regression analysis
was performed in an attempt to eliminate any correlated
independent variables and to determine the relative
explanatory power of each independent variable.

54 S.Afr.J.Bus.Manage.2013,44(3)
As can be seen from the preceding results four independent
variables (production cost, major, award, and sequel)
exhibited a highly significant linear relationship with
revenue, and four independent variables (action, drama,
holiday, and critic) did not exhibit a significant linear
relationship with revenue.
Interpretation of the results and comparison to the literature
Production cost
The production cost variable was positive and highly
significant. Production cost was the most significant
variable of the eight in the model. This variable implies that
the higher the budget, the higher the revenue of a film. This
is consistent with the results of Litman (1983), Ravid
(1999), and Terry et al. (2005). Big budget films commonly
have big name stars, special effects, large advertising
budgets, which were expected to attract bigger audiences to
the box office. The data set used showed that the 12 highest
budget films had production costs of $200 million and
higher. Of these twelve films the lowest earner was Robin
Hood that grossed $322 million at the box office against a
production cost of $200 million. The highest earner was
Avatar with $2,7 billion at the box office against a
production cost of $237 million. Avatar was also the highest
grossing film ever produced to date. Interestingly, the
highest budget film in the data set was Tangled which cost
$260 million to produce, but only grossed $586 million at
the box office. This however does not imply anything about
the actual profitability of the films. Though Avatar was the
highest grossing film to date, its profitability which was
simply calculated as total revenue as a percentage of total
production cost in the absence of further detailed data, was 1
175 per cent. The film with the highest profitability in the
data set was Paranormal Activity with a return of 5 917 per
cent. Its production cost was $3 million and its gross
revenue was $177 million. In terms of profitability, the
twelve most profitable films had an average production cost
of $20,2 million (excluding Avatar which was treated as an
outlier). In directing further research, given that one is able
to obtain detailed data, one may want to examine the effect
of variables on actual profitability or investment return of
films.
Major distributor
The results showed a statistically significant relationship
between a film released by a major studio and revenue. In
the data set 62 per cent of all films were released by a major
studio. Of the top 20 revenue earners, only two films were
not released by a major studio (The Twilight Saga: New
Moon and The Twilight Saga: Eclipse). According to this
model, films released by a major studio were expected to
earn $11,3 million more in revenue than films not released
by a major studio. The data set also showed that of the 50
lowest revenue earners, 72 per cent were not distributed by a
major studio. The result of this model is consistent with
Litman (1983) who reported a strong positive relationship
between a major release and revenue. Litman reported that
films distributed by major studios earned $7,21 million more
than those distributed by independent studios. This result
was contrary to Sombunarasin (2010) who reported that
major studios had a negative effect on revenue and do not
guarantee success of films. Major studios normally have
bigger marketing budgets and strong distribution networks
ensuring that their films reach as many screens as possible
and thereby maximising revenue.
Table 3: Determinants of revenue (2009-2010)
Coefficients t –value P-value
Intercept 1,077 1,023 0,307
LN Production Cost 0,930 14,682 0,000
Major distributor 0,745 5,240 0,000
Award nomination 0,209 5,974 0,000
Sequel to success 0,958 4,603 0,000
R2 0,643
F-value 127,711
Significance level 0,000
Award nominations
The results showed strong evidence of a significant linear
relationship between award nomination and revenue. In this
sample, of the top twenty highest grossing films, twelve
received Academy Award nominations. Avatar received
nine nominations. The film The King’s Speech received
twelve nominations and grossed $427 million, the 25th
highest revenue earner in the sample. In the sample 54 films
received one or more Academy Award nominations.
According to the model, being nominated for an award was
worth approximately $39 million. The coefficient for the
award variable implies that for every award nomination
earned, the revenue should increase by about 23 per cent.
These results were consistent with those of Litman (1983),
Smith and Smith (1986), Dodds and Holbrook (1998),
Nelson et al. (2001) and Terry, et al. (2005). According to
Litman, being nominated for an award is capable of
generating significant additional business. His model
estimated that being nominated for an Academy award in
one of the top three categories was worth $7.34 million in

S.Afr.J.Bus.Manage.2013,44(3) 55
additional revenue. His study went further and estimated
that actually winning an award was worth about $16.3
million. Terry et al. (2005), are of the opinion that a
nomination serves as a signalling device, indicating which
films are viewed by industry experts as being worthy of
recognition. According to their model, an Academy Award
nomination was worth more than $6 million per nomination.
They, together with Litman both concur that it was not
surprising, given the value of an award, that major
distributors spent large amounts on advertising and
campaigns before the awards in order to attract the favour of
the members of the Academy. Sombunarasin (2010) also
alluded to the signalling theory, particularly where a first
film in a series of sequels received an award, in which case
it will have a positive effect on the success on the following
films in the series.
Sequel to successful film
The results showed overwhelming evidence of a significant
linear relationship between sequels and revenue. The result
for sequel implied that a sequel could add as much as $169
million to box office revenue. In the sample set, 30 films
were sequels. Of the twenty highest grossing films in the
sample, ten were sequels, of which six were in the top ten.
Of the 20 highest grossing films, fourteen were sequels. The
highest grossing sequel in the sample set was Toy Story 3
which was the second highest gross earner with a total
revenue of $ 1.064 billion. Other significantly high earners
in the sample set which were sequels were The Dark Knight
(grossing $1 billion), two in the Harry Potter series (each
grossing in excess of $900 million), Ice Age (grossing $886
million), and Transformers (grossing $836 million). In the
sample, of the 150 lowest grossing revenues, only three
were sequels.
These findings were consistent with that of Terry et al.
(2005) who found a positive and statistically significant
relationship between sequels and box office revenue. Most
of the blockbuster films in their sample, were sequels. They
concurred that the sequel was a major player in the world of
motion pictures and should be included as a determinant in
future research. This is also consistent with the results of
Sombunarasin (2010) who had 102 sequels in her sample of
200 films. She suggests that the first sequel’s box office
success guarantees the success of the next sequel in the
series.
Action genre
The results did not show any linear relationship between the
action genre and revenue. The coefficient for action was
negative. The action variable was included in the model
because of the 20 highest grossing films in the data set, 15
were in the action genre. Action films made up 24 per cent
of the total sample by genre. The nine highest grossing films
in the data set were all in the action genre. The results of this
model is consistent with Anast (1967) who also found a
negative relationship between action genre films and
revenue. It is however contrary to Terry et al.’s (2005) study
that found a positive relationship between the action genre
and revenue. The difference could be explained by a
difference in audience taste over time. Terry et al.’s sample
contained films released in the period 2001 – 2003 and this
research focussed on films released during 2009 and 2010.
Furthermore, this research used total box office revenue
while their study was confined to domestic box office
revenue.
Holiday release
The results of this regression analysis showed that there was
no linear relationship between a holiday release and
revenue. In the data set however, 35 per cent of releases
were during the defined holiday periods. Six of the highest
grossing films in the sample set (Avatar, Toy Story 3, Harry
Potter and the Half Blood Prince, Ice Age: Dawn of the
Dinosaurs, Transformers: Revenge of the Fallen, and
Inception) were all released during the holiday period. Of all
the films grossing more than $ 100 million in the sample, 63
(or 58 per cent of the sample) were actually released outside
the holiday period. Some of these included Alice in
Wonderland, The Dark Night, Harry Potter and the Deathly
Hallows, Shrek, and Up. It is interesting to note that many
of these were actually aimed at children yet they were
released outside of the holiday period. One of the reasons
could be that because of tougher competition between
releases during the holiday period, studios could actually be
strategically positioning their releases so as not to compete
with other major releases during the same time. Another
explanation could be that during holidays children frequent
the films more, therefore to smooth the seasonality and
peaks during the holiday periods studios place other films
outside the holiday period.
Contrary to these results, Litman (1983) reported a positive
relationship between Christmas releases and revenue, citing
that a film released during the Christmas period would earn
$10 million more than a film released during any other time
of the year. Sochay (1994) reported a positive relationship
between summer releases and revenue. Radas and Shugun
(1998) also reported better performance at the box office for
peak season releases. Einav (2001) also supported the view
of better performance for summer and Christmas releases.
The contrarian result for this variable in the current research
could be because the dependent variable is global revenue
whilst in all the other studies, the dependent variable was
limited to USA domestic revenue only. The patterns of
audience attendance may be different in the international
markets. In the southern hemisphere, summer holidays are
not in the June – August period and are shorter than in the
US.
Critical acclaim
Surprisingly in this model, positive critical reviews did not
display any linear relationship with revenue. In the data set
of the top twenty grossing films, the average critic score was
63,95. The highest critical acclaim was for the film The
Social Network with a score of 95, which grossed $ 224
million in revenue. The critic score for Avatar which
grossed $2,7 billion was 83. Of the top 20 films the data set
in terms of critic score, 16 received Academy Award
nominations. There were certain anomalies in the sample.
The film The Last Airbender scored only 20 in critic
reviews, yet grossed $319 million. Similarly, Sex and the
56 S.Afr.J.Bus.Manage.2013,44(3)
City and Little Fockers 2 both scored 27 in critical acclaim
yet grossed $294 million and $310 million respectively. The
films The Damned United and The Secret of Kells were
both highly critically acclaimed with a score of 81 each, yet
earned only $4 million and $2 million respectively at the
box office.
The results of this model were contrary to the results of
other researchers. According to Litman, each additional star
rating (used as a proxy for positive critics reviews),
increased revenue by $3,3 million. Litman contends that
critics were perfect judges of quality of films, and that this
variable may simply be measuring the differential effects of
quality on revenue. According to Terry et al. (2005), a ten
per cent increase in critical approval rating implied an
increase in revenue of $7 million. They proposed that films
earning critical acclaim appeared to profit from the
information cascade put forth by the positive word of
mouth. They further propose that studios and distributors
with negative critical reviews could cut their losses early by
limiting their advertising campaigns and costs after release
and speeding up the video release. Based on the results of
their study they were of the opinion that critics were more
predictors than influencers of box office revenue. They
suggested that although reviews themselves could influence
some filmgoers, the reviews primarily produced valuable
predictive information about the ultimate success, or a film
based on the film quality. According to them, many studios
or distributors assume that critics are influencers and
attempt to persuade critics to be favourable. They cited the
example of Sony Pictures who created a fake film critic to
positively review their releases, implying that insiders
believed that film critics were important to box office
success.
Drama genre
The results showed a negative relationship between the
drama genre and revenue. The drama genre was included
because of all the films in the data set, most were in the
drama genre. Eighty-one films or 28 per cent were in the
drama genre. In the data set drama films had the highest
correlation with Academy Award nominations, however the
market may be saturated with drama scripts, and the
audience thus preferring to attend other genres of film
resulting in higher revenues for the other genres. These
results are consistent with Prag and Casavant (1994) who
also reported a negative relationship for the drama genre and
box office revenue. Sawnhey and Eliashberg (1996)
reported that audiences react slower to the drama genre.
In summary it was found that approximately 64,8 per cent of
the variation in revenue was explained by the model. A two-
tailed test was then performed on each independent variable
to determine whether sufficient evidence existed to infer a
linear relationship between the variable and revenue. It was
found that only production cost, major studio release,
academy award nomination, and the sequel variables had
highly significant linear relationships with revenue. These
results were then compared to the results of other authors. In
certain cases the results of this study concurred with existing
literature and in other cases the results were contrary to
existing literature.
Conclusion
The main purpose of this research was to establish which
factors, if any, contribute to the success of films at the box
office. Using a multiple regression model, a number of
variables believed to influence box office success were
evaluated. The model’s coefficient of determination, R2 was
at 0,647, overall significant.
The most significant contributor to box office revenue was
found to be production cost. The model implied that higher
production budgets would lead to higher global box office
revenue. This result was consistent with three studies,
Litman (1983), Ravid (1999), and Terry et al. (2005). Only
one study showed no evidence of a positive relationship
between the production cost variable and revenue (De Vany
& Walls 1999). There were certain anomalies though, in that
certain low budget films actually performed very well at the
box office.
The results also showed that a release by a major studio had
a positive relationship with revenue. Only one other study
(Litman 1983) focussed on this variable and his conclusion
was consistent with the result of this model. According to
this model, films released by a major studio were expected
to earn $11,3 million more in revenue than films not
released by a major studio.
Another significant contributor to box office success was
award nominations. This model valued an award nomination
at $39 million. The positive relationship between award
nomination and revenue was also confirmed by Litman
(1983), Dodds and Holbrook (1988), Terry et al. (2005), and
Nelson et al. (2001).
The other significant contributor to box office success
identified by this model was sequel. The model revealed an
overwhelmingly significant relationship between sequels
and box office revenue. The result for sequel implied that a
sequel could add as much as $169 million to box office
revenue. These findings were consistent with that of Terry et
al. (2005), and Sombunarasin (2010) who found a positive
and statistically significant relationship between sequels and
box office revenue.
Two variables, action and drama, displayed insignificant
negative coefficients. This was consistent with Anast (1967)
whose study also showed a negative relationship between
the action genre and revenue. Prag and Casavant (1994)
showed a negative relationship for drama and revenue.
Contrary to the result of this model, Terry et al. (2005),
demonstrated a positive relationship between the action
genre and revenue.
The results of the model showed that there was no
significant relationship between a holiday release and
revenue. This was contrary to the evidence presented by
other researchers who all reported a positive relationship
between a holiday release and revenue.
The critic variable surprisingly did not show any linear
relationship with revenue. This was contrary to all other
literature surveyed regarding the power of critic’s reviews.

S.Afr.J.Bus.Manage.2013,44(3) 57
All the other authors reported a positive relationship
between critic reviews and revenue. The difference between
this model and their studies could be due to the revenue
variable in this sample being much wider than just covering
the USA market. The critics’ scores in this model were
derived from USA critics only. If data was available for
foreign critics in those markets outside the USA, the critical
review ratings could possibly have increased.
The purpose of this was to identify and confirm the
significance of various explanatory variables in forecasting
global box office revenue of films using global box office
revenue. It is concluded that the factors contribute to box
office success, are films with higher budgets, released by a
major studio, with one or more Academy nominations, and a
sequel to a prior success. The significance of these statistical
findings is supported by the literature.
Some directions for future research arise. It will be of
interest to examine actual returns on investment as direct
measure of the profitability of films. Complete production
cost data, however, is difficult to obtain. In the present
instance, the original sample of 1263 films had to be filtered
down to 289 due to production cost data being unavailable.
It would also be interesting to repeat the study using income
data beyond ticket sales, e.g. income deriving from DVD
sales, Blue-Ray sales and rentals, digital downloads, cable
and satellite television and merchandising. Accurate
supplementary data sources, however, remain problematic to
access. Finally, incorporating income foregone through
piracy may add a further dimension to studies regarding film
investment.
References
AMPAS. 2012.‘ Resources and databases’ [online]
URL:http://www.oscars.org. Accessed: 19 January 2012.
Anast, P. 1967. ‘Differential movie appeals as correlates of
attendance’, Journalism Quarterly, 44: 86-90.
Austin, B.A. 1984. ‘Portrait of an art film audience’,
Journal of Communication, 34(winter): 74-87.
Box Office Mojo. 2012. ‘Worlwide grosses’. [online] URL:
http://www.boxofficemojo.com/alltime/world/ .Accessed:
11 January 2012.
De Vany, A. & Walls, W.D. 1999. ‘Uncertainty in the
movie industry: Does star power reduce the terror of the box
office?’ Journal of Cultural Economics, 23: 285-318.
De Vany, A. & Walls, W.D. 2002. ‘Does Hollywood make
too many R-rated movies? Risk, stochastic dominance, and
the illusion of expectation’, The Journal of Business, 75(3):
425-451.
De Vany, A. & Walls, W.D. 2004. ‘Motion picture profit,
the stable Paretian hypothesis, and the curse of the
superstar’, Journal of Economic Dynamics & Control, 28:
1035-1057.
Dodds, J.C. & Holbrook, M.B. 1988. ‘What’s an Oscar
worth? An empirical estimation of the effect of nominations
and awards on movie distribution and revenues’, Current
Research in Film: Audiences, Economics and the Law, 4:
72-87.
Einav, L. 2001. ‘Seasonality and competition in time: An
empirical analysis of release date decisions in the U.S.
motion picture industry’. Working Paper, Harvard
University.
Eliashberg, J. & Shugan, S.M. 1997. ‘Film critics:
Influencers or predictors?’ Journal of Marketing, 61(2): 68-
78.
Litman, B. 1983. ‘Predicting success of theatrical movies:
An empirical study’, Journal of Popular Culture,
16(spring): 159-175.
Metacritic. 2012. ‘Metacritic – Keeping score of
entertainment’. [online] URL: http://www.metacritic.com/.
Accessed 19 January 2012.
Motion Picture Association of America (MPAA). 2011. The
economic contribution of the motion pPicture & television
industry to the United States. Washington D.C: MPAA.
Neelamegham, R. & Chinatagunta, P. 1999. ‘A Bayesian
model to forecast new product performance in domestic and
international markets’, Marketing Science, 18(2): 115-136.
Nelson, R., Donahue, M., Waldman, D. & Wheaton, C.
2001. ‘What's an Oscar worth?’ Economic Inquiry, 39(1): 1–
6.
OpusData. 2011. ‘OpusData.’ [online]
URL:http://www.opusdata.com/. Accessed 20 December
2011.
Prag, J.J. & Casavant, J. 1994. ‘An empirical study of the
determinants of revenues and marketing expenditure in the
motion picture industry’, Journal of Cultural Economics,
18(3): 217-235.
Radas, S. & Shugan, S.M. 1998. ‘Seasonal marketing and
timing introductions’, Journal of Marketing Research,
35(3): 296-315.
Ravid, S.A. 1999. ‘Information, blockbusters, and stars: a
study of the film industry’, Journal of Business, 72(4): 463-
492.
Reddy, S.K., Swaminathan, V. & Motley, C.M. 1998.
‘Exploring the determinants of Broadway show success’,
Journal of Marketing Research, 35(3): 370-383.
Reinstein, D. A. & Snyder, C.M. 2000. ‘The influence of
expert reviews on consumer demand for experience goods:
A case study of movie critics’. Working Paper, University of
California-Berkeley and George Washington University.

58 S.Afr.J.Bus.Manage.2013,44(3)
Sawhney, M.S. & Eliashberg, J. 1996. ‘A parsimonius
model for forecasting gross box-office revenues of motion
pictures’, Marketing Science, 15(2): 113-131.
Sedgwick, J. & Pokorny, M. 1999. ‘Movie stars and the
distribution of financially successful films in the motion
picture industry’, Journal of Cultural Economics, 23: 319-
323.
Smith, S.P. & Smith, V.K. 1986. ‘Successful movies – a
preliminary empirical analysis’, Applied Economics,
18(May): 501-507.
Sochay, S. 1994. ‘Predicting the performance of motion
pictures’, The Journal of Media Economics, 7(4): 1-20.
Somburanasin, M. 2010. ‘Risky business: Does recognition
reduce uncertainty of the movie industry global box office
revenue?’ Master thesis within Economic and Management
of Entertainment & Arts, Jonkoping International Business
School, Jonkoping University, Sweden.
Terry, N., Butler, M. & De’Armond, D. 2005. ‘The
determinants of domestic box office performance in the
motion picture industry’, Southwestern Economic Review,
32: 137-148.
The Numbers. ‘Pulp fiction’. [online] URL: http://www.the-
numbers.com/movies/1994/0PUFI.php. Accessed 17
January 2012.
Wallace, W.T., Seigerman, A. & Holbrook, M.B. 1993.
‘The role of actors and actresses in the success of films:
How much is a movie star worth?’ Journal of Cultural
Economics, 17(1): 1-27.
70 S.Afr.J.Bus.Manage.2013,44(3)
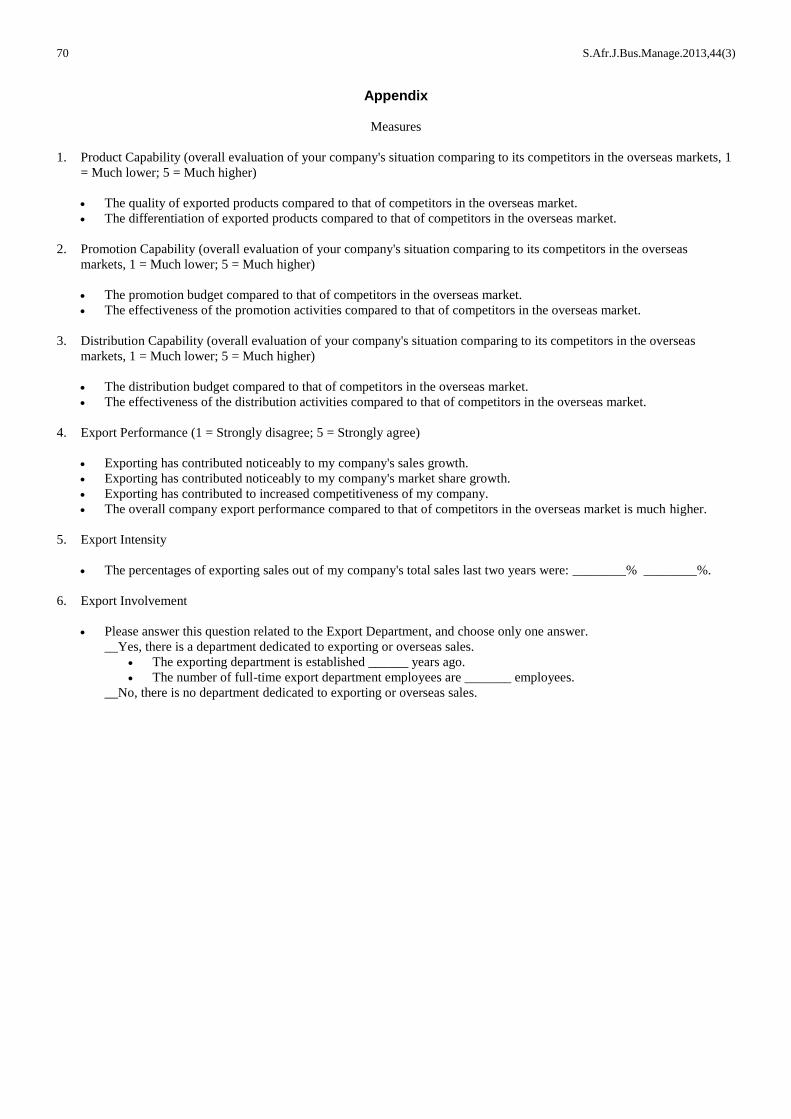
Appendix
Measures
1. Product Capability (overall evaluation of your company's situation comparing to its competitors in the overseas markets, 1
= Much lower; 5 = Much higher)
The quality of exported products compared to that of competitors in the overseas market.
The differentiation of exported products compared to that of competitors in the overseas market.
2. Promotion Capability (overall evaluation of your company's situation comparing to its competitors in the overseas
markets, 1 = Much lower; 5 = Much higher)
The promotion budget compared to that of competitors in the overseas market.
The effectiveness of the promotion activities compared to that of competitors in the overseas market.
3. Distribution Capability (overall evaluation of your company's situation comparing to its competitors in the overseas
markets, 1 = Much lower; 5 = Much higher)
The distribution budget compared to that of competitors in the overseas market.
The effectiveness of the distribution activities compared to that of competitors in the overseas market.
4. Export Performance (1 = Strongly disagree; 5 = Strongly agree)
Exporting has contributed noticeably to my company's sales growth.
Exporting has contributed noticeably to my company's market share growth.
Exporting has contributed to increased competitiveness of my company.
The overall company export performance compared to that of competitors in the overseas market is much higher.
5. Export Intensity
The percentages of exporting sales out of my company's total sales last two years were: ________% ________%.
6. Export Involvement
Please answer this question related to the Export Department, and choose only one answer.
__Yes, there is a department dedicated to exporting or overseas sales.
The exporting department is established ______ years ago.
The number of full-time export department employees are _______ employees.
__No, there is no department dedicated to exporting or overseas sales.


