The Destination and Early Career Performance of...
136
SWP653 1984 The Destination and Early Career Performance of Secondary School Graduates in Colombia Findings from the 1978 Cohort George Psacharopoulos Antonio Zabalza WORLD BANK STAFF WORKING PAPERS Number 653 HD 6276 .C72 P75 1984 c.2 O44 4 0249 K 902 SLCO1 8420 Public Disclosure Authorized Public Disclosure Authorized Public Disclosure Authorized Public Disclosure Authorized
Transcript of The Destination and Early Career Performance of...

SWP6531984
The Destination and Early Career Performanceof Secondary School Graduates in Colombia
Findings from the 1978 Cohort
George PsacharopoulosAntonio Zabalza
WORLD BANK STAFF WORKING PAPERSNumber 653
HD6276.C72P751984c.2 O44 4 0249
K 902
SLCO1 8420
Pub
lic D
iscl
osur
e A
utho
rized
Pub
lic D
iscl
osur
e A
utho
rized
Pub
lic D
iscl
osur
e A
utho
rized
Pub
lic D
iscl
osur
e A
utho
rized


cn6WORLD BANK STAFF WORKING PAPERS
Number 653
The Destination and Early Career Performanceof Secondary School Graduates in Colombia
Findings from the 1978 Cohort
George PsacharopoulosAntonio Zabalza
S1CTCORAL 1,1'1RARi
N, ERN, rIONAL B3AN!TkfC')N'S;TRlCTILIN END LIY' ME'4l
AUG 31 1988
The World BankWashington, D.C., U.S.A.

Copyright @ 1984The Intemational Bank for Reconstructionand Development/THE WORLD BANK
1818 H Street, N.W.Washington, D.C. 20433, U S.A.
All rights reservedManufactured in the United States of AmericaFirst printing July 1984
This is a working document published informally by the World Bank. To present theresults of research with the least possible delay, the typescript has not been preparedin accordance with the procedures appropriate to formal printed texts, and theWorld Bank accepts no responsibility for errors. The publication is supplied at atoken charge to defray part of the cost of manufacture and distribution.
The views and interpretations in this document are those of the author(s) andshould not be attributed to the World Bank, to its affiliated organizations, or to anyindividual acting on their behalf. Any maps used have been prepared solely for theconvenience of the readers; the denominations used and the boundaries shown donot imply, on the part of the World Bank and its affiliates, any judgment on thelegal status of any territory or any endorsement or acceptance of such boundaries.
The full range of World Bank publications, both free and for sale, is described inthe Catalog of Publications; the continuing research program is outlined in Abstracts ofCurrent Studies. Both booklets are updated annually; the most recent edition of eachis available without charge from the Publications Sales Unit, Department T, TheWorld Bank, 1818 H Street, N.W., Washington, D.C. 20433, U.S.A., or from theEuropean Office of the Bank, 66 avenue d'1ena, 75116 Paris, France.
George Psacharopoulos is manager of the research program in the EducationDepartment of The World Bank. Antonio Zabalza, professor of economics at theUniversity of Barcelona and lecturer in economics at the London School of Economics,is a consultant to the Education Department.
Library of Congress Cataloging in Publication Data
Psacharopoulos, George.The destination and early career performance of
secondary school graduates in Colombia.
(World Bank staff working papers ; no. 653)Bibliography: p.1. High school graduates--Employment--Colombia.
2. Education, Secondary--Colombia. I. Zabalza, Antonio,1946- . II. Title. III. Series.HD6276.C72P75 1984 331.11'423 84-13018ISBN 0-8213-0383-X

ABSTRACT
This paper reports the results of an evaluation of Bank-assisted
diversified secondary schools (INEM) in Colombia offering prevocational
subjects alongside the traditional academic curriculum. The evaluation is
based on a retrospective follow-up of nearly 1,800 graduates of" target" and
"control" schools three years after leaving school. The central finding is
that the new schools have not generated further training or employment
patterns that are different from the control schools. In particular, INEM
graduates are not more likely to enter employment immediately upon graduation
and do not obtain higher earnings in the labor market than traditional
graduates. According to this initial evaluation, there is virtually no
difference in the social rate of return on the resources invested in the two
types of schools.

EXTRACTO
En este estudio se dan a conocer los resultados de una evaluaci6n de
los "institutos nacionales de educaci6n media diversificada" (INEM) de
Colombia --los cuales reciben asistencia del Banco Mundial-- que imparten
enseiianza en materias de formaci6n preprofesional paralelamente con los
planes de estudios academicos tradicionales. La evaluaci6n se basa en un
seguimiento retrospectivo de cerca de 1.800 graduados de los institutos
fijados como "meta" y de un grupo de escuelas "testigo" tres aiios despues
de egresados. La conclusi6n principal consiste en que las nuevas escuelas
no han generado pautas de capacitaci6n o empleo que sean diferentes de las
observadas en las escuelas testigo. De modo especial, comparados con los
graduados de escuelas tradicionales, no es mas probable que los de los
INEM obtengan empleo inmediatamente despues de graduados, ni que en el
mercado laboral los ingresos que obtienen sean mas altos. De acuerdo con
esta evaluaci6n inicial, practicamente no hay diferencia en lo que
concierne a la tasa de rendimiento social sobre los recursos invertidos en
los dos tipos de escuelas.

ABREGE
Ce document pr6sente les r6sultats d'une 6valuation des 6coles
secondaires polyvalentes (INEM) en Colombie. Ces ecoles, dont la creation
a ete appuyee par la Banque mondiale, dispensent un enseignement
preprofessionnel, parallelement au programme scolaire classique.
L'evaluation s'appuie sur le suivi trois ans apres la fin de leurs 6tudes,
de quelque 1.800 anciens e1lves d'6coles "polyvalentes" et d'ecoles
"t6moins". La principale conclusion en est qu'on ne constate pas de
difference, pour ce qui est de l'emploi comme de la poursuite des etudes,
entre les diplomes des deux types d'ecoles. En particulier, les e1lves
des ecoles polyvalentes n'ont pas davantage de chances de trouver un
emploi des la fin de leurs etudes et ils ne sont pas mieux remuner6s sur
le marche de l'emploi que les diplomes des 6coles classiques. D'apres
cette premiere 6valuation, le taux de rentabilite sociale de
l'investissement est pratiquement le meme pour les deux types d'6cole.

Acknowledgments
This paper is based on a more comprehensive World Bank research project
on Diversified Secondary Curricula (DiSCuS, RPO 672-45), in collaboration
with the Colombia Ministry of Education and the Instituto SER de
Investigacion (Drs. Eduardo Velez and Carlos Rojas), and the Tanzania
Ministry of Education and the Institute of Education, University of Dar es
Salaam (Professor I. Omari). We wish to thank A.M. Arriagada, J. Garcia and
Z. Tzannatos for research assistance. The Colombian research team was most
helpful in collecting and processing the data, as well as in assisting in
their interpretation. The views expressed here are those of the researchers
and do not necessarily reflect the policy of the World Bank or the Colombian
Government.

Contents
Page
Abstract
I. Introduction 1
II. An Overview of the Data 7
III. Who Attends the INEMs? 17
IV. The Demand for Post-Secondary Education 22
V. Further Training 35
VI. Labor Force Participation 41
VII. Job Search and Unemployment 51
VIII. Labor Earnings 51
IX. An Economic Evaluation of Diversified Education 74
X. Summary and Conclusions 81
References 86
Annexes
1. A Sequential Probability Model 87
2. The Binomial Probit Model 89
3. Means and Standard Deviations of Selected Variables 93
4. Zero-Order Correlation Matrix 94
5. Questionnaire 95


I. Introduction
Colombia is one of the many countries that enacted a series of
educational reforms in the last two decades to make the school system more
relevant to the world of work. One particular reform refers to the
diversification of the secondary school curriculum.
The origins of this reform date back to 1963 when the Government -
in collaboration with the World Bank and Unesco - made a diagnostic study of
Colombian education. The conclusion of the resulting "Varner Report" (1965)
was that priority should be given to the introduction of specialized
education at the secondary level. In 1969, Decree No. 1962 introduced a
separate type of school for this purpose, the INEM (Instituto Nacional de
Educacion Media Diversificada).
The World Bank financed the creation of 19 INEM's in Colombia. 1,
The first such school became operational in 1970 and the last in 1975.
1/ The World Bank Lending for Diversified Secondary Schools in Colombia hasbeen as follows:
Loan Year Cost (10°) US$ Number ofBank Colombia Total Schools Students Annual Graduates
INEMColombia I(552-CO) 1968 6.5 6.8 13.3 10 48,000 7,300
Colombia II(679-CO) 1970 5.0 6.6 11.6 9 31,000 3,970
CASD a/Colombia III(920-CO) 1973 19.0 10.3 29.3 20 12,000 3,500
a/ Centros Auxiliares de Servicios Docentes, attended part-time by non-INEMstudents in order to be exposed to laboratories and workshops lacking intheir regular school in the surrounding area. Costs are actual (aftercompletion).

- 2 -
Because the example of Colombia is not unique, the Bank embarked in
1981 on an evaluation of secondary school curricula (known as the DiSCuS
study). Two countries have been chosen as research sites (Colombia and
Tanzania) on grounds of previous Bank involvement and time lapse since
implementation for project maturity. The study design is of the longitudinal
type (tracer study) in order to allow for proper control of individual and
background characteristcs (for a description of the study and the
questionnaires used see Psacharopoulos and Loxley, 1984a and 1984b). The
first instrument to collect baseline information was administered to a sample
of the 1981 graduating cohort while still in school. A follow-up of the same
persons took place in 1982.
Given the long inherent delays associated with longitudinal
studies, it was felt that the project could yield some early indications on
the labor market destination and performance of secondary school graduates by
introducing a pseudo-panel component to it. This was achieved as follows.
After the selection of the sample of schools and students for the 1981
cohort, addresses were obtained from the same school of the graduates of the
1978 class. A target sample of 2,000 such graduates from both INEM and
traditional schools was randomly selected from the school records and
attempts were made to locate the graduates for the administration of a
special questionnaire (see Annex 5). This questionnaire raised retrospective
information on the student's further education and occupational record
between 1978 and the Fall of 1981 when the interviews took place. The
questionnaire also raised information on the graduate's opinion regarding the
usefulness of the courses he has taken and included a battery of questions

pertaining to measure individual modernity. In fact, this questionnaire is a
hybrid of the student base questionnaire of the 1981 cohort and the graduate
follow-up questionnaire of the same cohort administered one year later. The
main block of information which is pragmatically missing regarding the 1978
cohort is the testing of students in particular subjects while they were in
the last class of secondary school.
The questionnaires were completed by personal interview at the
house of each selected graduate. In about 10 percent of the selected cases
the graduate was no longer living at the same home address reported in the
1978 school records. In such cases the interviewer moved to the next person
down the list who lived in the same locality until the target sample size was
reached. On this ground, the 1978 sample contains a potential unknown bias,
if those who emigrated between 1978 and the time of the interview in 1981
differed systematically in some characteristic relative to those who remained
behind. Speculating on the direction of the bias, it must have introduced
"flatter effects", on the assumption that those who emigrated have done so in
order to improve their position over the locally available alternatives.
Hypotheses To Be Tested
The main rationale for the diversification of the secondary
education in Colombia, and elsewhere, has been to provide a closer link
between the school system and the economy (Lillis and Hogan 1983). This
general proposition can be split into a number hypotheses that could be

tested with the available data. With reference to a control group of
non-diversified schools, we hypothesize that:
(a) Diversification leads to less private demand for post-secondary
education.
(b) Diversification leads to a higher rate of labor force participation
at the end of secondary education.
(c) Diversification leads to a better match between the field of
vocational specialization and actual employment.
(d) Diversification leads to lower unemployment (shorter job search).
(e) Diversification leads to higher earnings of graduates.
(f) Diversification is cost-effective in achieving any of the above
aims.
The Sample
Figure 1 shows a simplified structure of the Colombian educational
system. Primary school graduates who continue their education typically
split into three parallel schools at the secondary level: traditional
academic schools, vocational schools and INEMs. Vocational schools are
devoted to one area of specialization, e.g. agriculture or commerce during
the full six-year cycle. INEMs, however, offer a diversified curriculum, in

Figure 1: Illustrative Flow chart of the Colombian educational system.
Secondary
Vocational
1 2 3 4 5 Zy 6
(Industrial, Commercial, Agricultural,Social Services, Pedagogical)
Primary Academic University
Vocational Vocational OccupationalExploration Orientation Specialization
Note: The target group is shaded.

- 6 -
the sense of splitting the six year cycle into three distinct phases:
vocational exploration, vocational orientation and occupational
specialization. The latter can take place in five main areas: academic,
commercial, industrial, agricultural and social services. The target group
of the investigation was the population of the last year INEM students
(shaded area in Figure 1). Thus, the control for the academic track of INEM
was the mainstream academic secondary school (bachillerato clasico). The
controls for the industrial, commercial, agricultural and social services
INEM tracks were vocational schools specializing in the respective areas
(colegios univocacionales).

II. An Overview of the Data
The sample yielded a total of nearly 1,800 observations. The
distribution of the respondents across school types and subjects is shown in
Table 1. 1/
Table 1
Distribution of the Sample by School Type and Subject(Number of Graduates)
Subject School Type TotalINEM Control
Academic 181 277 458Commercial 184 181 365Industrial 213 156 369Agricultural 76 150 226Social Services 120 38 158Pedagogical - 250 250
Total 774 1,052 1,826
The Destination of Graduates
Table 2 compares the first destination of graduates to their status
three years later (1981) in terms of four categories: study only, study and
work, work only and other. The "other" category includes those who are not
participating in the labor force or are looking for work.
1/ The effective sample of INEM students corresponds to 14 percent of thetotal enrollment in such schools.

Table 2
First Destination and CurrentStatus of Graduates
(percent)
Activity First Destination CurrentUpon Graduation Status
(1978) (1981)
Study 26.3 28.8
Work and Study 26.2 22.1
Work 36.4 36.7
Other Than Above 11.1 12.4
Total 100 100
This table reveals a stability in the major activity distribution
of the cohort over a three year period and a surprising increase of those who
classify themselves as students. A cross-tabulation of first status against
current status (Table 3) shows that the stability of the marginal distri-
butions hides considerable mobility between activities during the three year
span. This variety of destinations is illustrated graphically in Figure 2.
Table 3
The Mobility of Graduates BetweenMajor Activities, 1978-1981
Current Activity, 1981Initial Study Work and Work Other TotalActivity, 1978 Study
Study 308 62 62 48 480
Work and Study 81 230 145 22 478
Work 69 98 419 79 665
Other Than Above 67 13 44 78 202
Total 525 403 670 227 1825 a/
Note: a/ There exists one missing observation regarding the initial status.

- 9 -
There are two points worth noting regarding the overall destination
of the cohort. First, those who are in a given state upon graduation (e.g.
work) would normally continue to be in the same state three years later.
Hence, by studying the initial destination of graduates one can predict a
great deal of their ultimate destination. Second, for those who continue to
study, a three years tracer is not enough to fully evaluate their performance
in the labor market.

- 10 -
Figure 2. Employment Patterns of the Whole Sample
First Destination, Current Status,1978 1981
Study 480 525
only (26.3%) - 2*" 308 (28.8%)
>~62
Study 81 403and 47840
Work 2 30
Graduating -(26.2%) (22.1%)Graduating 145 2
Cohort 22
N = 1826
6998 671
Work 665 > 6
only (36.4%) 79 (36.7%)
67
202 13 22744
Other (1.1) > 78 (12.4%)

- 11 -
Figure 3 (where the interperiod flows have been deleted) shows the
status of INEM and control graduates separately. It is difficult, on the
basis of these data, to reject the hypothesis that the INEMs have contributed
fewer high school graduates to the labor market than conventional schools.
More than 38 percent of the control students as compared to only 35 percent
of the INEM students were working in 1981. The difference is not dramatic
but, if at all, one would have expected it to go the other way around. The
result is maintained after including among the workers category those
individuals who combine work and study. Then conventional schools contribute
61.5 percent of their graduates to the labor market while INEMs only
contribute 55.8 percent of theirs.
- 12 -
Figure 3. Employment Patterns of INEM and Control Graduates
First Destinations, 1978 Current Status, 1981INEM Control INEM Control
Study 288 250 253 272only
(29.5%) (24.1%) (32.7%) (26.2%)
Study 200 278 162 241and
INEM ntrol Work (25.8%) (26.8% (20.9%) (23.2%1
774 1,038
(100%) (100%)
\ Work X 271 390 270 398
onl (35.0%) (37.6%) (34.9%) (38.3%)
75 120 89 .127
Other(9.7%) (11.6%) (11.5%) (12.2%)

- 13 -
Figures 4 and 5 show that the differences that exist between INEMs
and traditional schools are also present when the sample is divided by sex,
but clearly the most marked divergencies in the employment patterns occur in
the case of men, and in particular in the categories of graduates studying
only or working only. In 1981, 34.5 percent of male INEM graduates were
studying only, as compared to 25.6 percent of male graduates from traditional
schools - a difference of almost 9 percent between the two school types.
Concerning the "work only" category, the percentages are 36.4 for INEMs and
44.0 for control schools - a difference of almost 8 percent. For female
graduates, although the differences in these two categories go in the same
direction as for males, their magnitude is much smaller.

- 14 -
Figure 4. Employment Patterns of Male High School Graduates
First Destination, 1978 Current Status, 1981
INEM Control INEM Control
Study 143 105 165 121
only (29.9%) (22.2%) (34.5%) (25.6%)
Study 119 115 100 92and
Work (24.9%) (24.3%) (20.9%) (19.5%)
INEM Control
478 473
(100%) (100%)
\ Work \ 183 202 174 208
only (38.3%) (42.7%) (36.4%) (44.0%)
33 51 39 52Other
(6.9%) (10.8%) (8.2%) (11.0%)

- 15 -
Figure 5. Employment Patterns of Female High School Graduates
First Destination, 1978 Current Status, 1981INiEM Control INEM Control
Study 85 145 88 151
only (28.7%) (25.7%) (29.7%) (26.7%)
Study 8.1 163 62 .149and
Work (27.4%) (28.8%) (20.9%) (26.4%)
INEM Control
296 565
(100%) (100%)
Work 88 188 96 190
only (29.7%) (33.3%) (32.4%) (33.6%)
42 69 50 75Ot-her
(14.2%1 (12.2%) (16.9%) (13.3%)

- 16 -
Having shown the basic structure of the data under analysis, we now
proceed to investigate to what extent these data can help to reject or
otherwise the hypotheses detailed above. However, before entering into the
hypotheses themselves, we want to look more closely at the type of students
who have been attracted by INEM.

- 17 -
III. Who attends the INEMs?
The simple inspection of the data suggests that it is not clear
that INEMs have resulted in employment patterns widely different from those
generated by traditional schools. Nevertheless, it may be the case that
INEMs have managed to provide secondary education to students who typically
would not have had access to this educational level. If this is the case,
INEMs may have had desirable distributional effects. Here we cannot evaluate
these distributional effects because even if real, they will not manifest
themselves until later in the graduates' working life. But we can at least
look at the characteristics of INEM students and see to what extent they
differ from those of traditional schools.
The first two rows of Table 4 show indeed that INEM students come
from families which are poorer than those of control students. Both family
and father's income are more than 13% higher for control than for INEM
students. There must be important reporting errors in these two variables,
but there is no a priori reason that these should operate differently in the
two groups. Thus the comparison in Table 4 could be a reliable indicator of
the relative disadvantage of the two types of families. This is confirmed
by rows 3 and 4, which show that both parents of control students are better
educated than those of INEM students. The difference is not very large but
the ordering is consistent with that of family and father's income. The last
two rows show indicators of the students' academic background and perhaps
ability. The percentage of INEM students who repeated at least one year in

- 18 -
primary education is substantially larger than that of control students, but
when we consider repeaters in secondary education then INEM students do
better than control students. These two facts may suggest that INEM
students, although with a much worse primary education, are not worse than
control students in terms of ability and motivation. However, they could
also suggest that the INEMs are educationally much better than traditional
schools; according to these data the new schools have managed to lower
substantially the rate of repeaters relative to control schools, despite
having started with a student population which was apparently worse.
Table 4
Mean Socioeconomic Characteristics ByType of School
Characteristic INEM Control Overall
Father's monthly income (in pesos) 16,674 18,906 17,971
Family Income (in pesos) 26,426 29,921 28,440
Father's years of schooling 6.4 6.7 6.6
Mother's years of schooling 6.0 6.2 6.1
Repeater in primary education (%) 25.8 20.3 22.7
Repeater in secondary education (%) 15.9 24.6 20.9

- 19 -
Table 5 shows the distribution of students in INEM and control
schools by father's occupation. The first conclusion from these figures is
that there are certain differences in the two distributions. As compared
with control schools, INEMs seem to have a more homogeneous student
population in terms of its socio-economic background. More than 71% of INEM
student have fathers with occupation in the middle range of the status scale
(employees and professionals), while in control schools their percentage is
only 62%. At the two extremes of the scale, on the other hand, control
schools have relatively more students. 27.6% of control students have
fathers who are farmers or manual workers, while only 21.5% of INEM students
have fathers with these professions. Also, 10.3 of control students have
fathers who are business owners as compared to only 7.1% for INEM students.
Table 5
The Distribution of INEM and Control Students by Father's Occupation(percent)
Father's Occupation INEM Control Sample
Farmer 7.2 19.0 14.0
Manual worker 14.3 8.6 11.0
Employee 38.1 34.5 36.0
Professional 33.3 27.6 30.0
Business Owner 7.1 10.3 9.0Total 100.0 100.0 100.0
The figures in Table 4 suggest that the possible equity effects
that INEMs may have had are weaker than those that would be inferred by the
mean comparison of Table 4. The distribution in terms of socio-economic
background is different, but this difference only affects the center of

- 20 -
distribution. INEMs do not seem to have had much impact in attracting
farmer's or business owner's sons. It may be presumed that the farmers are
still largely located at the lower end of the quality scale of traditional
schools, and the later at the upper end.
Another significant difference concern the proportion of males that
attend INEMs. Overall, 61.8% of INEM students are males as compared to only
45.1% in control schools. This might be attributed to the fact that Pedagogy
(a largely female-attended specialty) is not taught in INEMs. But as
Table 6 shows, with the exception of Industrial students, all other subjects
have a higher proportion of males in INEMs than in conventional schools. The
difference is particularly large (more than double) in Academic and
Commercial studies, and less important in Agricultural and Social Services.
We thus conclude that relative to control schools, INEMS are largely attended
by males. 2/
2/ These results are largely maintained when the influence of all thesefactors is jointly taken into account. A logit analysis of theprobability of attending INEMs confirmed that INEMs are significantlymore attended by males and urban residents in cities of relatively highper capita income. Residents from large cities and secondary schoolrepeaters tended to attend conventional schools and relatively to sonsof farmers those who attended INEMs most were, in order of importance,sons of employees, manual workers and professionals.

- 21 -
Table 6
Male Proportion by Type of School and Subject(percent)
Subject INEM Control Sample
Academic 69.6 30.3 45.9
Commercial 38.6 17.7 28.2
Industrial 96.2 98.1 97.0
Agricultural 89.5 84.0 85.8
Social Services 6.7 2.6 5.7
Pedagogical - 31.2 31.2
Overall 61.8 45.1 52.1

- 22 -
IV. The Demand for Post-Secondary Education
The Colombian education system allows anyone holding a "bachiller"
degree to pursue further education. In the middle of the 1970s, INEM degrees
were recognized as such. This implies that INEM and non-INEM graduates have
the same possibilities of continuing on to post-secondary education. But
since INEM graduates have achieved some working skills that non-INEM students
do not have, it is possible to expect them to go to the labor market in a
higher proportion than non-INEM graduates. In addition, each INEM's
specialization was created to supply adequate labor force to those areas the
Colombian economy presumably needs the most. Therefore, INEM graduates are
expected to work in their area of specialization or to do further studies in
that area, while non-diversified secondary school graduates are more likely
to continue on to post-secondary education.
At the time of interview (1981) 50.8 percent of the sample reported
they were studying full-time or part-time. There are significant differences
in the probability of being a student in 1981, depending upon the type of
school attended or the subject followed in school. As shown in Table 7, INEM
students of the academic stream are the most likely to be studying three
years after graduation from secondary school relative to any other category
(3 out of 4). Those having the smallest probability of being students in
1981 are agricultural graduates of non-INEM schools (only 1 out of 5).
- 23 -
Table 7
Percent Of Respondents Studying in 1981By School Type And Subject
(percent)
Subject INEM Control Sample
Academic 75.1 53.7 62.2
Commercial 44.0 59.7 51.8
Industrial 51.6 48.0 50.1
Agricultural 44.7 20.0 28.3
Social Services 45.0 58.3 47.2
Pedagogical - 54.8 54.8
Overall 53.6 49.4 51.2
Table 8 shows the percentage of the 1978 cohort who in 1981 were
studying full-time, by school type and subject. INEM graduates of the
academic stream are again the ones with the highest likelihood of being
full-time students in 1981. They represents 56% of all those who followed
academic studies, while the corresponding percentage for control students is
only 38%. Agriculture is another subject where the difference between INEMs
and control school is marked. Of those INEM graduates who followed
agricultural studies more than 35% were studying full time in 1981 as
compared to only 15% for control students. In the other subjects of study
the difference goes in favor of traditional schools but the gap is not very
large. Overall the proportion of INEM graduates who ended up studying full

- 24 -
time is almost 7 percentage points larger than that of graduates from
traditional schools. It is interesting to note, however, that although
control schools seem to be sending a smaller proportion of their graduates to
further education, the quality of the education they obtain is not
necessarily worse than that received by INEM graduates. In particular, the
proportion of control students who in 1981 were enrolled in the best six
universities of Colombia was 6.7 percent, while the corresponding proportion
for INEM students was 6.1 percent. 3/
Table 8
Percent of Respondents Studying Full Time in 1981by School Type and Subject
(percent)
Subject INEM Control Sample
Academic 55.8 37.5 44.8
Commercial 17.9 25.4 21.6
Industrial 29.1 30.1 29.5
Agricultural 35.5 14.7 21.7
Social Services 25.0 25.0 25.0
Pedagogical - 18.8 18.8
Overall 32.7 26.2 29.0
3/ The best six universities are taken to be: Universidad Nacional deBogota, Universidad de los Andes, Universidad de Antioquia, Universidaddel Valle, Universidad Industrial de Santander and UniversidadJaveriana.

- 25 -
These figures seem to reject hypothesis (a) above. It is not clear
that diversification leads to less private demand for post-secondary
education. But Tables 7 and 8 do not control for factors other than subject
of study which may differ between INEMs and traditional schools, and which
could explain the higher rate of enrolment into full-time education of INEM
graduates. In order to isolate the effect of school type and subject, we
take into account the influence that other factors may also have on the
probability of being a full time student.
We estimate this probability in terms of a binary choice between
the alternative "Student Only" on the one hand, and the other three
alternatives - "Study and Work", "Work Only" and "Other" - on the other
hand. 4/ The individual's choice between these two alternatives will depend
4/ This is not the only way in which this problem could be approached. Themost general would consist in investigating the factors that at thegraduation point make people choose one of the four alternatives shown inFigure 2 above, and then, subject to this first decision, to find out whatdetermines the second choice that leads to the current individual'sposition. This way of posing the problem (which is discussed in moredetail in Annex 1) has the advantage of emphasizing the possibility ofstate dependency that may exist in the data. Other things equal, theprobability of, say, being a worker in 1981 should be higher if a personwas a worker in 1978 than if this was not the case. The procedure,however, in addition to requiring the use of multiple choice models (suchas multinomial probits or logits), could be hampered by the small samplecells on which some of these probabilities would have to be estimated.Even when using much more aggregated choices, we have found that thedistribution of missing observations in the present set of data reducesvery rapidly the available size. We thus propose to concentrate only onthe determinants of the 1981 position, and to model the individual'sbehavior in terms of only binary choices. The first requirement may notbe very stringent in the light of the stability over time of employmentstatus that the data show (see Figure 2). The second simplificationcould be more problematic because it will force us to bring togetheraltenatives which are not necessarily homogeneous, but given thecharacteristics of the data there is little scope for narrower definitionsthan the ones used below.

- 26 -
on a comparison of the net benefits associated to each of them. In this
particular case this comparison involves evaluating whether it is worthwhile
for the individual to postpone his (or her) entrance into paid work in
exchange for higher expected earnings after finishing post-secondary
studies. One way of modelling this choice would be to have a model of income
determination for each of these two alternatives and for each individual, and
to see the extent to which the discounted value of the net benefits
associated to each alternative was a relevant factor. Here, given the nature
of the data, we cannot use such a model. As we shall see below, we can
identify certain elements of the earnings structure associated to the working
alternative, but we do not know the factors determining post-university
income as our sample does not include information on this. So we approach
the problem in terms of a reduced-form framework, entering into the model not
the net benefits associated to each alternative, but the more basic
variables, like education and personal characteristics, which are likely to
determine these benefits. This of course does not allow us to identify
income elasticities for each of the relevant decisions, but in the context of
our problem this is not a severe limitation since our main objective is not
so much to identify these income elasticities as to evaluate whether and to
what extent the type of school from which an individual has graduated has any
influence on employment status.
The model used is described formally in Annex 2. Essentially, we
want to investigate which factors determine the probability that an
individual chooses to study (i.e., chooses to "Study Only") as opposed to
work (i.e., chooses to "Study and Work", "Work Only" or the "Other"
alternative). In additon to the 10 school type-subject of studies set of

- 27 -
dummies, we consider the following variables. 5/ First, a set of school and
locational variables. The attractiveness of further study will be positively
related to the quality of primary and secondary education, thus it is
important to consider explicitly variables that proxy educational quality.
We are only able to use information on whether the school is private or
public, and on whether it is rural or urban. Other available quality indices
such as student-teacher ratios, school expenditure per student etc., were
omitted because, due to missing values, their presence reduced to
unacceptable levels the sample size. Locational variables, such as the
economically active population and per capita income, are included to pick up
characteristics of the local labor market and therefore capture possible
demand forces which would make the "Work" alternative more attractive than
the "Study" alternative.
Then we consider a set of personal and family characteristics.
Age is likely to be an important variable; the older the individual is the
shorter the period of time over which he (or she) can recover the benefits of
further educational investments, and thus the more likely that he (or she)
will choose to work. Place of birth and years of residence are included to
capture possible effects that information on local labor markets may have on
the choice of whether to work or not. Repetition of years in either primary
or secondary school should indicate lack of individual academic ability and
thus favor the chances of work. Among family characteristics we include
parents schooling to proxy individual's ability and/or borrowing capacity;
5/ Note that all the variables included give information prior to the choicebeing investigated. That is, we do not include variables such asexperience or hours of work because, although relevant to thedetermination of earnings, they would introduce endogeneity in the presentanalysis.

- 28 -
father's vocational training to capture possible intergenerational inertia in
employment status; and father's occupation to capture both this type of
inertia and/or family wealth and borrowing capacity.
Table 9 shows for males and females separately the effect that
these variables have on the probability of studying. Variables with a
positive sign increase, and those with a negative sign decrease, the
probability that an individual will choose study only as his (or her)
preferred alternative. The table only shows the coefficients of these
variables on the vector determining the cut-off level of the probability
distribution; the actual effect on probabilities will be discussed below.

- 29 -
Table 9
Determinants of the Probability of "Studying Only"
Variable Male FemaleCoefficient (t) Coefficient (t)
Constant 3.736 (3.10)* -1.237 (5.83)*
Educational variables**
INEM x Academic 1.089 (4.31)* 1.209 (3.82)*INEM x Commercial -0.362 (1.11) 0.165 (0.59)INEM x Industrial 0.278 (1.23) -INEM x Agricultural 0.314 (1.14) 1.115 (1.72)INEM x Social Service 0.708 (0.67) 0.419 (1.51)
CONTROL x Academic 0.159 (0.59) 0.548 (2.30)*CONTROL x Commercial -0.113 (0.36) 0.182 (0.73)CONTROL x Industrial 0.128 (0.54) 0.381 (0.45)CONTROL x Agricultural 0.058 (0.16) -CONTROL x Social Services - - 0.823 (2.13)*
School and locational variables
Private secondary school 0.270 (0.95) -0.028 (0.12)Urban secondary school -0.106 (0.48) -0.645 (2.39)*Proportion active population
in city -1.969 (0.82) 4.152 (1.11)Per-capita city income 0.000 (0.38) 0.001 (2.04)*
Personal and family characteristics
Age -0.195 (5.21)* -0.137 (2.14)*Urban born -0.120 (0.60) -0.334 (1.32)Years resident in city -0.000 (0.04) 0.006 (0.37)Primary repeater -0.039 (0.26) 0.058 (0.31)Secondary repeater -0.044 (0.30) -0.310 (1.58)Father's years of schooling 0.019 (0.95) -0.003 (0.13)Mother's years of schooling 0.004 (0.16) -0.019 (0.68)Father had vocational training 0.116 (0.98) -0.001 (0.00)Father's occupation***
Manual Skilled - -Non-Manual 0.155 (1.19) 0.146 (0.95)Professional 0.402 (1.82) 0.007 (0.03)
Log likelihood -351.3 -243.0N 659 472
Mean sample probability 0.30 0.26
* Statistically significant at the 5 percent level** Excluded category, CONTROL x Pedagogy. A dash indicates that the cell
number of observations was too small to allow the inclusion of thevariable.
* Excluded category, Manual Unskilled. A dash indicates that the cellnumber of observations was too small to allow the inclusion of thevariable.

_ 30 -
Age is an important determinant for both men and women, and takes
the expected negative sign; the older a person is, the lower the probability
that he (or she) will engage in full-time study after secondary education.
Males whose father is a professional have a higher probability of studying
than those whose father has a manual unskilled occupation (significant at the
10 percent level), urban schools appear to decrease the probability of
studying of female graduates, and finally per capita income in the city tend
to increase this probability. Among the educational dummies INEM x Academic
is the most important, significantly increasing the probability of full-time
study for both men and women. CONTROL x Academic and CONTROL x Social
Services also increase this probability (with respect to Pedagogy) but are
only significant in the case of women.
How significant are the differences betwen INEM's and traditional
schools spotted in Table 9? We answer this queston by reestimating again
these probits but now restricting the INEM and CONTROL coefficients in the
educational set of dummies to have the same value. (These estimates are not
shown as they are very similar to those in Table 9). If the restriction is
accepted then the hypothesis that INEMs have no differential effect cannot
be rejected. We test the restriction by means of a likelihood ratio which
turns out to be 16.2 for men and 10.4 for women. If the likelihood ratio
exceeds the critical value 11.1 then the restrictions are not accepted and
vice versa. 6/ Thus, the equality restriction is rejected for men and
6/ The likelihood ratio R is defined as R = -2 [log likelihood restrictedregression - log likelihood unrestricted regression3. It is distributedas a chi-square with 5 degrees of freedom, with a critical value at the5 percent level of 11.1.

accepted for women. Thus, statistically speaking, we conclude that INEM's
have a positive differential effect on the probability of studying in the
case of male graduates, but not in the case of female graduates.
In the light of the results obtained in Table 9, this conclusion
may appear surprising, but there is an easy explanation for it. The
likelihood ratio test is a joint test of the differences of coefficients
between INEM variables and their corresponding control counterparts. It is
perfectly possible to have sigfnificant differences across subjects, as is
the case with women, and yet not to be able to establish for each subject a
difference depending on whether that subject has been studied in an INEM or
in a traditional school. In the case of women, the differences across three
subjects are significant but those across type of school are not. In the
case of men there is only one significant difference across subjects -
Academic -, but this is also significant across type of school.
The coefficients in Table 9 have a difficult interpretation as
they are only indirectly linked to the probability concept. So, in Table 10
we present a summary of the results in terms of the effects the different
educational variables have on the corresponding probability. The probabil-
ities are calculated for a typical individual who, other than the type of
school and the subject of study, which will vary, has the following
description. The individual studied in a public secondary school which was
located in an urban centre with 36.4 percent of active population and 1,595
Colombian Pesos per month per capita. He (or she) was born in a city, is 22
years old, resident in his (or her) current city for 18 years, had not
repeated any year in primary or secondary school, his (or her) parents had 10

- 32 -
years of schooling each and finally his (or her) father had not received
vocational training and is in a manual skilled occupation.
Looking first at men we see that the typical individual's
probability of studying would be much larger if his academic studies had been
done in an INEM than if they had been done in a traditional school (42.9
percent as compared to 13.4 percent). The same is true of the typical
woman. She would have a probability of studying of only 4.6 percent if she
had done her academic studies in a traditional school, and of 15.2 percent if
she had done them in an INEM. This is probably the most important and
clear-cut result of this exercise. INEM students in the academic curriculum
have a significantly greater propensity to go on studying after graduation
than their counterparts from traditonal schools.

- 33 -
Table 10
The Effect of School Type and Subject of Study on the Probability of"Studying Only"
(percent)
Subject Men WomenINEM Control INEM Control
Academic 42.9* 13.4 15.2* 4.6*
Commercial 5.2 8.4 1.9 2.0
Industrial 16.1 12.7 1.3 3.2
Agricultural 17.1 11.3 13.1+ 1.3
Social Services 28.8 10.2 3.4 7.9*
Pedagogy - 10.2 - 1.3
Notes:1. These probabilities are calculated for an individual whose secondary
school was public and located in an urban centre with 36.4 percent ofactive population and 1,595 Colombian Pesos per month per capita. Theindividual was born in a city, was 22 years old, had resided in his (orher) current city for 18 years, had not repeated any year in primary orsecondary school, his (or her) parents had 10 years of school each, his(or her) father had not received vocational training and was a manualskilled worker.
2. (*) Significantly different (5 percent level) from the probability for anindividual specializing in Pedagogy. (+) significantly different (10percent level) from the probability for an individual specializing inPedagogy.
The table shows other interesting results. Except for commercial
studies, INEM male graduates have a higher probability of studying than
control students in all other aspects. This, together with the strong
difference in the academic curriculum, explains the significance of the joint
test described above. In the case of women the results are not so clear, and
in one instance - Social Services - the probability of studying among control
students is greater than that of INEM students.

- 34 -
The hypothesis that diversification reduces the demand for
post-secondary education is clearly rejected by the data. In the case of
women, the most favorable instance for the hypothesis, we cannot identify
any significant overall difference between diversified and non-diversified
schools. But in the case of men we find a statistically significant
difference and this goes the other way around. Diversified schools increase
rather than reduce the demand for post-secondary education.
It is difficult to interpret what this finding means without a more
detailed knowledge of the characteristics of INEM and traditional schools.
A possible interpretation is that INEMs are failing in achieving one of the
basic aim for which they were crated: to supply people to the labor market at
a higher rate than had been done by the traditional school system. But this
is not the only possible view. INEMs are new schools provided with better
and newer inputs than regular public and private schools, and this could have
meant an output of higher quality and thus equipping the graduate with a
comparative advantage over control students to pursue higher education.

- 35 -
V. Further Training
Out of the 1,826 respondents, 800 had undertaken a certain amount
of further training between graduation and the time of the interview. Most
of these 800 people were now either "working only" (43.5 percent) or "working
and studying" (25.0 percent). But there were also some of them who at the
time of the interview were "studying only" (19.0 percent) or in the "other"
category (12.5 percent).
Most of this further training takes place in SENA (Servicio
Nacional de Aprendizaje - National Apprenticenship Service), in Technical
Institutes, in Firms and in Universities. The rest takes place in other
centers which can be both private and public. Table 11 shows the
distribution of students undertaking training in these different places, by
school type.
Table 11
Location of Post-Secondary School Training by School Type(percent)
Training Location INEM Control
SENA 47.3 37.9
Technical Institute 29.1 25.8
Firm 9.0 9.8
University 4.2 5.1
Other 10.4 21.4
Total 100.0 100.0
- 36 -
One of the often stated aims of diversified schools is to enhance
the propensity of the student towards further training in the area of his/her
specialization. So, it is important to investigate the extent to which INEMs
performed better than traditional schools in this respect, and the degree of
consistency between field of specialization and training among INEM and
control students.
The average length of further training in 19.7 weeks for INEM
graduates and 12.8 weeks for conventional school graduates. Therefore, the
data seem to confirm the presumption that INEMs do better than control
schools in this respect. Table 12 shows that this advantage is quite
general, with INEM graduates undertaking more training than control graduates
whatever the field of specialization. However, except for commercial and
social services studies, the difference is not very great. These results are
largely maintained when the comparison is adjusted for other factors through
regression analysis. Then the average length of further training for INEMs
is 19.9 weeks and that of control schools 13.1 weeks. The difference in
school type and subject are the main explanatory variables.
The figures shown in Table 12 are the averages of weeks of training
calculated over both those who undertake and those who do not undertake
training. They therefore reflect the true extent of the difference that
exist between INEMs and control schools in this respect. It is interesting,
however, to discern whether this difference is due to more graduates
undertaking training or to a greater length of the duration of training among
those who choose to undertake training.

- 37 -
Table 12
Unconditional Mean Duration of Post-Secondary School TrainingBy Type of School and Subject
(weeks)
Subject INEM Control Sample
Academic 18.3 17.3 17.7
Commercial 22.3 15.2 18.7
Industrial 16.3 14.4 15.5
Agricultural 8.9 6.9 7.6
Social Services 30.7 15.6 28.2
Pedagogical - 8.3 8.3
Overall 19.7 12.8 15.7
Table 13 shows again the mean duration of training, but now only
for those who actually undertook training. It also shows the proportion of
graduates of each subject who undertook training. The results suggest that
INEMs advantage over control schools is maintained, and that this advantage
is due not so much to the fact that relatively more INEM graduates undertake
training (the difference here is relatively small), but to the fact that
among those who choose further training, the length is much longer for INEM
than for control graduates (42 weeks as opposed to 29 weeks). Except for
commercial studies, the proportion of students taking further training is
always greater for control schools than for INEMs. But this is clearly
compensated by the much longer duration of the courses taken by INEM
graduates, again with the exception of commercial studies where the mean
length of courses is very similar.
- 38 -
Table 13
Conditional Mean Duration of Post-Secondary School Trainingand Proportion of Graduates Undertaking Training
by School Type and Subject
Subject Weeks of Training Proportion Undertaking TrainingINEM Control INEM Control
Academic 45.0 37.0 40.7 46.7
Commercial 42.3 41.0 52.8 37.1
Industrial 43.2 37.4 37.8 38.6
Agricultural 25.6 14.2 34.7 49.0
Social Services 44.8 20.8 68.7 75.0
Pedagogical - 19.6 - 42.5
Overall 42.4 29.2 46.4 43.8
A piece of revealing evidence about the nature of INEMs is given by
the extent to which their graduates undertake pre-university courses. A
pre-university course is usually a short term course (less than a year)
destined to prepare secondary school graduates for university entrance
examination, and consists of a review of topics which are relevant for the
first year of a university degree. These are courses of essentially a
remedial character and it is interesting to note, as Table 14 shows, that
INEM Academic graduates undertake these courses to a significantly lower
extent than control Academic graduates. This, together with the fact
analyzed above that INEM Academic graduates attend university in a larger
proportion than control Academic graduates, reinforces our previous
presumption about the higher educational quality of INEMs.

- 39 -
Table 14
Proportion Having Taken Pre-University Courses(percent)
Subject INEM Control Sample
Academic 9.9 14.1 12.5
Commercial 8.7 12.2 10.4
Industrial 8.0 5.8 7.1
Agricultural 11.8 6.0 8.0
Social Services 12.5 7.9 11.4
Pedagogical - 12.8 12.8
Overall 9.7 10.8 10.4
Finally, Table 15 shows the extent to which field of specialization
and further training are matched for INEM and control graduates. The overall
degree of matching is fairly good. Leaving aside education, which is an area
of training in which all subjects of study are well represented, we tend to
find that there is a certain congruence between what a graduate studied and
his or her further training. For instance, graduates from commercial
subjects tend to do further training in Economic and Business Administration,
while those from industrial subjects concentrate in Engineering. The degree
of matching is of course not perfect but it clearly differs from a random
allocation. The data also show that, particularly in those subjects of
specialty where the degree of congruence is highest (Commercial and
Industrial), the differences between INEMs and control schools are not very
important.

- 40 -
Table 15
The Relationship Between Secondary SchoolSubject And Post-Secondary Specialization
By School Type(percent)
Secondary School Subject
Academic Commercial Industrial Agricult. SocialServices
Post-Secondary I C I C I C I C I CSpecialization
Econ.,Bus.Adm. 20 24 50 50 8 3 6 14 17 50
Health Sciences 8 11 1 12 3 4 6 3 17 0
Education 16 22 10 5 12 11 29 24 32 29
Arch.,Fine Arts 4 5 0 5 12 8 0 0 0 0
S.Sc.,Humanities 14 15 21 17 6 4 0 21 24 14
Sciences 3 4 0 2 8 9 0 3 2 0
Law 8 7 10 6 3 3 10 3 4 0
Agr. Sciences 11 3 0 2 1 4 24 10 0 0
Engineering 16 8 4 3 38 44 27 17 6 7
Other 0 2 4 0 0 0 0 3 0 0
Total 100 100 100 100 100 100 100 100 100 100
Note: I = INEM, C - Control

- 41 -
VI. Labor Force Participation
We turn now to the differential influence that INEMs may have had
over traditional schools on labor force participation. To some extent this
question has already been investigated in Section IV above, when analysing
the determinants of the choice between the alternatives "studying" and "not
studying". The problem is that there we focussed our attention on the first
of these two alternatives, and included in the second, types of status which
were quite different among themselves. Here we want to define the working
status in a more homogeneous fashion and see what factors determine whether
or not a graduate will choose to work.
The first issue we have to deal with is the definition of labor
force participation. If we define a labor market participant as an
individual who is either working (full or part-time) or looking for work, we
find that 70% of the respondents belong to this category. The distribution
of participants by school type and subject of study is given in Table 16.
There are less labor force participants among those who studied at INEMs,
67.4%, then among those who studied at conventional schools, 73.0%. This is
consistent with the results obtained in Section IV, where we saw that the
demand propensity for higher education was higher for INEM than for control
graduates. Control students have much higher participation rates in
Academic, Agriculture and Social Services Studies and slightly lower
participation rates in Commerce and Industry.

- 42 -
Table 16
Labor Force Participation Rates in 1981Colombia 1978 Cohort
(percent)
Subject INEM Control Sample
Academic 49.2 61.4 56.6
Commerce 79.4 74.6 77.0
Industry 73.7 72.4 73.2
Agriculture 63.2 78.7 73.5
Social Services 68.3 79.2 67.1
Pedagogical - 81.2 81.2
Overall 67.4 73.0 70.4
The problem with this concept of labor force participation is that
it includes people who may be in very different circumstances. At the early
stages of a working life, it is not surprising that people see themselves as
not settled, and thus as looking for a job, whatever their actual status. To
remedy this, we show in Table 17 a more strictly defined measure of labor
force participation: the proportion of respondents who in 1981 were working
either full or part time. We find that only 58.8% of the sample belong to
this category, and that control graduates maintain their advantage with a
participation rate of 61.6% as compared to only 55.8% for INEM graduates.
The differences across subject of study are now uniform, with control
graduates never showing a lower work propensity than INEM graduates in all
subjects of study.

- 43 -
The differences shown in Table 17 could be due to the variation of
factors other than school type and subject of study. So we need to
standardize for these factors in order to reach a clearer picture of the
isolated influence of diversified schools. We approach the problem by means
of a probit analysis similar to that presented in Section IV above, when
analyzing the demand for post-secondary education. The binary choice in this
case is between working ("Study and Work" or "Work Only") and not working
("Study Only" or "Other"), and the variables considered are the same as those
described in Section IV. Table 18 shows the results obtained.
Table 17
Probability Of Working In 1981By School Type And Subject
(percent)
Subject INEM Control Sample
Academic 37.0 46.2 42.6
Commercial 66.9 66.9 66.9
Industrial 62.9 66.7 64.5
Agriculture 50.0 58.0 55.3
Social Services 58.3 66.7 56.3
Pedagogical - 73.2 73.2
Overall 55.8 61.6 58.8

- 44 -
Table 18
Determinants of the Probability of"Studying and Working" or "Working Only"
Variable Male FemaleCoefficient (t) Coefficient (t)
Constant -4.904 (4.13)* -1.723 (0.89)
Educational variables**
INEM x Academic -0.939 (3.87)* -1.342 (4.48)*INEM x Commercial 0.111 (0.40) -0.675 (2.87)INEM x Industrial -0.235 (1.12) -INEM x Agricultural -0.410 (1.62) -1.356 (2.42)*INEM x Social Service -0.422 (0.39) -0.632 (2.56)*
CONTROL x Academic -0.160 (0.64) -0.785 (3.72)*CONTROL x Commercial 0.229 (0.75) -0.305 (1.42)CONTROL x Industrial -0.007 (0.03) -0.344 (0.39)CONTROL x Agricultural -0.189 (0.61) -0.564 (1.35)CONTROL x Social Services - - -0.432 (1.14)
School and locational variables
Private secondary school -0.301 (1.10) -0.223 (1.15)Urban secondary school -0.133 (0.68) 0.054 (0.24)Proportion active population
in city 5.219 (2.30)* -1.415 (0.49)Per-capita city income 0.000 (0.70) 0.000 (0.65)
Personal and family characteristics
Age 0.147 (4.33)* 0.120 (2.43)*Urban born 0.029 (0.16) 0.210 (0.95)Years resident in city -0.003 (0.28) -0.014 (1.05)Primary repeater -0.014 (0.11) 0.163 (1.05)Secondary repeater 0.019 (0.15) -0.108 (0.65)Father's years of schooling -0.011 (0.59) 0.005 (0.23)Mother's years of schooling 0.011 (0.55) -0.023 (0.89)Father had vocational training 0.007 (0.06) 0.151 (1.15)Father's occupation***Manual Skilled - 0.154 (0.14)Non-Manual -0.146 (1.21) 0.056 (0.05)Professional -0.321 (1.53) 0.111 (0.10)
Log likelihood -407.4 -298.6N 659 472
Mean sample probability 0.60 0.58
* Statistically significant at the 5 percent level** Excluded category, CONTROL x Pedagogy. A dash indicates that the cell
number of too small to allow inclusion of variable.* Excluded category, Manual Unskilled. A dash indicates that the cell
number was too small to allow inclusion of the variable.

- 45 -
For males, with the exception of Commercial studies, all other
subjects are associated to a lower probability of work than Pedagogy (the
base category), but in general the differences are not significant. Only
male INEM graduates from Academic studies have a significantly lower
probability of work than Pedagogy graduates. Among the school or locational
variables the only significant variable is the proportion of active
population in the city which has the expected positive effect. Age also
shows the expected positive effect on the probability of work and is strongly
significant. The other variables are in general working in the expected
direction but their effect is statistically negligible (with the possible
exception of "Father's Occupation Professional", which is almost significant
at the 10 percent level).
The results for women are similar as regards to the non-educational
variables, with only age exerting a significant effect, but are much better
determined in the case of the school type-subject set of dummies. All
specialties are associated with a lower probability of work than Pedagogy,
and significantly so in the case of INEM's. In the case of traditional
schools only the Academic curriculum exerts a significant negative effect.
Despite being more narrowly defined than labor force participation
the choice modelled in Table 18 could still be too heterogenous. In Table 19
we correct this somewhat, by concentrating on the determinants of the
probability of "Working Only". That is, the probability that in 1981 an
individual will be observed in that category as opposed to the other three
alternatives. The results are consistent with those in Table 18 but, at

- 46 -
least for men, the new choice seems much more relevant than the one modelled
before. Now we are able to spot five significant differences on the
educational set of dummies. The most interesting finding is that while the
probability that Academic INEM graduates will be "Working Only" in 1981 is
significantly smaller than that for Pedagogy graduates, the corresponding
probability for Academic graduates from conventional schools is
significantly larger. For women the differences spotted earlier disappear
somewhat, which indicates that whether they graduate from INEMs or not may
have an influence on choosing work and study combined, but not on choosing
the alternative "Work Only".
We reestimated again the probits in Tables 18 and 19 but
restricting the INEM and control coefficients in the educational set of
dummies to be equal, in order to test whether the differences between INEMs
and conventional schools are significant. The likelihood ratios for the
choice specified in Table 18 are 12.8 for men and 8.6 for women, and those
for Table 19 are 32.4 for men and 5.8 for women. We again have as when
analyzing the choice between "Studying" and "Not Studying", that the equality
restriction is rejected for men and accepted for women. Therefore, we
conclude that INEMs have a negative effect on the probability of working of
male graduates which is statistically significant. For female graduates, on
the other hand, the data reject the hypothesis that INEMs have any
differential effect on employment status.

- 47 -
Table 19
Determinants of the Probability of "Working Only"
Variable Male FemaleCoefficient (t) Coefficient (t)
Constant -5.995 (4.84)* -4.142 (2.26)*
Educational variables**
INEM x Academic -0.678 (2.37)* -0.447 (1.44)INEM x Commercial 0.633 (2.31)* -0.068 (0.28)INEM x Industrial 0.152 (0.71) -INEM x Agricultural 0.288 (1.15) -0.304 (0.57)INEM x Social Service 0.510 (0.38) 0.119 (0.46)
CONTROL x Academic 0.525 (2.09)* -0.300 (1.35)CONTROL x Commercial -0.044 (0.13) 0.171 (0.76)CONTROL x Industrial 0.576 (2.58)* 0.976 (1.31)CONTROL x Agricultural 0.612 (2.00)* 0.395 (0.98)CONTROL x Social Services - - -0.393 (1.13)
School and locational variables
Private secondary school -0.259 (0.91) -0.034 (0.17)Urban secondary school -0.084 (0.43) -0.041 (0.17)Proportion active population
in city 5.322 (2.40)* -1.735 (0.58)Per-capita city income 0.000 (0.70) 0.000 (0.34)
Personal and family characteristics
Age 0.155 (4.26)* 0.208 (4.16)*Urban born -0.044 (0.25) 0.042 (0.21)Years resident in city -0.000 (0.03) -0.004 (0.28)Primary repeater -0.060 (0.46) -0.024 (0.16)Secondary repeater -0.056 (0.42) -0.121 (0.71)Father's years of schooling 0.027 (1.41) -0.003 (0.11)Mother's years of schooling -0.034 (1.77) -0.038 (1.51)Father had vocational training -0.112 (0.96) 0.053 (0.38)Father's occupation***Manual Skilled - 0.057 (0.07)Non-Manual -0.184 (1.52) 0.021 (0.02)Professional -0.449 (2.02)* 0.241 (0.27)
Log likelihood -394.5 -279.4N 659 472
Mean sample probability 0.41 0.34
* Statistically significant at the 5 percent level** Excluded category, CONTROL x Pedagogy. A dash indicates that the cell
number of too small to allow inclusion of variable.* Excluded category, Manual Unskilled. A dash indicates that the cell
number was too small to allow inclusion of the variable.

- 48 -
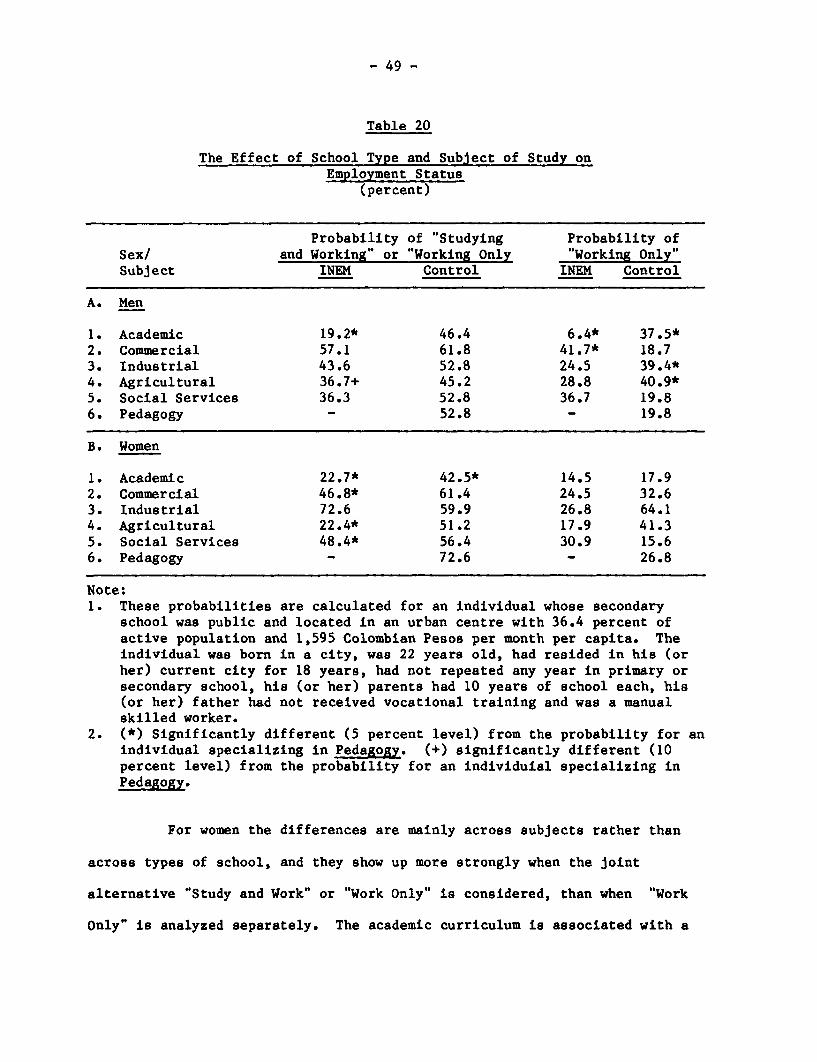
Finally, we show in Table 20 the predicted probabilities of work
which are implied by the results in Table 18 and 19. These probabilities are
calculated for a typical individual who has the same characteristics as those
defined in Table 10 of Section IV. Looking first at men we see that the
typical individual's probability of "Working Only" would be much smaller if
his academic studies had been done in an INEM than if they had been done in a
traditional school (6.4 percent as compared to 37.5 percent). This is
consistent with the results found in Section IV above. There we calculated
that for this individual the probability of "Studying Only" was much larger
if the academic curriculum had been followed in an INEM than if it had been
followed in a traditional school (42.9 percent as opposed to 13.4 percent).
So that result together with the ones reported in Table 20 confirm the
conclusion that INEM graduates, except if they had specialized in commercial
studies, have a lower probability of "Working only", and a higher probability
of "Studying Only", than graduates from traditional schools. In the case of
commercial studies, on the other hand, INEM graduates are more likely to
concentrate on full-time work than graduates from conventional schools (a
41.7 percent probability as compared to a 18.7 percent probability).
- 49 -
Table 20
The Effect of School Type and Subject of Study onEmployment Status
(percent)
Probability of "Studying Probability ofSex/ and Working" or "Working Only "Working Only"Subject INEM Control INEM Control
A. Men
1. Academic 19.2* 46.4 6.4* 37.5*2. Commercial 57.1 61.8 41.7* 18.73. Industrial 43.6 52.8 24.5 39.4*4. Agricultural 36.7+ 45.2 28.8 40.9*5. Social Services 36.3 52.8 36.7 19.86. Pedagogy - 52.8 - 19.8
B. Women
1. Academic 22.7* 42.5* 14.5 17.92. Commercial 46.8* 61.4 24.5 32.63. Industrial 72.6 59.9 26.8 64.14. Agricultural 22.4* 51.2 17.9 41.35. Social Services 48.4* 56.4 30.9 15.66. Pedagogy - 72.6 - 26.8
Note:1. These probabilities are calculated for an individual whose secondary
school was public and located in an urban centre with 36.4 percent ofactive population and 1,595 Colombian Pesos per month per capita. Theindividual was born in a city, was 22 years old, had resided in his (orher) current city for 18 years, had not repeated any year in primary orsecondary school, his (or her) parents had 10 years of school each, his(or her) father had not received vocational training and was a manualskilled worker.
2. (*) Significantly different (5 percent level) from the probability for anindividual specializing in Pedagogy. (+) significantly different (10percent level) from the probability for an individuial specializing inPedagogy.
For women the differences are mainly across subjects rather than
across types of school, and they show up more strongly when the joint
alternative "Study and Work" or "Work Only" is considered, than when "Work
Only" is analyzed separately. The academic curriculum is associated with a

- 50 -
significantly lower probability of work than the pedagogy curriculum, and
this is true of both INEMs and traditional schools although the lowest
probability (as in the case of men) is found among INEM graduates. We also
find that, although to a lower extent than academic studies, commercial,
agricultural and social services studies are all associated with a
probability of work smaller than that of pedagogical studies. It must be
said, however, that female graduates from pedagogy have a very high
probability of being engaged in some sort of work after their secondary
studies (72.6 percent), and it is therefore not surprising to find
significantly lower probabilities for graduates from other curricula.
- 51 -
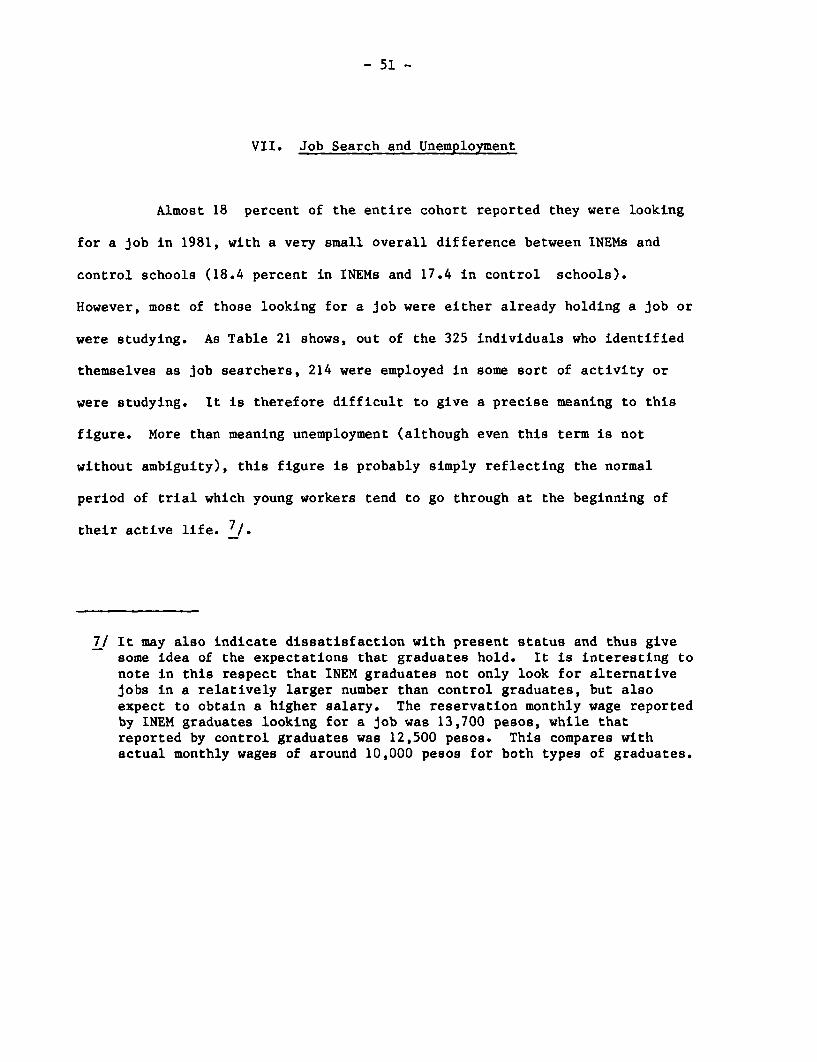
VII. Job Search and Unemployment
Almost 18 percent of the entire cohort reported they were looking
for a job in 1981, with a very small overall difference between INEMs and
control schools (18.4 percent in INEMs and 17.4 in control schools).
However, most of those looking for a job were either already holding a job or
were studying. As Table 21 shows, out of the 325 individuals who identified
themselves as job searchers, 214 were employed in some sort of activity or
were studying. It is therefore difficult to give a precise meaning to this
figure. More than meaning unemployment (although even this term is not
without ambiguity), this figure is probably simply reflecting the normal
period of trial which young workers tend to go through at the beginning of
their active life. 7/.
7/ It may also indicate dissatisfaction with present status and thus givesome idea of the expectations that graduates hold. It is interesting tonote in this respect that INEM graduates not only look for alternativejobs in a relatively larger number than control graduates, but alsoexpect to obtain a higher salary. The reservation monthly wage reportedby INEM graduates looking for a job was 13,700 pesos, while thatreported by control graduates was 12,500 pesos. This compares withactual monthly wages of around 10,000 pesos for both types of graduates.

- 52 -
Table 21
1981 Status by Search Activity
1981 PercentStatus Not Looking Looking Total Looking
Study 425 100 525 19.1
Study & Work 361 42 403 10.4
Work 599 72 671 10.7
Other 116 111 227 48.9
Total 1501 325 1826 17.8
Note:These figures correspond to the number of respondent who were lookingfor a job in 1981, irrespective of whether they were also studying orworking.
A probably more reliable indicator of difficulty in finding a job
is given by the percentage of respondents who in 1981 were looking for a job
and were not working or studying. Overall, 6 percent of the cohort were in
this situation and Table 22 shows how they were distributed across school
type and subject of study. The first point to notice is that the
differences between INEMs and control schools is very small (5.8 percent as
compared to 6.2 percent). This, however, marks some important divergencies
across the different subjects of study. Academic and Agricultural graduates
do much worse in terms of unemployment if they come from a control school
than if they come from an INEM, whereas Commercial and Industrial graduates
from control schools do better than their counterparts from INEMs. Finally,
the ordering of subjects according to the incidence of unemployment is not
the same in the two types of school. INEM Academic graduates are the ones
who suffer less unemployment and Agricultural graduates are the ones who

- 53 -
suffer most. In control schools, Academic graduates show the second highest
unemployment rate after Agricultural graduates, and Industrial graduates the
lowest.Table 22
Unemployment Rates in 1981 by School Type and Subject(percent)
Subject INEM Control Sample
Academic 3.9 6.1 5.2
Commercial 8.2 3.9 6.0
Industrial 4.7 1.9 3.5
Agricultural 9.2 17.3 14.6
Social Services 5.0 4.0 4.9
Pedagogical - 4.0 4.0
Overall 5.8 6.2 6.0
Note: We classify as unemployed those respondents who in 1981 were lookingfor a job and were not studying or working.
Although the overall difference in unemployment rates between INEMs
and control schools is not large, the difference by sex is more marked. Male
graduates from INEMs, in particular, seem to do much better than their
counterparts from control schools. The percentage unemployed from the INEM
cohort of males was 5.5 and that for the control cohort 7.0. Female INEM
graduates, on the other hand, are more likely to be unemployed than female
graduates from traditional schools, but the difference is small. In 1981, 19
female INEM graduates were unemployed (6.4 percent of the female INEM

- 54 -
cohort), while the corresponding number for female graduates from
traditional schools was 31 (5.5 percent). 8/
Another important variable in this survey, which also gives
information as to the readiness with which graduates are integrated into the
labor market, is the period of time that each graduate had to wait to find
his (or her) first job. If training on the job is a relevant factor in this
market, this variable ought to have also an influence on the level of
earnings observed for each working individual in 1981. Other things equal
one should expect higher earnings for individuals with longer market
experience. We leave the detailed analysis of this issue until the next
section and here we concentrate on the distribution of this variable across
school type, employment status and sex.
Table 23 shows the average number of weeks that it took people to
find their first job. Since this information is likely to be of more
difficult interpretation in the case of self-employed graduates, we
concentrate here on employees only.
8/ The results obtained so far do not change practically at all when othervariables are taken into account. The probability of looking for a jobis significantly reduced if the individual is a male, and dependsinversely on the per capita income of the city of residence and on thenumber of post-secondary courses taken. These influences, however, arenot sufficiently strong to alter the pattern given by Table 22 above.

- 55 -
Table 23
Number of Weeks Searching for First Job by School Type,Employment Status and Sex
INEM Control All
1. "Work Only" and "Study and Work"
Male 11.8 (148) 11.1 (143) 11.5 (291)
Female 11.2 ( 93) 14.8 (207) 13.7 (300)
Male and Female 11.6 (241) 13.3 (350) 12.6 (591)
2. "Work Only"
Male 13.8 ( 93) 11.9 ( 94) 12.8 (187)
Female 12.3 ( 50) 15.9 (118) 14.8 (168)
Male and Female 13.2 (143) 14.1 (212) 13.8 (355)
3. "Study and Work"
Male 8.6 ( 55) 9.6 ( 49) 9.0 (104)
Female 10.0 ( 43) 13.3 ( 89) 12.2 (132)
Male and Female 9.2 ( 98) 12.0 (138) 10.8 (236)
Notes:1. Figures in parenthesis are the number of cases over which the
corresponding means have been calculated.2. The sum of observations "INEM" plus "Control" do not add up to "All"
because overall there are 14 observations that cannot be identifiedas belonging to an INEM or a control school.
3. Employment status refers to the individual's position in October1981.
4. The figures refer to employees only.
There are several interesting points to note in this table. First,
we find that on average the amount of time that elapsed between graduation
(December 1978) and the beginning of the first job is not negligable. For
the whole sample it stands at about 3 months, which represents almost 9

- 56 -
percent of the maximum span of time that goes from graduation to the point at
which individuals were observed. Second, the data suggest that male
graduates have less difficulty in finding their first job than female
graduates, particularly in the case of traditional schools; in INEMs the
overall difference is not very large and in fact for those graduates who
exclusively work, men waited on average longer than women. Third, graduates
who combine work with studies wait on average less than graduates who
specialize on work. This is not surprising, as it is likely that the former
regard their jobs as provisional and are therefore less choosy than those who
devote their whole time to work. Fourth, overall INEM graduates found their
first jobs quicker than Control graduates (about two weeks earlier on
average). This advantage is fairly consistent across categories of work and
sex, with the exception of males exclusively working, for whom the period of
waiting time is almost two weeks longer.

- 57 -
VIII. Labor Earnings
The next issue we want to look into is the level of earnings
obtained by those graduates who in 1981 were working. As we have seen in
Section VI above, the probability that INEM graduates enter the labor force
after post-secondary education is lower than that for control graduates,
particularly in the case of men. It might be that INEMs send less people to
the labor market, but that those who end up there are more productive, and
thus command higher earnings, than graduates from traditional schools. Table
24 shows earnings by employment status, type of school and sex. Looking
first at employees and self-employed workers (first three columns) we see
that the general pattern is the following: INEM male graduates earn more, and
INEM female graduates less, than their counterparts from traditional schools,
and overall INEM graduates earn slightly more than graduates from traditional
schools. This pattern is the same whatever the employment status considered,
although the magnitude of the differences varies somewhat. The INEM
advantage in the case of males is greater when graduates combine work and
study than when they only work. For males who work and study, INEM graduates
earn 7.3 percent more than Control graduates, and for males that only work,
INEM graduates earn 5.5 percent more than Control graduates. For females the
INEM disadvantage is greater in the case of "Work Only" (-9.4 percent) than
in the case of "Study and Work" (-2.1 percent).

- 58 -
The INEM's advantage over traditional schools in the case of males,
however, is largely due to the effect of earnings by people who define
themselves as self-employed. Since earnings reported by self-employed
workers are not always reliable, and since it is unlikely that whatever
genuine difference may remain is due to the different type of schooling
received, a more accurate picture of the INEM-Control comparison may be
obtained from the sample including only employees. Excluding self-employed
people (last three columns of Table 24) does substantially reduce the INEM
advantage for males (in the category "Work Only" it does even reverse the
sign), and leaves more or less unchanged the previous results concerning
female graduates. Including self-employed people, INEM male graduates who
only worked were earning 5.5 percent more than Control graduates in this
category; now, excluding self-employed people, they earn 2.2 percent less.
Also the previous results suggested that INEM male graduates who combined
work and study were earning 7.3 percent more than Control graduates; now,
excluding self-employed, they only earn 5.1 percent more.
The two remaining features of Table 24 worth noting are the higher
earnings reported by male graduates and the fact that graduates who combine
study and work tend to earn more than graduates who only work. The first
feature is not surprising and it is found in most earnings surveys both in
developed and developing countries. The magnitude of the difference,
however, is probably much larger than what we would expect to find in
developed countries. It must be noticed that this is a very homogenous
sample in terms of education level and market experience; in developed
countries, sex differences for equally educated people tend to be small at
the beginning of the working career and grow when women start to drop from
the labor force for reasons related to childbirth and childcare.

- 59 -
Table 24
Mean Labor Monthly Earnings by School TypeEmployment Status and Sex(Colombian Pesos, 1981)
Employees and Self-employed EmployeesINEM Control All INEM Control All
1. "Working Only" and "Study and Work"
Male 11,473 10,822 11,131 10,757 10,715 10,735(266) (294) (560) (243) (266) (509)
Female 8,913 9,543 9,332 8,777 9,439 9,218(154) (333) (490) (150) (322) (375)
Male and Female 10,534 10,142 10,292 10,001 10,016 10,002(420) (627) (1,050) (393) (588) (984)
2. "Work Only
Male 11,520 10,915 11,190 10,572 10,787 10,686(170) (203) (373) (158) (180) (338)
Female 8,359 9,222 8,921 8,396 9,183 8,904(92) (186) (281) (91) (181) (275)
Male and Female 10,410 10,106 10,215 9,776 9,983 9,887(262) (389) (654) (249) (361) (613)
3. "Study and Work"
Male 11,391 10,614 11,013 11,101 10,563 10,830(96) (91) (187) (85) (86) (171)
Female 9,735 9,948 9,885 9,366 9,767 9,649(62) (147) (209) (59) (141) (200)
Male and Female 10,741 10,203 10,418 10,390 10,068 10,193(158) (238) (396) (144) (227) (371)
Notes:1. Figures in parenthesis are the number of cases over which the
corresponding means have been calculated.2. The sum of observations "INEM" plus "Control" does not add up to
"All" because, as indicated in the text, there are some cases forwhom the type of school cannot be identified.
3. Employment status refers to the individual's position in October1981.

- 60 -
The second feature is unexpected. In principle it would seem that
people combining work and study would be found in temporary and dead-end type
of jobs to a greater extent than people exclusively working. But this is not
the case for these data, and the higher earnings in the category "Study and
Work" is quite consistent whatever the sex of the individual or the type of
secondary school attended.
Earnings differences between INEMs and traditional schools are
therefore not very large. As far as men are concerned the differences that
are observed seem to be explained almost totally by the effect of
self-employed individuals, and concerning women it appears that traditional
school graduates do somewhat better. This, of course, is a preliminary
conclusion based only on the limited amount of standardization performed in
Table 24. There could be systematic differences in other variables across
INEM and Control schools which also need to be taken into account.
Before entering into this analysis, however, it should be noted
that the survey to which these data belong also gives information on the
earnings that individuals had in their first job after graduation. Thus, we
could potentially use this longitudinal aspect of the sample to improve the
estimates of the determinants of earnings. However, this information, which
is retrospective, is not without problems. Retrospective information always
tends to be less reliable than information on current magnitudes, but the
problem is aggravated when the variables involved are nominal and when the
context to which they refer is inflationary. Then the tendency is to
overestimate the real value of the variable in question. To see whether that

- 61 -
was the case here, we expressed earnings in the first job in Colombian pesos
of 1981, using the Index of Consumer Prices and the information on time of
search to obtain that job. Then we compared real earnings in 1978 with real
earnings in 1981, and found that for a substantial proportion of people (42.4
percent) earnings had gone down in real terms. It is unlikely that this is
just a consequence of a general fall in productivity. Even if overall real
wages had been falling during this period, we would expect real earnings to
grow for most people as the largest gains resulting from market experience
are usually obtained during the early stages of the individual's working
life. 9/
These results suggest that, in examining the determinants of
earnings, it may be advisable to concentrate only on the information
referring to October 1981. To analyse employment status, on the other hand,
we believe that the information referring to December 1978 is quite reliable,
and to that extent we think that the results shown in Figures 2 to 5 above
are certainly useful for evaluation purposes.
Do INEMs play a significant role in the determination of earnings,
once the influence of other possible determinants has been accounted for?
This is the sort of question we would like to answer in the remainder of this
section. The most widely used model of earnings determination singles out
education and on-the-job training as the main factors determining earning
capacity (Mincer, 1974). Under perfectly competitive conditions, and for a
9/ To ensure that this result was not due to the inclusion of peopleengaged in temporary jobs of work, we performed the same calculationfor the sample of people who were in the category "Work Only" in bothperiods. For this subsample the proportion of individuals whose realearnings in 1978 was greater than their real earnings in 1981 was 41.0percent.

- 62 -
given level of ability, these two variables are good predictors of individual
productivity levels. If, however, individuals cannot invest in education as
much as they would like (because of capital market imperfections), if the
labor market is segmented or if the distribution of tastes across types of
jobs is not uniform, then variables other than education and training may be
relevant in determining earnings.
In the present sample the main source of variation in educational
inputs is given by the presence of individuals graduated from both INEM's and
traditional schools. If we are able to isolate a differential effect on
earnings this may be indicative of possible differences in quality between
these two educational modalities. Also, besides the division between INEM
and Control graduates, we know the subject of study on which they
specialized. The effect of INEMs need not be uniform across subjects of
study, so we may capture the variations in educational quality by
distinguishing not only between INEMs and traditional schools but also,
within these two categories, between the six subjects of study.
Despite the homogeneity of the sample in terms of education and
age, we are fortunate to have at our disposal a reasonable proxy for
on-the-job training, which we obtain from the potential amount of individual
labor market experience. As explained above, we know for each person how
long he or she had to wait to obtain the first job. This, together with the
date of observation (October 1981) and the date of graduation (December
1978), allows us to construct a measure of the maximum span of time that each
individual may have spent in the market. Naturally, there may have been
periods of inactivity within this span of time which are not captured by this

- 63 -
proxy, but we believe that on the whole it is better to use this information
than to assume that all individuals have the same labor market experience.
Although the period between graduation and observation is not long, there is
a reasonable amount of variation in potential experience; it ranges from a
minimum of 11 months to a maximum of 2 years and 10 months, and the
coefficient of variation is 13.9 percent. In addition to potential
experience there exist other variables which may also proxy accumulated
training: age, weeks of formal training after high school, and tenure in
current job.
A third group of variables that we consider consists of standard-
izing factors that are meant to account for the particular characteristics of
either the data set or the Colombian labor market. The first is hours of
work which is included because the dependent variable is measured in terms of
earnings rather than wages. The second is a dummy variable for
self-employment designed to isolate the specific effect that this type of
worker may have on average earnings; in general, information on self-employed
people tends to be less reliable than that on employees. The sample also
includes among wage earners people who combine work and study; since the
employment status (and associated earnings) of these individuals could differ
from that of people specializing on work for reasons other than education or
training we include another dummy to account for their presence in the
sample. Finally, we consider a third dummy which captures the possibility
that private and public jobs pay differently for reasons again unconnected
with education or training.

- 64 -
The fourth and last group of variables that we are going to
consider are parental and other socio-economic background factors which are
meant to capture part of the sample variation in individual ability and/or in
access to capital. Among a whole battery of indicators, the ones that are
used in this analysis are the level of schooling of the individual's parents,
dummies for repetition of years of study in secondary and primary school and
the individual's father occupation. 10/
Table 25 shows, for male graduates, the results of regressing the
log of monthly earnings on this set of variables. We present separate
regressions for men and women because, as will become evident below, the
earnings structures of men and women are different, and combining both sexes
into the same analysis would have tended to confound the results. In column
(1) we show a specification with all the variables described above and in
column (2) we present a simpler equation which omits insignificant
variables. We allow for the possibility that INEM effects operate not only
through the constant term of the equation but also through any of the
training and standardizing variables associated with the individual's labour
market experience after graduation. 11/ The interactive specification
allows us to identify separately the INEM and control coefficients and is
used in preference to other forms which would only identify differential
effects between schools type. Finally, the male regressions do not include
socio-economic variables as these proved to be very insignificant in
preliminary estimations.
10/ A whole battery of additional variables was tried in priorexperimentation, but in all cases the results were extremelyinsignificant.
11/ An exception to this is the log of hours which in preliminaryspecifications always showed a very similar effect whatever the schooltype.

- 65 -
Table 25
The Determinants of the logarithm of male monthlyearnings, unrestricted regressions
Variable (1) (2)Coefficient (t) Coefficient (t)
Constant 7.515 (13.58)* 7.732 (25.19)*
Educational variables**
INEM x Academic -0.172 (0.23)INEM x Commercial -0.024 (0.03)INEM x Industrial -0.024 (0.03)INEM x Agricultural -0.140 (0.19) -0.054 (0.52)INEM x Social Service -0.133 (0.16)
CONTROL x Academic -0.085 (0.68)CONTROL x Commercial -0.117 (0.69)CONTROL x Industrial 0.007 (0.07)CONTROL x Agricultural -0.375 (2.91)* -0.359 (3.74)*
Training variables
INEM x Years of experience 0.260 (2.38)* 0.265 (3.27)*INEM x Weeks of training -0.000 (0.16)INEM x Age 0.019 (0.95)INEM x Months present job -0.000 (0.20)
CONTROL x Years of experience 0.335 (2.48)* 0.293 (3.57)*CONTROL x Weeks of training 0.000 (0.52)CONTROL x Age 0.011 (0.65)CONTROL x Months present job -0.001 (0.60)
Standardizing variables
INEM x Self-employed 0.511 (3.73)* 0.498 (3.86)*INEM x Private -0.109 (1.25) -0.101 (1.23)INEM x Worker & student -0.039 (0.51)
CONTROL x Self-employed 0.003 (0.02) -0.011 (0.09)CONTROL x Private -0.158 (2.02)* -0.170 (2.33)*CONTROL x Worker & student 0.003 (0.04)
Logarithm (Weekly hours) 0.213 (3.13)* 0.239 (3.92)*
R2 0.18 0.16N 312 312
* Statistically significant at the 5 percent level.** Excluded categories, CONTROL x Social Services and CONTROL x Pedagogy.

- 66 -
The first result worth noting is that there are very few
significant variables (although in all cases the equations as a whole are
significant). Other things equal, all subjects of study yield the same level
of earnings with the only exception of Agricultural studies in traditional
schools, which are associated with significantly lower earnings than the
rest.
The variable years of labor market experience" shows the expected
positive sign and is significant both for INEMs and for traditional schools.
The point estimate of the annual rate of growth of earnings is larger for
Control schools than for INEMs, but the gap is not very wide. It is
interesting to note that the rate of gain per year of experience is quite
large (26 percent in the case of INEMs and 33.5 percent in the case of
traditional schools). This is not surprising as most of the gains in
earnings are usually made at the beginning of the individual's working life.
We attempted to estimate the degree of curvature of the earnings profile by
including quadratic terms, but were unable to do so due to the small
variation present in the sample. 12/ We are confident however that the
results obtained identify fairly well the rate of growth of the profile
during the first three years of work. The other three training variables, on
the other hand, prove to be very unimportant as far as earnings determination
is concerned.
12/ Due to small variation, the variables "years of experience" and "yearsof experience" - squared are highly correlated and introducing both ofthem in the regression results in multicollinearity renderinginsignificant both coefficients.

- 67 -
Among the standardizing variables the most important in magnitude
is that capturing INEM graduates who are currently self-employed, which is
consistent with our results in Table 24. Also, we find that private firms
tend to pay less than public firms, and that this difference is significant
in the case of graduates from traditional schools. Not surprisingly, the
longer an individual works the more he earns. It should be noticed, however,
that the coefficient on the log of hours is very low; normally, we would
expect it to be much nearer to one. This result is indicative of a very
large negative correlation between wages and hours and this, in turn,
suggests that hours of work may have been measured with substantial
error. 13/ Finally, we see that, once all these variables have been taken
into account, the fact that a graduate works only or combines work and study
does not matter as far as his earnings are concerned. 14/
In column (2) we omit all the insignificant variables and only
enter the pairs in which at least one of them is significant. The estimates
prove to be very stable and the only noticeable change occurs with the
coefficient on years of experience for control graduates, which now becomes
even more similar than before to the corresponding INEM effect.
13/ The correlation coefficient between wages and hours is -0.45 for the1981 observations and -0.65 for the 1978 observations.
14/ We tested for selectivity bias following the Heckman (1979) procedureand found that this problem was of no significance for the present setof data.

- 68 -
The results, therefore, point to very few differences between
INEM and traditional schools. But are the differences that remain
statistically significant? We answered this question by running again
equations (1) and (2) constraining the coefficients on INEM and Control
variables to be the same. Then we performed an F-test to see whether the
increment in the residual that results from the restriction is significant or
not. If significant, it means that the restrictions are not accepted and
thus that INEM and Control schools have a differential effect; if, on the
other hand, the incremental residual is not significant the hypothesis that
INEM and Control schools have the same effect on earnings cannot be
rejected. For the large specification the F statistic F(12,286) was 1.66
while the corresponding critical value is 1.79; for the small specification
the F statistic F(4,294) was 0.74 and the critical value 2.37. So in neither
case are the restrictions rejected. We then conclude that, statistically,
there are no differences in the effect that INEM's and traditional schools
have on male earnings.
Table 26 presents the equivalent analysis for female earnings.
Here we include a set of family background variables as they appear to be
more important than in the case of men. As for men, there are few
differences among subjects of study. Only graduates from traditional schools
in Commercial studies do earn significantly more than the rest. All other
specialities yield about the same level of earnings. The training variables
have a weaker effect on earnings than in the case of men. Years of
experience, in particular, is now insignificant in both INEMs and traditional

- 69 -
schools. This result - flatter earnings profile for females - is again
consistent with findings from other data sets. Another difference with
respect to men is the effect of tenure which although insignificant in the
case of INEM graduates, it is quite important and takes the expected sign for
graduates from traditional schools.
Among the standardizing variables, private employment for control
graduates is again significantly associated to lower earnings, while the
effect of hours is also positive and significant. But, contrary to the male
results, we now find that female graduates that combine work and study tend
to earn more than those who only work, particularly in the case of
traditional schools. Finally, the socio-economic variables all tend to get
the expected sign (the only exception being the level of schooling of
mothers) but they are usually insignificant. Only "father's education" is
positively and significantly associated to earnings.
We also run for women the regressions in Table 26 but with the
effects of INEM and Control variables restricted to be the same. On the
basis of the F-test we conclude again that we cannot reject these
restrictions. 15/ That is, statistically, there are no significant
differences in the effect that INEMs and traditional schools have on
earnings.
15/ For the large specification the F statistic, F(12,254), was 0.71, andfor the small specification, F(4,276), 1.70. None of them isstatistically significant at the 5 percent level.

- 70 -
Table 26
The Determinants of the logarithm of female monthlyearnings, unrestr crea regressions
Variable (1) (2)Coefficient (t) Coefficient (t)
Constant 7.973 (17.07)* 8.099 (44.50)*
Educational variables**INEM x Academic 0.327 (0.40)INEM x Commercial 0.279 (0.35) -0.014 (0.20)INEM x Industrial -0.215 (0.24)INEM x Agricultural 0.273 (0.31)INEM x Social Service 0.298 (0.37)
CONTROL x Academic 0.084 (1.17)CONTROL x Commercial 0.232 (3.57)* 0.186 (3.26)*CONTROL x Industrial 0.649 (1.93)CONTROL x Agricultural -0.057 (0.32)CONTROL x Social Services -0.064 (0.53)
Training variablesINEM x Years of experience 0.105 (0.74)INEM x Weeks of training -0.001 (0.77)INEM x Age -0.009 (0.31)INEM x Months present job 0.000 (0.06) 0.002 (1.00)
CONTROL x Years of experience -0.014 (0.22)CONTROL x Weeks of training 0.000 (0.46)CONTROL x Age 0.012 (0.76)CONTROL x Months present job 0.004 (2.68)* 0.003 (3.00)*
Standardizing variablesINEM x Self-employed -0.248 (0.73)INEM x Private -0.126 (1.28) -0.088 (1.19)INEM x Worker & student 0.045 (0.56) 0.052 (0.73)
CONTROL x Self-employed -0.234 (1.36)CONTROL x Private -0.229 (4.09)* -0.223 (4.55)*CONTROL x Worker & student 0.109 (2.08)* 0.081 (1.80)
Logarithm (Weekly hours) 0.204 (4.00)* 0.224 (4.67)*
Family and socio-economic backgroundFather's years of schooling 0.013 (1.99)* 0.014 (2.33)*Mother's years of schooling -0.006 (0.70)Primary school repeater -0.013 (0.25)Secondary school repeater -0.083 (1.57)Father's occupation***Manual skilled -0.021 (0.28)Non-Manual 0.034 (0.43)Professional 0.104 (1.06)
R2 .24 .19N 288 288
* Statistically significant at the 5 percent level.** Excluded category, CONTROL x Pedagogy.* Excluded category, Manual Unskilled.

- 71 -
Although our main conclusion points to the inexistence of
significant differences, it is nonetheless interesting to calculate the
standardized earnings that follow from the point estimates just obtained.
Panel A of Table 27 shows the standardized earnings for each subject of
study. 16/ For men the highest earnings are obtained by those specializing
in industrial studies, particularly when studying this curriculum in
traditional schools. Academic studies yield earnings below the mean, but it
should be noted that the most able students in this category would be
"Studying Only" and therefore are not included in this regression. The only
noticeable difference is that of graduates having specialised in Agricultural
studies, who earn significantly less than the base group (Pedagogy). The
main difference as far as women are concerned is the significantly higher
earnings obtained by graduates from Commercial curricula in traditional
schools. The differences obtained for graduates from Industrial curricula
are based on very few observations and should not be given any weight.
16/ These earnings have been adjusted to yield the overall mean for thewhole sample (excluding Pedagogy), because the missing observations inthe regression analysis tend to understate mean earnings somewhat.This does not affect the structure of standardized earnings, which isour main concern here, and allows us to give a more precise meaning tothe rates of return calculated in the next section, which are based ona comparison with undstandardized earnings of individual with primaryeducation.

- 72 -
Standardizing over the whole subject distribution we find, as in
Table 24 above, that male graduates from INEMs earn more and female graduates
from INEMs less than their counterparts from traditional schools. The
differences are small and, we repeat, statistically insignificant. Finally,
in Panel B, we aggregate the male and female figures using for both school
types the sample proportions of Table 24 and conclude that the (statistically
insignificant) advantage of traditional schools over INEMs is of 183
Colombian pesos per month.

- 73 -
Table 27
Standardized Monthly Earnings by Subject of Study,School Type and Sex
(Colombian Pesos, 1981)
Subject/ Men WomenSex INEM Control INEM Control
A. Subject Comparison a/
Academic 10,039 11,094 9,655 9,511
Commercial 11,640 10,745 9,203 11,029*
Industrial 11,640 12,163 5,615 c/ 16,734+c/
Agricultural 10,365 8,302* 9,147 8,260
Social Services 10,478 12,079 9,379 8,203
Pedagogy - 12,079 - 8,745
All subjects excluding Pedagogy 11,058 10,940 9,313 9,932
INEM ControlB. Overall INEM-Control Comparison b/
Male 11,058 10,940
Female 9,313 9,932
Male and Female 10,343 10,526
Notes:
a/ Based on Equation 1, Tables 25 and 26.b/ This comparison excludes Pedagogy and the aggregation has been done using
the same (overall) employment distribution for the calculation of bothINEM and control earnings.
c/ Based on .3 percent of the women entering the regression.(*) Significantly different (5 percent level) from earnings forPedagogy. (+) Significantly different (10 percent level) from earningsfor Pedagogy.
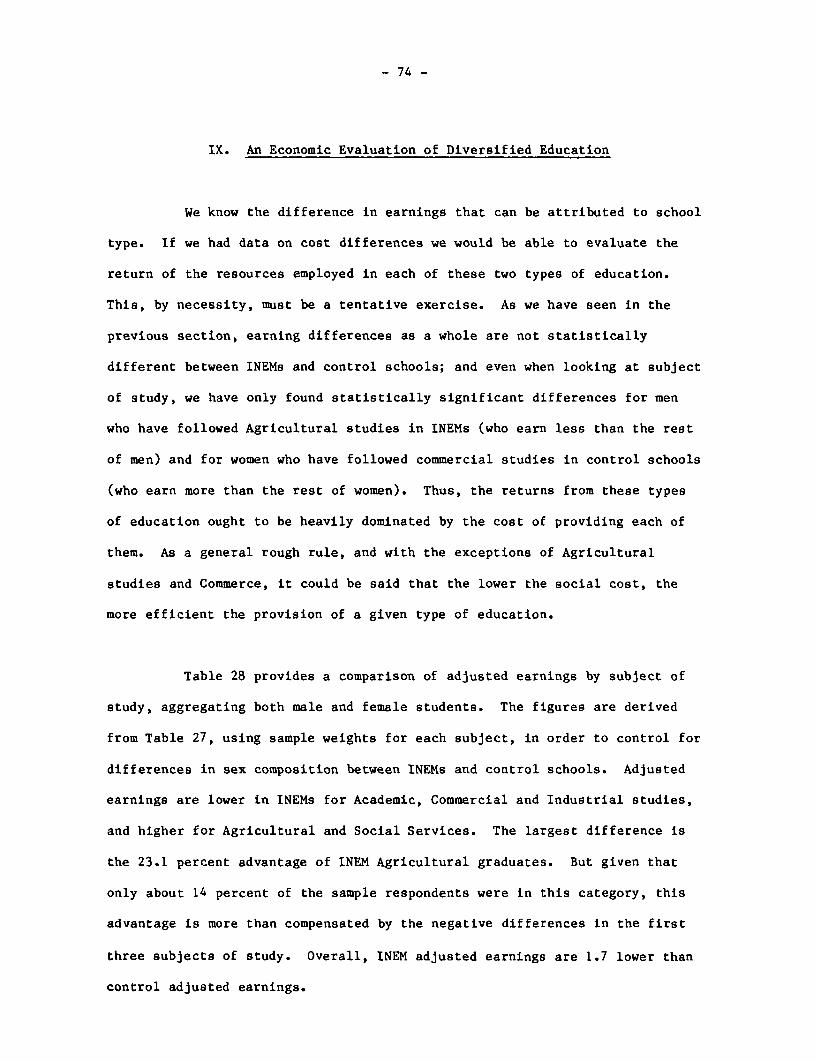
- 74 -
IX. An Economic Evaluation of Diversified Education
We know the difference in earnings that can be attributed to school
type. If we had data on cost differences we would be able to evaluate the
return of the resources employed in each of these two types of education.
This, by necessity, must be a tentative exercise. As we have seen in the
previous section, earning differences as a whole are not statistically
different between INEMs and control schools; and even when looking at subject
of study, we have only found statistically significant differences for men
who have followed Agricultural studies in INEMs (who earn less than the rest
of men) and for women who have followed commercial studies in control schools
(who earn more than the rest of women). Thus, the returns from these types
of education ought to be heavily dominated by the cost of providing each of
them. As a general rough rule, and with the exceptions of Agricultural
studies and Commerce, it could be said that the lower the social cost, the
more efficient the provision of a given type of education.
Table 28 provides a comparison of adjusted earnings by subject of
study, aggregating both male and female students. The figures are derived
from Table 27, using sample weights for each subject, in order to control for
differences in sex composition between INEMs and control schools. Adjusted
earnings are lower in INEMs for Academic, Commercial and Industrial studies,
and higher for Agricultural and Social Services. The largest difference is
the 23.1 percent advantage of INEM Agricultural graduates. But given that
only about 14 percent of the sample respondents were in this category, this
advantage is more than compensated by the negative differences in the first
three subjects of study. Overall, INEM adjusted earnings are 1.7 lower than
control adjusted earnings.

- 75 -
Table 28
Adjusted Monthly Earnings by Subject of Study(Colombian Pesos, 1981)
Subject of Study INEM Control INEM AdvantagePercent
1. Academic 9,846 10,298 -4.4
2. Commercial 9,973 10,940 -8.8
3. Industrial 11,537 12,241 -5.8
4. Agricultural 10,210 8,296 23.1
5. Social Services 9,468 8,517 11.2
Overall 10,343 10,526 -1.7
Table 29
Annual Direct Costs Per Student by School Typeand Subject of Study(Colombian Pesos 1981)
Subject of Study INEM Control INEM AdvantagePercent
1. Academic 25,700 22,200 15.7
2. Commercial 25,200 23,200 8.6
3. Industrial 25,300 31,900 -20.7
4. Agricultural 26,200 33,700 -22.3
5. Social Studies 25,000 27,800 -10.1
Overall 25,459 27,234 -6.5

- 76 -
Estimates of the social cost per student in each type of school and
for each subject are obtained from Hinchliffe (1983). These costs include
forgone earnings, capital costs of buildings, furniture and equipment and
direct recurrent costs. Foregone earnings were measured by the earnings of
primary school leavers and were taken from Psacharopoulos (1983), who used an
urban labor market survey for 1975. Monthly earnings of a primary school
leaver aged 22, at 1981 prices, were calculated to be 5,813 Pesos per month.
The per pupil capital cost, annualized, is based on the World Bank Appraisal
reports for the INEM and other secondary education projects in Colombia.
Recurrent expenditures financed by households are available from the student
questionnaire in some detail. Data on school expenditures including
salaries, maintenance, utilities, materials and equipment were based on the
school questionnaire and used to compare INEM and control schools as well as
subjects of study. Details about the assumptions made to arrive at these
figures can be found in Hinchliffe (1983). Table 29 shows direct costs per
student (that is, excluding foregone earnings) for the two types of school
and for five subjects of study. INEM education is more expensive for
Academic and Commercial studies, but cheaper for Industrial, Agricultural and
Social Services. Overall, weighting cost by the common sample attendance
distribution, INEM costs are 6.5 percent lower than Control costs.
To calculate rates of return over primary education, we used the
'short cut" rate of return method (Pacharopoulos, 1981). Essentially this
method assumes an infinite lifespan over which earnings are obtained, and a
comparison between two flat earnings profiles, which are used as

- 77 -
approximations of the true schedules. The fixed differential is approximated
by the actual differential at age 22; that is, about 3 years after leaving
secondary education. Also, we assume that all the costs were incurred at
once during the year at which the evaluation is made (1978). A graphical
representation of these assumptions is given in Figure 6, and the formula for
the rate of return to which they lead is:
12 (Yij - Yp)
rij
6 (12 Yp + Cij)
where Yij is average gross monthly earnings of the i subject of study in the
j type of school, Yp is forgone monthly earnings and Cij is direct annual
cost per student of the i subject of study in the j type of school.
Table 30 shows the approximate social rates of return calculated
with this method. Overall, INEMs do not appear to be economically more
efficient than control schools. Their rate of return over primary education
is 9.5 percent as compared to 9.7 percent for control schools. These figures
are very close to each other and suggest that in social efficiency terms both
types of schools are virtually the same. The slightly lower earnings
attributable to INEMs are compensated by the slightly lower unit costs of
INEM education.
- 78 -
Figure 6
The Flat-Earnings-Equivalent Assumption for
Approximating the Returns to Education
Earnings
*/~~~~~ -
0-0
yij4$
4-~~~~~~~~~0¶oe vK. __ __
__ _ __ _ _ _ __ _ _ ___ _y4_ -yprimary
Indirectcost
13 4 t19Direct Age
cost \(1981)
(1978)

- 79 -
This similarity in overall rates hides substantial differences in
rates of return by subject of study. Resources spent on Industrial studies
are the ones that yield the highest return both in INEMs (12.0 percent) and
control schools (12.6 percent). Social Services on the other hand are among
the subjects with the lowest return (7.7 percent in INEMs and 5.5 percent in
control schools). INEM rates of return are in general lower than the
corresponding ones for control schools, particularly in Commercial and
Academic studies. However, a significant exception is that of Agriculture
were INEMs achieve a rate of return twice as large as that of control
schools. This advantage, together with a smaller one for Social Services,
makes the rate of return of INEMs for vocational subjects slightly higher
than that of control schools, but this is largely due to the very inefficient
outcome of Agricultural studies in control schools where the rate of return
is only 4.8 percent.
In addition to the qualifications pointed out previously about the
approximative nature of these rates of return, an important caveat concerning
the Academic rate of return should be noted. As we have seen in Section IV
above, the percentage of students going on to further studies is
significantly higher for INEMs than for control schools (for men 42.9 percent
as compared to 13.4 percent, and for women 15.2 percent as compared
to 4.6 percent). Thus, it is possible that the 8.4 percent rate for INEM
Academic in Table 30 is an underestimate of the true rate of return. Under
the assumption that students who enter higher education are on average more
able than those who enter the labour market after graduation, the higher
propensity of INEM students from the Academic track to continue their full

- 80 -
time studies must have biased downward the INEM Academic rate of return
relative to that of Control Academic students. So, a calculation on the
basis of earnings once all the cohort has been for some time in the labour
market, could result in a higher rate of return for INEM, and even reverse
the sign of the difference with control schools.
Table 30
Approximate Social Rates of Return by Subject of Studyand School Type
(percent)
Subject of Study INEM Control
1. Academic 8.4 9.8
2. Commercial 8.8 11.0
3. Industrial 12.0 12.6
4. Agricultural 9.2 4.8
5. Social Services 7.7 5.5
6. Vocational Subjects (2 to 5) 10.3 9.7
7. All subjects 9.5 9.7

- 81 -
X. Summary and Conclusions
This paper has investigated to what extent the new modality of
INEM schools have had a differential effect on earnings and employment status
as compared with conventional secondary schools, and how these two types of
education compare in terms of economic efficiency. The main conclusions
reached can be summarized as follows:
(i) The simple examination of unstandardized data suggests that
earnings differences between INEM and traditional schools are not very
large. As far as men are concerned, the differences that are observed seem
to be due largely to the effect of self-employment, and concerning women,
graduates from traditional schools seem to do somewhat better than those from
INEMs.
(ii) The raw data on employment status suggest that INEMs have not
altered to any great extent the employment pattern of young people as
compared with the structure generated by the traditional school system. If
anything, the data suggest that INEMs, particularly in the case of males,
have accentuated the propensity of high school graduates for higher
education.
(iii) INEMs do not show a differential effect on the number of
people who end up enrolled in the best universities of the country, nor as
regards the number of graduates who end up unemployed.

- 82 -
(iv) INEM students come from families which are poorer, and have
parents who are less educated, than those of control students, although the
differences are not very large. These background characteristics appear to
affect negatively the performance of INEM students during primary education,
but the data suggest that INEMs educationally outdo control schools in that
they manage to lower substantially the rate of secondary education repeaters.
(v) INEM Academic students take less pre-university courses than
their control counterparts. Given the remedial character of these courses
and the fact that Academic INEM graduates attend universities in a larger
proportion than Academic control graduates, this evidence reinforces our
previous conclusion about the higher educational quality of INEMs.
(vi) INEM graduates appear to undertake further training to a
greater extent than control graduates. This is mostly due to the fact that,
among those who choose further training, the duration of the courses is
longer for INEM than for control graduates. As for the proportion of
students that follow these courses, INEMs win over control schools but the
difference is small. Further training is fairly well matched with the
specialty of study and, in the subjects where the degree of matching is
highest (Commercial and Industrial), the difference between INEM and control
schools is again small.
(vii) When earnings are standardized for other factors such as
ability proxies and labor market experience, the conclusions of the
descriptive analysis are largely maintained. Overall, we have found that the
hypothesis that INEMs generate an earnings structure different from that
generated by traditional schools is not supported by the data.

- 83 -
(viii) This conclusion is true for both men and women, but we have
been able to identify some interesting differences between the two sexes.
While male earnings grow significantly with labor market experience, female
earnings show a practically flat profile. Tenure on the job, on the other
hand, seems to be a significant determinant of earnings for women but not for
men. Finally, as far as subject differences are concerned we have found that
male graduates who specialized in agricultural studies earn significantly
less than other male graduates, while female graduates who specialized in
commercial studies earn significantly more.
(ix) We have standardized employment status data by means of a
probit analysis which, in addition to school type and subject of study, has
also taken into account the influence of variables determining the relative
attractiveness of work versus study. Our overall conclusion is that as far
as women are concerned the main differences are not between INEM and control
schools, but between different subjects of study. Concerning men, on the
other hand, we have found statistically significant differences between INEM
and control schools.
(x) Male INEM graduates, in particular those from an academic
curriculum, are much more likely to end up studying full-time than their
counterparts from control schools. On the other hand, INEM graduates
following a commercial curriculum are much more likely to end up working
full-time than their traditional school counterparts. For the remaining
subjects, the probability of choosing the alternative "Working Only" is
higher, and that of choosing "Study Only" lower, for INEM graduates than for
control graduates.

- 84 -
(xi) The pattern of probabilities for female graduates is similar
to that of men, but the differences between INEMs and traditional schools are
much smaller and statistically insignificant.
(xii) INEMs as a whole do not appear to be more efficient than
control schools. The rate of return of INEMs is approximately 9.5 percent as
compared to 9.7 percent for control schools. This similarily, however, hides
substantial differences in rates of return by subject of study. Resources
spent on Industrial studies yield the highest return both in INEM and control
schools. Social Services on the other hand are among the subjects with the
lowest returns. INEM rates are in general lower than the corresponding ones
for control schools, with the exception of Agriculture were INEMs achieve a
rate of return twice as large as that of control schools. INEMs appear more
efficient in providing vocational education (a 10.3 percent rate as compared
to a 9.7 percent rate for control schools). Also, due to the higher
propensity of Academic INEM students to go on to higher education, the rate
of return on INEM Academic studies could be substantially underestimated.
The differences in rates of return that have been evaluated are both small
and insignificant; this, together with the approximate nature of this
exercise, makes it impossible to discern any clear advantage of one type of
education over another.
Our overall conclusion is that INEMs have not increased the
propensity of high school graduates to enter the labor force. In fact, in
those cases in which a significant difference can be identified, we find that
the influence of INEMs has tended to go in the opposite direction. INEMs
have not influenced earnings either. But a final conclusion on this must

- 85 -
wait to the availability of data from university graduates, since one of the
differential effects of INEMs has been to send people to universities to a
greater extent than traditional schools.

- 86 -
REFERENCES
Heckman, J. "Sample Selection Bias as a Specification Error," Econometrica,Vol. 47, pp. 153-161, 1979.
Hinchliffe, K. "Cost Structures of Secondary Schooling in Tanzania andColombia," Education Department, mimeo, The World Bank, 1983.
Lillis, K., and D. Hogan. "Dilemmas of Diversification: Problems Associatedwith Vocational Education in Developing Countries," Comparative Education,Vol. 19, No. 1, 1983.
Mincer, J. Schooling, Experience and Earnings, National Bureau of EconomicResearch, 1974.
Psacharopoulos, G. "Returns to Education: An Updated InternationalComparison" Comparative Education, Vol. 17, No. 3, 1981.
Psacharopoulos, G. "Education and Private versus Public Sector Pay" Labourand Society Vol. 8, No. 2, April-June 1983.
Psacharopoulos, G. and W. Loxley. Diversified Secondary Education andDevelopment, Education Department mimeo, The World Bank, 1984.
Varner, G. Educacion Secundaria en Colombia, Informe a la Agencia ParaDesarrollo Internacional de los Estados Unidos, La Asociacion Nacional deEducacion de los Estados Unidos y al Ministro de Educacion Nacional deColombia, 1965.

- 87 -
Annex 1 A sequential probability model
A general probability model to analyse the flows of high school
graduates in this set of data can be easily described with reference
to the patterns depicted in Figure A in the text. Suppose that the
objective is to explain the probability with which an individual would
choose in 1981 each of the four available alternatives using information
on the individual's choice in 1978.
We denote the probability of being in status i in year t by Pitt
and the range of possibilities is given by four employment status
(i - 1,2,3,4), and two years (t - 0,1). Thus P31 denotes the
probability of "Work Only" in 1981, while P1 0 denotes the probability
of "Study Only" in 1978.
We can think of the decision tree in the following manner.
Initially, in 1978, the individual faces four alternatives, with
probabilities
P 10 p 20 p 3 0 and P4 0
Suppose the individual chooses alternative 1 in 1978, then his position
in 1981 can be thought of as the result of another election in which
the individual has to choose again among four alternatives, given
that he has already chosen to be initially in status 1. The
probability that having chosen initially 1, he will now choose, say,
2 is the conditional probability (P 21 IP1 0 ). So this second stage
choice can be represented as follows:
pII I Plo) /(P 1 1 I P2 0 )
pp21 PlO) p 21 I P2 0 )p10 (p31 0
P 31 IP10) (P31 IP20)
,iP 41 IP10) (P 41 IP20)

- 88 -
(P11 IP30) p11 P40)
(P21 IP30 (p21 P40)
P0 (P31 P30) (P31 IP40)
(P41 IP30) (P4 1 IP40)
Then, the probability that an individual is found in, say, status 1 is
equal to the probability that he has chosen status 1 given that he
initially chose status 1, (P1l |P10)P1 0, plus the probability he has
chosen status 1 given that he initially chose status 2, .(P11 IP20)P20,
and so on. Thus, the four probabilities of interest are
P11 (P11 P 10 )P 1 0 + (P 1 1 1P2 0 )P 2 0 + (P11 P30)P3 0 + (P 1 1 1P4 0 )P 40 (1)
P2 1 (P2 1 IP10)P10 + (P2 1 1P20)P20 + (P2 1 1P30)P30 + (P2 1 1P4Q)P40 (2)
P 31 = (P3 1JP10)P1 0 + (P3 1 1P2 0)P2 0 + (P3 1 1P3 0)P30 + (P3 1 1 P40)P4 0 (3)
P 41 = (P4 1jP10)P1 0 + (P4 1 1P2 0)P20 + (P4 1 1P30)P30 + (P4 1 1P40)P40 (4)
The model can be estimated consistently by fitting a multinomial
probit (with 4 alternatives) to all the 1978 data. This would estimate
the four Pio (i = 1,...,4) probabilities. Then the conditional elements
would be estimated by fitting again a multinomial probit, but this
time to each of the four subsamples resulting from the initial choice.
This would estimate the sixteen (PilP ) (i = 1,...,4; j = 1,...,4)
probabilities. Then using expressions (1) to (4) the probabilities
wanted could be obtained. This approach would both make the choices
as homogeneous as the data can permit, and utilize information on past
individual's decisions. If, as expected, state dependency is important,
then the main diagonal in the matrix formed by (1) to (4) ought to
yield the largest probabilities.

- 89 -
Annex 2 The binomial probit model
The model of choice used in the text considers only two alterna-
tives (1 and 2). It is therefore a binomial model of choice.
Suppose that we can represent the net benefits of alternative I by an
index X1 (X1 could be the present value of net earnings expected
from choosing alternative 1) which, in turn, can be presented as a
linear combination of variables plus an error term
X1 = !II + el
where a is a vector of parameters, Y1a vector of variables and s an
error term.
Assume also that the attractiveness of alternative 2 depends on
the index X2, which can also be represented as
X2 3 2 iY2 2
where B is another vector of parameters, Y2 another vector of variables,
which may include part or all of the variables in Yl, and 2 an error
term.
The model of choice-then is
If X1aX , individual chooses alternative 1
If X1< X2, individual chooses alternative 2
Then, in general, the probability that an individual chooses alternative
, P1 , is
P1 = Pr(X1 a X2)
Pr(aY 1 + E 1 ¢ BY2 + E21
= Pr(E 2- E X - $ 2
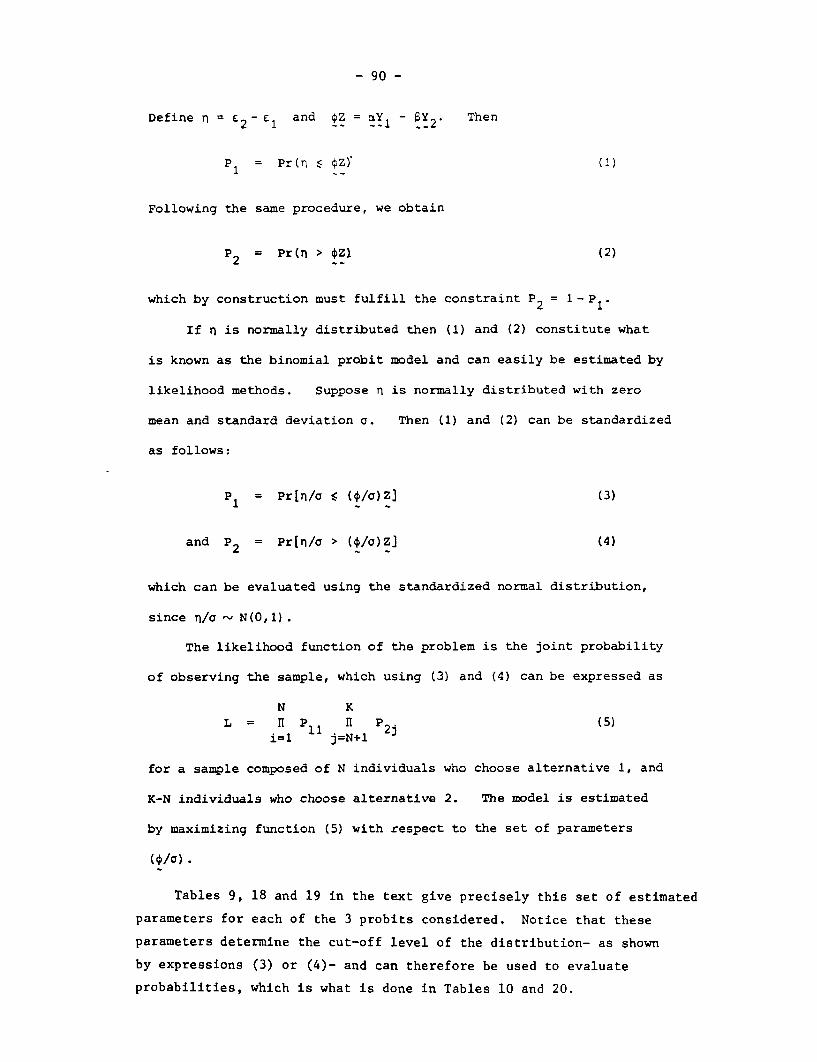
- 90 -
Define n = E2- E1 and -Z a i__2 Then
P = Pr(n s Z))
Following the same procedure, we obtain
p2 = Pr(n > OZI (2)
which by construction must fulfill the constraint P2 = 1- P1.
If n is normally distributed then (1) and (2) constitute what
is known as the binomial probit model and can easily be estimated by
likelihood methods. Suppose n is normally distributed with zero
mean and standard deviation a. Then (1) and (2) can be standardized
as follows:
P1 = Pr[n/a S (0/a)ZI (3)
and P2 = Pr[n/a > (0/a)Z] (4)
which can be evaluated using the standardized normal distribution,
since n/a - N(0,1).
The likelihood function of the problem is the joint probability
of observing the sample, which using (3) and (4) can be expressed as
N KL = T pl 11 pj 5
i=1 j=N+1
for a sample composed of N individuals who choose alternative 1, and
K-N individuals who choose alternative 2. The model is estimated
by maximizing function (5) with respect to the set of parameters
(0/a).
Tables 9, 18 and 19 in the text give precisely this set of estimated
parameters for each of the 3 probits considered. Notice that these
parameters determine the cut-off level of the distribution- as shown
by expressions (3) or (4)- and can therefore be used to evaluate
probabilities, which is what is done in Tables 10 and 20.

- 91 -
Call this cut-off level M. Then, for a given individual i,
M. a)zi (6)
and the probability that this individual chooses 1, Pii, is given by
the area to the left of M. in the standardized normal.
Take for instance the model investigating the probability of
"Working Only" estimated in the text. For the typical individual
described in the text who in addition followed an academic curriculum
in an INEM, the cut-off value, which we denote by MI, is
M, = )ZI= 1.524
Then we read from the table of the standardized normal the area to the
left of -1.524 and this gives 0.064, a 6.4 percent probability that
this individual will choose the option "Work Only". In Figure A.1
we represent this area in panel A. If we now evaluate the cut-off
point for an identical person except that has followed an academic
curriculum in a control school, Mc , we obtain
M = = - .321c - -
and the corresponding area to the left of Mc is 0.375, a 37.5 percent
probability that this person will choose the option "Work Only". In
this manner, by varying the elements of the set of variables Z, and
the corresponding coefficients, the whole array of entries in Table
14 can be derived.

- 92 -
Figure A.1
The evaluation of probabilities
A. Probability that a "typical individual" who has graduated froman academic stream in an INEM will choose the alternative"Work Only"
6.4% ~
MI=-1.524 0 (n/a)
B. Probability that a "typical individual" who has graduated froman academic stream in a Control school will choose thealternative "Work Only"
37.5%
M1=-.321 0 (n/a)
Note: The typical individual is described in the text.

- 93 -Annex 3
Means and Standard Deviations of Selected Variables, Colombia 1978 Cohort
StandardVariable/Category Mean Deviation
C. 1978 Cohort (N - 1,826)
Background
Male 0.521 0.499Age 21.859 1.864Siblings 5.608 2.838Father's Education (Years) 9.775 3.302Father is Farmer 0.117 0.322Father is Laborer 0.111 0.315Father is Employee 0.354 0.478Father is Professional 0.297 0.457Father is Business Owner 0.086 0.281Family Income (pesos) 28440 32516Urban Born 0.875 0.330
School Type/Subject
INEM 0.427 0.494
Academic 0.250 0.433Commercial 0.199 0.400Industrial 0.202 0.401Agricultural 0.123 0.329Social Sciences 0.086 0.281Pedagogy 0.136 0.343
1978 First Destination/Work Characteristics
Studying 0.262 0.440Working and Studying 0.261 0.439Working 0.364 0.481Self-Employed 0.025 0.158Earnings 5405 3748Hours tWorked 39.054 14.235Weeks to Find Job 14.157 17.784
1981 Status/Work Characteristics
Studying 0.287 0.452Working and Studying 0.220 0.414Working 0.367 0.482Self-Employed 0.039 0.195Earnings 10292 5474Hours Worked 40.205 12.403Looking for Work 0.177 0.382Weeks Looking 27.254 30.596

Annex 4
Zero-Order Correlation Matrix Among Selected Variables, Colombia 1978 Cohort
(1) (2) (3) (4) (5) (6) (7) (8) (9) (10) (11) (12) (13) (14)
1. Male 1.00
2. Age .09 1.00
3. Urban Born -.03 -.16 1.00
4. Years City Resident .04 .08 .23 1.00
5. Big City Resident .03 -.16 .09 .15 1.00
6. City p/c Income -.07 -.27 .18 .14 .78 1.00
7. INEM Graduate .16 -.06 .07 .09 .13 .22 1.00
8. Repeated Primary -.00 .17 -.01 .09 -.01 -.02 .07 1.00
9. Father is Farmer .04 .23 -.31 -.22 -.23 -.30 -.13 -.00 1.00
10. Father is Employee -.01 -. 11 .07 .02 .05 .08 .03 -.03 -.03 1.00
11. Student in 1981 -.01 -.28 .07 -.04 .09 .18 .04 -.06 -.11 .03 1.00
12. Worker in 1981 .03 .13 -.01 .00 .06 .06 -.06 .04 .00 .02 -.32 1.00
13. 1981 Earnings .16 .06 .02 .02 .11 .11 .04 .03 -.04 .00 .02 .00 1.00
14. Private Sector Empl. .08 -.11 .02 -.01 .19 .23 .16 -.03 -.13 -.03 .01 .00 -.02 1.00

Annex 5 95 -
No. de Orden 11I1L.1 1J
-C -ULO 1. IDENTIFICACION
Nombre del colegio de donde egreso: Dentro de todos us hermanas Ud. es:
- LEI primer hijo' ........... 0 ....... 1I I I I I I .... _______________ - - lEl segundo hijo? .0 2
- LEI tercer hijo? .... 03Ciudad: _______________ - De los ultimos hijos? . 04
Nombre del alumno: Q !En qu6 departamento y on que municipio naci6._______________________________________ Ud?
Departamento.Municipio:
Direccibn del alumno:
- bEn esa municipio naci6 Ud. on un area urbana (ca-becera municipal) o en un irea rural?
Telefono del alumno: I- Area rural. .... 1- Area urbana . . . 0 2
O tCuil modabldad u opci6n estudio Ud. en el bachi-
llereto7! tCuintos alas saguidos Ileve Ud. viviendo en esta
Clasico . ...... 0 01 Elctrircdad ... . 013 ciudad7Humanidades ..... 0 02 Elec.y Electr6nica.0 14 AMos _ L.ICiencias ...... 003 Motores ....... 0 15Secreteriado .. . .0 04 Metelmecanica . . 0 16Contabilidad ...... 0 05 Mecanica Autom. 0 17 U LCual es a fue al mayor nwel educatwo slcanzadoNormelista ... 0 06 Radio Electr6nica 0 18 por su sae0r padre?Salud y Nutrici6n . . 0 07 Quimica IndustrialO 19 L1Desarrollo comunidadO 08 Ebanister(a. . . 0 20 - Ninguno .......... . ............ r0 1Dibujo Tecnico .... 0 09 Metalirgica . . . 021 - Primaria incomplete .... ........... 02Fundici6n ....... 0 10 Agropecuerie .. . 0 22 - Primaria complete ... ............. 03Construccidn ..... 0 11 Soldedura ..... 0 23 - Secundaria incompleta ........... 04Electr6nica ..... 0 12 Metalisteria . . 0 24 - Secundaria completa ... . ........... 0 5Otro, /Cu7l_ - Universitaria incomplete .. . . . . . n 6
- Universiteria completa. .. .. 0 7
0 CuintasalioscumplidostieneUd? - Otre, Cal? 08- Nosabe .09
Alios cumplidos
U COel fue el mayor nivol educativa alcanzado por suSexo: seflora madre?
- Femenino ...... 0... . .. 0 1 - Ninguno ................ .0 1- Masculino ...... ... ........... 02 - Primaria incompleta ... . ........... 02
- Primaria completa .... ......... ... 03- Secundaria incomplete ........ .... .04
UN tCuintas hermenes y cuantas hermanas tiene Ud? - Secundaria completa ... 0 .. . . . . . O 5- Universitaria incomplete ... . ... 06- Universitarie completa ..... .. .. 0 7
- Hermanos L-i W - Otro, Cual?_ _ _ _ 0 8- Hermanas - No sabe . 9
_-

- 96 -
IMD lAIroo de sus padres ha zistdo as agin curso de caeitci6n?
LJ i Ud. hmo b nmyor parts deas primwib:- No ....... O 1- S i ..... . 0 2 - SEnselcmpo? .1............. 0- No sabe . .... O 9 - 0 en la ciudad? .............. D 2
* _Cal * Is principal ocupaci6n de su padre, _ cuil M Y Ud. hizo Ia mayor parts de lo primarib M una Ins-fui Ib ultima qud tuvo? titucibn:
blica..................- .P.bl a , 0 1- eO en una Privada? . 0 2
Escriba detallada y claramente.
SW LUd. reprtib alguan aflo en ba primaria?M De los cargos quo beni a continuacion cuel dascribe M .Lrpt6...a.oe.s.rMF....J.. IJ
mejor el que tone su padre an la ocupacian que men- - No ....... 0inb on la pregunta antenor? - Sf ....... 0- eCuintos?-
M Y durante el bechillerto repitib Ud. algun aflo a
- Jornalero o trebalador agricola ........ 0 01 grado?- Obreno (Sector Gobterno) ........... 0 02 - No ....... L- Obraro (Sector Privado) ............ 0 03 - Si ... 0- iCuantos? -
- Empleado (Sector Gobierno) ......... 0 04- Empleado (Sector Privado) ...... .... 0 05- Trabalador independiente (Campo). . 0 06 M JEn cuintos eoligios de bachillerato estuvo Ud.?- Trabajador ndipendiente (Ciudad). . . 0 07- Duenio negocio - Fibrica pequeno ...... 0 08 Nrmero Li- Duesio negocie -Fibrica mediano .... . 09- Duefno negocio -Fibrica grande ....... 0 10- Pequeno agrncultor ......... ...... 0 11 M LDesde quo Ud. termino el bachillerato ha asistido o- Mediano agricultor .. ...... . . 0 12 ha tomado curses de capacitaci6n?- Agricultor grande . . ..... ...... 0 13- Otro, Cual? ........... ., 014 - No ....... 0 LiJ _ 2
- SI ... 0- !Cuintos? -_ Sila
Ul Aproximadaments cuinto dinero gana mensualmen-te su padre? 1 0 esos eumos etl ha sido el meb importanb pa
re Ud.?Inqgreso mensual ........ I
0 88- Nosabe ........ 0 9
-Z U Y cual fue la duraeibn dea cuse en?• Aproximadamente cuinto dmaero reciben mensual-
ments todas las pensonas que conforman su hogar? Hores: - I ID (es:Semenas_
Ingreso mansual total .. ... J................. ... Meses: _______ 0 88
- No sabe. . . ................. .......... ... . .. o 9 * LEn que Instituciin estudi6 ani etnudimndo esecurso?
E3 Y su femilia es dueis de: - En una Empresa .............. 0 1
- En el SENA .......... ...... 0 2No S2 - En unr Unmversidad . 0 3
- Carro 0 1 0 2 Li - En un lnstituto Tcnico ............. .0 4
- Latrro .. .... 01 0 2 L-i - En un Colegio .......... 0c35- Lots ..... . 0... ... 51 0 2 L-4 - Por Radio o Correspondencia .0 6- Finca ........ 01 02 Li - Otro, Cual?_________ 0 7- Negocios. 01 0 2 Li 0 8

- 97 -
LDupuds de que Ud. tmMn el bmhill nto tiS M Lgi no aiera usudsindo quo swarn h.cidso d s cd a eursos preuninnitwios? an el tiempo que Ud. ahort ddiu am stdos?
- Trabajando ............ 01 Sl3i- No .. 01 - Otro actividadem ...... 0 2 a 35- Sf .. 02 - Nade ...... 03
08
r-. i &h li J lEn qud ocupacion a en qua ofico tarla Ud. tra-
l Eat estudiando actuumante? bajando7
- No .. 01 - a 38 Escriba dara y detaliadaments 0 88- SI .. 02 _ Siga
lY di en lupr de estr estudi ndo auviera tr ba-Mlui eurora o programas oat studiando? pando, culnto cre qua rs eoria pnando al mas
en ests momento?
S Mes:. I L L .088 Nosab ... 09
08
C LEn que lnstituci6n esd estudiando ess carere oprograma? U 1Cuinto considers Ud. qua mit sa ingraeo mensual
dentro do cinco (5) alos suponiando que satga tra-bajando?
088
M lEn qus mes y an quo aflo comeanz Ud. a estudiar S Mes:oa cerrerm o programa? No sab0 . 9
08BMes: -
Alto: _ -
0 88 U 1 lCuanto consider. Ud. que msrl u ingreso menrsal_ cuindo comience a trabapar despuds do tarmimr
mis estudiom actualsi?* ICul fue Is raz6n principal por la qua Ud. dee;di6astudiar aim carrra o programs?
Li $ Mes:- Era lo quo queria aetudiar ........... 0 1 No sab. 0 9- No habfa nada mds qus astudiar ....... 0 2 0 8- Solo pudo pasor la admisi6n on esa carrera
o programa ..................... 0 3 LI"- Problemas econ6micos is impidieron ir a VW lODspuis ds tarminar el bachillarato a cuil de las
otra ciudad a estudiar lo qus quer(a ... . 0 4 siguiantas actividades e ddic6 Ud.?- Los padras quarian quo etudiara asa ca-
rrera o programa ........ ........ 0 5 L..J- Otra, cCual7 _ 06 - LA estudiar ............ ....... 01 a 4- No ost6 saguro ........ . ........ 0 7 - lA estudiar y trabajar? ............. 0 2
0 8 - lSolo a trabajar? ............ 0 3 Silo_-_ - SOtra cosa? . ........ .... 0 4
l Cudl do In asugnaturas o materias qua Ud. astudioan sl bachillersto ha sado an su opinibn la do ma. M SHizo Ud. olicitud de admisi6n a prount6 eximu-yor utilidad para la carrera o programa qus oi' es- nes para studiar adguna erreram profesi6n u oficio?tudibndo?
Escriba can claridad - No ... 01 a 4088 - St .. 02 Si
m

- 98 -
* SCuM ftu in principd rzbn pws quo Ud. no sipiwe - En os trsbajo u ocupsi6a Ud. es:estudiundo desptse de quo teminb al bacillersto? LI
- Aprendiz . ............... O 1Li l - Obrero calificado ................. 0 2
- Empleado ....... 0.. 0 3 Sill- No estaba preparado para seguir estudiando 0 1 - Tdcnico ........ 0 4- No tenia dinero para seguir estudiando .0. 0 2 P r u - Supeivisor ......... ............. 0 5- No lo recibieron en ninguna Instituci6n .. . 0 3 a - Dueflo a independienta ....... 0 6 _ 9- luerts o tmnfa quo trabajar ........... 0 4 45 - Otro, Iua .............. 0 Sl.- Problemas familiares o personales .. 0. 5 0 8- Otro, ICual? 0
M_X ICuanto es su ingreso mensual antes de los descuen-to$?
1Q Ul estudios comenzb despues de torminar el ba- Passchdileroto? Mes: -I a s
08_ _ _ _ _ _ _ _ _ _ _ _ _ _ _ _ _ _ _ W sN .R .0 9- 088
tM ICuanto considera que so pna Ud. ml mes por suU iLos estudios que comenz6 son los mismos quo esl trabalo?
haciendo on la actualidad?Ll $ Ms: Mes_ LJW.LLJ1
- SI ......................... 0 1 _&45 0 8- No . ........................ 02 N.R. 09- No esti estudiando an la actualidad. 0 3 Slg
1 SCuinto cree que e tara ganndo Ud. mensulamenteM ICual he la razbn principal pars que Ud. dejra de dentro de cinao (5) ailos?
estudier Is carrers o pmqgrma que comenz6 cuandotermino el bachillersto? $ Mes:
LI 08- No la gust6 lo quo astudiaba ..... .... 0 1 N.R. 0 9- La pareci6 muy difici lo qua estudiaba 0 2- No tenfa dmaro ........ . ......... 0 3 IEn cuel ector eon6mico desempeii Ud. u ocu-- Cambi6 do domicilio ............... 0 4 peeibn u oficiop- Pmblemas personales o familiares ....... 05c u 0 5 Loi- Otro, ICuil? 0 -Agricultura y pesca . .0 1 -Comercio ..... 0 6
0 8 -Minas y Contaras.... 0 2 -Transporte .... 0 7
_____ _____ __ - -Industria Manufact.. . 0 3 -Soc. Financiero. 0 8-Servicios Publicos ... 0 4 -Servici0s Person. 0 9
E ICuanto tiempo estuvoa estudiando ea carrera 0 pro- -Construcci6n .... 0.. 5 0 0grams?
Aiaos: Va Y el trabsjo o le ocupacibn es con el:Meses: Ll
0 88 - Sector oficial (Gobierno) ? ....... 0.... 1
______________ _ _ - 0 con el sector privado? ............. 0 2CAPITULO IV. TRABA 08
3 IEdta Ud. trabslondo actualmente? Y Y Ud. trabaja de:L-I
LI - eTiempo parciel?.0 1- No . ... .................. 01 -a S 3 - 10 de tiempo completo? ............ 0 2- Sf . 02 _Sign 08
U Illue ocupscibn, trabalo u oficio realize Ud.? M lUd. tiene penrons a u cargo en el treabeo?
____________ LJ|J - No ... 0 - Sf ... 0 -Cuintos?
0E 88 088

- 99 -
13 LCudnts harns a Is nmim dedica Ud. a su trablo? M tLo quo Ud. aprndidi on a l bechillare, Indluyendaln prictiaa, I he wrvido mucho. elo o nide pwn
Hores L8Lj el trebsjo qua desempefla tuailmente?0588
- Nada .01* tHaeecuintotiampoestidesempeflandoeretnsbajo? - Alga. 0 2
- Mucho .0 3Mes - LeLj 08Aflos:-
088I U tOespuds de tarminar al bachillersto. tuvo Ud. algin
trabajo, ncupeibin u of ieio remunerida7I LC6mo consiguib Ud. el trabajo quo tiena actual-
mente? Li(Solo marque la mis importante) LI - No.0 01 78- Anuncio on la prense . 0 1 - S .0.2 _ SI.- Balsa de empleos 0 2- Por amigos o conocidos. 0 3- Par un familiar. 04 W3 LCuil fu6 el primer trabajo remunerado qua tuvo- Par media del colegi0 o 5 despuds del bachillerate?- Formo su propto nagocio . 0 6- Solicitud a ampresa.0 7 W- Otro, Cudl? .0
0 8 (Escriba clara y detalladamente) 0 88
U Cuanto tiempo estuvo Ud. bureando ese trabajo? E En as primer trabajo u ofieio remunraedo Ud. arm:
Lii ~~~~~~~~~LiSemanas: - Aprendiz ? .01Mea: - cObrero calificado? .0 2
088 - 6 Empleado ? .03- - Tdcnico ? .0 4- !Supervisor? .0 5
Teniando an cuenta el trabejo que tiene actualmente, - Ouaelo o independiente? .0 6que materias o astnaturas considere Ud. qua se de- - Otro, tCual? 0bieron profundrair a estudiar mts duranta el bachi- 0 8llerato?
(Solo registre hasta dos) l . .Si las raspuestas a las preguntu 64 y 66 son iguals a1. les respuesas de las preguntas 46 y 47 pm a lel pre.2. gunta 68, an caso contraria pmse a l pregunte 67.
088
LY pare el trabajo qua tiani actualmenta qua mate- U tCudl fud el primer sualda, alario o ginenci men-ras o asignatura dabiaran astudr y nunsa lo hicie sual qui tuvo Ud. en ese primer trabajo? (Registre elr6n an el bachillersto qua Ud. cursto valor del ingreso antes de dascuentos).
(Solo registre hasta dos) I.I L 71. MeLs: 782 _ _ _ _ _ _ _ _ _ _08
088 N.R. 9
M LCuil do es asignatures o materias qua Ud. estudiW M LCuil fut el primer ualdo, alwrio o genarici man-an el bachillerato ha sido an mu opini6n la de mayor sual qua tuvo Ud. an ea primer trabajo? (Rglsa elutilidad par el desempeflo de su traba jo? valor del ingramo mntes de descumntos).
(Solo registra la de mayor utilided) 1 1 .L 'L 1(S Mes:
t. __________________ 08088 N.R. 09

- 100 -
Md Y pa se tribaje qua tuve inieilmente que mate,tEn cuil sKtor eeonbmiw dempeff ba Ud. ne due o signsturrs debieron astudirse y nunca Io hi-ocuiam n u nfl..? cierbn en el buchilleruto quo Ud. curs6?
-Agriculture y pe c .c. 0 1 -Comercio ..... 0 6 (Solo registre huta dos) L I-Mins y Canteras ... .0 2 -Transporte .... 0 7 1 I I-Industria Manufac. . . 0 3 -Sec. Financiero. 0 8 2-Servicios Publicos . . .0 4 -Servicios Person.o 9 0 88-Construcci6n ...... 0 5 0 0
la -ud materiss o asignaturas de Is qua curs6 an ofM Y on.... .trobsio u aci6 fud con el:eblchillerato lo sirvieron a Ud. mas p ra el desempe-U Y ese trebajo u oeuptscan fui Don el: flo de eue trabajo?
- eSector Oficial (Gobiemo)t ........ .. 1 (Solo registre hs dos)- eO con el sector Privado? ........ 0.... o 2 2.
08 0 88
Y el trab'jo u ocupeci6n era de: U iLo que Ud. aprendib on el bachillermto ineluyendolas prncticas Is sirvieron mucho, algo o noda pars el
LU trabajo qua dasempeflaba inecialmente?- eTiempo parciel7 ................. 0 1- L0 de tiempo completot .......... 0.. 2 LJ
08 - Neda..... 01- Algo ..... 02- Mucha..............0 3
eCuintas horns a i semana dedicaba a ese trubalo? 0 8
Horns o 8i CAPITULO V. DESEMPLEO =0 88
_- eDurante la ultima semiana ha hecho diligencias paraM IC6mo consiguib Ud. ess trabajo? conseguir trabaro?
L-J(Solo marque lo mds importante) Li - No .. . . . o 1 _ 84- Anuncio an la prensa ............... 0 1 - S .0 2 Si,:- Bolsa de empleos ................. 0 2- Por amigos o conocidos .. . .. ...... 0 3- Por un familiar ................ 0 4 M SCuinto tiempo hace qua est6 buscando trabejo?- Por medio del colegio ...... ........ 0 5 I- Formo su negocio propio ............ 0 6 Semanas:- Solicitud a emprass ................ 0 7 Mesas:- Otro, eCudl?. 0 0 88
08
__ _ _ _ _ _ _ _ _ _ _ _ _ _ _ _ _ _ _ _ _ _ _ ___ - LOud tipo de trabajo east buscando?LCuinto tiempo despuds de qua se gradub durb Ud. MB ____u__tipo_de __ab_lo ____busc_ndo
buseando us trebajo?(Escriba clara y detalladamente) 0 88
Semanas: - L 1Mesas:.
0 88 M LCuil seria a sueldo, salario a ganancia con el quaN. R. 0 99 estarla satisf echo en Ia actuBlided?
S Mes:III
M Taneando an cuentu el primer tfabajo qua Ud. tuvo 0 8despuds de gaduanrsa. qud meteins a isignaturis con- N.R. 0 9sidera Ud. qua re dabieron profundizar o estudiarmis duninte el bachillersto? M Cudl cree quo sort w irtgro mensud dentro de 5
sefos suponiando qua ve a eatr trabepndo?(Solo registre hasta dos) L LIIJ1. _ L., S Mes:2. 08
0 88 N.R. O 9

- 101 -
M lDe quiin depends escnbmicements Ud. ens ac- M XCon qu6 frecuensiu Ie Ud. los periodices?tualidad?
(Raqistre lo mas importante) LJ - Nunca .. 1- Padres ......................... 0 1 - Rara vez .................. 0 2- Familiares ...................... 0 2 - Algunas veces a la semana ......... 0... 3- Negocio ........................ 0 3 - Todos los dias .................. 4 o4- Ahorros ........................ 04 ___4
- Amigos ........................ 0 5- Otro, eCubl? ......... 0 M t9En su opinibn cuales son los prncipales pmblemas
0 8 que tiene el pals en este momento?
~0 JLJ) MODE R?d-I~AD- (Escriba primero el mas importante V en seguida los&4AM W L0-V . MODERM otros que sean mencionados)
M Los cambios sociales ocurirn pnncipalmenta como _ Wresultado de: W
LI _ _ _ _ _ _ _ _ _ _ _ _ _ W~~~I I
- I La acci6n de las fuerzas naturales? .... 0. 1- l La acci6n de grandes hombres? ..... .. 0 2- lProgramas del gobierno? ...... 03...... 0 3- e La acci6n de grupos organizados? ..... 0. 4- l La acci6n de todo el pueblo? ..... .... 0 5- lOtro, eQud? 0.................... C M &Elui es lo mis importente para el futuro da Colom-
bia?:
M Entre las siguientes razones, cuil cree Ud. que ese/ LJmayor obsticulo pars el desarrollo del pals: - Buena suerte .......... ......... O 1
- Tener fe en sus dirigentes ? ...... ..... 0 2LU - Disponer de recursos econ6micos ? ...... 0 3
- La planificaci6n V scci6n por parte del- lLos recursos monetarios? ........... 0 ( 1 gobierno 7 ...................... 0 4- c Los recursos naturales7 ........ 0..... 0 2 - El trabalo duro de la poblaci6n ? ....... 0 5- l La forma de pensar de la gente? ..... 0.. 3
- 1 La falta de organizec6n? ............ 0 4 - De las siguientes caracteristicas cual considers Ud.
qua debs ser la mis important, para conseguir unUB Per, Ud. cual es el objetivo mes importente de la buen trabalo:educacibn: Lj
- l Pertenecer a una familia de alta posi-Ll ci6n social?.0 s o cie ? 1
- c Toner amigos nfluyentes ? .0 2- lProporcioner conocimientos generales? .M. 0 1 - 1 Tener un titulo educativo7 ...... 0.... 0 3- cPreparar a la persona para el trabalo?.... 0 2 - l Tener conocimientos tecmcos espe-
cializados? ..... .. t 0 4
Penteneca o as Ud. miembro de un:C emree Ud. que una persona puede tr realmente bue-
na sin tener ninguna religi6n?No Si
- Equipo deportivo ..... 0... 1 0 2 L.J LI- Grupo literario ... 01 02 ...... 01 2 L - No . .... . ....... 0..........- Organizaci6n estudiantil .. .0 1 0 2 LI.. - Si .0 2- Grupo polftico .......... 1 C I 0 2 L1_- Grupo cient(fico ....... 0. oI 0 2 L-i- Junts comunal .......... 0 1 0 2 L ... U Cual de los siguientes tipos de noticias o informacio-- Cruz Roe ....... .. .1 0 2 L.U nes Is nterfmn mis a Ud.- Club social ... . ........ 01I 0 2 U.J- Sindicato ....... 01 0 2 L. LJ- Grupo civico .... .... 0 1 0 2 L. - cLas de su barrio? ................. 1 l- Grupo religioso ....... 01 .. I 0 2 L - Las de su pueblo o de su ciudad? ...... 0 2- Cooperativa. 1 l 02 LJ - lLas nacionales? .0 3- Grupo folkl6rico ...... .. 1 0 2 L. - I Las internacionales? ............ 0 4

- 102 -
Dos muchachos j6venes uupendinon of trnbjio quo Nombre del anaadorheien an un taller d carpinteria y ae pusieron abunt Is firma de prodaeir Is misma cantidad docpan en menor tiempo sin toner le iguridad de paeder lograrlo. El papa de uno de allas les dijo: Me pa-rae bien quo piensn eo. En cambio oI papi del Obufvacionms del enmuestador:atro dijo: Enas cajas simpre so han hocho de Ismims maners, tratar de busar un cambio no a Iomis adeoudo. ICon cail de los dos padres ens Ud.do aecurde:
- eCon el primaro? .0 1
- XCon el segundo?.0............ .. 0 2
UliSi Ud. tiene uns cita con un amigo a ls 12 del diasdespuds de cudnto tiempo Ud. comienza a pensarque la persoam esn demorads?
(Escriba el tiempo que responda an minutos)
M Doentro de cinco (5) aios cuii cree Ud. qua sere su Nombre del supervisor:situaci6n econ6micas
- cMucho poor qua le quo tiene ahora? . 0 1- ePeor quo le que tiene ahora .0 2
- dIgual a la quo tiane shor 7 . 0 3- IMejor quo la quo tiene ahorart
. 0...... 0 4
- c Mucho molor que la que tiene ahora? . 0 5
4En su opmion squi on Colombia que es ao mis im-
portaeto pars conseguir un buen trabajo an Ia s-etuslidad?:
- cPertenecer a una familia de alta posi-ci6n social7 0 1 Formulsrio sprobado por el supervisor:
- cTener amigos influyentes .0 2- Tener un titulo educativo? .0 3 - No. 0- iTener conocamientos tirnacos nspeciaal- - S 0 3
zedos? .0 4
_ ~~~~~~~~~~~~~~~~Obsorvaciones Cadificaciin:Por sItamo, ESi dentro de un afio quisairamos volver Observ_ci_nes_C_d_fic_ci6n_
a hablar con Ud., on quo direcci6n lo podriamos con-tactar con segurided?
Oireccidn:
Telifono:
Ciudad:

- 103 -
SURVEY QUESTIONNAIRE FOR.THE 1978 COHORT
MINISTRY OW-2UBULIC. EDUCATIONEXTERNAL EVALUATION OF THE COLOMBIAN HIGH SCHOOL SYSTEMINSTITUTE S.E.R. OF aESEARCHCONFIDENTIAL
NUMBER OF ORDER / / / /
CWTER I. SCHOOL IDENTIFICATION
Name of the high school where you graduated:
* city / / /
Student name:
Student address:
Student phone number:
1. What type of high school did you study?
Classics ( ) I
Humani ties ( ) 2 Electricit, ( ) 13
Sciences ( ) 3 i Elec. & Electronics ( ) 14
Secretarial ( ) 4 Motors ( ) 15
Accounting ( ) 5 Metal Mechanics ( ) 16
Teacher Training ( ) 6 Automotive Mechanics ( ) 17
Health-Nutrition ( ) 7 Radio Electronics ( ) 18
Community DevelVpment ( ) 8 Industrial Chemistry ( ) 19
Techiical Draviug C ) 9 Wood-working ( ) 20
Casting ( ) 10 Metallurgy ( ) 21
Construction ( ) 11 Agriculture ( ) 22
Electronics ( ) 12 Metal Soldening ( ) 23
Metal Works ( ) 24
Others 'What
2. What is your age?

- 104 -
3. SEX Female - I Male - 2
4. How many brothers and sisters do you have?Brothers / /Sistars
5. Among your siblings you are:The oldest ( ) IThe second ( ) 2The third ( ) 3Among the younger sons ( ) 4
1/
6. In which municipality and in which departmeut were you born?
Municipality: / / / /
Department: / / / / /
7. Were you born in an urban (municipal head) area, or in a rural area?
Urban Area ( ) 1
Rural Area ( ) 2
8. How many consecutive years have you been living in this city?
Years t I1/
9. What is your father's educational level? / /
- None (- Primary incomplete ( )2- Primary compalete ( )3- Secondary incomplete 4- Secondary complete 5- University incomplete 6- University complete 7 )7- Others what ? _( )8- Do not know 9 )9
10. What is your mother's educational level? / /
- None ( )l- Primary incomplete 2 )2- Primary coupalete 3 )3- Secondary incomplete 4- Secondary complete ( )5- University incomplete t )6- University complete 7- Others whac ? a )- Do not know t )9

- 105 -
11. Has either of your parents been in a training course? L /
- No ( ) 1- Yes 2 )2- Do not know 9
12. What is your father's (main) occupation or the last one he had?
WRITE IN DETAIL AXD CLEARLY
13. In the following list of occupatious, ( J)the one which bestdescribes your father's current occupation.
- Farmer without land ( ) 01- Blue collar worker in public sector ( ) 02- Blue collar worker in private sector ( ) 03- Employee in public sector ( ) 04- Employee in private sector ( ) 05- Self-employed in rural area ( ) 06- Self-employed in urban area ( ) 07- Owner of small size industry or busines3 ( ) 08- Owner of medium size industry or business ( ) 09- Owner of large size industry or business . ) 10- Small farmer ( ) 11- Medium farmer ( ) 12- Large farmer ( ) 13- Other, what? ( ) 14
14. How much is your father's monthly income?
$1/ / / /Do not know 9
15. How much is the monthly income of your whole family?(Take into account all workers).
$/ / / / /Do not know 9 )9
16. In the following list of items, mark those which your family has.
NO YESHouse C )1 2 )2Car ( )1 ( )2 7--/Urban property ( )1 ( )2 7TT/
aura le °roperty 2 _7J

- 106 -
CHAPTER II. EDUCATION - TRAINING
17. Where did you do the majority of your primary education? / /
- In the country side ( ) 1- In the cicy ( )2
18. Did you obtain the majority of your pr4±ary educatiounin: I /
- public school ( ) 1- private school ( )2
19. Have you repeated any grade in primary school? / /
- No ( )- Yes ( ) How many grades? / /
20. Did you repeat any grade in high school? / I
- No ( )- Yes ( ) How many grades? / /
21. How many different high schools have you attended?
Number
22. Since you finished high school, have you taken any training courses?
- No ( ) lGo to 26- Yes ( ) 2
23. Which one of those training courses has been the most important for you?
7 / 88
24. How long was it? //
HoursDaysWeeksMonths / / 88
25. Where did you study, or are studying, this course? / /
- At an enterprise ( )l- At SLNA ( )2- At the university( 3- At a technical institute ( )4- At a school ( )5- By radio or correspondence 6 )6- Other, what? 7 )7

- 107 -
26. After you finished high school, did zou attend, or are you presentlyattending a pre-university course? /I
- No ( ) I- Yes ( )2
CHAPTER III. ADDITIONAL EDUCATION
27. Are you studying now? //
- No ( ) 1 Go to 38- Yes 2 )2
28. Whae career or program are you studying?
WRITE CLEARLY / / 88
29. Where (institution) are you studying this career or program? / /
/ / 88
30. When did you start studying this career or program?
Month
Year / /1/~~~ / / ~~~~~~~88
31. What was your reason for studying that career or program? / /
- It was what you wanted to study ( )1- There was nothing else to study 2 )2- You were admitted into this program or career only C ) 3- Because of economic problems you could not move to another
city to study the career or program you wanted. ( ) 4- Your parents wanted you to study this career or program ( ) 5- Other, What? 6_ ( )6- You do not know why ( )7
32. What courses you learned in high school have been the mostuseful in studying your current career or program?
WRITE CLEARLY 1./ /

- 108 -
33. I' you were not studying, what would vou be doing with the timeyou now dedicate to studying?
- Working ( ) 1- Something else ( )2)- Nothing ( ) 3 ) Go to 35
( ) 8
34. What occupation or job wou.ld you be doing?
WRITE CLZARLY AND IN DETAIL ( ) 88
35. If you were not studying but working, how much per month do youthink you would be earning now?
$ MonthDo not know ( )9
( ) 8
36. How much do you think your monthly income will be five years fromnow under the assumptdon vou will be workiiag?
$Month / / / / /Do not know ( ) 9
( ) 8
37. How much do you think your monthly income will be when start workingafter you have finished your studies?
$ Mouth / / / / /Do not know ( ) 9
( ) 8
38. After you finished high school, what did you do?
- Studied ( ) 1)Goto 41- Studied and wc ked ( ) 2)- Worked oly ( ) 3- Other activity 4
39. Did you apply and/or take any examination to enter in some careeror'program?
- ( ) I Go to 45- Yes ( )2

- 109 -
40. Give us the reasons for not continuing your studies after you finishedhigh school. / J.
- You were not prepared to continue your studies I ) 1 )- You had no money for studying ( ) 2 )- You were not accepted into any institution ( ) 3 ) Go to 45- You wanted to work ( ) 4)- Personal or family problems ( ) 5 )- Other, What?
( 8
41. What did you start studying after finishing high school?
/ / 88(Write the name of the course or program)
42. Are the studies which you started then, the same ones which you aredoing now?
- Yes ( ) 1 Go to 45- No ( )2- You are not studying now 3 )3
43. Why did you quit the career or program that you started after finishinghigh school? L
- You did not like it I- You thought it was too hard ( ) 2- You had no money 3- You moved to live somewhere else ( ) 4- Personal or family problems ( ) 5- Other, what ? ( )
44. How long were you studying that career or program?
Years Months

- 110 -
C3APTER AV. '70RK
45. Are 7ou working now? /
- No ( ) 1 Go to 63- Yes 2 )2
46. What is your occupation or job?
WRITE CLEARLY AND I' DETAIL / /)88
N.A. ( )
47. In this job, you are: / - Apprentice I- Skilled worker (blue collar) ( ) 2- Employee ( ) 3- Technician ( )4- Supervisor ( )5- Owner or self-employed C ) 6 Go to 49- Other, what? ( )
( ) 8
48. Row much is your gross monthly income? (before deductions)
S Month / / / I Go to 50( ) 8
N.A. ( ) 9
49. How much do you make monthly for your work?
$ Month / /f/
N.A. ( ) 9
50. How much do yoL think you will be earning per month five yearsfrom now?
$ Month / /1/
(A.C ) 8N.A. 9

51. What is the economic sector you are working in: / /
- Agriculcure - fishing ( )- Mining 2- Manufacturing ( )3- Public Services ( 4- Construction 5- Commerce 6- Transportation ( )7- Finances 8- Private Business 9
52. You are working: JI
- in the public sector (government) t ) 1- in the private sector ( )2
C 8
53. You are working: JI
- Part-time ( ) .
- Full-time ( )2(8
54. Do you have people working under you? / /
No ( )Yes ( ) Row many? /_/_88
//88
55>. Row many hours per week are you working in this job? / / I
Hours ( ) 88
56. How long have you been in this job? / / /
- Months - ()8- Years 88
57. How did you get this job? //(Mark the most important)
- Newspaper advertisement ( )1- Employment Office ( )2- Through friends 3- Through relatives 4- Through your school 5- Your formed your own business ( ) 6- Applying to the enterprise 7- Other, what? ( )8.

- 112 -
58. How long were you looking for this job?
- Weeks /1/- .Yonths
t ) 88
59. Taking into account your current job, which areas or subjectsthat you studied in high school do 70u think should have beentaught more extensively? (Write only two subjects.)
2.( ) 88
60. Taking into account your current job, which areas that were nottaught in high school do you think should have been taught?(Write only two subjects).
1.
2.( )88
61. To perform the job you are doing now, what area or subject studiedhas been the most useful? (Write only the most important)
1.( ) 88
62. To what extent have your high school studies, including practices,proven useful in your current job? / /
- Useless ( )1- Of some use ()2- Very useful ( )3
( )S8
63. After finishing high school, did you have any occupation orremunerative job?
- No I ) Go to 78- Yes 2 )
64. What was the first remunerative job you had after you finishedhigh school? //
W1ITE IN DETAIL( ) 88.

- 113 -
65. In this first remunerative job you were: / /
- Apprentice ( ) 1- Skilled worker (blue collar) ( ) 2- Employee ( )3- Technician ( )4- Supervisor 5- Owner or self-employed ( )6- Other, what? 8
- N.A. ( ) ( )
If the answers to questions 64 and 65 are the same as those to
questions 46 and 47, go to question 66; otherwise go to 67.
66. What was the first gross salary or profit you made in that firstjob? (Write the salary before deductions.)
$ Month / / / / Go to 78
()8
67. How much did you make monthly for your work?
$ Month
( ) 8NR( )9
68. In which of the following economic sectors were you working? / /
- Agriculture - fishing ( )1- Min;Lng ( )2- Manufacturing ( )3- Public Services ( )4- Construction ( )5- Commerce () 6- Transportation ( )7- Finances 8- Personal Sern-ces ( )9
69. You were working: L/
- In the public sector (government) ( ) 1- In the private sector ( )2
( )S8

- 114 -
70. This job ias:
- Part-time (- Full-time ( )2
( )8s
71. Row many hours per week did you work in that job? / / /
- Hours ( ) 88
72. How did you get that job? /f(Mark che most iMDortanr.)
- NewspaDer advertisement ( ) 1- Employment office 2- Through friends ( ) 3- Through relatives- 4- Through your school 5- You formed your own business ( ) 6- Applying to the enterprise 7 )7- Other, what? ( )
73. How long after you graduated were you lcoking for that job?
- Weeks / //- Months (. ) 88
( ) 99
74. Taking into account the first job you had after graduation, whichareas or subjects that you studied in hlgh school do you think shouldhave been taught more extensively? (Write only two subjects.)
2. ( ) 88
75. For that first job you had, which areas or subjects thatwere not taught in high school, do you think should have beentaught?(Write only two subjects.)
1.
2.t ) 88

- 115 -
76. Which areas or subjects of those you studied in high schoolincluding practical courses, were the most helpful in performingthat first job? (Write only two subjects). / I
1 . _ _ _ _ _ _ _ _ _ _ _ _ _ _ _
2 . _ _ _ _ _ _ _ _ _ _ _ _ _ _ _ _ _ _ _ _ _ _ _ _ _ _ _ C ) 8 8
77. To what extent have your high school studies, includingpractical courses, proven useful in your first job?
- Useless ( ) 1- Of some use 2- Very useful ( )3
( ) 8
CHAPTER V. UNEMPLOYMENT
78. During the last week, have.you done something to get a job?
- No ( ) lGo eo 84- Yes 2 )2
79. How long have you been looking for a job? / I
- Weeks- Months ( ) 99
80. What kind of job are you looking for? / //
WRITE CLEARLY AND IN DETAIL
81. At the present time, with what salary would you be satisfied?
$ Mouth()8
NR 9
82. How much do you think your monthly income would be five yearsfrom now under the assumption you will be working?
$ Month( ) 8
NE ( 9

- 116 -
83. W4ho is economically supporting you now? (the most important).t/1
- Parents ( ) 1- Relatives ( ) 2- Business snonsor ( ) 3- Savings 4- Friends ()5- Other, what? 6 )6
( ) 7
CHAPTER VI. MODERNITY
84. You believe that social changes occur mainly because of the: / /
- action of natural forces ( )1- action of great men ( )2- governent-s programs 3- action of organized groups ( )4- action of all people 5
85. Among the following reasons, what do you think isthe nain obstacle for developing the country? A lack of:
- monetary resources ( ) 1- natural resources ( )2- rational thinking C. ) 3- social organization 4
86. For you, the main purpose of education is: ii
- to provide general knowledge ( ) 1- to train you for working ( )2
87. Do you belong to:
NO YES- Sport Team ( )1 ( )2//- Literary Group ( ) 1 ( ) 2 7T/- Student's Organization ( ) 1 ( ) 2 7T/- Political Group ( ) I ( ) 2 7T/- Scientific Group ( ) 1 ( ) 2 7-/- Community Action Group ( ) 1 ( ) 2 7-/- lad Cross ( ) 1 ( ) 2 7-/- Social Club ( ) 1 ( ) 2 7T/- Labor Union ( ) 1 ( ) 2 7 /- Civic Group ( ) 1 ( ) 2 7'/
R Religious Group ( ) 1 ( ) 2 7-/- Cooperative ( ) 1 ) 2 7T/- PoLkloric Group ( ) I ( ) 2 7E/

- 117 -
88. How often do you read the newspapers? / /
- Never ( )1- Seldom 2 )- Several days per week ( )3- Everyday 4
89. For you, what are the main problems of the country at the presenttime? (Write the most important first and after that others)
_ _ _ _ _ _ _ _ _ _ _ _ _ _ _ _ _ _ _ _ _ _/ / /
_ _ _ _ _ _ _ _ _ _ _ _ _ _ _ _ _ _ _ _I / 1 /
90. What is most important for Colombia's future? / /
- Good luck ( ) 1- To trust in its leaders ( )2- Availability of economic resources ( ) 3- Government planning and action ( ) 4- Hard work from everybody 5
91. Which of the following characteristics do you believe should bethe most important in obtaining a good job? / /
- Belong to a well-known family (- ) 1- Having friends with influence ( ) 2- Having an educational degree 3 )- Having a technical specialization ( )4
92. Do you believe that somebody can be really a good person withouthaving religious beliefs? //
- No I - Yes 2
93. What is the type of news you are more interested in?
- Neighborhood news ( I- Local news 2National news ( )3
- International news 4

- 118 -
94. Two young men stopped their vork ia a carpentry shop and startedlooking for a di.ferent way to produce the same amount of boxes inless time. The father of one of them said that ic was a good ideato think about it. On the contrary, the father of the other onesaid that the boxes have always been made in the same way, so itwould be useless to search ;or new ways to make boxes. With whichfather do you agree? / /
- With the first one () I- Wich the second one ( ) 12
95. If you have one appointment with somebody at noon, and thatperson does not come, after how muen time do you start thinkingthe person is late?
(write the time in minutes)
96. Five years from now, what do you think your economic situationis goiag to be?
- A lot worse than now ( )1- Worse than now ()2-The same as now ( )3- Better than now ( )4- A lot better than now ( )5
97. At the present time in Colombia, what do you think is the mostuseful asset for gecting a good job?
1/
- Belonging to a family high in social status ( ) 1- Raving influential friends 2 )2- having an educational degree ( ) 3- having a technical specialization ( ) 4
98. Finally, if a year from now we want to get in touch with you,give an address where we can reach you.
Address:
Phoue:
City:
Interviewer same

- 119 -
Interviewer observations
Supervisor tName
Interview approved by Supervisor:
- No / /
- Yes _ /
Coding observations


World Bank ,," Education. . E:DUCACION Wadi D. Haddad, coordinating
Publications authorof Related N_ Emphasizes the pervasive role of edu-of* Relatedcation in development and draws ex-
lnterest W ;; ; tensively on the Bank's experience InInterest ' 7 . '1 education for two decades and itsclose collaborative ties with other in-ternational agencies, individuals, and
Alternative Routes to Formal i .Education: Distance Teaching , Institutions of developing countries.Sector Policy Paper 1980 143 pages (in-for School Equivalency ., cluding 19 annexes, map)Edited by Hilary Perraton ' ' .&,, ._ Stock Nos BK 9071 (Entglish), BK 9072The demand for education is outstrip- (French), BK 9073 (Spanish) $5ping the capacity of many countries tobuild schools or to recruit and payteachers To meet this demand and to Basic Education and Spanish Programas de formacion profes-provide access to education to individ- Agricultural Extension: Costs, siotial su evaluacion economica. Editorialuals who are unable to attend regular Effects, and Alternatives Tecnos, 1977schools, educators throughout the Hilary Perraton and others ISBN 84-309-0747-5, Stock No IB 0536.world are trying to develop alterna- $6tives to the traditional classroom One Addresses the effectiveness of usingof these alternatives-known as dis- mass media for agricultural extensiontance teaching-combines correspond- and basic education Includes a review The Educational Use of Massence courses with radio or television of the literature on the effectiveness of Mediabroadcasts and occasional face-to-face agricultural extension and on the use Gloria Feliciano, and othersstudy of mass media for rtiral education Staff Working Paper No. 497. 1981 1729Does this alternative work? Is it Case studies from Mlalawi, Cameroon, pages (including bibliography)cheaper7 This book is the first attempt ing mass media in widely different Stock No. WP 0491. S5to answer such key questions It exam- ways.ines the variety of wavs In wshich dis- wv.Education and Basic Humantance teaching has bein used, pro- Staff Working Paper No 564 1983 308 Needsvides comparisons of specific cases, pages Abdun Nooranalvzes their costs, and considers the ISBN 0-82713-0176-4 Stock No. WP 0564 Sta Working Paper No 450 1981. 68effectiveness of distance teaching ver- $15. pisus traditional education. pages (incltiding 2 annexes)
Charging User Fees for Social Stock No. WP 0450 $3.The Johns Hopkins University Press 1982 Services: The Case of Education and Income344 pages Education in Malawi Edited by Timothy King, preparedLC 82-7233 ISBN 0-8018-2587-3, Stock Mateen Thobani by Mary Jean Bowman and othersNo JH 2587 535 hlardcover An analysis of one wvay to reduce the Staff Working Paper No 402 2980 323
problem of recurrent expenditure in pages (including appendix, bibliographly)social sector services Argues that the Stock No WP 0402 $55
Attacking Rural Poverty: How deterioration or curtailment of servicesNon-Formal Education Can resulting from low user charges affects The Effects of Education onHelp the poor disproportionatelv, and con- HeIthPhilip H. Coombs and siders conditions under which raising eaManzoor Ahmed charges would increase efficiency Susan H. Cochrane and otherswhile reducing the financing problem Staft Working Paper No 405 1980 95Educational efforts outside the formalschool svstem that offer potential for Staff Working Paper No 572 1983 35 pages.rural development and productivity. pages. Stock No. WP 0405 $3Thle Johns Hopkins University Press, 1974, ISN 0-8213-0779-9 Stock No WP 0572 The Evaluation of Human3rd paperback printing, 1980 310 pages Capital in Malawi(including 3 appendixes, references, index). The Economic Evaluation of Stephen P. HeynemanISBN 0-8018-1601-7, Stock No IH 1601 Vocational Training Programs Staff Working Paper No 420 1980. 107$10.95 paperback Manuel Zymelman pages (including references, 21 tables. 6Spanish La lIcha contra la pobreza ruiral A methodology for appraising the cost annexes)el aporte de la educacion no formal Edito- effectiveness of alternative methods ot Stock No. WP 0420 S5rial Tecnos. 1975 industnal training in developing coun-ISBN 84-309-0559-6, Stock No IB 0525 tries Farmer Education and Farm$10 95. The lolinis Hopkins University Press, 1976 Efficiency
134 pages (incldinig chart, 3 appendixes, Dean T. Jamison and Lawrence J.bibliography) Lau
Prices subject to change without notice LC 76-4868 ISBN 0-8078-7855-9, Stock This book complements earlier studiesand may vary by country. No. IH 1855 S6 paperback by reviewing existing literature on the

relation between farmer education and ing and improvement of the vocational Staff Working Paper No 624. 1983. 116farm efficiency. The authors then are training system. pages.able to confirm these earher findings- Staff Working Papers No. 554 1983 41 ISBN 0-8213-0291-4.Stock No WP 0624.which strongly suggest that more edu- Saff WPcated farmers are more productive, pagesparticularly where new inputs and ISBN 0-8213-0144-6. Stock No WP 0554. Mmethods are available-by using new $3 Mexico's Free Textbooks:techniques to examine new data sets Nationalism and the Urgencyfrom Korea, Malaysia, and Thailand. The Influence of School to EducatePnce data from Thailand are used to T n o Peter H. Neumann andtest the effect of education on the abil- Resources in Chile: Their Maureen A. Cunninghamity of a farmer to adjust the pnces and Effect on Educational Maure ing ham
compslbn o hi ouputto he re- Achievement and Occupational Staff Working Paper No. 541 1982 148composition of his output to the pre- Acivmn n cuainl pagesvairhng prices Attainment ISBN 0-8213-0101-2 Stock No. WP 0541.The Johns Hopkins University Press, 1982 Ernesto Schiefelbein, Joseph P. $310 pages (including bibliography, appen- Farrell, and Manuel Sepulveda-dixes, index). StuardoLC 81-47612. ISBN 0-8018-2575-X, hard- Checks out impact of investments in Primary Schooling andcover. Stock No. JH 2575. $27 50 school resources as reflected by text- Economic Development: AHigher Education in book use, academic achievement and Review of the Evidence
Developing Cou ntries: A Cost- success in the labor market. For maxi- Christopher ColcloughDeveloping Countries: A Cost- mum benefit, investments should be Staff Working Paper No 399. 1980 31Benefit Analysis preceded by study of teacher attitudes pages (including references, 5 tables).George Psacharopoulos toward use of resources, be applied Stock No WP 0399 $3.Staff Working Paper No 440. 1980 129 early in the educational process andpages (including references, tables). take into account malnutntion and Primary School Participationother external problems andmats Snteool Distribuption iStock No WP 0440 $5 Staff Working Paper No. 530 1983 118 and Its Intemal Distribution in
pages Eastem AfricaNEW ISBN 0-8213-0245-4 Stock No WP 0530. Jack van L. Maas and Bert Criel
$5 Staff Working Paper No. 511. 1982. 105How Secondary School pagesGraduates Perform in the ISBN 0-8213-0055-5. Stock No. WP 05Z1.Labor Market: A Study of NEW$5IndonesiaDavid H. Clark Manpower Issues in Publishing for Schools:Investigates whether or not higher sec- Educational Investment: A Textbooks and the Lessondary education should be expanded Consideration of Planning Developed Countriesin Indonesia Compares employment Processes and Techniques Peter H. Neumannpatterns and earning rates of gradu- George Psacharopoulos, Keith Staff Working Paper No. 398. 1980. 81ates who enter the labor market with Hinchliffe, Christopher Dougherty, pages (including 2 appendixes).that of people having less education. adRbno olse tc oW 38$Results of the National Labor Force and Robinson Hollister Stock No WP 0398 $3Surveys suggest that academic senior Outlines for educators and economistssecondary schools are the best invest- a vanety of approaches to improve The Use of First and Secondment except in local situations where manpower analysis. Advocates replac- Languages in Primaryspecialized secondary schools deserve ing a dominant technique with a well- Education: Selected Casea higher prionty structured planning methodology StudiesStaff Working Paper No. 615. 1983 88 Recommends a broad approach to be Nadine Dutcher
pages ~~~~~~~~~used to analyze the relationship be-Pages tween manpower and the educational Staff Working Paper No. 504. 1982 65ISBN 0-8213-0260-4.Stock No. WP 0615. system. Examines planning tech- pages (including annex, references). Eng-$3. niques, three points of view (country, lish and Spanish.
technical assistance agency, lending Stock No WP 0504. $3.Human Resources Planning in agency), and the role of manpowerthe Republic of Korea: analysis planning in developing coun- Worker-Peasant Education inImproving Technical Education tries. Contends that forcing all man- the People's Republic of Chinaand Vocational Training power questions into any single ana-NaJ.Cletlytical framework results in low-quality Nat J. CollettaKye-Woo Lee analysis and low-quality educational Staff Working Paper No. 527. 1982. 94Provides a basis for human resources investments Cites a need for continu- pages.planning during a period of far-reach- ity of manpower analysis through the ISBN 0-8213-00504 Stock No. WP 0527.ing structural change. Focuses on labor development of a planning methodol- $3market problems and their solution ogy Suggests that such analysisthrough institutional hnkages between should go beyond identifying and pre- Prices subject to change without noticeformal education and vocational train- panng specific education projects. and may vary by country.

E 2IThe World BankPublications Order Form
SEND TO: YOUR LOCAL DISTRIBUTOR OR TO WORLD BANK PUBLICATIONS(See the other side of this form.) P.O. BOX 37525
WASHINGTON, D.C. 20013 U.S.A.
Date
Name Ship to: (Enter if different from purchaser)
Title Name
Firm Title
Address Firm
City State_ Postal Code Address
Country Telephone ( ) City State_ Postal Code
Purchaser Reference No. Country TelephoneI
Check your method of payment.Enclosed is my Ol Check O International Money Order Ol Unesco Coupons E International Postal Coupon.Make payable to World Bank Publications for U. S. dollars unless you are ordering from your local distributor.
Charge my O VISA El MasterCard El American Express E Choice. (Credit cards accepted only for orders addressedto World Bank Publications.)
Credit Card Account Number Expiration Date Signature
El Invoice me and please reference my Purchase Order No.
Please ship me the items listed below.
Customer InternalStock Number Author/ Title Routing Code Quantity Unit Price Total Amount S
All prices subject to change. Prices may vary by country. Allow 6-8 weeks for delivery.
Subtotal Cost $'Ibtal copies Air mail surcharge if desired ($2.00 each) $_ _
Postage and handling for more than two complimentary items ($2.00 each) $S
'Ibtal SThank vou for vour order.

Distributors of World INDONESIA Attn. Mr. J.M. HernandezPt. Indira Limited Castello 37
Bank Publications Attn Mr Bambang Wahyudi MadndJI, Dr Sam Ratulangi No. 37 SRI LANKA AND THE MALDIVESJakarta Pusat Lake House Bookshop
ARGENTINA IRELAND Attn. Mr. Victor WalataraCarlos HMrsch, SRL, TDC Publishers 41 Wad Ramanayake MawathaAttn Ms. Monica Bustos Attn. Mr James Booth Colombo 2Florida 165 40 piSO 12 North Fredenck Street SWEDENGalena Guemes Dublin I ABCE Fntzes Kungi, Hovbokhandel
JAPAN Attn Mr Eide SegerbackAUSTRALIA, PAPUA NEW GUINEA, Eastern Book Service Regenngsgatan 12, Box 16356FIJI, SOLOMON ISLANDS, Attn: Mr. Terumasa Hirano S-103 27 StockholmWESTERN SAMOA, AND 37-3, Hongo 3-Chome, Bunkyo-ku 113 SWITZERLANDVANUATU TkoLibraine PayotThe Australian Financial Review Tokyo yInformation Service (AFRIS) KENYA Attn. Mr. Henn de PerrotAttn Mr David Jamieson Afnca Book Services (E A ) Ltd 6, rue Grenus235-243 Jones Street . Attn Mr M.B. Dar 1211 GenevaBroadwav P.O Box 45245 TANZANIASydney, 1SW 20001 Nairobi Oxford University Press
BELGIUM ~~~~~KOREA, REPUBLIC OF Attn. Mr. Anthony TheoboldPublicahons des Nahons Unies Pan Korea Book Corporation Maktaba Road, P.O Box 5299Attn Mr. jean de Lannoy Attn Mr. Yoon-Sun Kim Dar es Salaamav du Roi 202 P O Box 101, Kwanghwamun THAILAND1060 Brussels Seoul Central Department Store, Head Office
MALAYSIA Attn Mrs. RatanaCANADA Unvriyo aaaCoeaie306 Silom RoadLe Diffuseur BUvkersity of Malaya Cooperative BangkokAttn Mrs Suzanne Vermette Boo s op Ltd.C.P 85, Boucherville J4B 5E6 Attn Mr. Mohammed Fahim Ht: Ailn Mrs SunanQuebec P.O Box 1127, Jalan Pantai Baru 308 Silom RoadCOSTA RICA Kuala Lumpur Bangkok
LAbrena TreHos ChabeI MEXICO UNITED KINGDOM ANDCAttn: -M3r Hugo Fhmernande GeINFOTEC NORTHERN IRELANDCalle 11-13, Av. Fernandez Guell Attn Mr. Jorge Cepeda Microinfo Ltd.San Jose San Lorenzo 153-1I, Col. del Valle, Attn: Mr Roy SelwynDENMARK Deleg. Benito Juarez Newman Lane, P 0. Box 3Sanfundslitteratur 03100 Mexico, D F. Alton, Hampshire GU34 2PGAttn. Mr Wilfried Roloff NETHERLANDS EnglandRosenderns Alle 11 MEB NTDSAEDK-1970 Copenhagen V Attn Mr Gerhard van Bussell The World Bank Book StoreEGYPT, Arab Republic of Noorderwal 38, 600 19th Street, N.W.Al Ahram 7241 BL Lochem Washington, D.C 20433Attn Mr Saved El-Gabn NORWAY (Postal address. P 0 Box 37525Al Galaa Street Johan Grundt Tanum A S. Washington, D.C. 20013, U.S A.)Cairo Attn Ms. Randi Mikkelborg Baker and Taylor CompanyFINLAND P 0. Box 1177 Sentrum 501 South Gladiola AvenueAkateeminen Kirjakauppa Oslo 1 Momence, Illinois, 60954Attn Mr Kan Litmanen PANAMA 380 Edison WayKeskuskatu 1, SF-00100 Ediciones Librena Cultural Panamena Reno, Nevada, 89564Helsinki 10 Attn Mr. Luis Fernandez Fraguela R 50 Kirby AvenueFRANCE . Av 7, Espana 16 Somerville, New Jersey, 08876World Bank Publications Panama Lone 1 Commerce, Georgia 3059966, avenue d'lena PHILIPPINES75116 Paris National Book Store Bernan AssociatesGERMANY, Federal Republic of Attn- Mrs. Socorro C. Ramos L73nhaGorg M arland, 20761 aUNO-Verlag 701 Rizal Avenue 9730-E Maryland, 20761Attn Mr Joachim Krause Manila Blackwell North America, Inc.Simrockstrasse 23 SAUDI ARABIA 1001 Fries Mill RoadD-5300 Bonn 1 Janr Book Store Blackwood, New Jersey 08012HONG KONG, MACAU Attn- Mr. Akram Al-Agil Sidney Kramer BooksAsia 2000 Ltd. P O Box 3196 1722 H Street, N W.Attn. Ms Gretchen Weanng Smith Riyadh Washington, D C. 200066 Fl, 146 Prince Edward Road SINGAPORE, TAIWAN, BURMA United Nations BookshopKowloon Information Publications Private, Ltd United Nations PlazaINDIA Attn Ms Janet David New York, N.Y 10017UBS Publishers' Distnbutors Ltd. 02-06 1st Floor, Pei-Fu Industrial VENEZUELAAttn Mr D P Veer Building Lbrena del Este5 Ansari Road, Post Box 7015 24 New Industnal Road Attn. Mr. Juan PencasNew Delhi 110002 Singapore Avda Francisco de Miranda, no 52(Branch offices in Bombay, Bangalore, SPAIN Edificio Galipan, Aptdo. 60.337Kanpur, Calcutta, and Madras) Mundi-Prensa Libros, S A. Caracas 1060-A


The World Bank
Headquarters European Office Tokyo Office1818 H Street, N W 66, avenue d'l6na Kokusat BuildingWashington, DC 20433, USA 75116 Paris, France 1-1 Marunouchi 3-chome
Telephone (202) 477-1234 Telephone (1) 723-54 21 Chiyoda-ku, Tokyo 100, JapanTelex WUl 64145 WORLDBANK Telex 842-620628 Telephone (03) 214-5001
RCA 248423 WORLDBK Telex 781-26838Cable Address INTBAFRAD
WASHINGTON DC
ISSN 0253-2115/lSBN 0-8213-0383-X