The Designer's TQM Toolkit 141 - Home Page - Design … Designer's TQM Toolkit 141 ... cent of the...
39
The Designer's TQM Toolkit 141 and the tally: Frequently used 22 Occasionally used 14 High applicability 20 Moderate applicability 17 Low applicability 4 Not applicable 12 This approach is reminis- cent of the old full-page ads from the Sears Roe- buck catalog, laying out the 497-piece master mech- anics tool set. You may not need the 17-piece left- handed metric monkey wrench collection with chrome knurled microme- ter calibration doodads. 4.2 The Designer's TQM Toolkit Lists of tools can never be complete. Most tools exist in multiple forms and variations. New variations are constantly being invented. Most of the terminology has yet to be standardized. - J. M. Juran Purpose To outline the techniques that have evolved as standard 'tools' in the TQM world, and to explain them in simple terms appropriate to architectural/design practice. The whole toolkit: a wrench for every nut On the pages that follow is a set of comprehensive tables which identify 90 TQM tools, techniques and systems. The first 48 are those listed in Peter Mears' excellent book Quality Improvement Tools & Techniques. The remainder are identified by Deming, Juran, Crosby and Stasiowski/ Burstein. Where these relate to ISO 9000, the ISO 9000 system element is given. For those who wish to read further on any of these tools, the page numbers of the sources are given. It should be noted that the referencing is not intended to be complete; only to serve as a general guide to one place where more information may be found. In the fourth column of these tables I have made an attempt to define whether the tool/technique was already being used by design professionals, if so, how much, and if not, how applicable it would be. This assignment of applicability is personal and subjective; I expect others would disagree with some of the assumptions made. There are two reasons to make these assignments. The first is to show that many design professionals are already using many TQM tools; it isn't a totally new technology to us. The second is to provide a way to focus; to discuss in more detail those tools/techniques which are NOT in common use in our industry, but which ARE likely to be of value to us. Following the tables is a brief description and example of those tools which I have given a 'High' or 'Moderate' applicability rating, and those which are 'Occasionally used'; and how they might be applicable to design practice.
Transcript of The Designer's TQM Toolkit 141 - Home Page - Design … Designer's TQM Toolkit 141 ... cent of the...

The Designer's TQM Toolkit 141
and the tally:Frequently used 22Occasionally used 14High applicability 20Moderate applicability 17Low applicability 4Not applicable 12
This approach is reminis- cent of the old full-page ads from the Sears Roe- buck catalog, laying out the 497-piece master mech- anics tool set. You may not need the 17-piece left- handed metric monkey wrench collection with chrome knurled microme- ter calibration doodads.
4.2 The Designer's TQM Toolkit Lists of tools can never be complete. Most tools exist in multiple forms and variations. New variations are constantly being invented. Most of the terminology has yet to be standardized. - J. M. Juran
Purpose To outline the techniques that have evolved as standard
'tools' in the TQM world, and to explain them in simple terms appropriate to architectural/design practice.
The whole toolkit: a wrench for every nut
On the pages that follow is a set of comprehensive tables which identify 90 TQM tools, techniques and systems. The first 48 are those listed in Peter Mears' excellent book Quality Improvement Tools & Techniques. The remainder are identified by Deming, Juran, Crosby and Stasiowski/ Burstein. Where these relate to ISO 9000, the ISO 9000 system element is given. For those who wish to read further on any of these tools, the page numbers of the sources are given. It should be noted that the referencing is not intended to be complete; only to serve as a general guide to one place where more information may be found. In the fourth column of these tables I have made an attempt to define whether the tool/technique was already being used by design professionals, if so, how much, and if not, how applicable it would be. This assignment of applicability is personal and subjective; I expect others would disagree with some of the assumptions made. There are two reasons to make these assignments. The first is to show that many design professionals are already using many TQM tools; it isn't a totally new technology to us. The second is to provide a way to focus; to discuss in more detail those tools/techniques which are NOT in common use in our industry, but which ARE likely to be of value to us. Following the tables is a brief description and example of those tools which I have given a 'High' or 'Moderate' applicability rating, and those which are 'Occasionally used'; and how they might be applicable to design practice.

142 TOOLS: Techniques for Managing Quality
The rest of this Part 4 goes into some detail about a few of the tools and techniques which are of particular signifi-cance in a quality management system for design.
Tables of Tools Legend
Source data reference key Refer Resources at end of Part 4 for reference Numbers are page numbers in text referenced
DMM = The Deming Management Method, Mary Walton
ISO = ISO 9000, system element as noted JQD = Juran on Quality by Design, J. M. Juran Q F = Quality is Free, Philip Crosby S&B = Total Quality Project Management,
Stasiowski & Burstein Applicability key # = by the design professions ## = to the design professions
F U = Frequently used by design professions O U = Occasionally used by design professions H = High applicability, rarely used # M = Moderate applicability, rarely used # L = Low applicability, rarely used # N A = Not generally applicable ##
Table 4.1: The basic TQM tools
Items 1, 2 and 4-8 are considered to be the seven basic quality improvement tools. Mears adds checklists and run charts (items 3 and 9) to these as they are closely related.
Name of tool/technique Source data Use, Notes Mears Other
Applica- bility
1 Flow chart 14, 18-22 JQD 46-51 DMM 100-102
O U Understanding situations
2 Check sheet 14, 23-28 H Factfinding 3 Checklist 15, 29 F U Factfinding 4 Histogram 16, 40-51 DMM 107-109 M Identifying problems 5 Pareto diagram 15, 29-40 JQD 57-60
DMM 103-105 S&B 283-284
M Identifying problems
6 Cause-and-effect (fishbone) diagram
16, 52-57 DMM 97-99 S&B 284-290
M Generating ideas; showing relationships between events
7 Scatter diagram 17, 57-61 DMM 109-111 L Visually gauging how a change in one thing affects another
8 Control chart 17, 67-90 DMM 111-116 N A Implementation; statistically-based variation identification
9 Run chart (line graph)
17, 61-67 DMM 105-107 F U Implementation; showing process output over time

The Designer's TQM Toolkit 143
Table 4.2: More TQM tools
Items 10-31 are later developments; additional tools which represent a further development of the concepts of the core seven tools.
Name of tool/technique Source data Use, Notes Mears Other
Applica- bility
10 Pie chart 91, 95-96 O U Show composition of whole 11 Bar chart 92, 97-99 F U Compare differences in data 12 Stratification diagram 93, 102-
107 F U Organizes categories, show structure
13 Frequency chart 93, 99-101
L Compare differences in data
14 Single case boring 94, 107-109
N A Depict unusual data relationship
15 Likert scale 94, 108-109
O U Measure subjective data
16 Radar chart 95, 109-114
M Shows relative strengths of key activities
17 Plan-Do-Check-Act (Shewhart cycle)
119, 122-123
DMM 84-86 H Outlines action/feedback process for simple activity structures
18 Personal quality checklist
119, 123-126
H Structures to individually effect change (Mears calls it one of the most powerful quality improvement tools)
19 Vision or mission statement; quality goals
119, 127-131
JQD 27-43 ISO s/e 1
H Establishes corporate goals (required by ISO 9000)
20 Deployment chart 120, 131-132
O U Assigns resources (required by ISO 9000)
21 Kaizen 120, 132 N A (note 1)
TQM concept extending continuous improvement throughout all aspects of employee's life; includes many other quality tools and techniques
22 Kanban 120, 133 N A An empty box is authority to manufacture parts to fill it
23 Poka-yoke 120, 133-134
S&B 308-309 L 'Idiot-proofing'; design to prevent assembling defects
24 SMED 120, 135-137
N A Means 'single minute exchange of dies' - for manufacturing only
25 Nominal grouping 121, 137-140
N A (note 2)
Idea generation and resolution for sensitive issues
26 Brainstorming 121, 137-140
F U Idea generation
27 Multivoting 121, 139-140
M Reduce list of ideas; used with brainstorming

144 TOOLS: Techniques for Managing Quality
28 Force field analysis, multivariable analysis
121, 140-142
S&B 302-307 M Understand driving and restraining forces; change analysis
29 Classifying quality problems
122, 142-143
M (note 3)
Sorts problems; internal/external; large/small
30 Improving perceived quality
122, 144-145
JQD 159-217 H Understanding client expectations; shaping marketing
31 Effective presentations
122, 145 F U Analyze factors in presentation
Notes: 1 Kaizen, which means 'improvement', is not so much a technique as a philosophy of life. We can think
of many brilliant designers who have approached their work with a commitment similar to Kaizen. Kaizen, however, includes many other quality techniques that do not have applicability to design.
2 Nominal grouping is a kind of structured brainstorming where everyone submits their ideas about an issue; then the ideas are organized and put up on a white board. The group votes on the ideas to arrive at a 'common' agreement. Idea generation and voting may be open or anonymous; the latter being used when the issue is sensitive (for example, if the question was to disband a department of the firm).
3 The technique of classifying quality problems forms the centerpiece of motivational guru Stephen Covey's time management system, which is illustrated in Chapter 5.5.
Are you a total quality person?
Scattered throughout Mears' text, with tick boxes to fill in, are questions that focus on the answer to the question at left. Here is Mears' aggregated list. What's your rating? (there is no evaluation scale; make up your own).
Seldom Sometimes Always ❑ ❑ ❑
I treat others fairly.
❑ ❑ ❑ If I am dealt a lemon, I make lemonade. ❑ ❑ ❑ I feel good about myself. ❑ ❑ ❑ I am proud of my achievements. ❑ ❑ ❑ I take personal pride and ownership in my job. ❑ ❑ ❑ When in conversation, I make positive comments that move the
discussion forward. ❑ ❑ ❑ I improve the quality of life for others. ❑ ❑ ❑ I attempt to improve the quality of my personal life. ❑ ❑ ❑ I set personal goals. ❑ ❑ ❑ I have specific plans to improve the quality of my personal life. ❑ ❑ ❑ I personally attempt to master something new, at least quarterly. ❑ ❑ ❑ I volunteer to help others in need. ❑ ❑ ❑ I have a healthy, positive outlook on life. ❑ ❑ ❑ I take control of my life and I do not rely on others to plan my future. ❑ ❑ ❑ I have developed realistic goals for my life, with achievable targets. ❑ ❑ ❑ I understand my values, which I follow in my personal life. (continued on page 145)

The Designer's TQM Toolkit 145
Table 4.3 Advanced quality improvement techniques
Mears notes of this group (p 147) "An application of any of (these) techniques ... requires both thought and careful planning."
Name of tool/technique Source data Use, Notes Mears Other
Applica- bility
32 Focus groups 147, 149-155
M Structured brainstorming
33 Benchmarking 147, 155-159
S&B 300-302 H Comparing your firm to others
34 Process ownership, team building
147, 159-163
QF 212-215 S&B 323 DMM 75-76
O U Employees identifying with firm goals
35 Customer needs mapping
148, 163-165
JQD 72-115 S&B 235-259
O U Organizes client needs; compares to processes
36 Quality functional deployment
148, 165-178
F U Formal briefing; detailed program development
37 Hoshin planning techniques (the seven management tools)
148, 179-190
F U (note 4)
Divides planning into 3 stages, uses the 7 tools to resolve planning issues; see also items 84-90
38 Gap analysis 148, 190-196
H Different views of providing service
39 Taguchi methods 148, 196-199
N A Statistical extension of improvement concepts into design
Notes: 4 Hoshin is a planning technique involving a number of tools familiar to many design professionals,
particularly those who work in facility management or interior design. Table 4.7 identifies the seven Hoshin techniques.
Seldom Sometimes Always
(Continuation of Mears' 'Are you a total quality person' questions:)
❑ ❑ ❑ I measure whether I am meeting my personal goals. ❑ ❑ ❑ I am open to changes in my life that will assist me to learn new things. ❑ ❑ ❑ I attempt to improve my home/family life. ❑ ❑ ❑ I admit my mistakes, and then move on with the goal of not making
the same mistake again. ❑ ❑ ❑ I strive for continuous learning. ❑ ❑ ❑ I practice positive reinforcement. ❑ ❑ ❑ I actively listen to others.

146 TOOLS: Techniques for Managing Quality
Table 4.4: Quality improvement systems
Items 40-48 are 'quality improvement systems' in Mears' structure, although I would suggest that ISO 9000 is more than 'quality improvement', and that the Baldridge Award, while certainly being a motivating device and structure for approaching TQM, is more of standard by which quality achievements are gauged.
Name of tool/technique Source data Applica- Use, Notes Mears Other bility 40 Quality cost system 201,
203-205 QF 178-181 H/M
(note 5) Identifies cost of poor quality
41 The learning organization
201, 205-207
H (note 6)
Conceptualizes self-learning by the firm
42 Customer/supplier agreements
201, 207-209
O U (note 7)
Details client's requirements
43 Shojinka 202, 209-210
S&B 180-186 F U (note 8)
Moves workers to suit demand, used with Just-in-time
44 Just-in-time 202, 210-215
S&B 186-193 N A Keep inventory low; applicable only to manufacturing
45 Quality teams 202, 215-221
QF 152-169 M Authority at production level; in design industry applicable only in very large firms
46 Quality council 202, 221-223
QF 220 M Formalized executive level TQM focus; in design industry applicable only in very large firms
47 ISO Standards 203, 224-228, 263-272
Refer Chapter 1.3
H Mears lists it as a 'quality improvement system', but its application is almost as broad as is TQM
48 Baldridge Award 203, 253-262
S&B 317-320 N A The pinnacle achievement in TQM, this award provides a rigorous structure for competing
Notes: 5 See Chapter 6.2. 6 See Chapters 5.1 and 5.2. 7 Design professionals very frequently use a low level of a 'customer-supplier agreement', the
architect-client agreement or the equivalent for other areas of design. Usually these documents are not specific about the client's requirements. The process of developing the program (called 'brief' in Commonwealth countries) is of great importance in ISO 9000, and is the subject of the third system element.
8 Design professionals, of course, move workers around to suit demand all the time, and have never needed a Japanese word to describe the process.

The Designer's TQM Toolkit 147
Table 4.5: More quality methods & techniques
Items 49-68 are tools, techniques or strategies not catalogued by Mears.
Name of tool/technique Source data Use, Notes Mears Other
Applica- bility
49 Management commitment
QF 149-152 ISO s/e 1 S&B 320-326
H Establishes management's role with respect to quality improvement
50 Identify customers JQD 44-67 S&B 173-180
M (note 9)
Understanding who will be affected by achievement of quality goals, and how
51 Develop process features
JQD 218-273 ISO s/e 9 S&B 291-300
H Modifying processes to respond to customer needs/wants
52 Quality audits QF 66-67, ISO s/e 17 S&B 344-351
H Determines whether firm is meeting its goals
53 Quality management maturity grid
QF 21-48 H Charts quality 'maturity' of the firm
54 Process controls & inspections
JQD 274-298 ISO s/e 10, 11, 12
N A Detect errors as they are made; prevention of defective products
55 Quality measurement
QF 169-178 ISO s/e 9 JQD 116-158
(note 10) Objective analysis of nonconforming work
56 Corrective action QF 191-198 ISO s/e 14 S&B 265-282
H Permanently remove the causes of error
57 Zero defects planning
QF 198-204 N A Structures events leading up to Z D Day
58 Z D Day QF 207-212 N A Event to demonstrate change to quality
59 Training JQD 438-461 QF 204-207 ISO s/e 18 S&B 206-211
F U Structured training to improve skills
60 Error-cause removal QF 215-218 ISO s/e 13
H (note 11)
Feedback loop from staff to manage-ment to identify causes of errors
61 Motivation & recognition
JQD 425-437 QF 218-220 S&B 335-344
H Fostering belief and rewarding achievement in quality improvement
62 Make Certain program
QF 241-249 (note 12) Structured elicitation of problems received by staff
148 TOOLS: Techniques for Managing Quality
63 Strategic quality planning
JQD 299-333 M Structured process for defining mission & goals; selection of strategies for achieving them
64 Multifunctional quality planning
JQD 334-362 M (note 13)
Structuring the quality improvement process
65 Departmental quality planning
JQD 363-406 L (note 13)
Carrying out the quality improvement process
66 Database, Santayana review
JQD 407-425
M Past quality history in accessible format
67 Project quality plan ISO s/e 2 S&B 59-60, 64
H (note 14)
Project-specific selection of applicable quality procedures
68 Design review ISO s/e 6 H (note 15)
Structured, minuted check of design appropriateness
69 Recruitment S&B 193-199 F U Upgrading of ability to deliver higher quality services through hiring
70 Induction S&B 199-200 O U Entry training to ensure new staff understand quality systems and standards
71 Performance evaluations
S&B 200-206 O U
Structured interaction between staff and management where each benefit from the other's appraisal
72 Partnering S&B 259-262 O U Replacing the adversary relationship between client and builder with a one that optimizes responsibilities and gains for both parties
73 Peer reviews S&B 326-328 H Structured evaluation of your firm's strengths and weaknesses by like professionals
Notes: 9 'Customers' here refers to stakeholders; all those who could be affected, including the public and
'internal' customers e.g. staff. 10 Quality measurement uses tools as appropriate for the industry. Generally, measuring actions is
less rewarding in the design professions than using other TQM techniques. 11 Error-cause removal is part of the corrective action process. 12 Crosby's 'Make Certain" program would have good application for large practices; less for the small
office. 13 Planning principles would find application in larger practices, especially in multi-office practices. 14 Project quality plans (PQPs) are a requirement under ISO 9000. See also p 174 and pp 297-298. 15 Virtually all design firms do some kind of design review, but the vast majority of it is the 'desktop
crit' informal review, where no record of the review is kept. Formal design review is a requirement under ISO 9000.

The Designer's TQM Toolkit 149
Table 4.6: Design quality techniques
This group of tools is specific to design or the design phase of a project.
Name of tool/technique Source data Applica- Use, Notes Mears Other bility 74 Concept review S&B 60 F U Comparing design features to broad
project requirements, including client brief, time and cost
75 Intradisciplinary review
S&B 60-61 F U Ensures qualified person from each discipline checks output of that discipline
76 Interdiscipline review S&B 61 F U Resolution of discrepancies between output of different disciplines
77 Drawing-specification crosscheck
S&B 61 F U Resolution of discrepancies between graphic and written instructions
78 Multifacility crosscheck
S&B 61 F U Resolution of discrepancies between parts of a large project designed by more than one team
79 Pre-tender check S&B 75-83 F U (note 16)
Structured process for detecting mistakes at completion of documentation state
80 Vendor review S&B 61-62 O U Obtaining product manufacturers' review to detect inappropriate applications, out-of-date selections
81 Constructability review
S&B 62-63 O U Ensuring that design does not include elements which are difficult or impossible to achieve on site
82 Operability review S&B 63 H Facility management review; ensuring design will be easy to operate
83 Record drawings S&B 159-165 F U Documenting changes between contract documents and built work
Notes: 16 All design firms believe in thorough pre-tender checking, but most experience difficulties in
actually doing it regularly. Very few have the structured approach of REDICHECK, developed by William Nigro. See also pp 199-200.

150 TOOLS: Techniques for Managing Quality
Table 4.7: Hoshin quality planning tools
Some of these quality planning tools have been long used by the design professions (refer Item 37).
Name of tool/technique Source data Applica- Use, Notes Mears Other bility 84 Affinity diagram 179, 181 F U Sort related ideas into similar groups
and identify each group 85 Interrelationship
diagram 179, 181 F U Identifies cause and effect links
between ideas/events 86 Tree diagram 180,
182-184 O U Organizes detail groups of tasks to
be accomplished 87 Matrix diagram 180,
185-186 O U Shows relationships between
activities 88 Matrix data analysis 180,
185-186 M A specialized scatter diagram used
to compare services you offer to services others offer
89 Process decision program chart (PDPC)
180, 186-187
M Maps events together with countermeasures that may be required in case a problem occurs
90 Activity network (Gantt chart, PERT chart, CPM)
180, 187-189
F U Relates events and time, establishes precedents for activities
School of Fishbone Diagrams

The Designer's TQM Toolkit 151
In the preceding seven tables, the following 37 quality tools, techniques and systems were identified as being of 'high' or 'moderate' application to design practice, but were only rated as rarely used by design professionals:
✓ Checksheet (H) ✓ Histogram (M) ✓ Pareto diagram (M) ✓ Fishbone diagram (M) ✓ Radar chart (M) ✓ PDCA (Shewhart) cycle (H) ✓ Personal quality checklist (H) ✓ Mission statement; quality goals (H) ✓ Multivoting (M) ✓ Forcefield analysis (M) ✓ Classifying quality problems (M) ✓ Improving perceived quality (H) ✓ Focus groups (M) ✓ Benchmarking (H) ✓ Gap analysis (H) ✓ Quality cost system (H/M) ✓ The learning organization (H) ✓ Quality teams (M) ✓ Quality council (M) ✓ ISO Standards (H) ✓ Management commitment (H) ✓ Identify customers (M) ✓ Develop process features (H) ✓ Quality management maturity grid (H) ✓ Corrective action (H) ✓ Error-cause removal (H) ✓ Motivation & recognition (H) ✓ Strategic quality planning (M) ✓ Multifunctional quality planning (M) ✓ Database, Santayana review (M) ✓ Project quality plan (H) ✓ Design reviews (H) (Refer Chapter 4.5) ✓ Peer reviews (H) ✓ Operability reviews (H) ✓ Matrix data analysis (M) ✓ Process decision program chart (M)
152 TOOLS: Techniques for Managing Quality
The following 14 TQM tools and techniques are used occasionally by design professionals, sometimes without knowing the name given them by the quality experts:
✓ Flowchart ✓ Pie chart ✓ Likert scale ✓ Deployment chart ✓ Process ownership; team building ✓ Customer needs mapping ✓ Customer/supplier agreements ✓ Induction ✓ Performance evaluations ✓ Partnering ✓ Vendor review ✓ Constructability review ✓ Tree diagram ✓ Matrix diagram
What about the 22 TQM tools and techniques which ARE frequently used by designers already? Shouldn't they be described as well, so readers who don't use them will understand them? Part of the answer is that there isn't room enough in this book to cover every aspect of quality management in design; the other part is that other works already describe the use of many of these tools in our industry. What this 'cataloging' does is to highlight a key point, which is that architects and other designers are already using 40% of the tools of TQM, although they may never have thought of it in those terms. This use, however, tends to be isolated; that is, these tools are used to accomplish specific purposes rather than seen as part of an overall, coordinated practice management strategy.
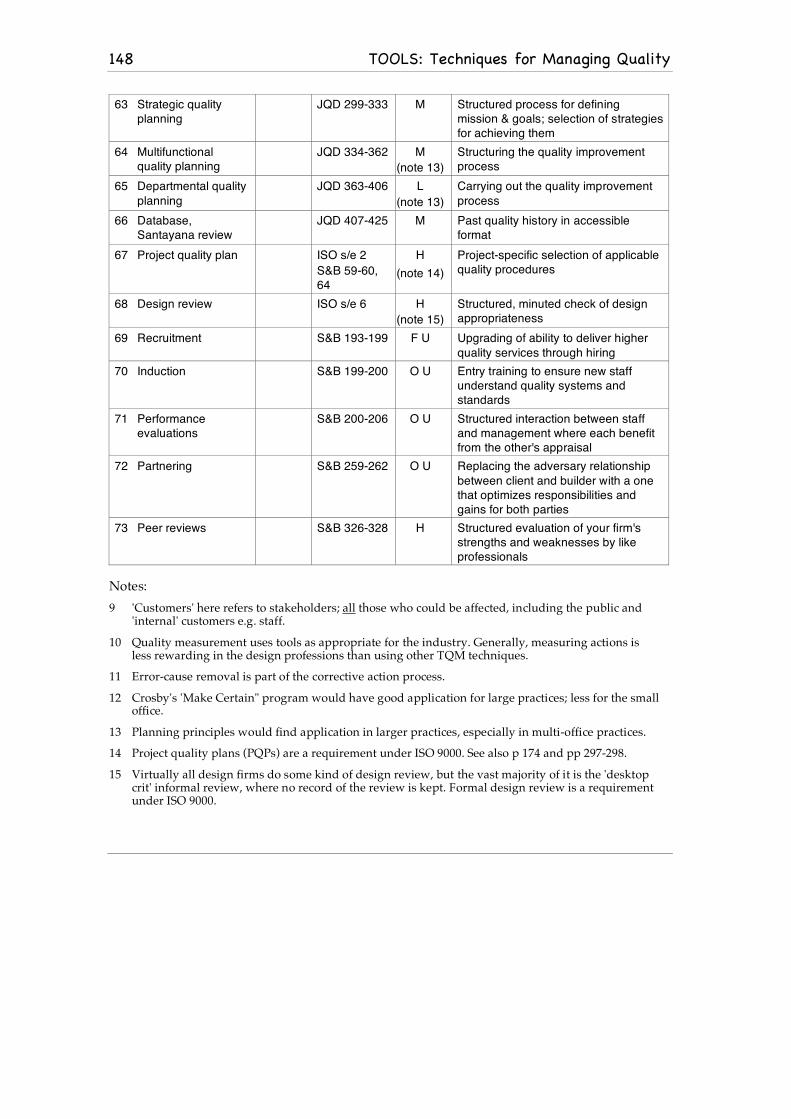
Checksheet Type: TQM basic tool Applicability: High More info reference: p 142/2
The purpose of check sheets is to facilitate and organize the collection of data. All design professionals must deal with a large quantity of data, which is usually highly diverse, comes from a wide variety of sources, and usually is poorly organized at source. The purpose of having data is to make decisions - the right decisions, the first time. Poor data = poor decisions = re-work = lost time = lost money. Peter Mears notes: (80) 'Data, by itself, is seldom useful.'
The Designer's TQM Toolkit 153
There are a number of reasons for data collection to 'go astray'. These vary in importance with the type of data being collected. In design, one problem that can occur (especially with less experienced staff) is that people collecting data have a 'perceptual' bias e.g. they see only what they are looking for. In other words, they interpret what they see to fit the mindset they bring to the problem. In so doing, they may miss relevant data which, if known, would change the design. Obviously this amounts to a flawed 'design input' which increases the chances of flawed design. Checksheets are purpose-designed, and it is always wise to think through the questions that you want answered before designing the checksheet, and then to get someone else to quickly review the questions for completeness. Checksheets can be used to simply record the incidence of something happening e.g. traffic counting; or can be used to organize the collection of qualitative data e.g. room data sheets. Sometimes simple checksheets can be used to quickly graphically compare different options e.g. the facilities available in different CADD software, or the bids on a project as per the example below.
BIDDER A B C D
1 Was bid received on time? ✓ ✓ ✓ ✓ 2 Was bid properly completed? ✓ ✓ ✓ 3 Was bid security included? ✓ ✓ ✓ 4 Was bid without exclusions or
qualifications? ✓ ✓
5 Were all schedules and supporting documents attached?
✓ ✓
You can see that from the construction of this checksheet that
a 'tick' is a positive. A quick glance tells you that bidder 'A' did everything right and bidder 'D' has a problem bid. Now suppose question 4 was phrased the other way, which might seem more natural: 'Did bid include any exclusions or qualifications?'. That change would make that tick answer negative, and would make the 'quick glance' assessment impossible. The checksheet would have been poorly designed, producing confusing results.

154 TOOLS: Techniques for Managing Quality
Flowchart Type: TQM basic tool Occasionally used by design professionals More info reference: p 142/1
Flowcharts are one of the most popular and ubiquitous quality management tools. Their chief use is to graphically identify, organize and represent process steps. There is no overall agreement amongst authorities on the meaning of symbols used in flowcharts, but there are similarities. For purposes of this example, the symbols used by Juran are used, as follows:
Activity symbol.
Decision symbol; from which 'yes-no' flow lines emanate. The path taken is in response to the question asked in the symbol.
Terminal symbol, used to identify the beginning or end of a process.
Document symbol, denoting an input or output document of the process.
A prototypical flowchart is shown opposite. This process is completely familiar, even instinctive, to all experienced design practitioners, even though few will ever have diagrammed the process.
Does the practice need this great TQM tool, the flowchart? Can we successfully manage the iterative process of design without them? If we use them, will we get back the time it takes to create them? The answer will depend on many factors, and will vary with firm size, project type, etc. Obviously, a key factor is complexity of the project: if forgetting a step in the process could expose the firm to loss or risk, then using flowcharts may be good insurance. Diagramming this process points out something that may not be so obvious from the 'experience' viewpoint: there are a lot of reasons why a project goes back to be redesigned! Obviously any failure along the way causes redesign after the design was thought to be complete. Quality management seeks to reduce this redesign; to save time and money. What this flowchart shows is the absolute importance of ensuring that as the design is developed, it takes into account all of the requirements by which it will ultimately be evaluated. Design may be necessarily iterative, but should not be more iterative than necessary.

The Designer's TQM Toolkit 155
Schematic Design Review Flowchart

156 TOOLS: Techniques for Managing Quality
Pareto diagram Type: TQM basic tool Applicability: Moderate More info reference: p 142/5
Pareto diagrams (81) are used to identify problems. This tool explains data using Juran's discovery of the 'vital few / trivial many' principle; sometimes expressed as the '80-20 rule': 20% of the causes account for 80% of the problems. The idea of the Pareto diagram is that it identifies areas requiring further study, by separating the 'vital few' from the 'trivial many'. I think we all have an instinctual awareness of this princi-ple; as a farm kid I grew up with the idea of 'separating the wheat from the chaff'. The Pareto diagram replaces the hunch with the facts. The validity of this principle was brought home to me sharply in 1994 when I was researching some data on con-struction cost and time growth for New South Wales Public Works, as preparation for their development of a strategy to reduce these factors in their building program. What I found, in almost every set of construction reports, that 15% or less of projects were causing 85-90% of cost/time growth. What this meant was that it would be foolish to develop 'across the board' remedies; what was needed was an 'early warning' program that could identify the problem projects before they turned into problems. These were the 'vital few' on which the spotlight needed to be aimed, if they could be identified. How would we use a Pareto diagram in design? Let's say we wanted to identify the principal causes of cost overruns in construction. We would first collect data on a number of projects, say all the projects for one year. We would check all change orders issued, count them according to type, and group them in order of frequency. Such a chart might look like this:
COST OVERRUNS - 1995 Item
Number of Occurrences
Cumulative Occurrences
Cumulative percent (%)
Client requested changes Consultant coordination error Specification error Drawing error All other errors
56 43 27 16 9
56 99 126 142 151
37.1 65.6 83.4 94.0
100.0
This data is then put into a Pareto diagram, as shown at right. Note that this method only tracks 'occurrences' rather than severity of the occurrence.
Back in Chapter 2.1 I made the observation that 'problems facing practices are ... those of which the practice is unaware'. I don't know how to test it, but my hunch is that there would be a high correlation between the design situation not previously encountered and the resultant project problems. Perhaps that is why we say 'experience is the best teacher, and our more experienced clients usually opt for building type experience in selection of a designer.

The Designer's TQM Toolkit 157
In TQM parlance, this is called 'discrete data'. What this data won't tell you is the relative value of the change orders - for that you need a different tool although you could have charted cost of overruns, but not cost and frequency both on the same diagram.
Nu
mb
er o
f ch
ang
e o
rder
s
0
151
100
50
0%
25%
50%
75%
100%
56
43
2716
9Client
changesCoord.
errorDrawing
errorSpec. error
Allother
37.1%
65.6%
83.4%
94.0%Cause of Cost Overruns - 1995
You may be thinking that this diagram isn't all that useful to you; you could get the same information just looking at the tabulation. True, but its real use is as a presentation device, to graphically demonstrate the facts. Obviously the pur-pose of the curve line is to show relative severity of the occurrence; the steeper the line, the more important the factor. If you thought this looks a lot like a bar chart, right again. As to interpretation of the above diagram, where you need to focus energy for improvement is obvious. On the day I wrote this, I was at a meeting at an architect's office; he showed me a Pareto analysis of 62 objections to a planning application he had compiled for a client, using 25 complaint categories. Not only was he able to show quite graphically what the significant objections were, he could group them by their geographic source location.
Histogram Type: TQM basic tool Applicability: Moderate More info reference: p 142/4 Mears has an excellent outline section on construction and interpretation of histograms.
A histogram looks like a Pareto diagram, without the curve line. Unlike the Pareto diagram, which measures units of data, the histogram is used when the data is 'continuous' or 'variable'; for example, measurements or money. If, for example, we wanted to see the pattern of change order costs over many projects, we could use a histogram. The conven-tion is to use as many categories of data as the square root of the number of events.

158 TOOLS: Techniques for Managing Quality
For example, if you had 150 change orders, you would round up from the square root (12.25) to 13 categories. The construction of a histogram has many steps, can be time-consuming, and the discussion of interpretation of the diagram is involved, more than there is room for here. If your work includes the interpretation of a lot of diverse data, such as ergonomic or sociological data, or measure-ments such as finding a pattern of discrepancies in floor slab heights, the histogram tool can be very useful. The average architectural/design office won't have much reason to use it.
Fishbone diagram Type: TQM basic tool Applicability: Moderate More info reference: p 142/6
The fishbone diagram, one of the most-used TQM tools, is also called a 'cause & effect' or Ishikawa diagram (after its inventor). It is used after a problem has been identified, to generate ideas for solution through identification of root causes of the problem. The general case is shown below.
The steps to construct a simple fishbone diagram: 1 Identify the 'effect' - the head of the fish; the problem you
want to solve. Draw the spine to the left. 2 Brainstorm causes; group them together as process head-
ings (usually 4-6, but no rule); add them to the diagram. 3 Ask 'why?' 5 times to each of these headings; enter the
answers off the main ribs of the fishbone. 4 Study and refine the results. Search for causes behind
causes until you have the complete causal picture.
Example: Let's say that you have decided to get to the root of the problem with consultant coordination errors that you identified with the Pareto diagram above. Your diagram may end up looking something like this:

The Designer's TQM Toolkit 159
Pie chart Type: TQM tool Occasionally used by design professionals More info reference: p 143/10
We see pie charts every day; they are widely used graphic means of 'at-a-glance' demonstration of quantifiable relationships.
Radar chart Type: TQM tool Applicability: Moderate More info reference: p 143/16
Radar charts are a bit like pie charts, but show relative strengths and weaknesses of responses as a distance from the center of a circle out to the circumference. They are particu-larly good for getting an overall image of the results of using the Likert scale, and thus graphically showing areas where improvement is needed. This diagram serves the same purpose as a bar chart.
28.5%
17.9%
37.1%
10.5%
6.0%Clientchanges
Consultantcoordinationerror
All otherDrawing error
Specifi-cationerror
Cause of Cost Overruns - 1995
Pie Chart Example
Client Satisfaction Survey
Control ofCost
Control of Time
Design
Communication ContractAdministration
3.9
4.8
2.9
6.8
5.4 Neutral line
Positiveresponses Negative
responses
Radar Chart Example

160 TOOLS: Techniques for Managing Quality
Likert scale Type: TQM tool Occasionally used by design professionals More info reference: p 143/15
You have seen Likert scales many times, but probably didn't know that they were called that. Likert scales are used to gauge attitudes and perceptions, and usually have five or seven categories of agreement or satisfaction, as shown below. They are often used in program development and facilities management to determine user preferences and satisfaction; and can be used to test client satisfaction.
PDCA (Shewhart) cycle Type: TQM tool Applicability: High More info reference: p 143/17 The PDCA cycle is not to be confused with Herman's Sole Practitioners Ezypark Cycle (SPEC), shown at right. SPEC is not actually a QM tool, but it is unparalleled for assessing and navigating traffic congestion.
Suggested to Dr. Deming by Walter Shewhart, and developed by Deming as a key part of his quality strategy, the PDCA cycle is a very important item in the TQM toolbox. It is the fundamental technique for ensuring that we learn from our past actions.
The details of the PDCA cycle and its application to design practice are dis-cussed in more detail in Chapter 5.1
Personal quality checklist Type: TQM tool Applicability: High More info reference: p 143/18
This tool takes your QM program directly to each person in your practice, starting with yourself and your partners if any. If you think about the 'weak links / strong links' idea of improving your quality delivery, it follows that each person in the firm will 'own' some of the strong and some of the weak links - each will have a different set.

The Designer's TQM Toolkit 161
I think the 4 pages Mears gives to this topic are worth the price of his book. He notes that the hardest part of using this tool is identi-fying what belongs on it.
It further follows that each of us will need a different checklist - tailored to our own 'improvement' needs. If you are a person who can't keep a timesheet, please go on to the next item; you are wasting your time reading this. Keeping a personal quality checklist will be much more demanding than simply recording how you spend your day. Below is Peter Mears' own checklist, from his book (Sorry, I haven't got one of my own to show you).
Personal Quality Checklist: Peter Mears Week of:
Defect category Mon Tue Wed Thu Fri Sat Sun Total
Excessive handling of paperwork
Not answering phone within two rings
Delayed return of forms
Not prepared for meeting
Office not clean at end of day
Typos in correspondence
Mission statement; quality goals Type: TQM/ISO 9000 tool Applicability: High More info reference: p 143/19; also p 93-94
Defining the purpose of your practice is a requirement of all versions of TQM and of ISO 9000, and is emphasized by every writer about these systems that I have read. In quality management theory, the core purpose of procedures is to help the firm achieve its mission, and therefore that mission must be defined if the procedures are to have any connective meaning. Mears differentiates between vision and mission statements thus: (82)
"Vision defines what we want to be. Mission defines the accomplishments needed that will result in realization of the vision."
Your mission and vision statements should be shorter rather than longer; reduced to be as concise as possible. This makes them easier to remember. Many companies put their mission statement on the backs of the calling cards of all staff; thus both reinforcing the message throughout the organization, and using it as part of the marketing message of the firm.
Deployment chart Type: TQM tool
A deployment chart is simply a graphical way of assigning responsibility for key actions to get something accom-plished. Example:

162 TOOLS: Techniques for Managing Quality
Deployment chart (cont.) Occasionally used by design professionals More info reference: p 143/20
= Primary responsibility
= Helper/assist
TASKS Hermione Frank Fred
Write goals & objectives
Standardize office forms
Work out electronic file coding
Work out paper file coding
Organize library
Organize samples room
Multivoting Type: TQM tool Applicability: Moderate More info reference: p 143/27
Multivoting is a technique for focusing - sifting out the 'vital few'. Brainstorming, with which we are all familiar, gener-ates a lot of ideas. Multivoting reduces them down to a short list which most agree are the most important. How it works: 1 Check list for duplications; combine & eliminate. 2 Number items to facilitate voting. 3 Each person votes for the most important items. All vote
for same number of items, which should be about 1/3 of total on list.
4 Tabulate votes. Eliminate all with one or no votes. 5 Repeat steps 3 and 4. The result is your list.
Force field analysis Type: TQM tool Applicability: Moderate More info reference: p 144/28
Force field analysis is a method for identifying forces that shape a situation, to better understand things that needed to changed, and what is required to make the change. The theory is that if the 'restraining' forces are stronger, change won't happen; if he 'driving' forces are stronger, change will take place. Change can be effected by reducing restraining forces or strengthening driving forces. Here's an example:
Current Situation: Ideal Situation:
Problem Statement :
Driving Forces Restraining Forces
Coordination of the client's consultants is an ongoing problem.
Our contract requires us to coordinate theconsultants, but they don't follow our sched-ule, so we are rushed at the end and don'thave time for checking.
Client's agreements with consultants wouldrequire them to work to our schedule.
123
Our time and profitability.Quality of the contract documents.Danger of cost blowouts due to errors.
123
Client doesn't seem interested.Consultants are understaffed.We don't approve payment of consultants.

The Designer's TQM Toolkit 163
Classifying quality problems Type: TQM tool Applicability: Moderate More info reference: p 144/29
As soon as a business starts to focus on quality issues, so many 'problems' are identified that the whole idea seems un-manageable. It is important to conserve the firm's resources; to work on only as many items as can be accommodated with-out compromising the ability to earn money. One way is to profile your delivery strengths (see pages 106-107). Another way is to 'classify' found problems: Are they 'big' or 'small', and are they internal or external to the practice? Example:
Motivational guru Dr. Stephen Covey advocates the use of this method to help you better manage your time. See Chapter 5.5
Internal External
Smal
l Pro
blem
Larg
e Pro
blem
Price cutting by our competition is hurting our market share.
We have had a claim filed on a project but we aren't at fault.
The person responsible for site administration has resigned; no one else in the office has much site experience.
Our filing system is a mess.
Improving perceived quality Type: TQM/ISO 9000 tool Applicability: High More info reference: p 144/30
Here we come back to the idea of 'meeting and exceeding the client's expectations'. Mears defines three aspects of the client's view as follows (83):
"Perceived quality is the customer's opinion regarding what they received. "Actual quality is what the customer feels they received. "Expected quality is what the consumer expects upon use of the quality or service."
Perceived quality is measured by the ratio of the actual quality to the expected quality: If 'more than 1', then they are satisfied; their expectations exceeded. Earlier I stated that you should never promise more than you can deliver. If you do, the perceived quality of your service will be 'less than 1', and the client will be unhappy, no matter how good the service was.
Sometimes practices promise too much to get work. Even if they then work very hard at pleasing the client, it may be impossible to meet the ultra-high expectation created. Improving perceived quality involves two parts: Promise less, and do more.

164 TOOLS: Techniques for Managing Quality
Focus groups Type: TQM technique Applicability: Moderate More info reference: p 145/32 Mears has an excellent section on focus groups - Refer pages 149-154 in his book. In particular, his steps for developing the questions to be asked is recommended reading.
Focus groups are widely used in market research to determine how people feel about a new product or service, or a new idea. On a recent project, my colleagues used focus groups to find out what people of different ages and ethnic backgrounds felt should be the key issues in establishing a museum of immigration for Australia. Some design practices have used this technique to learn more about how target groups evaluate the performance of the practice, and how the services of our industry are perceived by other groups. In the former case, one might invite in a number of former clients to discuss the service they got; in the latter case, one might organize a group of hospital administrators to discuss their view of what they expected from a health-care architect. Focus groups require a trained facilitator, and must 'focus' on a specific question. Constructing a good focus group takes care and significant advance preparation. My advice is to utilize the services of a firm who has these skills, until you have developed the skills yourself through participation.
Benchmarking Type: TQM/ISO 9000 technique Applicability: High More info reference: p 145/33
Benchmarking is the art of imitating others who are the best at something you do. Mears identifies five types of benchmarking: Internal, competitive, shadow, functional, and world-class. (84) The middle three of these have the most application to the design industries, because of the relative size of typical practices. Competitive benchmarking involves studying your competi-tion carefully to see how they perform their services, and comparing yours to theirs on a point by point basis. Shadow benchmarking means keeping a close watch on what industry leaders are doing, and watching how they change: offering new services, for example. Functional benchmarking compares indices of your firm to industry standard; for example the salaries and perks you give your employees, or your overhead multiple compared to other design practices. There are two stages to benchmarking : needs assessment and the benchmarking process itself. Needs assessment focuses the effort, by identifying clients' needs, and asking if your practice is meeting those needs, meeting them but not as well as the clients would like, and whether others are meeting them better than you.

The Designer's TQM Toolkit 165
Example: Let's say that you have learned (perhaps through a focus group) that clients would prefer that their engineers had better project management skills. How would your firm rate? The needs assessment process identifies the critical success factors; those of strategic importance to the practice. These factors must be known to do the benchmarking; they will determine what it is you study about the industry or your competition. This process defines these factors, estab-lishes your own performance against them, identifies those who perform the best in respect to these factors, collects data on their performance (which may not be easy), ana-lyzes the data, and finally develops strategies for improv-ing your performance against these higher standards.
Process ownership, team building Type: TQM/ISO 9000 technique Occasionally used by design professionals More info reference: p 145/34; also see Chapter 5.4.
Most designers would understand the importance of having their employees feel a sense of ownership about the practice. Some practice leaders have succeeded in this admirably; many have not. What is the right technique? In TQM, the process ownership technique is fairly involved, requiring that all employees identify the processes in their work, their 'suppliers' (those who precede them in the pro-cess flow) and their 'customers' (those who follow them in the process flow). The needs of these 'customers' are then analyzed to see what their needs are, and these are compared to the parts of the process over which the employee has control. Finally, the employees is invited to work out how she can modify her 'part' of the process so the people downstream can have more of their needs fulfilled. This formal process wouldn't be applicable to the great majority of design practices, because of the small size of most of them, and the fact that in the average design prac-tice, there is very little specialization of work. In ISO 9000, the need for process ownership is acknow-ledged, but there are no formal processes other than a requirement to have accurate role descriptions for all staff members. There are a number of process ownership steps that are applicable to even very small practices, including the following: ◆ Ask staff to write up their own job descriptions; discuss
the results with them until you both agree on their role.

166 TOOLS: Techniques for Managing Quality
◆ Reinforce the concept of the 'internal client' - every person who receives and uses the work of another. Be sure to set the example.
◆ Encourage staff to 'invest' in their own roles, by studying to see how they can make their own contributions to the practice more valuable, thus making themselves more valuable.
◆ Reward and immediately enact good suggestions. Paul Laseau has studied the application of systems to design. He rcommends using bar charts and simple PERT charts as a tool for improving working relationships at the project level. (85)
Customer needs mapping Type: TQM/ISO 9000 technique Occasionally used by design professionals More info reference: p 145/35
This technique continues the idea of the 'internal client'. It is a method for identifying external and internal clients' wants, and then checking to see how the practice satisfies those wants. Identifying the needs of external clients can come from sources such as focus groups or project briefing documents. Identifying the needs of internal 'clients' can come from sources such as process ownership development. The 'map' is a simple chart like the one shown below. The second column rates the needs, with (1) being lowest and (5) being highest. The effectiveness of the practice in meeting these needs is shown by the H-M-L letters in the boxes, where H = high, M = medium and L = low. These ratings are not made up by the practice's leaders, but are the result of surveys of clients, external and internal.
External Client Needs Map

The Designer's TQM Toolkit 167
Gap analysis Type: TQM technique Applicability: High More info reference: p 145/38
Gap analysis is a technique for understanding the differences in perceptions about the services offered by the firm. These differences may be internal or external. Mears identifies five such gaps: (86) 1 Client Expectation / Management Perception Gap. 2 Management Perception / Service Quality Specification
Gap. 3 Service Quality Specifications / Service Delivery Gap. 4 Service Delivery / External Communications Gap. 5 Expected Service / Perceived Service Gap. As you can see, there is a sequential nature to these 'gaps' in the service delivery process, and it could be that each gap is partly responsible for creating the next gap. This structure is particularly applicable to design practice. As earlier discussed, there frequently is a difference between what the client thinks is important (cost, time) and what the designer thinks is important (design). That's Gap 1. Gap 2 usually occurs because there is no service quality specification - its never been 'specified'. Who knows what it is? If staff are not 100% confident of management's service delivery perceptions, they are not likely to meet them: Gap 3. Gap 4 means that what we tell the client she will get is different from what the client gets (or thinks she got). This creates Gap 5, where the client's expectations exceed her perception of the value of what we deliver. The gaps are usually measured with Likert scales constructed to test the extent of the gaps.
Quality cost system Type: TQM/ISO 9000 quality improvement system Applicability: High/moderate More info reference: p 146/40
A Quality cost system identifies, measures and controls quality costs. Crosby defines the cost of quality as "the expense of doing things wrong". (87) This cost, for designers, is not only the payment of errors and omissions insurance and the deductibles when there is a claim, it is the wasted person-hours of drawing that get thrown away because of poor design planning, it is the necessity of putting the best people out on the jobsite to find the mistakes before the contractor does, it is the loss of reputation, and much more. There is a concern amongst professional design institutes that the cost of quality includes a lack of public confidence in the design professions generally. (Pogo was right.) The cost of quality is discussed in Chapter 6.2.

168 TOOLS: Techniques for Managing Quality
The learning organization Type: TQM/ISO 9000 quality improvement system Applicability: High More info reference: p 146/41
Peter Mears says that "TQM systems often fail because organizations have failed to deal with a current truth: continuous improvement requires continuous learning". (88)
He describes the learning organization as one which has moved from adaptive learning to generative learning: (89)
"Adaptive learning concerns itself with reacting to the changing business environment and coping with current situations. Generative learning expands an organization's capabilities and creates new oppor-tunities. Generative learning requires new ways of looking at the world. Generative learning sees the systems that control events and focuses on the systems rather than on the results or the event itself."
Peter Senge has researched and written about the learning organization. (90) Mears quotes Senge with respect to the five disciplines of a learning organization: Personal mastery, mental models, shared vision, team learning and system thinking. (91) I wish I had space here to include Mears' summary of Senge's work, but I don't - I urge you to read further on this. Senge's The Fifth Discipline: The Art & Practice of The Learning Organization is good stuff for design professionals. Thinking about the quotation above reminds me of a talk by Wayne Schmidt FAIA, at the AIA's Service Delivery in Architecture workshop in Seattle in March, 1995; where Schmidt quotes Wayne Gretzky as answering a question about his success with "Others go toward the puck, I go to where the puck is going to be." That's a learning organiza-tion!
Customer/supplier agreements Type: TQM/ISO 9000 quality improvement system Occasionally used by design professionals More info reference: p 146/42
We are quite used to the idea of a contract between the client and ourselves; most of us have got past relying on a handshake as a legal document. But what about that other client, the internal kind? At the simplest level, a jointly agreed job description is a client/supplier agreement (especially if we remember that both of us are both supplier and client). In TQM companies, there is an increasing focus on written agreements between departments; as a way of clarifying needs and defining expectations. ISO 9000 requires customer-supplier agreements; that is the whole purpose of system elements 4.3 and 4.6.
The Designer's TQM Toolkit 169
Quality teams Type: TQM quality improvement system Applicability: Moderate More info reference: p 146/45
One of my clients, a star design firm of about 35, has a quality team of six people representing all "corners" of the practice, which meets every two weeks. They are seeking certification under ISO 9000 to mark the 20th anniversary of the founding of the practice, and they've given themselves 16 months to get there.
A quality team is two or more people who meet regularly to discuss and resolve quality issues. A sole practitioner could conceivably be a quality team by talking to herself, but my advice would be to find another sole practitioner and talk to each other. Given the size of many of our practices, it makes sense to think of the quality team as spanning several firms. That is what happens in the quality workshops I run: Six to ten practices form a working group, and each practice sends one or two key people; this 'quality group' becomes an infor-mal forum for shared learning about quality systems. All but the smallest of these practices, however, will have an internal quality team. As we have already seen, there are diverse, very real pressures that mitigate against the development of quality systems and cultural change in the practice. As a practical matter, no firm will achieve its quality goals unless it formalizes the effort and the responsibility in a quality team. It is essential. For this team to be effective, however, there are some absolute ground rules:
◆ All functions of the practice must be represented, including secretarial/bookkeeping.
◆ Meetings must be to a regular schedule, with a program of actions to be accomplished and dates for results.
◆ The time spent (including appropriate preparation time) must be budgeted and chargeable to an overheads account.
◆ Management must give its absolute commitment to the process, as well as its enthusiastic support.
If the practice is large or multi-office, there will need to be a central coordinating quality committee, as well as working task groups with particular problems to research and make recommendations on (see next system).
Quality council Type: TQM quality improvement system Applicability: Moderate More info reference: p 146/46
The central coordinating quality committee noted above is called the Quality Council in TQM-speak. It must include senior management. Mears comments (92):
"It is not unusual to find organizations that have a quality council, but what is unusual is to find a council that is successful in implementing and directing their TQM program."

170 TOOLS: Techniques for Managing Quality
Mears says that the chief reason for this lack of success is that councils are often composed of executives who are used to operating autonomously. Obviously management's real commitment to the quality program is required for the system to be a success!
Management commitment Type: TQM/ISO 9000 strategy Applicability: High More info reference: p 147/49
In an ISO 9000 system, the chief function of management is called management review, and is the subject of Clause 4.1.3. This clause requires that management with 'executive responsibility' shall review the quality system at 'defined' intervals sufficient to ensure its continual suitability and effectiveness in satisfying the standard and the company's quality policy and objectives. 'Defined' is key here: the firm must schedule these reviews and do them as scheduled. Management commitment is Step 1 in Philip Crosby's 14 Step approach to quality.
Identify customers Type: TQM strategy Applicability: Moderate More info reference: p 147/50
You might think this 'TQM strategy' is a bit silly, until you realize that it means 'identify all customers', including the internal ones. As we have already seen, TQM theory puts great emphasis on this change in thinking, and this 'strategy' is more of the same. Juran devotes some 23 pages to the subject. Stasiowski & Burstein state that when a design firm grows, there is increasing rivalry between administrative managers and technical staff, and this "leads to an adversarial relationship that increases overhead costs, hurts morale, and encourages destructive office politics".(93) The key to this strategy is to understand how all 'customers' - internal and external - will be affected by achievement of quality goals. This understanding is essential if boycotting of the system is to be avoided.
Develop process features Type: TQM/ISO 9000 strategy Applicability: High More info reference: p 147/51
The essence of this strategy is to modify how you do things such that the results are more likely to enhance progress toward the quality goals. As pointed out in Chapters 3.1 and 3.2, it is first necessary to document the processes you now have, and then look at how much modification they will need to meet your quality goals and, if you go the ISO 9000 route, to comply with the standard.

The Designer's TQM Toolkit 171
Quality management maturity grid Type: TQM tool Applicability: High
This TQM tool is the invention of Philip Crosby, who says there are five stages to quality maturity. The purpose of the grid, shown below (94) is to figure out where you are now, and to see what changes you need to make to get to the next stage of maturity. More info reference: p 147/53
QUALITY MANAGEMENT MATURITY GRID Measurement Categories
Stage 1: Uncertainty
Stage II: Awakening
Stage III: Enlightenment
Stage IV: Wisdom Stage V: Certainty
Management understanding and attitude
No comprehen-sion of quality as a management tool. Tend to blame quality department for "quality problems."
Recognizing that quality management may be of value but not willing to provide money or time to make it all happen.
While going through quality improvement program learn more about quality manage-ment; becoming supportive and helpful.
Participating. Understand absolutes of quality management. Recognize their personal role in continuing emphasis.
Consider quality management an essential part of company system.
Quality organization status
Quality is hidden in manufacturing or engineering departments. Inspection probably not part of organization. Emphasis on appraisal and sorting.
A stronger quality leader is appointed but main emphasis is still on appraisal and moving the product. Still part of manufacturing or other.
Quality department reports to top management, all appraisal is incorporated and manager has role in management of company.
Quality manager is an officer of company; effective status reporting and preventive action. Involved with consumer affairs and special assignments.
Quality manager on board of directors. Prevention is main concern. Quality is a thought leader.
Problem handling
Problems are fought as they occur; no resolu-tion; inadequate definition; lots of yelling and accusations.
Teams are set up to attach major problems. Long-range solutions are not solicited.
Corrective action communication established. Problems are faced openly and resolved in an orderly way.
Problems are identified early in their develop-ment. All functions are open to sugges-tion and improvement.
Except in the most unusual cases, problems are prevented.
Cost of quality as % of sales
Reported: unknown Actual: 20%
Reported: 3% Actual: 18%
Reported: 8% Actual: 12%
Reported: 6.5% Actual: 8%
Reported: 2.5% Actual: 2.5%
Quality improvement actions
No organized activities. No understanding of such activities.
Trying obvious "motivational" short-range efforts.
Implementation of 14-step program with thorough under-standing and establishment of each step.
Continuing the 14-step program and starting Make Certain.
Quality improvement is a normal and continued activity.
Summation of company quality posture
"We don't know why we have problems with quality."
"Is it absolutely necessary to always have problems with quality?"
"Through manage-ment commitment and quality improvement we are identifying and resolving our problems."
"Defect prevention is a routine part of our operation."
"We know why we do not have problems with quality."

172 TOOLS: Techniques for Managing Quality
Corrective action Type: TQM/ISO 9000 strategy Applicability: High More info reference: p 147/56
Corrective Action is a requirement of both TQM systems and ISO 9000. It is step 6 in Crosby's 14 step quality system, and is the subject of system element 4.14 of ISO 9001. The Standard has four requirements for corrective action: ◆ Effective handling of client complaints and reports of
service nonconformities. ◆ Investigation of causes of nonconforming service, and
recording results of investigation. ◆ Determine corrective action to eliminate causes of
nonconformities. ◆ Apply controls to ensure that corrective action is taken
and is effective. Crosby says that corrective action is most successful when the biggest problems are attacked first, next biggest next, and so on. (95) Stasiowski & Burstein have developed a design office version of Dr. Juran's 11-step process for corrective action: (96) 1 Assign priority to projects 2 Pare to analysis of symptoms 3 Theorize on causes of symptoms 4 Test theories; collect and analyze data 5 Narrow list of theories 6 Design experiments 7 Approve design; provide authority 8 Conduct experiment; establish proof of cause 9 Propose remedies 10 Test remedies 11 Action to institute remedy; control at new level
Error-cause removal Type: TQM/ISO 9000 strategy Applicability: High More info reference: p 147/60
This strategy is also common to TQM and ISO 9000 systems. In ISO 9001, it is called 'preventative action' and is the other topic covered by system element 4.14, which requires the following: ◆ Using 'appropriate sources of information' to 'detect,
analyze, and eliminate potential causes of nonconformi-ties'. Here the key word is 'potential'. Preventative action means fixing a problem before it happens.
◆ Determining steps needed to deal with problems requiring preventative action.

The Designer's TQM Toolkit 173
◆ Initiating preventative action; applying controls to ensure effectiveness.
◆ Management review. Crosby's Step 11 is error-cause removal, which he says gives employees a method of communicating to management the situations that make it difficult for them to meet quality objectives.(97)
Motivation & recognition Type: TQM/ISO 9000 strategy Applicability: High More info reference: p 147/61
The force-field analysis tool states that driving forces must be greater than restraining forces if change is to occur. Recognition of the contribution of employees motivates them to further contribution, which ensures that the driving forces outweigh the restraining forces in your team. To be effective, rewards must be specific to the contribution and the person. The yearly bonus may be thought of as recognition by management, but is thought of as part of the pay packet by staff. Recognition also increases your chances of retaining corporate memory - see Chapter 5.2 for my recommendation.
Strategic quality planning Type: TQM/ISO 9000 technique Applicability: Moderate More info reference: p 148/63
Strategic quality planning is a key component of Dr Juran's TQM system and the subject of Chapter 9 in the referenced book. In this system, strategic quality planning consists of a structured process for defining the mission and strategic goals for the firm, and then determining the means required to reach those goals. This includes establishing the Quality Council, development of goals, and deployment of goals, and deployment of the goals throughout the firm, as well as developing strategies to overcome resistance. This process would be a separate activity in a large practice, but in the average design practice, these functions would be integral with the general management commitment.
Multifunctional quality planning Type: TQM strategy Applicability: Moderate More info reference: p 148/64
This is the second tier in Dr. Juran's quality planning philosophy, described in detail in Chapter 10 in the referenced work. Large, multi-office practices will find his analysis and recommendations of interest and applicable; average practitioners are not likely to.

174 TOOLS: Techniques for Managing Quality
Database, Santayana review Type: TQM tool Applicability: Moderate More info reference: p 148/66
In Dr. Juran's TQM approach, this process is structured; a job for the 'historians'. It includes five steps: (98) ◆ Identification of the critical variables ◆ Establishment of cause-effect relationships ◆ The data bank (facilitates information retrieval and
decision making) ◆ The checklist (what to do, what not to do) ◆ The countdown (ordered list of things to be done) My version of the 'databank' is called 'corporate memory'. See Chapter 5.2.
Project quality plan Type: ISO 9000 tool Applicability: High More info reference: p 148/67 and pp 297-298
The PQP is emerging as one of the most important tools in an ISO 9000 quality system, particularly for the design profes-sions. One of the reasons for this is that procedures are not public documents and not available to the client, whereas the PQP is available for the client's review. More import-antly, however, the fact that every project is different means that every PQP is also different; indeed unique. ISO 9000 requires the preparation of project quality plans 'as appropriate', but the test of that is left to the practice to decide. A PQP is essentially a sub-set of the firms quality system. It can be as short as a few pages or; for large, complex projects, a substantial document. The PQP normally has the following elements: ◆ The firm's quality goals and objectives. ◆ A description of the project. ◆ Quality requirements, if any, of the project. ◆ Project team and assignment of key positions of
responsibility. ◆ A listing of applicable procedures, which is usually by
reference rather than including them. ◆ Any other information required by the client.
This PQP then becomes a 'road map' for carrying out the project. See Chapter 6.6 for a discussion of how clients are using the PQP to reduce their risk of time and cost growth due to design.
The Designer's TQM Toolkit 175
Induction Type: TQM/ISO 9000 tool Occasionally used by design professionals More info reference: p 148/70
Induction is a formalized orientation process for new employees. In most design firms that have an induction process, it takes place either on a twice-annual basis, or when a certain number of new employees have been put on. The induction is an intensive training process, where top management is on hand and not interrupted by telephone calls or meetings. The training involves all aspects of the practice, from vision and mission, to housekeeping rules and details.
Performance evaluations Type: TQM/ISO 9000 tool Occasionally used by design professionals More info reference: p 148/71
There are substantial differences of opinion about the value of performance evaluations. A prominent Boston firm has long used twice-yearly performance reviews as a way to understand how the staff see management, and to share expectations of each other. This firm spends about 12 days per year of partner level time on performance reviews (3 partners x 2 days twice a year), and an equal amount of other senior staff time, so the overhead is a significant item. If performance reviews are done in the spirit this firm uses, they can be a very worthwhile motivator as well as a tool for uncovering problems before they happen - a true TQM tool. If, on the other hand, reviews are simply forums for management to judge staff in, the results are more likely to be negative than positive. Mears advocates using performance reviews as a place to establish specific quality goals with staff.(99) Stasiowski & Burstein recommend that staff evaluate management as well as management evaluating staff.(100)
Peer reviews Type: TQM tool Applicability: High More info reference: p 148/73
Although identified as a TQM tool, peer review is also a good augmentation of the management review process required under ISO 9000. In QM-speak, the peer review validates management's own review. Refer pages 62-64 for a brief outline of the peer review process.

176 TOOLS: Techniques for Managing Quality
Vendor review Type: TQM/ISO 9000 tool Occasionally used by design professionals More info reference: p 149/80
In ISO 9000, vendors are called suppliers, and review of suppliers' quality systems is required under system element 4.6: Purchasing to ensure that purchased products/services conform to requirements. This includes (Clause 4.6.2) the evaluation of subconsultants. This vendor review is of the vendor by the purchaser. In TQM, the term has a different meaning; where the vendor reviews your documents, to identify equipment incompati-bility, obsolete specifications and models, and inappropri-ate use of materials. In certain areas of design, such as hard-ware selection, such review is essential because of the complexity of products available and the rate with which they change.
Constructability review Type: TQM/ISO 9000 tool Occasionally used by design professionals More info reference: p 149/81
In my early years, I worked for a stretch with the Detroit firm of Smith, Hinchman & Grylls. The chief draftsman there had the ability to age a building a hundred years in ten minutes, as you watched your lovely details rot, leak and decompose to nothing. Unrolling your drawings in front of him was a pretty sobering experience, one I will never forget. That review might better be termed a 'destructibility review'; but that would be the reverse of a constructability review. A constructability review is more than just checking the durability aspects; it is also checking the ease of construction. This can - and should - be both from the macro level to the micro level. For example, what size cranes, and how many, are needed to reach all parts of the project? Where can they be located, and how can they be removed? These are design issues, or ought to be. At the micro level, it seems that architects have a penchant for designing joinery details that literally cannot be fabri-cated as drawn. Having spent big chunks of my life writing specifications, I've seen the drawings from many practices, and one recurring nasty detail is the reveal around door frames, deeper than it is wide, impossible to paint and keep free from joint compound. I've seen it on jobs where the screws from the hinges stuck through into the reveal. Our fore-fathers invented casings for very good reasons!

The Designer's TQM Toolkit 177
Operability reviews Type: TQM tool Applicability: High More info reference: p 149/82
No part of our industry is evolving as rapidly as mechanical and electrical systems, which have reached levels of sophistication beyond most architects and some engineers. This evolution includes the rapid change toward integrated systems and performance specifications, the latter of which moves the designer one step further away from control of project quality. Add to this the increasing requirements for functional recycling of structures within their first-cost lifetime, and you have all the makings for systemic operability problems in the future. Operability reviews must look at the ability of a structure to respond to changing use as well as to keeping its first inhabitants comfortable and at the lowest possible cost.
Tree diagram Type: TQM Hoshin tool Occasionally used by design professionals More info reference: p 150/86
Tree Diagram format
Tree diagrams are simple graphic tools used to map out detailed groups of tasks to be accomplished. The general structure is shown below, together with a sample tree diagram as it might be used in a design office.
Tim
e &
Co
st
Select & AppointConsultants
Start-up
QualityMonitoring
Completion
Design
Construction
Interviews
Request fee proposals
Prepare & execute agreements
Briefing
Agree program schedule
Agree formats & media
Arch / Consult. coord. check
Verify consult. cross-checks
REDICHECK
Spec./drawing coord. check
Check progress to schedule
Resolve any delays
Check estimates to cost plan
Check long lead equipment
Fu
nct
ion
Resolve any discrepancies
Consultant Coordination Plan

178 TOOLS: Techniques for Managing Quality
Matrix diagram Type: TQM Hoshin tool Occasionally used by design professionals More info reference: p 150/87
The matrix diagram is used to show graphically relation-ships between activities; it is particularly useful where the impact of demands need to be identified on system capabili-ties and priorities developed. In the example below, I have extended the tree diagram from the previous page, to add responsibilities to the actions.
Matrix data analysis Type: TQM Hoshin tool Applicability: Moderate More info reference: p 150/88
This is another simple graphic device to show the intensity or strength of relationships, thus adding a dimension to the information in a matrix diagram. These 'intensity' ratings are provided by some other TQM tool, such as a Likert scale or multivoting. Example:

The Designer's TQM Toolkit 179
Process decision program chart (PDPC) Type: TQM Hoshin tool Applicability: Moderate More info reference: p 150/89
This TQM tool graphically shows relationships in a tree-type structure, but its purpose is to predict where problems can occur, and to suggest solutions. Thus, it is a 'preventative action' tool. Code for the 'boxes', and example below:
Counter MeasuresThings that cango wrong
Chapter 4.2 Summary Checklist We can draw a number of conclusions from this very quick overview of nearly four dozen TQM tools which have some application to design practice.
✓ TQM is a lot about theory and a lot about tools. These tools make the theory real. The theory will be slightly different in our industry; and so will the tools.
✓ About half of the TQM tools have some equivalent in ISO 9000.
✓ Most of the tools were developed in response to specific needs in large manufacturing companies. The needs are not the same in small design firms.
✓ Some of these tools have high applicability. The rest would only be useful in large, multi-office practices.