The Dependency of Hollow Ball Deformation on Material ...
15
2006 ABAQUS Users’ Conference 389 The Dependency of Hollow Ball Deformation on Material Properties D.S. Price, R. Jones, and A.R. Harland Sports Technology Research Group, Loughborough University, Loughborough LEICESTERSHIRE, LE11 3TU, UK Abstract: The work presented in this paper details the development of a finite element (FE) model of a soccer ball, allowing for a greater understanding of the performance of soccer balls under dynamic conditions that are representative of play. The model consists of composite shell elements that include a hyperelastic strain energy potential equation to define the latex bladder layer and a plane stress orthotropic elastic material model to define the anisotropic woven fabric outer panels. The model was validated through a series of experimental tests whereby the ball was impacted normal to a rigid plate at an inbound velocity of approximately 34 ms -1 (76 mph), with each impact recorded using high speed video (HSV) techniques. It was found that the combined effects of ball design and panel material anisotropy caused impact properties such as impact contact time, deformation, and the 2D shape taken up by the ball at maximum deformation, to vary with pre-impact ball orientation. The model showed good agreement with the experimental measurements and was able to represent the effects of anisotropy in ball design. Keywords: Elasticity, Fabrics, Anisotropy, Hyperelasticity, Impact, Shell Structures, hollow sphere, soccer ball engineering. 1. Introduction Soccer is the most popular ball game in the world, with over 250 million active players and a television audience peaking at 1.7 billion for the final of the 2002 FIFA World Cup championships. The primary equipment requirement for the game of soccer is the ball, and, with annual sales estimated at 40 million units (Stamm and Lamprecht, 2001), the soccer ball market is as competitive as the game itself. The soccer industry provides a plethora of sponsorship and advertising opportunities and gives leading multinational sports companies a platform to market their products. This places the emphasis on brand image and product quality meaning that the design, development and innovation of soccer balls are crucial activities in order to gain competitive advantage within the market. Soccer has been played in many different forms in all corners of geography and history. From its origins as tsu chu in ancient China 2500 BC, the spread of the game throughout the world proceeded. Early forms of ball juggling were conceived in Thailand, and the ancient game of kemari, which originated in Japan throughout 600BC, was also played (Murray, 1994). The Greeks and Romans developed ball games entitled epyskyros and harpastum respectively, Visit the SIMULIA Resource Center for more customer examples. Visit the SIMULIA Resource Center for more customer examples.
Transcript of The Dependency of Hollow Ball Deformation on Material ...
2006 ABAQUS Users’ Conference 389
The Dependency of Hollow Ball Deformation on Material Properties
D.S. Price, R. Jones, and A.R. Harland
Sports Technology Research Group, Loughborough University, Loughborough LEICESTERSHIRE, LE11 3TU, UK
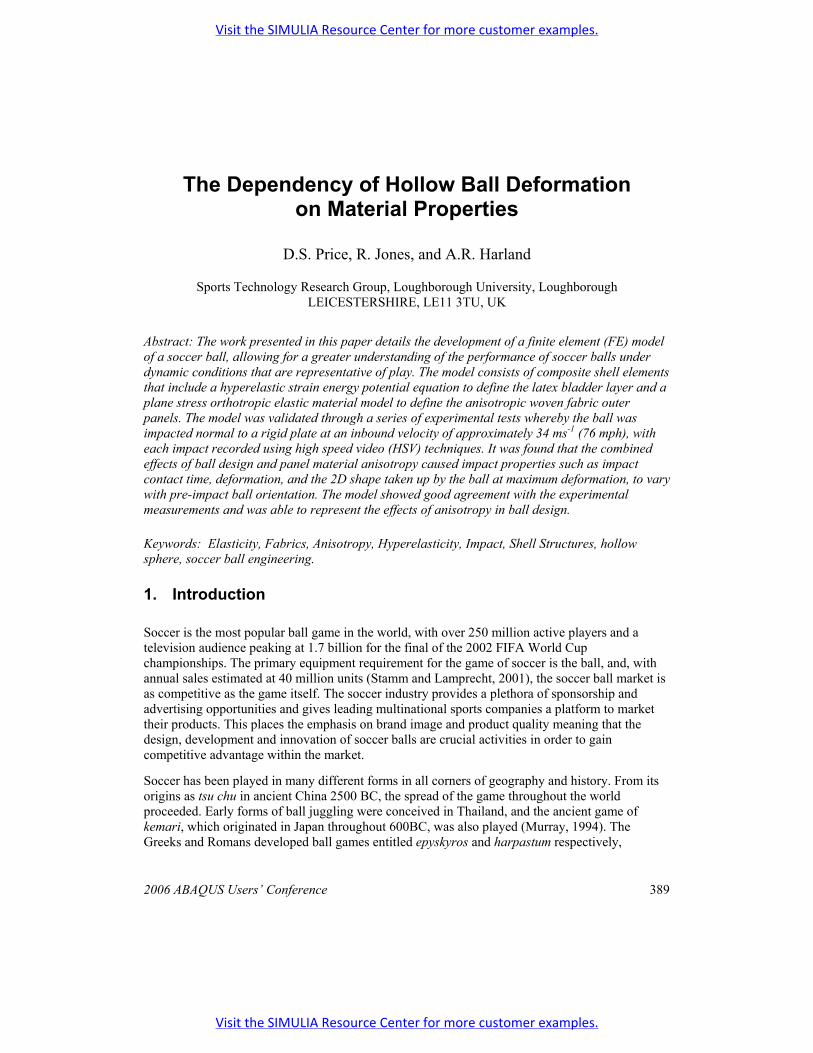
Abstract: The work presented in this paper details the development of a finite element (FE) model of a soccer ball, allowing for a greater understanding of the performance of soccer balls under dynamic conditions that are representative of play. The model consists of composite shell elements that include a hyperelastic strain energy potential equation to define the latex bladder layer and a plane stress orthotropic elastic material model to define the anisotropic woven fabric outer panels. The model was validated through a series of experimental tests whereby the ball was impacted normal to a rigid plate at an inbound velocity of approximately 34 ms-1 (76 mph), with each impact recorded using high speed video (HSV) techniques. It was found that the combined effects of ball design and panel material anisotropy caused impact properties such as impact contact time, deformation, and the 2D shape taken up by the ball at maximum deformation, to vary with pre-impact ball orientation. The model showed good agreement with the experimental measurements and was able to represent the effects of anisotropy in ball design.
Keywords: Elasticity, Fabrics, Anisotropy, Hyperelasticity, Impact, Shell Structures, hollow sphere, soccer ball engineering.
1. Introduction
Soccer is the most popular ball game in the world, with over 250 million active players and a television audience peaking at 1.7 billion for the final of the 2002 FIFA World Cup championships. The primary equipment requirement for the game of soccer is the ball, and, with annual sales estimated at 40 million units (Stamm and Lamprecht, 2001), the soccer ball market is as competitive as the game itself. The soccer industry provides a plethora of sponsorship and advertising opportunities and gives leading multinational sports companies a platform to market their products. This places the emphasis on brand image and product quality meaning that the design, development and innovation of soccer balls are crucial activities in order to gain competitive advantage within the market.
Soccer has been played in many different forms in all corners of geography and history. From its origins as tsu chu in ancient China 2500 BC, the spread of the game throughout the world proceeded. Early forms of ball juggling were conceived in Thailand, and the ancient game of kemari, which originated in Japan throughout 600BC, was also played (Murray, 1994). The Greeks and Romans developed ball games entitled epyskyros and harpastum respectively,
Visit the SIMULIA Resource Center for more customer examples.
Visit the SIMULIA Resource Center for more customer examples.
390 2006 ABAQUS Users’ Conference
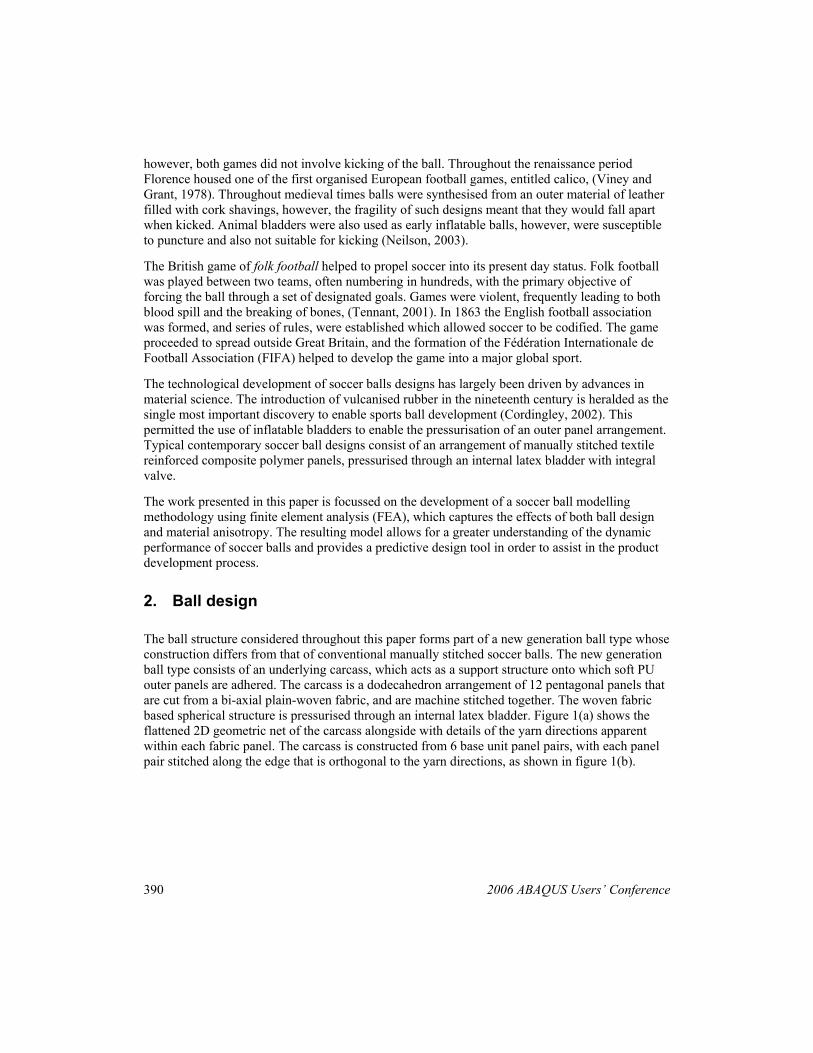
however, both games did not involve kicking of the ball. Throughout the renaissance period Florence housed one of the first organised European football games, entitled calico, (Viney and Grant, 1978). Throughout medieval times balls were synthesised from an outer material of leather filled with cork shavings, however, the fragility of such designs meant that they would fall apart when kicked. Animal bladders were also used as early inflatable balls, however, were susceptible to puncture and also not suitable for kicking (Neilson, 2003).
The British game of folk football helped to propel soccer into its present day status. Folk football was played between two teams, often numbering in hundreds, with the primary objective of forcing the ball through a set of designated goals. Games were violent, frequently leading to both blood spill and the breaking of bones, (Tennant, 2001). In 1863 the English football association was formed, and series of rules, were established which allowed soccer to be codified. The game proceeded to spread outside Great Britain, and the formation of the Fédération Internationale de Football Association (FIFA) helped to develop the game into a major global sport.
The technological development of soccer balls designs has largely been driven by advances in material science. The introduction of vulcanised rubber in the nineteenth century is heralded as the single most important discovery to enable sports ball development (Cordingley, 2002). This permitted the use of inflatable bladders to enable the pressurisation of an outer panel arrangement. Typical contemporary soccer ball designs consist of an arrangement of manually stitched textile reinforced composite polymer panels, pressurised through an internal latex bladder with integral valve.
The work presented in this paper is focussed on the development of a soccer ball modelling methodology using finite element analysis (FEA), which captures the effects of both ball design and material anisotropy. The resulting model allows for a greater understanding of the dynamic performance of soccer balls and provides a predictive design tool in order to assist in the product development process.
2. Ball design
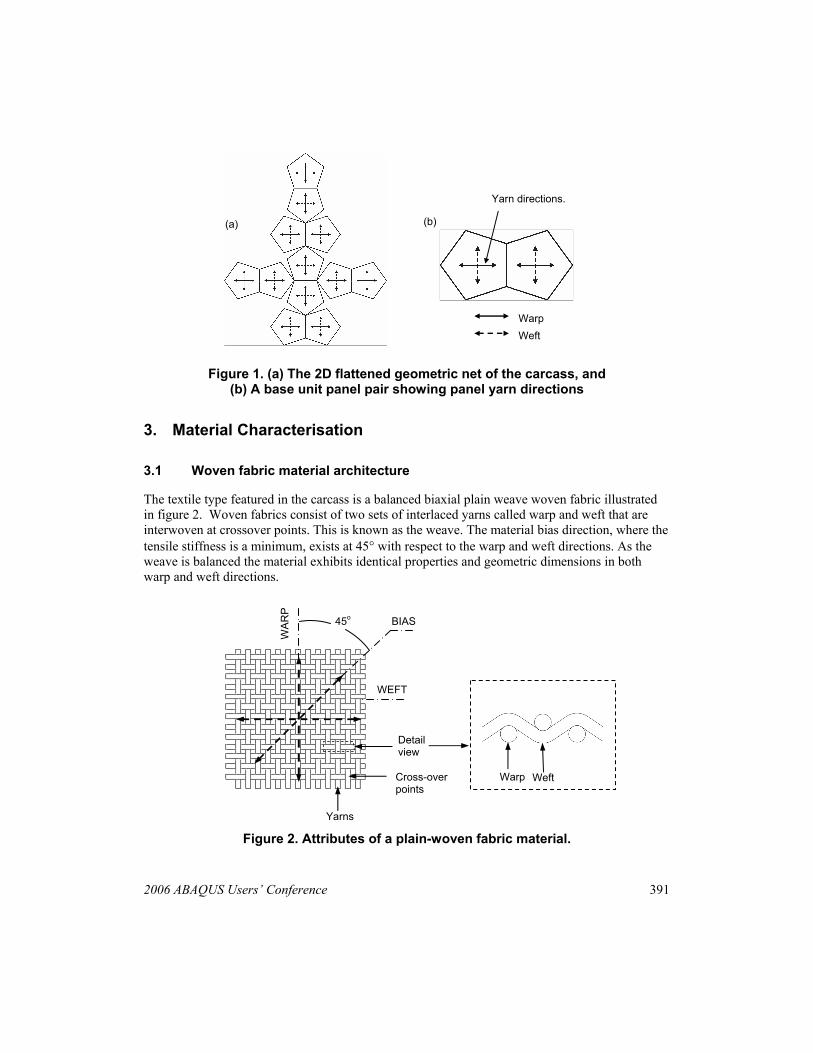
The ball structure considered throughout this paper forms part of a new generation ball type whose construction differs from that of conventional manually stitched soccer balls. The new generation ball type consists of an underlying carcass, which acts as a support structure onto which soft PU outer panels are adhered. The carcass is a dodecahedron arrangement of 12 pentagonal panels that are cut from a bi-axial plain-woven fabric, and are machine stitched together. The woven fabric based spherical structure is pressurised through an internal latex bladder. Figure 1(a) shows the flattened 2D geometric net of the carcass alongside with details of the yarn directions apparent within each fabric panel. The carcass is constructed from 6 base unit panel pairs, with each panel pair stitched along the edge that is orthogonal to the yarn directions, as shown in figure 1(b).
2006 ABAQUS Users’ Conference 391
Figure 1. (a) The 2D flattened geometric net of the carcass, and (b) A base unit panel pair showing panel yarn directions
3. Material Characterisation
3.1 Woven fabric material architecture
The textile type featured in the carcass is a balanced biaxial plain weave woven fabric illustrated in figure 2. Woven fabrics consist of two sets of interlaced yarns called warp and weft that are interwoven at crossover points. This is known as the weave. The material bias direction, where the tensile stiffness is a minimum, exists at 45° with respect to the warp and weft directions. As the weave is balanced the material exhibits identical properties and geometric dimensions in both warp and weft directions.
Figure 2. Attributes of a plain-woven fabric material.
Yarn directions.
(a) (b)
Warp Weft
Yarns
WEFT
WA
RP
Cross-over points
45o
Detail view
Weft Warp
BIAS
392 2006 ABAQUS Users’ Conference
3.2 Directional Tensile Testing
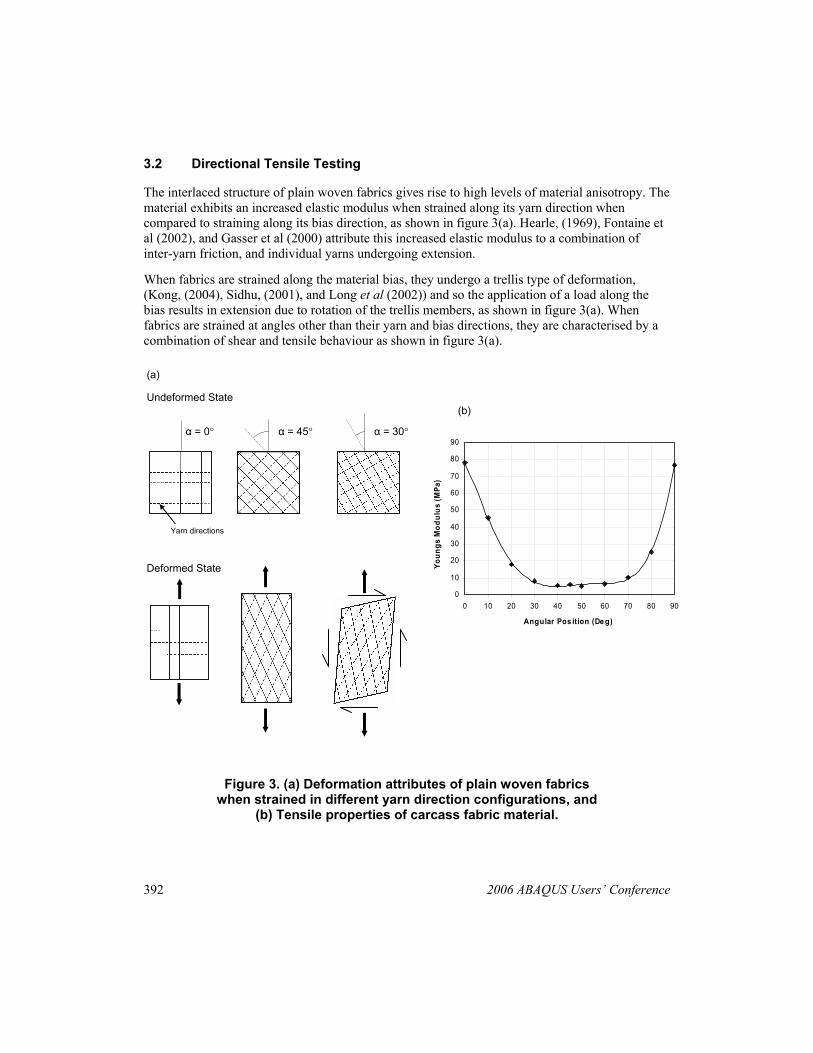
The interlaced structure of plain woven fabrics gives rise to high levels of material anisotropy. The material exhibits an increased elastic modulus when strained along its yarn direction when compared to straining along its bias direction, as shown in figure 3(a). Hearle, (1969), Fontaine et al (2002), and Gasser et al (2000) attribute this increased elastic modulus to a combination of inter-yarn friction, and individual yarns undergoing extension.
When fabrics are strained along the material bias, they undergo a trellis type of deformation, (Kong, (2004), Sidhu, (2001), and Long et al (2002)) and so the application of a load along the bias results in extension due to rotation of the trellis members, as shown in figure 3(a). When fabrics are strained at angles other than their yarn and bias directions, they are characterised by a combination of shear and tensile behaviour as shown in figure 3(a).
Figure 3. (a) Deformation attributes of plain woven fabrics when strained in different yarn direction configurations, and
(b) Tensile properties of carcass fabric material.
0
10
20
30
40
50
60
70
80
90
0 10 20 30 40 50 60 70 80 90
Angular Pos ition (De g)
Youn
gs M
odul
us (M
Pa)
α = 45° α = 30° α = 0°
Undeformed State
Yarn directions
Deformed State
(a)
(b)
2006 ABAQUS Users’ Conference 393
A series of directional tensile tests were carried out on the carcass material. Eleven sets of material tensile tests occurred at angles ranging from 0-90° in 10° intervals, and also along the material bias (45°). Standard dog-bone tensile test pieces were used, and testing occurred at a strain rate of 1000 mm/min. Five trials were carried out for each test direction, with maximum test strains being approximately 0.6. Figure 3(b) shows a 5th order polynomial expression fitted to the elastic moduli data. Both the high levels of symmetry within the curve and the similar values of E at both 0° and 90° allow the fabric to be considered as a balanced plain weave.
4. Carcass Impact Testing
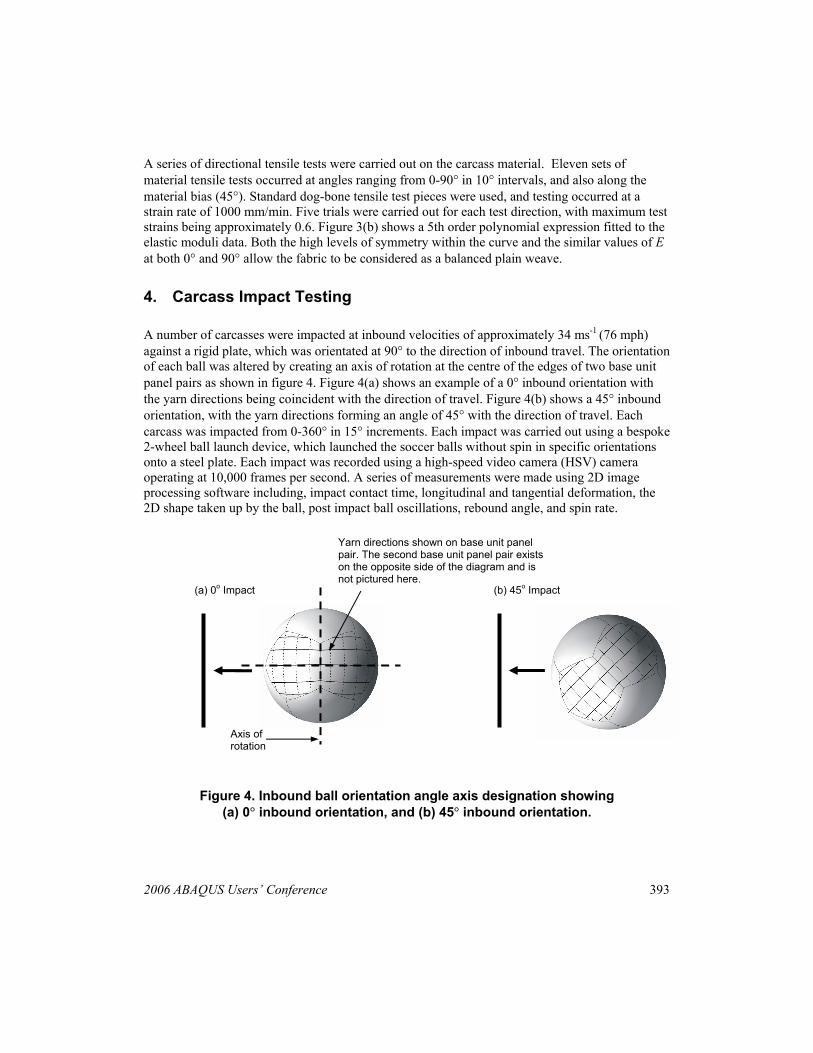
A number of carcasses were impacted at inbound velocities of approximately 34 ms-1 (76 mph) against a rigid plate, which was orientated at 90° to the direction of inbound travel. The orientation of each ball was altered by creating an axis of rotation at the centre of the edges of two base unit panel pairs as shown in figure 4. Figure 4(a) shows an example of a 0° inbound orientation with the yarn directions being coincident with the direction of travel. Figure 4(b) shows a 45° inbound orientation, with the yarn directions forming an angle of 45° with the direction of travel. Each carcass was impacted from 0-360° in 15° increments. Each impact was carried out using a bespoke 2-wheel ball launch device, which launched the soccer balls without spin in specific orientations onto a steel plate. Each impact was recorded using a high-speed video camera (HSV) camera operating at 10,000 frames per second. A series of measurements were made using 2D image processing software including, impact contact time, longitudinal and tangential deformation, the 2D shape taken up by the ball, post impact ball oscillations, rebound angle, and spin rate.
Figure 4. Inbound ball orientation angle axis designation showing (a) 0° inbound orientation, and (b) 45° inbound orientation.
Yarn directions shown on base unit panel pair. The second base unit panel pair exists on the opposite side of the diagram and is not pictured here.
Axis of rotation
(a) 0o Impact (b) 45o Impact

394 2006 ABAQUS Users’ Conference
5. FE Implementation
The dodecahedron carcass panels were discretised into a mesh of 3D linear interpolated, triangular composite shell elements, with quadrilateral shell elements used to define the stitching region. Pressurisation of the model was permitted through an integral layer of hydrostatic fluid elements, which shared the nodes of the structural shell elements. The fluid elements were coupled with a cavity reference node, which possessed a single degree of freedom to represent the pressure of the cavity. A mass flow rate was applied onto the cavity reference node, which simulated the flow of a compressible fluid within the cavity, in order to represent the air within the physical bladder and allow for pressurisation (Price et al, 2005).
The use of composite shell elements permitted multiple material models to define each constituent layer of the complete ball material. A triple material model was used where the inner layer corresponded to the bladder material and two layers corresponded to two plane stress orthotropic layers used to define material anisotropy, as shown in figure 5.
A series of quasi-static uniaxial tensile tests were performed on dumbbell specimens of the bladder material conforming to BS 903 Part A2, using a commercially available tensile test machine. A hyperelastic reduced polynomial strain energy potential equation was calibrated against the material data; through a least squares fit procedure. This procedure was carried out within the FE software and allowed for the characterisation of the bladder material.
Figure 5. Plane stress orthotropic elastic material definition for material anisotropy characterisation.
Layers A and B incorporated local material directions x and y and were each prescribed elastic moduli data in the two principal directions, alongside in-plane shear moduli and Poisson ratios. Layer A incorporated Ex and Ey values that corresponded with straining the material along the yarn directions. Layer B incorporated Ex and Ey that corresponded with straining the material along the
Bladder
Layer A: 0o Carcass Material Model layer
Layer B: 45o Carcass Material Model layer
0 45 90 θ
E
Material co-ordinate system for Layer B
Material co-ordinate system for Layer A
Bladder layer – homogeneous
x
y
x y
2006 ABAQUS Users’ Conference 395
bias direction, with the material axes offset from layer A by 45° as shown in figure 5. In both layers A and B, low values of shear moduli were prescribed in accordance with woven fabrics exhibiting low resistance to shear. An in-plane Poisson’s ratio of 0.5 was used as it was hypothesised that this may assist in the buckling behaviour of fabrics throughout compressive loading, as opposed to the material undergoing in-plane compression. Additionally, success had been seen in the use of incompressible material models for woven fabric characterisation by Xue et al, (2003).
A number of impact simulations were carried out in order to ensure that the longitudinal and tangential deformation of the ball was well represented in the model. This was achieved through carrying out two impacts in FE with inbound orientations of 0° and 45° respectively, and comparing model data with experimental contact time and deformation data. It was found that agreement between model and experimentation was established when the elastic modulus was increased to accommodate the section thickness being halved. Greater agreement was established when increasing the elastic moduli data by a factor of 3.
6. Results
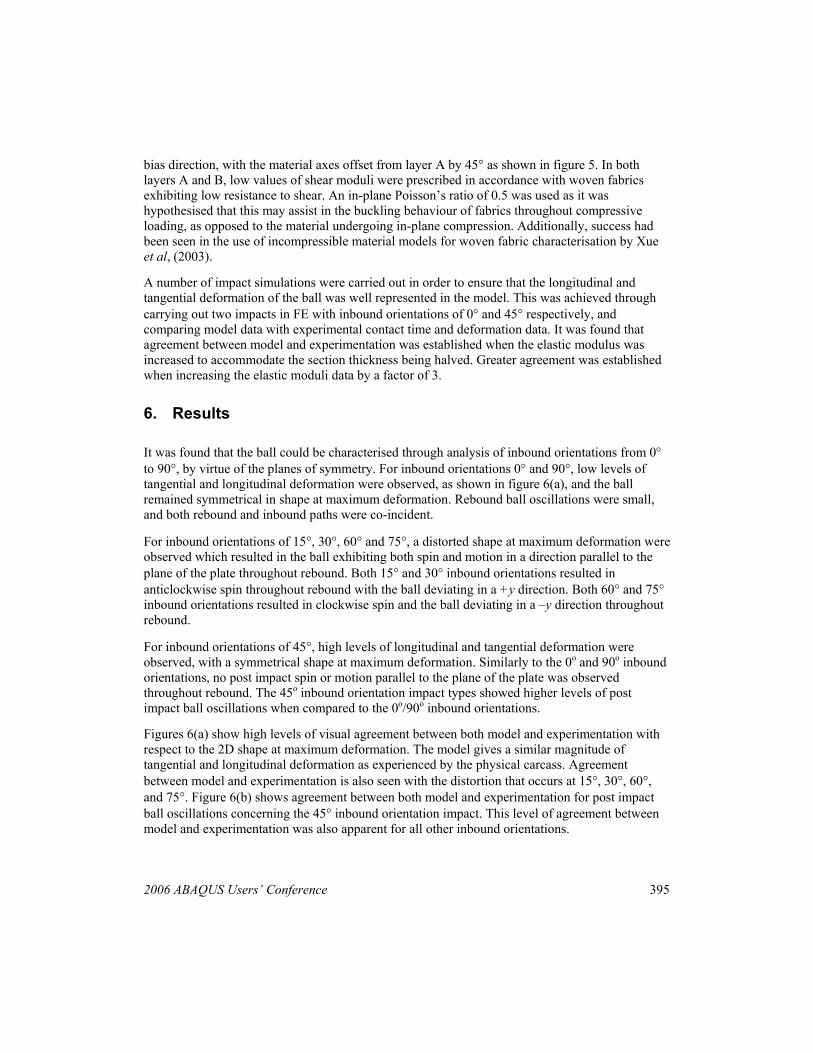
It was found that the ball could be characterised through analysis of inbound orientations from 0° to 90°, by virtue of the planes of symmetry. For inbound orientations 0° and 90°, low levels of tangential and longitudinal deformation were observed, as shown in figure 6(a), and the ball remained symmetrical in shape at maximum deformation. Rebound ball oscillations were small, and both rebound and inbound paths were co-incident.
For inbound orientations of 15°, 30°, 60° and 75°, a distorted shape at maximum deformation were observed which resulted in the ball exhibiting both spin and motion in a direction parallel to the plane of the plate throughout rebound. Both 15° and 30° inbound orientations resulted in anticlockwise spin throughout rebound with the ball deviating in a +y direction. Both 60° and 75° inbound orientations resulted in clockwise spin and the ball deviating in a –y direction throughout rebound.
For inbound orientations of 45°, high levels of longitudinal and tangential deformation were observed, with a symmetrical shape at maximum deformation. Similarly to the 0o and 90o inbound orientations, no post impact spin or motion parallel to the plane of the plate was observed throughout rebound. The 45o inbound orientation impact types showed higher levels of post impact ball oscillations when compared to the 0o/90o inbound orientations.
Figures 6(a) show high levels of visual agreement between both model and experimentation with respect to the 2D shape at maximum deformation. The model gives a similar magnitude of tangential and longitudinal deformation as experienced by the physical carcass. Agreement between model and experimentation is also seen with the distortion that occurs at 15°, 30°, 60°, and 75°. Figure 6(b) shows agreement between both model and experimentation for post impact ball oscillations concerning the 45° inbound orientation impact. This level of agreement between model and experimentation was also apparent for all other inbound orientations.
396 2006 ABAQUS Users’ Conference
Figure 6. (a) HSV and FE model data comparisons, (b) Impact sequence of a typical 45° inbound orientation.
y
x z
(a)
(b)
t = 0
t =
2.5
ms
t = 5
ms
t = 7
.5 m
s t =
10.
5 m
s
0°
15°
30°
45°
60°
75°
90°
2006 ABAQUS Users’ Conference 397
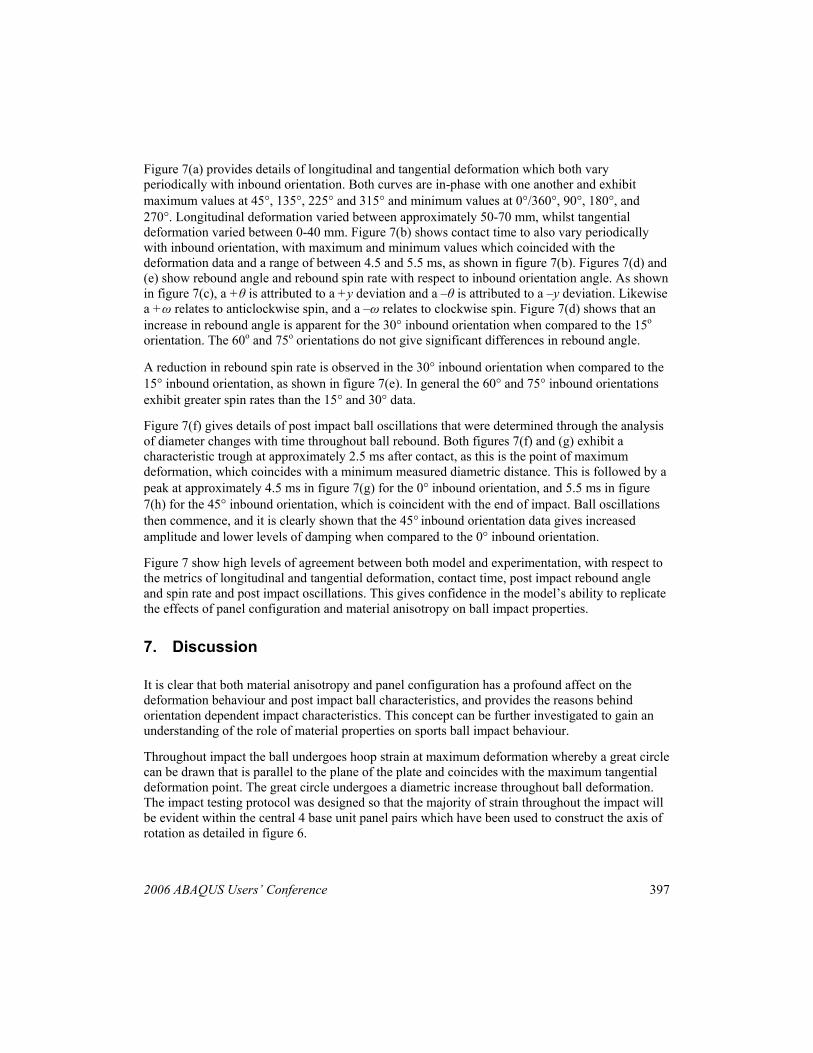
Figure 7(a) provides details of longitudinal and tangential deformation which both vary periodically with inbound orientation. Both curves are in-phase with one another and exhibit maximum values at 45°, 135°, 225° and 315° and minimum values at 0°/360°, 90°, 180°, and 270°. Longitudinal deformation varied between approximately 50-70 mm, whilst tangential deformation varied between 0-40 mm. Figure 7(b) shows contact time to also vary periodically with inbound orientation, with maximum and minimum values which coincided with the deformation data and a range of between 4.5 and 5.5 ms, as shown in figure 7(b). Figures 7(d) and (e) show rebound angle and rebound spin rate with respect to inbound orientation angle. As shown in figure 7(c), a +θ is attributed to a +y deviation and a –θ is attributed to a –y deviation. Likewise a +ω relates to anticlockwise spin, and a –ω relates to clockwise spin. Figure 7(d) shows that an increase in rebound angle is apparent for the 30° inbound orientation when compared to the 15o
orientation. The 60o and 75o orientations do not give significant differences in rebound angle.
A reduction in rebound spin rate is observed in the 30° inbound orientation when compared to the 15° inbound orientation, as shown in figure 7(e). In general the 60° and 75° inbound orientations exhibit greater spin rates than the 15° and 30° data.
Figure 7(f) gives details of post impact ball oscillations that were determined through the analysis of diameter changes with time throughout ball rebound. Both figures 7(f) and (g) exhibit a characteristic trough at approximately 2.5 ms after contact, as this is the point of maximum deformation, which coincides with a minimum measured diametric distance. This is followed by a peak at approximately 4.5 ms in figure 7(g) for the 0° inbound orientation, and 5.5 ms in figure 7(h) for the 45° inbound orientation, which is coincident with the end of impact. Ball oscillations then commence, and it is clearly shown that the 45° inbound orientation data gives increased amplitude and lower levels of damping when compared to the 0° inbound orientation.
Figure 7 show high levels of agreement between both model and experimentation, with respect to the metrics of longitudinal and tangential deformation, contact time, post impact rebound angle and spin rate and post impact oscillations. This gives confidence in the model’s ability to replicate the effects of panel configuration and material anisotropy on ball impact properties.
7. Discussion
It is clear that both material anisotropy and panel configuration has a profound affect on the deformation behaviour and post impact ball characteristics, and provides the reasons behind orientation dependent impact characteristics. This concept can be further investigated to gain an understanding of the role of material properties on sports ball impact behaviour.
Throughout impact the ball undergoes hoop strain at maximum deformation whereby a great circle can be drawn that is parallel to the plane of the plate and coincides with the maximum tangential deformation point. The great circle undergoes a diametric increase throughout ball deformation. The impact testing protocol was designed so that the majority of strain throughout the impact will be evident within the central 4 base unit panel pairs which have been used to construct the axis of rotation as detailed in figure 6.
398 2006 ABAQUS Users’ Conference
Figure 7. (a) Longitudinal and (b) tangential deformation data, (c) Convention for spin rate and rebound angle data. Post impact data for: (d) rebound angle, (e) spin
rate and ball oscillations for inbound orientations of (f) 0° and (g) 45°.
0
1
2
3
4
5
6
7
0 30 60 90 120 150 180 210 240 270 300 330 360
Inbound Orientation (Degree s )
Con
tact
Tim
e (m
s)
-30
-10
10
30
50
70
90
0 30 60 90 120 150 180 210 240 270 300 330 360
Inbound Or ie ntation (Degrees )
Def
orm
atio
n (m
m)
-9
-6
-3
0
3
6
9
0 20 40 60 80 100
Orie ntation Angle (De g)R
ebou
nd A
ngle
(Deg
)
-15
-10
-5
0
5
10
0 20 40 60 80 100
Orientation Angle (De g)
Spin
Rat
e(re
v/s)
(a) (b)
(d)
(e)
0.1
0.12
0.14
0.16
0.18
0.2
0.22
0.24
0 2 4 6 8 10 12 14 16 18 20 22
Tim e (m s)
Dis
tanc
e (m
)
0.1
0.12
0.14
0.16
0.18
0.2
0.22
0.24
0 2 4 6 8 10 12 14 16 18 20 22
Tim e (m s)
Dis
tanc
e (m
)
Longitudinal Deformation.
Tangential Deformation.
+θ
-θ
+ω
-ω
t1 = Impact end
t2
15o and 30o inbound orientations
60° and 75° inbound orientations
y
x
(c)
Key: FE data
Experimental data
(f) (g)
2006 ABAQUS Users’ Conference 399
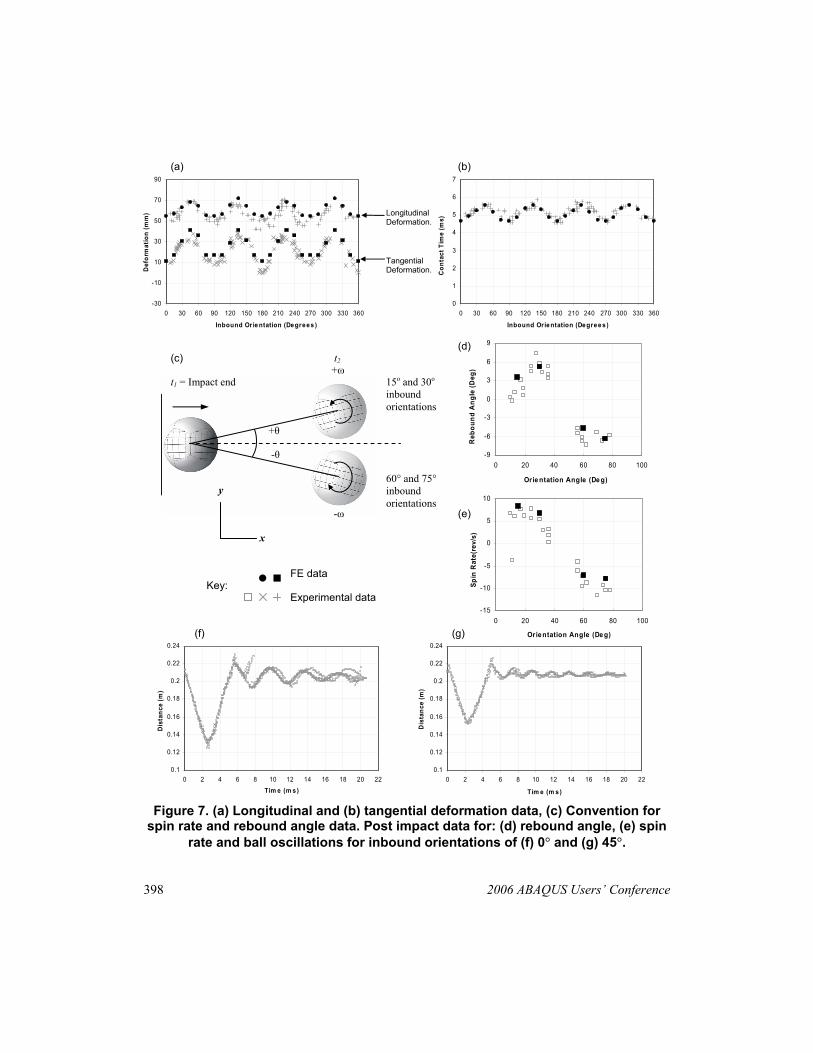
This concept can be combined with the mechanical properties of fabrics detailed in section 3 to provide reasoning for the orientation dependent impact properties observed throughout experimentation. Figure 8(a) gives details of the 0° inbound orientation impact showing a single solid arrow that represents the yarn directions, with the dotted line showing the plane of hoop strain. The panels that are shown in view have their yarn directions orientated coincident with the plane of hoop strain. Throughout deformation, the hoop strain experienced by the ball is analogous to applying uniaxial tension along the dotted line. This results in low levels of deformation as the individual mechanical properties of the yarns undergo straining.
In figure 8(b) the yarn directions are orientated at 45° to the plane of hoop strain, which results in high levels of deformation since the panels in view undergo straining along the material bias resulting in a trellis-type deformation. The distorted shape at maximum deformation as apparent in the 15° inbound orientation detailed in figure 8(c) can be attributed to the resulting shear deformation developed when straining the material such that the yarn directions form an angle of 15°. The shear mode of deformation developed within the panels shown in figure 8(c) propagates throughout the whole ball resulting in a distorted shape at maximum deformation.
Fig. 8. Relationship between fabric mechanical properties and ball deformation behaviour for (a) 0°, (b) 45° and (c) 15°.
0o
Individual yarns strained – Low Deformation.
45o 15o
Trellis mode of deformation – high levels of deformation.
In-plane shear deformation - distorted shape at maximum deformation.
(a) (b) (c)
400 2006 ABAQUS Users’ Conference
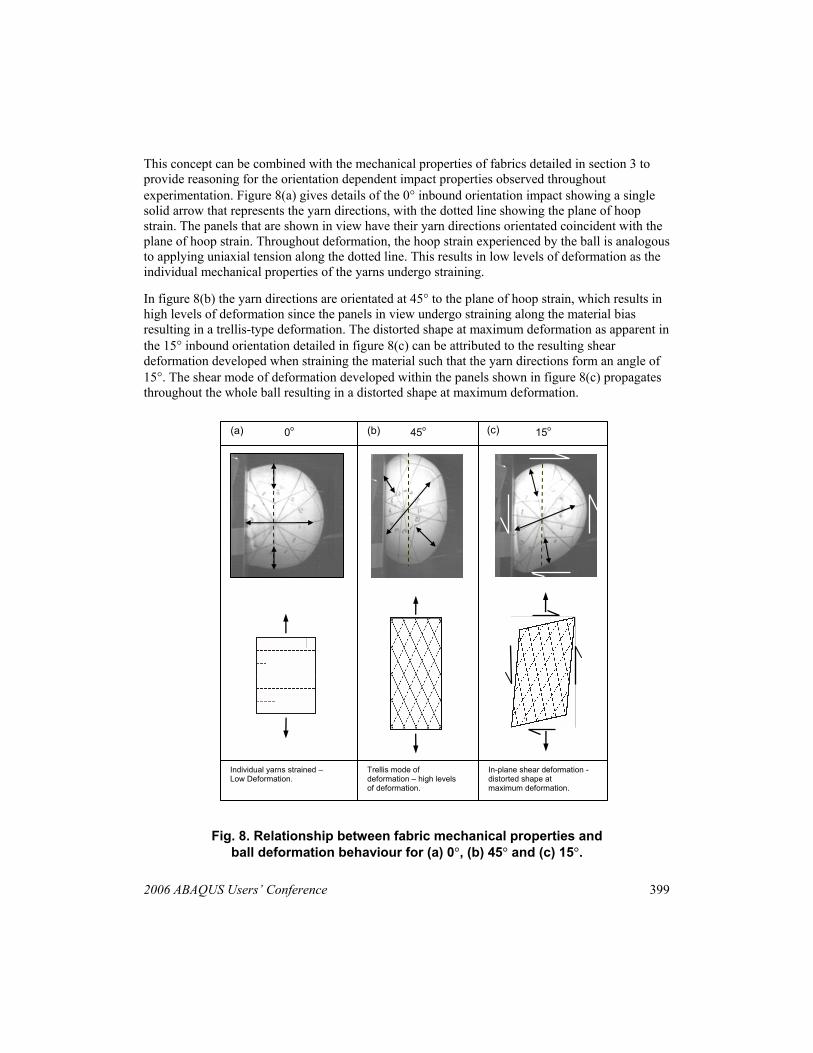
Due to the high levels of agreement seen between both model and experimentation, the model can be confidently used to predict the strain distribution within the ball panels. Figure 9 provides details of in-plane strain throughout inbound orientations 0°, 15°, 30°, and 45° respectively. At 0°, as shown in figure 9(a) the distribution of strain is evenly balanced as the yarn directions within both panels are aligned with the plane of hoop strain. Throughout the 15° and 30o inbound orientations as shown in figures 9 (b) and (c), panel 1 exhibits high localised strain when compared to other panels. Both panels 1 and 2 exhibit high localised strains at an inbound orientation of 45° as shown in figure 9(d).
Fig. 9. Variation of in-plane strain throughout (a) 0° (b) 15° (c) 30° and (d) 45° inbound orientations.
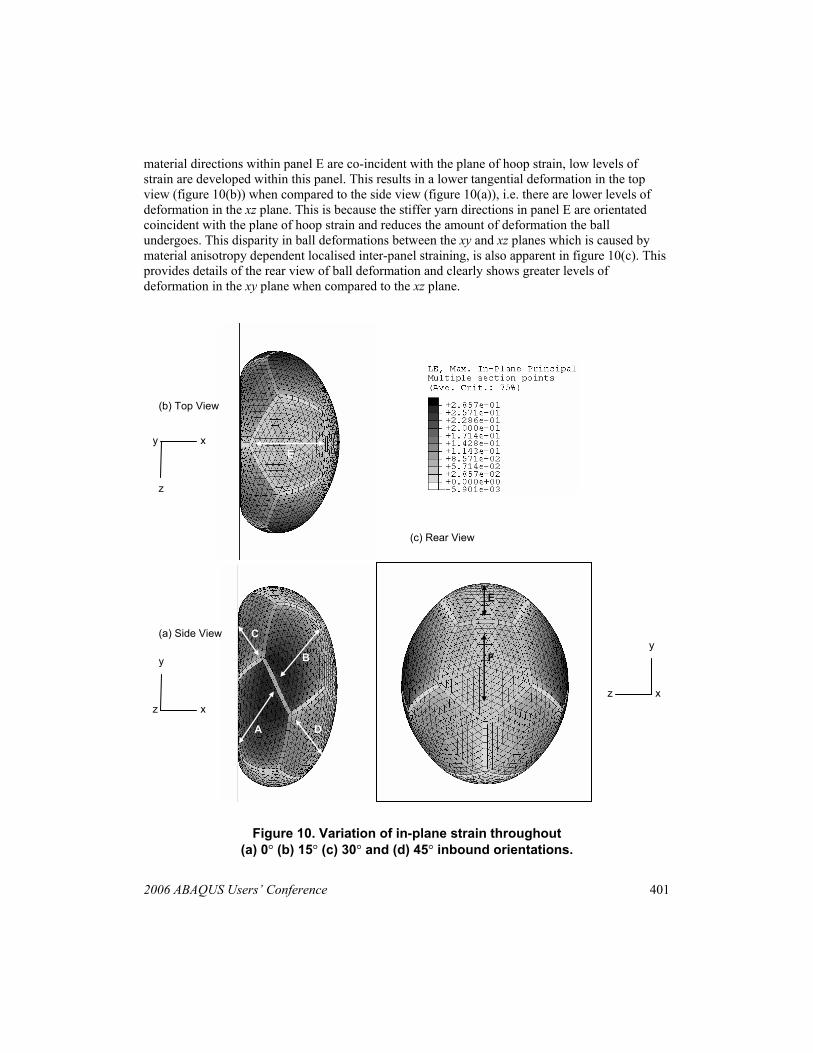
The effects of localised inter-panel strains can be further explained by consideration of the 45° inbound orientation impact. Figure 10 gives details of the side, top and rear view of the 45° inbound orientation maximum deformation shape. Figure 10(a) depicts the majority of straining to occur in panels A and B, as previously reported. Panels C and D within figure 10(a) also exhibit significant levels of straining. As previously mentioned this is due to all four panels being orientated at 45° with respect to the plane of hoop strain. The high levels of strain exhibited by panels A-D results in high levels of tangential deformation occurring in the xy plane as shown in figure 10(a). Figure 10(b) shows the top view of the same ball impact, and as the principal
(a) (b) (c) (d)
2 1 2 1 2
1
2
1
2006 ABAQUS Users’ Conference 401
material directions within panel E are co-incident with the plane of hoop strain, low levels of strain are developed within this panel. This results in a lower tangential deformation in the top view (figure 10(b)) when compared to the side view (figure 10(a)), i.e. there are lower levels of deformation in the xz plane. This is because the stiffer yarn directions in panel E are orientated coincident with the plane of hoop strain and reduces the amount of deformation the ball undergoes. This disparity in ball deformations between the xy and xz planes which is caused by material anisotropy dependent localised inter-panel straining, is also apparent in figure 10(c). This provides details of the rear view of ball deformation and clearly shows greater levels of deformation in the xy plane when compared to the xz plane.
Figure 10. Variation of in-plane strain throughout (a) 0° (b) 15° (c) 30° and (d) 45° inbound orientations.
A
B
C
D
E
E
(a) Side View
(b) Top View
(c) Rear View
z
y
x
y
x z
x
z
y
F
402 2006 ABAQUS Users’ Conference
8. Conclusions
This paper has provided evidence for soccer ball impact characteristics to be significantly influenced by the combined effects of material anisotropy and panel configuration. The inherent shear deformation that results from straining fabric material at non-0°/90° directions was found to cause a distorted shape at maximum ball deformation. An inbound orientation of 0° involved straining the fabric along its yarn directions resulted in low levels of symmetrical deformation as the mechanical properties of the yarns are engaged throughout straining. A 45° inbound orientation resulted in straining of the material along its bias, which resulted in yarns undergoing rotation about their cross-over points due to a trellis mode of deformation, resulting in high levels of symmetrical deformation. The range of deformation behaviour exhibited by the ball was shown to have a profound effect on post impact ball characteristics including, spin, motion of the ball in the plane of the plate, and ball oscillations.
A composite shell element FE model was developed, which incorporated a hyperelastic material model to define the latex bladder and an orthotropic plane stress elastic definition to define the woven fabric outer panels. Good agreement was seen between both model and experimentation with respect to both deformation behaviour and post impact ball characteristics. Additionally the model allowed for inter-panel strain distribution data to be ascertained and revealed that the configuration of panels resulted in disparate levels of ball deformation in two principal planes.
The agreement seen between both model and experimentation gives reassurance in the model’s ability to replicate the effects of panel configuration and material anisotropy on ball impact performance. This allows for the prediction of ball impact characteristics under many differing inbound orientations and the determination of the effects of adding softer polymeric outer panels to the carcass, as featured within the complete new generation ball.
9. Acknowledgements
The author would like to thank both adidas and EPSRC for funding the project.
10. References
1. Cordingley, L., “Advanced Modelling of Hollow Sports Ball Impacts,” PhD Thesis, Loughborough University, Loughborough UK, 2002.
2. Fontaine, S., Durand, B. and Freyburger, J.M., “Fabric Thickness Dynamic Measurement during a Classic Uniaxial Tensile Test,” Experimental Mechanics, vol. 42, no. 1, pp. 84-92, 2002.
3. Gasser, A., Boisse, P. and Hanklar, S., “Mechanical Behaviour of Dry Fabric Reinforcements,” 3D Simulations versus Biaxial Tests. Computational Material Science, vol. 17, pp. 7-20, 2000.
4. Hearle, J.W.S., Grosberg. P. and Backer, S., “Structural Mechanics of Fibres, Yarns and Fabrics,” Wiley, London, 1969.

2006 ABAQUS Users’ Conference 403
5. Kong, H.P., Mouritz, A.P and Paton, R, “Tensile Extension Properties and Deformation Mechanisms of Multiaxial Non-Crimp Fabrics,” Composite Structures, vol. 66, pp. 249-259, 2004.
6. Long, A.C., Souter, B.J., Robitaille, F. and Rudd, C.D., “Effects of Fibre Architecture on Reinforcement Fabric Deformation,” Plastics, Rubber and Composites, vol. 31, no. 2, pp. 87-97, 2002.
7. Murray, B., “Football A History of the World Game,” Scolar Press, Aldershot, 1994. 8. Neilson P.J., “The Dynamic Testing of Soccer Balls,” PhD Thesis, Loughborough University,
Loughborough UK, 2003. 9. Price, D.S., Harland, A.R. and Jones, R., “Computational Modeling of Out of Balance Forces
in Hollow Spheres: Soccer Ball Application,” Asia-Pacific Congress on Sports Technology, APCST 2005, Tokyo Institute of Technology, Japan, 12th – 14th September 2005.
10. Sidhu, R.M.J.S., Averill, R.C., Riaz, M. and Pourbograt, F., “Finite Element Analysis of Textile Composite Preform Stamping,” Composite Structures, 52, pp. 483-497, 2001.
11. Stamm, H. and Lamprecht, M., “FIFA Big Count. L&S Social Research und Consultation AG Zurich,” 2001.
12. Tennant, J., “Football The Golden Age,” Castle and Co, London, 2001. 13. Viney, N. and Grant, N., “An Illustrated History of Ball Games,” Heinemann, London, 1978. 14. Xue, P., Xiongqi, P. and Cao, J., “A Non-Orthogonal Constitutive Model for Characterising
Woven Composites,” Composites: Part A, vol. 34, pp. 183-193, 2003.
Visit the SIMULIA Resource Center for more customer examples.