THE DEFAULT NETWORK IN ALTERED STATES OF CONSCIOUSNESS: A STUDY BY EEG
52
1 MASTER RECHERCHE EN SCIENCES COGNITIVES - COGMASTER - ENS - EHESS - UNIVERSITE PARIS V FRANCE THE DEFAULT NETWORK IN ALTERED STATES OF CONSCIOUSNESS: A STUDY BY EEG Realisé par: Zulay Lugo 2009-2010 Directeur de stage : Pr Steven Laureys MD, PhD Encadrant: Noirhomme Quentin Ir, PhD Laboratoire: "Coma Science Group" Cyclotron Research Center Université de Liège Belgique
Transcript of THE DEFAULT NETWORK IN ALTERED STATES OF CONSCIOUSNESS: A STUDY BY EEG

1
MASTER RECHERCHE EN SCIENCES COGNITIVES - COGMASTER -
ENS - EHESS - UNIVERSITE PARIS V FRANCE
THE DEFAULT NETWORK IN ALTERED STATES OF CONSCIOUSNESS:
A STUDY BY EEG
Realisé par:
Zulay Lugo
2009-2010
Directeur de stage : Pr Steven Laureys MD, PhD Encadrant: Noirhomme Quentin Ir, PhD
Laboratoire: "Coma Science Group" Cyclotron Research Center
Université de Liège Belgique

2
ABSTRACT
The default-mode network (DMN) is a group of cerebrals areas which include posterior
cingulate cortex / precuneus, anterior cingulate cortex, medial prefrontal cortex, and
temporo-parietal junctions which are co-activated in a dominant way during the activity
of the brain at rest. The functional signification of this network remains unclear and it
was proposed as the network which would support the basic functions which maintains
the consciousness of the human being. Nevertheless, the DMN remains poorly studied
and characterized by electroencephalography. To identify the pattern of EEG activity
associated with the default network at rest and possible changes in that pattern in the
altered state of consciousness, a study was conducted simultaneously recording EEG /
fMRI in healthy subjects in the waking state and under light and deep sedation using
propofol. We calculated the correlation coefficient between the electrical signal at
different locations of the EEG and the BOLD signal from fMRI representative of the
default network. The results did not confirm the presence of EEG patterns associated
with the default network in the resting state. We conclude on the need to improve
certain technical aspects of simultaneous record EEG / fMRI in order to obtain optimal
results from their use.
Key Words: default mode network, EEG, altered states of consciousness

3
TABLE OF CONTENTS
I.- INTRODUCTION..................................................................................................................... 5
1. The default mode network.................................................................................................... 5
1.1 Anatomy of the default network ............................................................................. 5
1.2 Functions of the default network .............................................................................. 7
1.2.1 The sentinel hypothesis..................................................................................... 8
1.2.2 The mentation hypothesis................................................................................ 8
2. Consciousness........................................................................................................................ 10
2.1 Consciousness as a multidimensional concept.......................................................... 10
2.2 Altered states of consciousness................................................................................... 11
3. The default mode network and consciousness...................................................................... 12
3.1 fMRI and PET studies ............................................................................................... 12
3.2 Electrophysiological studies..................................................................................... 13
II.- OBJECTIVES........................................................................................................................... 15
III.- MATERIALS AND METHODS.......................................................................................... 16
1. Data acquisition.......................................................................................................... 16
2. EEG/fMRI analysis................................................................................................... 18
2.1 EEG signal processing............................................................................................ 18
2.2 Identification of the default network by fMRI................................................... 22
2.3 EEG/fMRI signals analysis.................................................................................. 24
IV.- RESULTS................................................................................................................................ 25
1. General results.............................................................................................................. 25
2. EEG patterns of the Default Network........................................................................ 27
V.- DISCUSSION........................................................................................................................... 30
1. Possible explanatory factors ...................................................................................... 30 2. The evaluation of the default network in altered states of consciousness............... 31
3. Considerations about the method used...................................................................... 32
VI.- CONCLUSIONS AND PERSPECTIVES............................................................................ 34
VI.- BIBLIOGRAPHY................................................................................................................. 35
VII.- APPENDIX........................................................................................................................... 39
ACKNOWLEDGMENTS........................................................................................................... 52
4
I.- INTRODUCTION
Over the last ten years, increasing attention has been paid to the study of spontaneous
brain activity and its significance for cognition and behavior. The concept of a “default
mode of brain function” was introduced by Raichle et al. (2001) after observing that a
number of areas, including the precuneus, bilateral temporo-parietal junctions and the
medial prefrontal cortex, were more active at rest than when the subjects were involved
in an attention-demanding task.
Nevertheless, up to date, the functional significance of the default network remains a
matter of debate. It has been implicated in cognitive processes like, stimulus-
independents thoughts (Mason et al., 2007) or self-related thoughts (Buckner, Andrews-
Hannas & Schacter, 2008). It has also been involved in processes of memory (Mazoyer,
et al., 2001; Greicius, Srivastava, Reiss & Menon, 2004), anticipation (Spreng & Grady,
2006) and consideration of the thoughts and perspectives of other persons (Buckner et al.
2008; Otti et al., 2010).
The default network has been also suggested as a candidate network sub-serving basic
functions related to consciousness (Boly et al. 2008). Studies of regional metabolism in
vegetative state patients (VS, i.e., state of arousal without awareness, Zeman, 1997)
have identified a systematic metabolic dysfunction in a wide frontoparietal network
which includes brain areas that have been described as part of the default mode network
(lateral and medial frontal regions bilaterally, parieto-temporal and posterior parietal
areas bilaterally, posterior cingulated and precuneus cortices (Boly et al., 2009). This
and other studies that we will review later, have given evidence pointing to the default
network as part of the functional network supporting the function of human
consciousness.
It has been proposed that altered states of consciousness, such as sleep, anesthesia,
coma, vegetative state, epileptic loss of consciousness and somnambulism, are a
privileged way to investigate the links between spontaneous brain activity and behavior
(Cavanna & Trimble, 2006; Boly et al., 2008) because these states are characterized by
the alteration of intrinsic brain activity, which induces dramatic changes in the contents
of consciousness and responses to promising not only in regard to research into the
possible neural correlates of consciousness, but also with regard to its use for diagnostic
purpose in the differentiation of altered states of consciousness very difficult to separate

5
such as vegetative and minimally conscious state.
However, a previous approach to the study of the default network in pathological states
of consciousness can be done by studying the physiological altered states of
consciousness, such as sleep or deep sedation anesthesia in healthy subjects (Greicius et
al., 2008; Horovitz et al., 2008). This would allow the determination of what we might
call the "normal" pattern give these states of consciousness. Then, by applying the same
techniques to patients with altered states of consciousness, we may establish network
disturbances that could contribute evidences in favor of the hypothesis of the default
network as support of the human consciousness.
We hence think that would be useful to deepen in the study and characterization of
possible alterations in the default network under such non-pathological conditions, with
the aim to establish good anatomical and functional characteristics of this network
which can be later evaluated in patients with altered states of consciousness. Differences
found between the network in healthy subjects and in the patients, may help to better
identify the anatomical and functional correlates of human consciousness.
1. The default mode network
A "default mode network" (DMN) has been highlighted in functional neuroimaging
studies as a set of brain regions showing synchronized activity at rest or in task-
independent cognitive state (Raichle et al., 2001). This concept comes from the
observation of a number of brain regions whose activity decreased during the
performance of cognitive task. By means of positron-emission tomography (PET), it
was made possible to estimate the brain oxygen extraction fraction (OEF), which s
defined as the ratio of oxygen used to oxygen delivered by flowing blood. This OEF is
remarkably uniform in the awake but resting state in normal subjects, Raichle et al
(2001) found that the changes in the OEF was strongly correlated in a group of areas,
indicating a small but systematic modulation of these areas at rest, areas he called for
the first time the ‘default network’.
1.1) Anatomy of the default network
The areas initially described by Raichle et al (2001) as belonging to the default network
were mainly in the midline, such as the posterior cingulated cortex, the precuneus and

6
the medial prefrontal cortex and also (although less noticeable in this study) by the
lateral parietal cortex. In later studies, other areas have been also described as part of
this network such as the temporo-parietal junction (Boly et al., 2008; Vanhaudenhuyse
et al., 2010), the bilateral inferior parietal cortex (Mantini, Perrucci, Del Gratta, Romani,
& Corbetta, 2007; Greicius et al., 2008), the hippocampus (Grecius et al., 2004) and the
medial temporal cortex (Buckner et al., 2008). Table 1 presents the main regions
described as belonging to the default network.
_____________________________________________________________________________________ REGION ABREV INCLUDED BRAIN AREAS _____________________________________________________________________________________ Ventral medial prefrontal cortex vMPFC 24, 10 m/10 r/10 p, 32ac Posterior cingulate/retosplenial cortex PCC/Rsp 29/30, 23/31 Inferior parietal lobule IPL 39, 40 Lateral temporal cortex† LTC 21 Dorsal medial prefrontal cortex dMPFC 24, 32ac, 10p, 9 Hippocampal formation†† HF+ Hippocampus proper, EC, PH _____________________________________________________________________________________ TABLE 1. Core regions associated with the brain’s default network. Labels correspond to those originally used by Brodmann for humans with updates by Petrides and Pandya (1994), Vogt et al. (1995), Morris et al. (2000), and Ongür et al. (2003). †LTC is particularly poorly characterized in humans and is therefore the most tentative estimate. ††HF+includes entorhinal cortex (EC) and surrounding cortex (e.g., parahippocampal cortex; PH). Adapted from Buckner et al. (2008)
But, as its name suggests, the default network is a set of areas whose main feature is the
activation together in the resting state and deactivation, also jointly, during the
realization of a variety of cognitive tasks. Consequently, their anatomy could be better
understood as multiple interacting subsystems (Buckner et al., 2008). Figure 1 shows a
schematic representation of the interrelation of theses sub-systems.
• The subsystem of the medial temporal lobe, which provides information from
past experiences in the form of memories and associations that are the building
blocks of mental simulation.
• The medial prefrontal system, which facilitates the flexible use of this
information during the building of self-relevant mental simulations.
• Finally, these two subsystems converge on important nodes of integration,
including the posterior cingulated cortex

7
Figure 1. Functional correlation strengths for multiple regions within the default network. The structure of the default network has a core set of regions (red) that are all correlated with each other. Lateral temporal cortex (LTC) is distant because of its weaker correlation with the other structures. The medial temporal lobe subsystem (blue) includes both the hippocampal formation (HF) and parahippocampal cortex (PHC). This subsystem is correlated with key hubs of the default network including posterior cingulate cortex/retrosplenial cortex (PCC/Rsp), ventral medial prefrontal cortex (vMPFC), and inferior parietal lobe (IPL). The dorsomedial prefrontal cortex (dMPFC) is negatively correlated with the medial temporal lobe subsystem suggesting functional dissociation. Adapted from Buckner et al. (2008)
1.2 Functions of the default network
The best evidence for understanding the function of the default network, comes from the
context in which it is activated, when individuals are at rest or engaged in internally
focused task: retrieval of autobiographical memory, imagining the future and
anticipation (taking) of other's perspectives.
However, the anatomical correlations of the network, mainly at the retrosplenial area
and the precuneus, suggests another possible role for the default network, that of
monitoring the external environment when focused attention is relaxed. In this way,
there have been two main hypotheses of its function,. So, we would have the hypothesis
of the default network as a watchdog of our external environment -the sentinel
hypothesis- and the other, the default network acting as support for internal cognitive
functions or self-referenced -the mentation hypothesis- (Buckner et al., 2008).

8
1.2.1 The sentinel hypothesis
In 2001 Raichle et al., had already proposed that the deactivation of the areas located
mainly in the midline within the posterior cingulated, precuneus ant the medial
prefrontal cortex, suggested that specific brain functions, unique to resting state, were
being temporarily suspended during the performance of cognitive activities. In this
hypothesis, they suggested that, the posterior cingulate cortex and the precuneus would
form a tonically active brain region that continually meet the information about the
external environment (and possibly on our internal environment);this would have an
important evolutionary function of warning against possible predators and that must be
maintained at all times while awake and would be disabled only when other mental
tasks require attentional resource allocation. In this hypothesis, the medial prefrontal
cortex would be implied in the integration of emotional and cognitive processes by
incorporating emotional biasing signals or markers into decisional processes. Hence,
these three regions together, would act as the sentinels of our brain at rest, by collecting
and evaluating the internal and external information. The sentinel hypothesis, however,
does not account for the presence in the network of brain structures closely linked to
memory processes, such as the hippocampus.
1.2.2 The mentation hypothesis
In the context of the mentation hypothesis, the default network would have mostly
cognitive role, forming part of several mental processes such as autobiographical
memory, anticipation, self-referential and, finally, while spontaneous cognition
supporting, also a role in supporting human consciousness. Figure 2 shows the
activation of default network's areas during the execution of different cognitive tasks,
supporting its possible role in all this mental functions.

9
Figure 2. The default network is activated by diverse forms of tasks that require mental simulation of alternative perspectives or imagined scenes. Adapted from Buckner et al. (2008)

10
2) Consciousness
2.1 Consciousness as a multidimensional concept
Conscious has two major components: awareness (i.e., the content of consciousness)
and arousal (i.e., the level of consciousness). The level of arousal depends on the tonic
excitatory influence of cholinergic, noradrenergic, histaminergic, serotonergic, and
dopaminergic activating structures of the brain stem and diencephalon, formerly known
as the reticulo-thalamic activating system (Zeman, 2001). Awareness is in turn
composed by 2extra components: perception of the environment or the external world
(external awareness) and of our inner world and self-awareness encompassing inner
speech, mental imagery, and thoughts (internal awareness) (Laureys, 2005). Fig 3
shows the distribution of the altered states of consciousness in the two dimensions of it.
Fig 3. Simplified illustration of the two main components of consciousness: arousal (or wakefulness) and the content of consciousness (i.e. awareness). In normal physiological states, arousal and awareness are positively correlated (with the exception of dream activity during REM-sleep). Patients in coma or under general anesthesia are unconscious because they cannot be awakened. Patients in the vegetative or the minimally conscious state are awake but have no or low awareness. Locked-in patients are awake and aware but are nearly completely paralyzed and may be mistaken for coma or vegetative state. Adapted from Laureys et al., (2005)
11
2.2 Altered states of consciousness
Three main types of altered states of consciousness can be defined: physiologically,
pharmacologically, and pathologically altered conscious states (Boveroux, et al., soumis)
• Normal sleep, encompassing light (stage II) and deep (stage III and IV) slow
wave sleep stages, and dreaming [mostly occurring during rapid eye movement
(REM) sleep] can be considered as the main physiologically altered conscious
states.
• Pharmacologically induced unconscious states are commonly named deep
sedation or general anesthesia. Sedative anesthetic agents can be separated into 3
main categories: the classic anesthetic agents, the dissociative anesthetic agents,
and the minimally sedative agents. Examples of classic anesthetic agents are
benzodiazepines, barbiturates, propofol, and halogenated compounds such as
desflurane or sevoflurane. They are able to induce graded states of sedation and
combine alterations of wakefulness and awareness functions.
• The last category of altered states of consciousness refers to pathologic altered
conscious states, which are the result of severe brain insults of various origins,
and encompass comatose, vegetative, and minimally conscious states.
- Coma: coma is a state of unarousable unresponsiveness characterized
by the deficiency of the arousal systems and thus also by absence of awareness. The
comatose patient lacks the sleep–wake cycles that can be observed in the VS (Laureys,
Boly, Moonen & Maquet, 2009).
- The vegetative state (VS): it was defined by Jennet et Plum in 1972 to
describe those patients who ‘awaken’ from their coma (meaning they open their eyes
spontaneously or on stimulation) but remain unaware of self or environment (meaning
they show only reflex motor responses) (Zeman, 1997; Laureys et al., 2004)
- The minimally conscious state (MCS): describes the condition of
patients who show, on a reproducible or sustained basis limited but clearly discernible
evidence of awareness of self or environment but are unable to functionally
communicate their thoughts and feelings (Giacino et al., 2002).
- The locked-in syndrome: describes patients who are awake and conscious but
selectively deefferentes, i.e., have no means of producing speech, limb or facial
movements. (Laureys et al., 2005). Its interest in the study of the altered states of

12
consciousness is that, it is almost the mirror image of the vegetative state (patient able
to move but completely unconscious), an entity with which is very often confused.
3) Default mode network and consciousness
As described, the default network, while supporting the spontaneous cognitive activity,
could be regarded as one of the pillars of the state or the function of human
consciousness (Boly et al., 2008). This hypothesis has recently been supported by
several studies that show a clear association between altered states of consciousness and
the (dys)function of the default network.
3.1 fMRI and PET studies.
PET and fMRI have been widely used for the identification and evaluation of the
default network both in healthy subjects and in subjects with pathological cerebral
conditions, having shown a good ability to identify structural pattern of functional
connectivity of this system. (Rachle et al., 2001; Damoiseaux et al., 2006). We will
focus on this section with respect to the studies that have allowed evidence of a possible
relationship between the function or the operation of the default network and awareness.
An early study done in subjects under light sedation, has been found a reduced
functional connectivity in the posterior cingulated cortex suggesting that, these
reductions in default network's connectivity may represent a stable correlate of reduced
consciousness (Grecius et al., 2008 ).
As we mentioned previously, Boly et al. (2009) had already demonstrated the alteration
of functional connectivity in the default network in a vegetative state patient compared
with a normal subject, suggesting a possible relationship between the functioning of the
default network and the consciousness alteration in the patient. But also, the same study
evidenced the absence of network connectivity in a patient with a diagnosis of brain
death, further support the hypothesis that the functioning of the default network may be
involved in maintaining the state of consciousness.
A more recent study (Vanhaudeynhese et al, 2010) evaluated the default network's
connectivity in patients with different altered states of consciousness: coma, vegetative
state (VS), minimal state of consciousness (MSC) and a patient with locked-in

13
syndrome (LIS), comparing it with that of healthy control subjects. The results showed
a decrease of the default network connectivity in severely injured patients, in proportion
to the degree of impairment of consciousness; whereas, the LIS patient, showed a
connectivity similar to the controls; strongly supporting this finds the idea of the default
network as a functional network whose activities largely depend on the presence of
consciousness in human beings.
3.2 Electrophysiological studies
Electrophysiological methods, such as the electroencephalogram (EEG) have been also
used in the evaluation of the default network. Although the EEG assessment of brain
activity at rest is frequently used after so many years, only recently, and through
technique combined EEG / fMRI, has begun to characterize the rhythms associated with
certain cognitive functions and many more recently has begun to try characterization of
the default network by this method.
A recent study of the spatial distribution of EEG energy fields in the default network,
found an alpha activity of bilateral posterior distribution that decreased significantly
with eye opening, a prefrontal theta activity also decreasing with eyes opening, a
prefrontal delta activity that increases with eye opening, a Beta-1 activity of similar
distribution to alpha and also decreased with eyes open and finally, a prefrontal
distribution for the beta-2 and gamma rhythms without changes to the eye opening
(Chen, Feng, Zhao, Yin & Wang, 2008).
With the technique combining EEG/fMRI, in 2002 a study was conducted to identify
brain regions whose BOLD signal varied with fluctuations in alpha rhythm modulation
at rest (Goldman, Stern, Engel & Cohen, 2002). They found that the increased alpha
power was correlated with decreased MRI signal in multiple regions of occipital,
superior temporal, inferior frontal and cingulated cortex, and with increased signal in
the thalamus and the insula; which they interpreted as confirmation of the alpha rhythm
as an index of cortical inactivity and the thalamus as the possible generator of this
rhythm. Moosmann et al., (2003) using the combined EEG/fMRI and near infrared
spectroscopy, found un inverse relationship between alpha activity and the BOLD
signal in the occipital cortex.
Lauf et al., 2003a, also conducted a study to identify the BOLD signal variations
associated with alpha fluctuations, finding a strong negative correlation of parietal and

14
frontal activity with alpha power and only sparse and nonsystematic positive correlation.
They conducted another study (Lauf et al., 2003b) to establish the neuroanatomical
patterns of resting state fluctuations in the brain and they found a little positive
correlation with alpha power that was sparse and restricted to two foci in the cingulated
gyrus and occipital cortex, and widespread negative correlation with alpha power in a
bilateral fronto-parietal network. Also they found that the power in a 17–23 Hz range of
beta activity was positively correlated with the activity in retrosplenial, temporo-parietal,
and dorsomedial prefrontal cortices and finally, for the theta band they found no
correlation. This was the first study to attempt to establish an EEG pattern for the
resting state, evaluating other frequency bands besides the alpha band.
In this same line of identifying the EEG patterns of the default network, a more recent
study (Mantini et al., 2007), has established the presence of six resting states networks,
the first corresponding to the default mode network, and in which they found a
coalescence of EEG rhythms but only a positive correlation for the alpha and beta
rhythm.
The default network has been studied little by EEG in conditions of altered states of
consciousness. Only one study showed the persistence of DMN connectivity during
light sleep (Horovitz et al.,2008), but in this work, the EEG record was used only as a
marker of sleep stages. So, it has not been established so far the variation of the default
network in altered states of consciousness, using simultaneous EEG / fMRI recording.
We, therefore, propose the realization of this study with assessment EEG/fMRI of the
default mode network following the protocol used by Mantini et al., (2007) and
extending to the study of the correlation in altered states of consciousness induced by
anesthesia with the aim to confirm the presence of a specific EEG pattern of the default
network and, by comparing this pattern with the activities obtained during the recording
in conditions of light and deep sedation, to establish network's alterations associated
with these altered states of consciousness, getting more indirect evidence about the role
of the default mode network in the emergence and maintenance of human consciousness.

15
II.- OBJECTIVES
1) General objective: to establish the EEG patterns of the DMN in resting state in
normal subjects.
2) Specific objectives:
• To determine the correlation of the different bands of frequency of the EEG in
healthy subjects at rest.
• To determine the variations of this pattern in the same subjects under light and
deep sedation.
• By comparing the electric patterns of the subjects in the wakefulness condition
with those in the conditions of light and deep sedation: to determine the
alterations in the activity of the default mode network that could be related to
the altered states of consciousness.

16
III.- MATERIALS AND METHODS
1. Data acquisition
1.1 Type of study: we designed an experimental transverse study . The study was
approved by the Ethics Committee of the Faculty of Medicine of the University of
Liège. Written informed consent was obtained from all subjects.
1.2 Subjects: 19 healthy right-handed volunteers, 3 male, 16 female, aged from 19 to
31 years (mean: 23 years, SD: 3) participated to the study. Subjects were recruited
among medical, paramedical or students of health sciences, who knew or were able to
understand the risks inherent in the use of sedation with propofol. All were
compensated for their participation in the study.
1.3 Sedation protocol
- Anesthesia was achieved with a computer-controlled intravenous infusion of propofol
to obtain constant effect-site concentrations. Propofol (2,6 di-isopropylphenol) is a very
short acting non-opioid sedative–hypnotic agent, structurally unrelated to other hypnotic
compounds, It is thought to work by potentiating the binding of gamma-amino butyric
acid to receptor sites in the central nervous system (Peter et al 2005). It induces sedation
rapidly and reliably, and has additive or synergistic hypnotic effects with many other
agents (barbiturates, benzodiazepines, opioids and ketamine) used in anaesthesia
(Bryson, Fulton and Faulds 1995). Its rapid onset of action and amnesic properties,
coupled with smooth and rapid recovery, make propofol an appealing agent for
procedural sedation and analgesia (Peter et al., 2005) and the choice of this agent for
this study is relied to these pharmacological properties and the relative safety of its
use. Arterial blood samples were also taken immediately before and after the scan in
each clinical state for subsequent determination of the concentration of propofol and for
blood gas analysis .
The level of consciousness was evaluated clinically throughout the study with the
Ramsay scale (RS) (Ramsay et al., 1974). The RS scores sedation at six different levels,
according to how arousable the patient is. To assess the level of consciousness, the
subject was asked to strongly squeeze the hand of the investigator. She/he was
considered fully awake or having recovered consciousness if the response to verbal
command ("squeeze may hand") was clear and Strong (Ramsay 2), in mild sedation if

17
the response to verbal command was clear but slow (Ramsay 3), and in deep sedation if
there was no response to verbal command (Ramsay 5-6). So, we defined four test
conditions:
• Wakefulnes ( W1): state of consciousness at baseline (RS= 2)
• Sedation 1 (S1): state of mild sedation (RS= 3)
• Sedation 2 (S2): state of deep sedation (RS= 5-6)
• Recovery of consciousness (W2): waking state of anesthesia (R= 2)
Before and after each scanning session, a reaction time task was also performed to
provide additional information on the clinical state of the subjects. Lying in the scanner,
subjects were instructed to press a keypad as fast as possible each time they heard a
beep through the headphones. At each test, a block of 20 beeps was presented.
To ensure safety, the following physiological parameters were monitored: 4-lead
electrocardiogram, non invasive blood pressure on the left arm, pulse oxymetry (SpO2)
and end tidal carbon dioxide partial pressure (ETCO2). This last measure was not
expected to be precise but merely to inform us about the subjects breathing.
1.4 Functional MRI acquisition: Functional images (200 images in each condition)
were acquired on a 3 Tesla Siemens Allegra scanner (32 slices, repetition time = 2460
ms, echo time = 40 ms, field of view = 220mm, voxel size = 3.45x3.45x3 mm, matrix
size = 64x64x32). A high resolution T1 image was also acquired in each volunteer at
the end of the whole experiment, for co-registration to the functional data.
1.5 EEG acquisition:
EEG was recorded utilizing two MR-compatible 32-channels amplifiers (Brain Amp
MR plus, Brain Products GmbH, Gilching, Germany) and an MR-compatible EEG cap
(Braincap MR, Falk Minow Services, Herrsching Breitbrunn, Germany) with 64 ring-
type electrodes. EEG caps included 60 scalp electrodes, four electrodes for referencing
(two on the nose and one on each mastoid) as well as two electrooculogram (EOG) one
electromyogram (EMG) and three electrocardiogram (ECG) channel which were online
referenced to FCz. The electrodes were placed following the 10-20 International
System.(Appendix 1). Electrode-skin impedance was kept below 5 kΩ in addition to
the 5 kΩ resistor built into the electrodes. EEG was digitized at 5000 Hz sampling rate
with a 500 nV resolution. Data were analog-filtered by a band limiter low pass filter at

18
250Hz (30 dB/Octave) and a high pass filter with 10 s time constant corresponding to a
high pass frequency of 0.0159 Hz. Data were transferred outside the scanner room
through fibre optic cables to a personal computer where the EEG system running Brain
Recorder Software v1.03 (Brain Products GmbH, Gilching, Germany) was
synchronized to the scanner clock. For analysis, EEG data were low-pass filtered (FIR
filter, −36 dB at 70 Hz), and down-sampled to 250 Hz. The duration of the registration
was 8 minutes (12 subjects) and 14 minutes (9 subjects) in each condition.
2. EEG/fRMI analysis
To determine the correlation between the EEG signal and the default network as
identified by of MRIthe following steps were followed (Appendix 2 shows an outline of
these steps)
• Processing of raw EEG records in order to eliminate artifacts.
• Selection of EEG electrodes to include in the spectral analysis.
• Spectral analysis of the EEG.
• Identification of the default network by fMRI.
• Convolution of the EEG waveform with the HRF
• Calculating the correlation coefficient
These tests were the focus of our work for the stage and the choice of each parameter
was widely discussed with the stage manager and other team members with extensive
experience in EEG / fRMI.
2.1 EEG signal processing
2.1.1 Removal of artifacts
As is well known, a major problem of EEG–fMRI simultaneous, consists of the
contamination of EEG recordings by gradient switching -the gradient related artifact -
(GRA) and the pulse related artefacts (PRA) (Fig. 3 y 4) The former is related to the
echo planar sequence used in fMRI. The latter is thought to have multiple causes related
to the interaction between the static magnetic field and the heart beat, such as pulsatile
motion of recording electrodes, cardio-ballistic head movements and Hall effects in
blood vessels (Allen, Polizzi, Krakow, Fish, & Lemieux,1998). Therefore, it is

19
necessary to treat the raw signals to eliminate these artifacts to make usable the obtained
signals. Several methods have been proposed and used for this treatment
Fig 4. Gradient related artifact (GRA) Fig 5. Pulse related artifact (PRA)
a) For GRA rejection:
- The Averaged Artifact Subtraction (AAS) (Allem et al 1998): Compute a GRA
template using the mean of the n last scan and after subtract the GRA template from the
current EEG. Because the gradient artifact is very reproducible across consecutive
volume acquisitions, it is satisfactorily removed from raw data with this method
followed by adaptive noise cancellation to reduce any residual artifact ( Leclerq et al.
2009)
b) For PRA rejection:
- A new method based on ICA has been recently developed to remove the PRA:
the constraint independent corposant analysis (cICA, Leclerq et al 2009). The
application of this method is developed in five steps: 1) computing a PRA template for
each of the N° channels of the EEG signal; 2) computing the artefact related
components based on these constraints using the cICA algorithm; 3) clustering the
estimated artifact components and computing the average of each cluster to produce
more robust estimates of the artifact sources; 4) finding the subspace of neural sources
within the demixing matrix, i.e. the complementary space of the artifact sub-space,
using a Gram–Schmidt procedure and 5) replacing artifact sources by void sources and
reprojecting all sources in signal space. This algorithm potentially leads to a more
robust estimation than other ICAs of the PRA sources without increasing the

20
computational cost. In addition, the identification of sources to suppress is automated,
data driven and not observer-dependent.
In previous studies of joint analysis EEG/MRI, have been used AAS methods for the
elimination of artifacts both gradient-related as pulse- related (Lauf et al. 2003), and a
combination of the AAS method for the GRA and the ICA for PRA (Mantini et al.,
2007). In the current study, has been chosen to use the method of cICA because its
efficient in rejecting PRA for EEG data recorded during wakefulness and NREM sleep,
this last characteristic being important to an study under anesthesia. This method has
been validate by comparing with the others methods of artifacts rejects (Leclerq et al.,
2009), showing, in the frequency domain (where all the correction methods globally
decrease signal power), that is the method which removes the most power in all
frequency bands and pleasingly provides the spectrum closest to the recording obtained
outside the scanner. (Fig 5)
Fig. 6. Power spectrum of the EEG recorded at electrode F8 after correction by the different PRA rejection methods. The power spectrum of the original signal and signal recorded with the head outside the MR scanner are given as references. Adapted from Leclerq et al., 2009
The application of the cICA algorithm, was followed by the visual inspection of the
records in order to manually remove those devices not addressed by the mainly those

21
related to subject movements. Those EEG with a percentage of artifacts more than 10%
of the total recording time were discarded.
2.1.2 Selection of EEG electrodes to include in the spectral analysis
Different groups of EEG electrodes have been analyzed in previous studies of the
default network: averaged signals from the occipital electrodes O1-O2 with the
reference electrode located at FCz (Lauf et al., 2003a) or at the ear (Moosmann et al.,
2003), averaged signals from all electrodes (Moosmann et al., 2003; Mantini et al.
2007), from groups of electrodes across different regions (O1,O2, C3, C4, F3, F4,
Moosmann et al., 2003), with non clear consensus on which electrodes could provide
better information for the activity of our interest. In this regard, some have found no
differences in measurements of the power of the frequency bands between different
locations, (Lauf et al., 2003), while others point to this factor as influential in obtaining
dissimilar results for the same frequency among different studies (Nunez et al., 2001;
Sheeringa et al., 2008).
We decided to do the analysis of three groups of signals with the objective of covering
more of electrodes but restricted to the locations corresponding macroscopically to the
network by default: 1) the signals coming from three groups of electrodes in frontal
(F3-F4-FC3-FC4), centro-parietal (CP3-CP4-P3-P4) and occipital (O1, O2) location,
each group referenced to the central electrode (Fz, Cz and Oz respectively); 2) the
signals coming from the midline electrodes (Fz-Cz-Pz-Oz-FPz- AFz -CPz -POz )
referenced to the mean of the mastoid electrodes (M1, M2), 3) and for control and
comparative purposes, the signals coming from the average of all electrodes (60) also
referenced to the mean of the mastoid electrodes.
2.1.3 Spectral analysis of EEG
To determine the spectral characteristics of the artifact-free EEG data, the power
spectrum was calculated by using the method of the Morlet wavelet of ordre 7, this
transformation being broadly equivalent to other non-linear transformations (such as
short-term Fourier transform or the Hilbert transform), so, all three could be used for
this calculation (Kiebel, Tallon-Baudry & Friston, 2005). This approach enable us to
remove small artifacts like eye blink whiwh were discarded before averaging. Figure 7
shows the waveform of the Morlet wavelet.

22
Figure 7. Morlet wavelet
The resulting spectrogram was divided into six sub-bands, corresponding to delta (1–4
Hz), theta (4–8 Hz), alpha (8–12 Hz), beta1 (13–16 Hz), beta 2 (16-24 ) and gamma
(25–45 Hz) rhythms. We calculated one wavelet for ech sub-band, centred on 2.5, 6, 10,
14 and 20 Hz respectively with a width of 1.5, 2, 2, 2 and 4.
2.2 Identification of the default network by fMRI
2.2.1 Choice of the method
There are two main ways to analyze resting–state functional connectivity MRI (rs-
fcMRI): (1) hypothesis-driven seed-voxel (Fox et al., 2005) and (2) data driven
Independent Component Analysis (ICA) approaches (McKeown et al., 1998), each
offering their own advantages and limitations.
The seed-voxel approach consists in extracting the BOLD time course from a
region of interest and determines the temporal correlation between this signal (seed) and
the time course from all other brain voxels (Fox et al., 2005). This method, which is
quite straightforward and gives very intuitive results has been widely adopted and
seems to give very consistent results (Fox and Raichle, 2007), but it has raised some
controversial issues mostly related to the pre-processing procedure, especially
concerning the regressing out of the global activity from the BOLD signal which might
induce some spurious anti-correlations. (Murphy et al., 2009)

23
Contrary to the previous approach, ICA-based analysis (McKeown et al., 1998)
does not require an a priori definition of seed regions. It analyses the entire BOLD
dataset and decomposes it into components that are maximally statistically independent
(Hyvarinen et al., 2001). A number of studies have shown that ICA is a powerful tool
which can simultaneously extract a variety of different coherent neuronal networks (De
Luca et al., 2006; Esposito et al., 2008; Greicius et al., 2003; Greicius et al., 2004;
McKeown et al., 1998) and separate them from other signal modulations such as those
induced by head motion or physiological confounds (e.g., cardiac pulsation, respiratory
cycle and slow changes in the depth and rate of breathing), (Birn et al., 2008, Perlbarg et
al., 2007). ICA decomposes the signal in spatial patterns and their associated time
course maximally independent for each other. However, ICA does not provide any
classification or ordering of the independent components (ICs), and it is left to the user
to decide which IC corresponds to the DMN. Automatic approaches have been proposed
to remove user-bias in selecting the component. (Greicius et al., 2004, Esposito et al.,
2005).
In this study was used the ICA approach for the identification of the default network on
account of the expertise of the person carrying out this analysis, however, a
simultaneous analysis (results not shown in this work) done on the same group of
subjects using the seed-voxel approach, obtained similar results regarding the
identification of the default network
2.2.2 Data preprocessing and analysis
fMRI data were preprocessed using the "BrainVoyager"s sotware package (R. Goebel,
Brain Innovation, Masstricht, The Netherlands). Preprocessing of functional scans
included 3D motion correction, linear trend removal, slice scan time correction and
filtering out of low frequencies of up to 0.005 Hz. The data were spatially smoothed
with a Gaussian filter of full width of half maximum value of 8 mm. ICA (Formisano et
al., 2004) was performed with the ‘‘BrainVoyager’’ software package using thirty
components (Ylipaavalniemi and Vigario, 2008).
We performed, as implemented in Brain Voyager (self-organizing ICA Esposito et al.,
2005) a spatial similarity test on single subjects ICs and a previously created template of

24
the Default Mode based on 20 controls to select the DMN component. For each subject
we obtained one spatial pattern and its associated time course.
2.3 EEG/fMRI signals analysis.
2.3.1 Convolution with hemodynamic response function
For each scan and frequency band, the mean power spectrum was computed. Only data
which were not artefacted were included in the computation. Each power time series of
EEG bands was convoluted with five different hemodynamic response function (HRF).
The thirty signals were normalized by subtracting the minimum value and dividing by
the difference of maximum and minimum values.
HRF was modeled as a mixture of 2 Gamma functions as implemented in SPM. The
canonical hemodynamic response function has a delay of response of 6 sec, a delay of
undershoot of 16 sec and a length of 32 sec. The four other HRF had a delayed onset of
-2,-1, 2, 1 sec from the canonical HRF. Figure 8 shows the five HRF calculated.
Figure 8. Hemodynamic response functions
2.3.2 Correlation
For each subject and frequency band, five correlations coefficients were
computed between the five HRF and the IC waveform ( it was compute with matlab,
Mathworks Inc., USA). The correlation coefficient with maximum value was selected as
most representative of the link between the EEG time course and the IC waveform.

25
IV. RESULTS
A total of nineteen simultaneous records EEE/fMRI were examined, of which 11 were
discarded for the analysis: nine due to the presence of artifacts (mainly related to
movement) and two for lack of analysis of the default network in fMRI. Therefore, we
finally analyzed data from eight subjects: 2 men, 6 women, aged between 20 and 24
years (mean = 21.4, SD = 1.2).
We obtained the correlation coefficient between EEG frequency bands and the BOLD
signal in each condition for three groups of electrodes:
- Midline electrodes group: Fz-Cz-Pz-Oz-FPz- AFz -CPz -POz, referenced to the
averaged mastoid electrodes
- Paramedian electrode groups: anterior (frontal): F3-F4-FC3-FC4 (referenced to
Fz), middle (centro-parietal) : CP3-CP4-P3-P4 referenced to Pz, and back
(occipital): O1-O2 referenced to Oz. These electrodes were chosen on account of
its superficial location very close to the anatomical areas associated with the
default network.
- Finally, we did the analyses for the set of all electrodes (60 electrodes).
1. General results
• Wakefulness and recovery conditions: We found a large inter-subject variability
of correlation coefficients, which were generally rather low , considering the
highest values for the theta band at the central-parietal electrodes (mean=
0.1532 Std= 0.2028) and the lowest for the gamma band at the occipital
electrodes (mean=0.0121, Std: 0.0942) (all coefficients for all the electrodes
groups and the four conditions are showed in the Appendix 4). In general, the
highest correlations were obtained by the electrodes in the centro-parietal
location and the lowest in the occipital and midline locations (this one with the
lowest values for the alpha band). However, it is not possible to determine a
homogeneous pattern of correlation of the frequency bands in this condition
(table 2)

26
Electrode Groups
Delta Theta Alpha Beta1 Beta2 Gamma
Occipital
0.1389 0.0981 0.0299 0.0247 0.0993 0.0121
Centro-Parietal
0.1034 0.1532 0.0961 0.1471 0.1525 0.0802
Frontal
0.0915 0.0856 0.0726 0.0739 0.0711 0.0249
All
0.1249 0.1021 0.036 0.1221 0.0834 0.0339
Midline 0.0888 0.0833 0.0224 0.0774 0.0902 0.0554
Table 2. Correlation coefficients (mean) in the wakefulness for all the locations studied
With respect to the alpha band, the feature rhythm of wakefulness at rest, we found low
levels of correlation in all locations, including in the occipital where there is a
predominance of delta band. This distribution, however, was completely different in the
normal wakefulness condition, in which alpha band was predominant in all locations,
with the greatest correlations weightings to the electrodes in centro-parietal location (r=
0.1199.
For the beta-1 and beta-2 bands, the largest coefficients in the wakefulness condition
were located also in the central-parietal electrodes (beta1, r= 0.1471; beta2, r= 0.1525).
In the awakening condition we found negatives coefficients for these bands in all
locations.
• Sedation conditions: As in the wakefulness condition, the coefficients showed
low values and high inter-subject variability. In these conditions, it can be seen
a net predominance of negative correlations for almost all bands in all locations,
the alpha band showing a negative correlation in both stages of sedation for all
locations. It may also be noted a tendency for positive correlations of the delta
band in the stage of deep sedation, which although low, may be observed at all
locations except in the centro-parietal regions Figure 9 shows the variation of
the six frequency bands in the centro-parietal location in the four conditions.

27
Figure 9. Variations of the correlations coefficients for each frequency band across the four conditions in the centro-parietal region
• Finally, in the recovering condition, besides the predominance of correlation for
the alpha rhythm, the persistence of some negatives correlations, especially in
the frontal regions can be observed.
2. EEG patterns of the default network
Our first objective was to determine the pattern of EEG rhythms of the default network
in the awaking condition, our hypothesis being so, the existence of such a pattern
characteristic for this state.
To answer this, we analyzed the correlation coefficients of alpha, beta1 and beta2,
which had been found significantly correlated with the default network in a previous
works (Mantini et al., 2007). We chose the data from midline electrodes and we ordered
a one-sample t-test, which showed no significant correlation for the analyzed
frequency bands (alpha band t= 0.6794; beta1 band t = 0.1777; beta2 band t= 0.0506;
for a statistical significance level set at p< 0.0167 after Bonferroni correction).
As a secondary analysis, the same test was conducted to analyze the signal of these
three bands coming from all electrodes and found no significant correlation (alpha band
t= 0.4198; beta1 band t= 0.0440; beta2 t= 0.0346). The same analysis for these bands
and for the theta band was made in the frontal group, central group and occipital
electrode groups, also finding no significant association of EEG rhythms with the
default network to these locations (data included in the Appendix 5).
‐0,1
‐0,05
0
0,05
0,1
0,15
0,2
Delta Theta Alfa Beta1 Beta2 Gamma
Wake2
Sedation2
Sedation1
Wake1

Not h
cond
other
whet
the a
drow
show
by de
exten
To a
elect
ANO
corre
The
0.012
0.062
1,2 a
Grapband
having foun
dition which
r condition
ther there w
awaking c
wsiness, we
ws a signific
efault? It m
nt in any of
answer this
trodes (depe
OVA was d
ection for m
results sho
28), but not
23; signifi
and 3 shows
phic 1. Boxd through
nd a charact
h could be c
s, we then
was a signif
ondition w
have the f
cant variatio
means: the p
f the conditio
question, w
endent vari
done for e
multiple com
owed a stat
t for the alph
cance level
s the distribu
xplot of the the four stu
teristic patte
compared ag
n reformula
ficant differ
with respect
following qu
on between
power spectr
ons?
we ordered
iable) for th
each EEG
mparison (Bo
tistically sig
ha and the b
l set at p<0
ution for ea
A
variation udied cond
ern of EEG
gainst the c
te the seco
ence in the
t to conditi
uestion: is
each of the
rum of the a
a repeated
he four con
rhythm, al
onferroni) w
gnificant va
beta1 band (
0.0167 after
ach band.
Alpha band
of the corrditions
for the defa
correlation c
ond hypoth
EEG patter
ions of lig
that some o
four condit
analyzed ba
measures A
nditions (in
lfa, beta-1
was applied
ariation onl
(alpha band
r Bonferron
d
relations co
fault networ
coefficients
hesis. En in
rn of the de
ght and dee
of the rhyth
tions in area
ands change
ANOVA for
ndependent
et beta-2,
d.
ly for the b
d p = 0.3672
ni correction
oefficients f
rk in the aw
obtained fo
nstead of a
efault netwo
ep sedation
hms of the
as of the net
es to a signif
r for the mi
variables).
(3 time) h
beta2 band
2; beta1 ban
n). The gra
for the alph
28
aking
or the
asking
ork in
n and
EEG
twork
ficant
idline
This
hence
(p =
nd p =
aphics
ha

Grap beta
Grap beta
phic 2. Boxa1 band thr
phic 3. Boxa2 band thr
xplot of therough the f
xplot of therough the f
e variation four studie
e variation four studie
Beta1 band
of the corred condition
Beta2 band
of the corred condition
d
relations cons
d
relations cons
oefficients
oefficients
for the
for the
29
30
V. DISCUSSION
The aim of this work was to determine the relationship between the brain electrical
activity and areas that make up the brain's default mode network, using simultaneous
recording of EEG activity with fMRI identification of brain areas belonging to that
network. To accomplish this, we obtained the time course of the spectral power for each
EEG band, which was then convolved with the fMRI hemodynamic response to
calculate the correlation coefficient between the two signals. Analyses performed did
not support our hypothesis of a relationship between a particular type of brain electrical
activity and the default mode network at rest.
1.- Possible explanatory factors
Three factors could partially explain these results:
1.1 The depth of the source signal that is intended to measure. As noted, the structures
that make up the default network (mainly precuneus, posterior cingulated cortex and
dorsomedial prefrontal cortex) are deep structures of the midline whose electric fields
are largely tangential to the recording electrodes, which affects the registration of its
electrical signal, much weaker than for other cortical structures.
In this study, we try to improve the spatial resolution and reduce the number of
electrical signals and also noise from other areas, taking groups of electrodes in the
scalp surface, roughly corresponding to the location in depth of the structures of the
default network. It should be noted that higher correlations were obtained in just one of
these groups of electrodes (centro-parietal) and the lowest in general corresponded to
those recorded in the midline electrodes.
1.2 Another factor could be that, in this study, was carried out the correlation with the
default network as a whole and not in separate areas. In other studies which have found
significant associations of a rhythm, mainly alpha, in the resting state with some
especific brain areas , (Moonann et al., 2003; Goldman et al.2002) these associations
have not been made with respect specifically to the default mode network (as has been
done in this study) but with any area in the brain showing an activation correlated to
that particular rhythm. We have followed the work of Mantini (Mantini et al.(2007),
who have searched the correlation directly with the default network, but they have also
obtained very low correlation values (between 0.03 and 0.28 for the highest).

31
1.3 Inter-subjects variability: the results also show a high variability of inter and intra-
subject correlations coefficients. In 2006, Gonçalvez et al. have described this large
inter-subject variability in brain rhythms having found, in seven subjects studied,
negative and positive correlations for the same rhythm (alpha) in different brain areas
and even in the same area they found different correlations among the patients. In our
results, we observed a large inter and intra-subject variability, with correlation
coefficients of opposite sign among different subjects for the same frequency band in
the same area, which might partially explain the lack of identification of a specific
pattern.
As noted by Lauf et al., (2008), the neural and hemodynamic oscillations recorded at
rest via surface EEG and BOLD fMRI are often only indirectly linked, because both
signals are generated differently and exhibit different temporo-spatial properties, so , in
an stable experimental context, , their overlap is further influenced by the brain state, or
context, in which they are acquired.
In this regard, the conditions for acquisition of data in this study were very different
from other similar studies (Mantini et al., 2007); in which subjects are generally asked
simply to remain relaxed in the scan, with eyes closed with any other auditory or visual
stimulation. The subjects in the present study were evaluated in the context of
preparation for anesthesia, and the total duration of their participation was extended for
several hours. From this point of view, this may account also the different results.
2. The evaluation of the default network in altered states of consciousness
The results in the four conditions tested (wakefulness, light sedation, deep sedation and
recovery), showed: in the wakefulness condition, a predominance of slow rhythms
(theta and delta) in all locations and low alpha activity (which is the marker rhythm of
wakefulness) was observed. As theta activity is prominent in the earliest stages of sleep,
but has also been associated with cognitive processes that require the use of attentional
or short-term memory (Sheringe et al., 2008) , it could be hypothesized that subjects in
this first phase, were not in the resting state as defined for the default mode network, but
rather engaged in tasks of attention or just sleepy (the latter also supported by the
presence of delta activity. On the other hand, during the recovering phase after sedation,
a clear prominence of alpha activity in all locations and very few slow activity can be
seen, which is in line with normal brain activity in awake.

32
In the analysis of rhythms variation during the stages of sedation, the most interesting
observation is the prominence of negative correlations starting from the stadium of light
sedation for all frequency bands in almost all locations (except for beta1 in central –
parietal and midline; beta2 in frontal and delta in the midline location), which are
maintained in the stage of deep sedation (unconsciousness), but noting further the
presence of positive correlations for the delta band in all locations (except central-
parietal) and a slight variation, significant from the statistical point of view, of beta2
band through the four conditions.
Previous studies show the persistence of default network connectivity in stages of light
sedation (Greicius et al., 2008; Horovitz et al., 2008) but decreased focal points at the
posterior cingulate cortex in this condition (Greicius et al., 2008). However, there are
no studies of the association of EEG rhythms and the default network during sedation.
In the present study, low values of correlation coefficients do not allow statements
about trends (for the variations are slightly different from zero). In this case, we
consider that a larger number of subjects might have been possible to ascertain whether
this variability of rhythms in the default network through the four levels of
consciousness studied is significant. This variability is, indeed, a normal finding in
normal EEG records, however, in this study, the relationship or the association of this
variation with the default network has shown be practically nonexistent.
3. Considerations about the method used
Among the technical aspects to be considered, and that may have influenced the
whole results, we analyze the conditions identified by Lauf as necessaries for success
in this type of study (Lauf et al 2008): 1) equal length of the sessions: in our case, 12
subjects had records during 8 minutes and 9 subjects during 14 minutes in each state,
and in the final analysis, seven of the eight records were during eight minutes and only
one had a duration of fourteen minutes; 2) consistent spatial coverage: we use a 32-
channel EEG with 60 electrodes on the scalp); 3) a proper reduction of GRA and PRA
artifacts: in this regard, it is noteworthy that in discarded records, about half had a
significant persistence of artifacts GRA, especially in sedation, which was significantly
influenced by the movements of the patients during these conditions (mainly snoring)
since the presence of motion artifacts also affect the execution of the algorithm for the
elimination of other types of artifacts; 4) enough smoothering of fMRI date; 5) a

33
consistent approach to derive the regressors based on EEG: in this regard, various
methods existent, without finding a clear advantage of one over the other. For example,
for the calculation of the regressor, the EEG signal can be used as the independent
variable and the BOLD signal as the dependent variable, but it can be reversed or also it
is possible the fusion of data using all as the dependent and independent variable at the
same time (Lauf, 2008). 6) Finally, the choice of montages and references, which can
determine the collection of more local or global properties of the EEG. We have
mentioned that, we tried to improve this choosing a greater amount of electrodes and
closer to the regions of interest .
We may finally wonder, given the amount of different cognitive functions in which
have been implicated brain areas which belongs to the default network, if we can set a
pattern "fixed" or "stable" of electrical activity in this network, which has, indeed, a
dynamic behavior. The presence of excessive theta activity in waking initial registration,
makes us wonder if, despite being physically at rest, the subjects were in a state
fluctuating between the rest and the mental activity. As mentioned, the conditions of the
study required a close and careful cooperation of the patient, which may simply have
turned off the default network at this early stage to other areas devoted to attention. In
this regard, Lauf et al., (2006), have proposed a theory of the brain function from the
resting state, based on a study in which they found two patterns of brain activity to
which the brain can move from a basal alpha activity: an occipito-parietal pattern
associated to an increase in theta activity and a fronto-parietal pattern associated with
increased beta activity. It should be noted that the regions identified in this study not
showed the characteristics of areas of the default mode network, however, is an
illustration of the presence of mental processes that may be normal fluctuations of
activity in a brain that we say is "at rest".
34
VI. CONCLUSIONS AND PERSPECTIVES
The work did not allow the identification of a particular EEG pattern associated with the
default network in the resting state using the simultaneous EEG/fMRI recording.
Nevertheless, we believe that improvements are possible in the protocol that would
achieve this goal in a second phase of the project.
In general terms, we must try to improve the factors cited by Lauf et al.(2006) to
increase the chances of obtaining conclusive results. It is necessary, in principle, to
increase the number of available subjects for analysis (this is especially critical for the
realization of the comparison between the four conditions of wakefulness and sedation).
In this regard, the EEG tracings retreat to eliminate as many artifacts as possible is the
first step to follow. This will be done with a new version -in preparation- of the
algorithm for the cICA method.
We also need a better model for the correlation between the two signals (EEG / BOLD).
Having found no variations for the frequency bands separately, we propose to assess the
whole spectrum variation, to see if the whole EEG activity correlates with the activity of
the default network. We think that it could also help circumvent the inter-subject
variability.
Finally, despite the many technical aspects to care, the study of electroencephalographic
activity in combination with functional magnetic resonance imaging, offers the
advantage of complementary evaluation of different aspects of brain function allowing
real time assessment of cognitive events (EEG) and spatial location (fMRI). The study
of the foundations of consciousness, both cognitive and neurobiological level, has
benefited greatly from this practice and we are confident we can correct the factors that
allow optimal application of the neurophysiologic techniques such as EEG to his best
knowledge.

35
BIBLIOGRAPHY
Allen, P.J., Polizzi, G., Krakow, K., Fish, D.R., & Lemieux, L.,1998. Identification of EEG events in the MR scanner: the problem of pulse artifact and a method for its subtraction. Neuroimage, 8 (3), 229–239.
Allen, P.J., Josephs, O., Turner, R., 2000. A method for removing imaging artifact from continuous EEG recorded during functional MRI. Neuroimage, 12 (2), 230–239
Boly M, Philips C, Tshibanda L, Vanhaudenhuyse A, Schabus M, Dang-Vu T.T., Moonen G, Hustinix R, Maquet P and Laureys S. (2008). Intrinsic Brain Activity in Altered States of Consciousness: How Conscious Is the Default Mode of Brain Function? Ann. N.Y. Acad. Sci, 1129, 119-129.
Boly M, Tshibanda L, Noirhomme Q, Vanhaudenhuyse, A., Schnakers C, Ledoux D, Boveroux P, Garweg C, Lambermont B, Philips C, Luxen A, Bassetti C, Maquet P, Laureys S. (2009). Functional connectivity in the default network during resting state is preserved in a vegetative but not in a brain dead patient. Hum Brain Mapp, 30, 2393-2400 .
Boveroux, P., Vanhaudenhuyse, A., Lauwick, S., Bruno, M-A., Noihomme, Q., Faymonville, M-E., Lamy, M., Moonen, G., Luxen, A., Deguldre, C., Plenevaux, A;, Schnakers, C., Phillips, C., Brichant, J-F., Bonhomme, V., Maquet, P., Greicius, M., Laureys, S., & Boly, M. (soumis) Within- and between-networks resting state fMRI connectivity reflects the level of consciousness during anesthesia.
Birn, R.M., Murphy, K., & Bandettini, P.A. (2008). The effect of respiration variations on independent component analysis results of resting state functional connectivity. Hum Brain Mapp, 29, 740-750
Bryson, H.M., Fulton, B.R., & Faulds, D. (1995). Propofol: an Update of its Use in Anaesthesia and Conscious Sedation. Drugs, 50(3),513-559.
Buckner, R.L, Andrews-Hanna, J.R, Schacter, D.L. (2008) The brain's default network: anatomy, function and relevance to disease. Ann N Y Acad Sci, 11, 1-38.
Cavanna A.E., Trimble, M.R. (2006) The precuneus: a review of its functional anatomy and behavioural correlates. Brain, 129, 564-583.
Chen, A., Feng, W., Zhao, H., Yin, Y., & Wang, P. (2008). EEG default mode network in the humain brain: Spectral regional field powers. Neuroimage, 41, 561- 574.
Damoiseaux J.S., Rombouts, S.A., Barkohof F., Scheltemns P, Stam C, Smith SM, Beckman C.F. (2006) Consistent resting-state networks across healthy subjets. Proc Natl Acad Sci U S A, 103(7), 13848-13853.
De Luca, M., Beckman, C.F., De Stefano, N., Matthews, P.M., & Smith, S.M. (2006). fMRI resting state networks define distinct modes of long-distance interactions in the human brain. Neuroimage, 29, 1359-1367.
Esposito, F., Aragri, A., Pesaresi, I., Cirillo, S., Tedeschi, G., Marciano, E., Goebel, R.,& Di Salle, F. (2008). Independent component model of the default-mode brain function: combining individual-level and population-level analyses in resting state fMRI. Magn Reson Imaging, 26, 905-913.

36
Formisano, E., Esposito, F., Di Salle, F.,& Goebel, R. (2004). Cortex-based independent component analysis of fMRI time series. Magn Reson Imaging, 22, 1493-1504.
Fox, M.D., Raichle, M.E. (2007). Spontaneous fluctuations in brain activity observed with functional magnetic resonance imaging. Nat Rev Neurosci, 8, 700-711
Fox, MD., Snyder, A., Vincent, J.L., Corbetta, M., Van Essen, D.C., & Raichle, M.E. (2005). The human brain is intrinsically organized into dynamic, anticorrelated functional networks. Proc Acad Sci USA, 102, 9673-9678.
Giacino, J.T., Ashwal, S., Childs, N., Cranford, R., Jennett, B., Katz, D.L., Kelly, J.P., Rosenberg, J.H., Whyte, J., Zafonte, R.D., & Zasler, N.D. (2002). The minimally conscious state: definition and diagnostic criteria. Neurology, 58, 349–353.
Goldman, R.I., Stern, J.M., Engel, J., & Cohen, M.S. (2002). Simultaneous EEG and fMRI of the alpha rhythm. NeuroReport, 13(1820), 2487-2492.
Gonçalves, S.I., de Munck, J.C., Pouwels P.J.W., Schoonhoven, R., Kuijer, J.P.A., Maurits, N.M., Hoogduin, J.M., Van Someren, E.J.W., Heethaar R.M., & Lopes da Silva F.H. (2006). Correlating the alpha rhythm to BOLD using simultaneous EEG/fMRI: Inter-subject variability. NeuroImage,30,203-13.
Greicius M.D., Krasnow, B., Reiss, A.L., & Menon, V. (2003). Functional connectivity in the resting brain: a network analysis of the default mode hpothesis. Proc Natl Acad Sci U S A, 100, 253-258.
Greicius, M.D., Srivastava, G Reiss, A.L., and Menon, V. (2004). Default-mode network activity distiguishes Alzheimer's disease from healthy aging: Evidence from funcional MRI. PNAS, 101(13), 4637-42.
Greicius, M.D., Kiviniemi, V., Tervonen O, Vainionpaa V, Alahuhta S, Reiss A.L., and Menon, V. (2008). Persistent default-mode network connectivity during light sedation. Hum Brain Mapp, 29(7), 839-847 .
Hyvarinen, A., Karhunen, J., & Oja, E. (2001) Independent Component Analysis.
Horovitz, S.G., Fukunaga, M., de Zwart, J.A., van Gelderen, P., Fulton, S., Balkin, T., & Duyn, J.H. (2008). Low Frequency BOLD Fluctuations During Wakefulness and Light Sleep: A Simultaneous EEG-fMRI Study. Hum Brain Mapp, 29, 671-682.
Kiebel, S.J., Tallon-Baudry, C., ans Friston, K.J. (2005). Parametric Analysus of Osicllatory Activity as Measured With EEG/MEG. Hum Brain Mapp, 26, 170-177.
Laufs, H., Kleinschmidt, A., Beyerle, A., Eger, E., Salek-Haddadi, A., Preibisch, C., & Krokowa, K. (2003a). EEG-correalted fMRI of human alpha activity. NeuroImage, 19, 1463-76.
Lauf, H., Krakow, K., Sterzer, P., Eger, E., Beyerle, A., Salek-Haddadi, A., and Kleinschmidt, A. (2003b). Electroencephalographic signatures of attentional and cognitive default modes in spontaneous brain activity fluctuations at rest. PNAS, 100(19), 11053-11058.
Lauf, H., Holt, J.L., Elfont, R., Krams, M., Paul, J.S., Krakow, K., & Kleinschmidt, A. (2006). Where the BOLD signal goes when alpha EEG leaves. NeuroImage, 31, 1408-18. Lauf, H. Endogenous Brain Oscillations and Related Networks

37
Detected by Surface EEG-Combined fMRI. (2008). Hum Brain Mapp, 29, 762-69.
Laureys, S., Famoville, M.E., De Tiège, X., Peigneux, P., Berré, J., Moonen, G., Goldman, S., and Maquet, P. (2004). Brain function in the vegetative state. Advances in Experimental Medicine and Biology, 550, 229-38.
Laureys S. (2005). The neural correlates of (un)awareness: lessons from the vegetative state. Trends Cogn Sci, 9, 556-559.
Laureys, S., Pellas, F., Van Eeckhout, P., Ghorbel, S., Schnarkers, C., Perrin, F., Berré, J., Faymonville, M.E., Pantke, K-H., Damas, F., Lamy, M., Moonen, G., and Goldman, S. (2005). The locked-in syndrome: what is it like to be conscious but paralysed and voiceless?. Progress in Brain Research, 150, 495-511.
Laureys, S., Boly, M., Moonen, G., and Maquet, P. (2009). Coma. Encyclopedia of Neurosciences, 2, 1133-1142.
Leclerq, I., Balteau, E., Dang-VU, T., Schabus, M., Luxen, A., Maquet, P., & Phillips, C.(2009). Rejection of pulse related artefact (PRA) from continous electroencephalographic (EEG) time series recorded during functional magnetic resonance imaging (fMRI) using constraint independent component analysis (cICA). NeuroImage, 44, 679-691.
McKeown, M.J., Makeig, S., Brown, G.G., Jung, T.P., Kindermann, S.S., Bell, A.J., & Sejnowski, T.J. (1998). Analysis of fMRI data by blind separation into independent spatial components. Hum Brain Mapp, 6, 160-188.
Mantini D, Perrucci M.G., Del Gratta C., Romani G.L. and Corbetta M. (2007). Electrophysiological signatures of resting state networks in the human brain. PNAS, 104(32), 13170-13175 .
Mason, M.F., Norton, M.I., Van Horn, J.D., Wegner, D.M., Grafton, S.T. and Macrae, C.N.(2007). Wandering Minds: The Default Network and Stimulus- Independent Thought. Science, 315, 393-95.
Mazoyer, B., Zago, L., Mellet, E., Bricogne, S., Etard, O., Houdé, O., Crivello, F., Joliot, M., Petit, L. and Tzourio-Mazoyer, N. (2001). Cortical networks for working memory and executive functions sustain the conscious resting state in man. Brain Research Bulletin, 54(3), 287-298.
Moosmann, M., Ritter, P., Krastel, I., Brink, A., Thees, S., Blankenburg, F., Taskin, B., Obrig, H., & Villringer, A. (2003). Correlates of alpha rhythm in functional magnetic esonance imaging and near infrared spectroscopy. NeuroImage, 20, 145-158.
Murphy, K., Birn, R.M., Handwerker, D.A., Jones, T.B., & Bandettini, P.A.(2009). The impact of global signal regression on resting state correlations: are anti- correlated networks introduced? Neuroimage, 44, 893-905.
Nunez, P.L., Wingeier, B.M., & Silberstein, R.B. (2001). Spatial-Temporal Structures of Human Alpha Rhythms: Theory, Microcurrent Sources, Multiscale Measurements, and Global Binding of Local Networks. Human Brain Mapp, 13, 125-164.

38
Otti, A., Guendel, H., Läer, L., Wohlschlaeger, A.M., Lane, R.D., Decety, J., Zimmer, C., Henningsen, P. and Noll-Hussong, M. (in press). I Know the pain you feel – how the human brain’s default mode predicts our resonance to another’s suffering. Neuroscience (2010), doi: 10.1016/j.neuroscience.2010.04.072.
Perlbarg, V., Bellec, P., Anton, J.L., Pelegrini-Issac, M., Doyon, J.,& Benali, H. (2007). CORSICA: correction of structured noise in fMRI by automatic identification of ICA components. Magn Reson Imaging, 25, 35-46.
Raichle, M.E., MacLeod, A.M., Snyder, A.Z., Powers, W.J, Gusnar, D.A. and Shulman, G.L. (2001). A default mode of brain function. PNAS, 98(2), 576-682 (*)(*)
Ramsay, M.A., Savege, T.M., Simpson, B.R., & Goodwin, R. (1974). Controlled sedation with alphaxalone-alphadolone. Br Med J, 2( 5920), 656-9.
Spreng, N.R., & Grady, C.L. (2009). Patterns of Brain Activity Supporting Autobiographical Memory, Prospection, and Theory of Mind, and Their Relationship to the Default Mode Network. Journal of Cognitive Neuroscience, 22(6), 1112-1123.
Scheeringa, R., Bastiaansen, M., Peterson, K.M., Oostenveld, R., Norris, D.G., & Hagoort, P. (2008). Frontel theta activity correlates negatively with the default mode network in resting state. International Journal of Psychophysiology, 67, 242-251 .
Vanhaudenhuyse, A., Noirhomme, Q., Tshibandaa L, Bruno MA, Boveroux, P., Schnakers C, Soddu A, Papa M, Perlbarg V, Ledoux D, Brichant JF, Moonen G, Phillips C, Maquet P, Greicius M, Laureys S, Boly M (2010). Default Network connectivity reflects the level of consciousness in non-communicative brain- damaged patients. Brain, 133 (Pt1), 161-71.
Ylipaavalniemi, J., & Vilgario, R. (2008). Analyzing consistency of independent components: an fMTI illustration. Neuroimage, 39, 168-180.
Zed, P.J., Abu-Laban, R.B., Chan, W.W.Y., and Harrison, D.V. (2005). Efficacy, safety and patient satisfaction of propofol for procedural sedation and analgesia in the emergency department: a prospective study. CJEM-JCMU, 9(6), 421-427.
Zeman A. (1997). Persistent vegetative state. Lancet, 350, 795-799.
Zeman, A. (2001) Consciousness. Brain, 124, 1263-1289.
39
APPENDIX
APPENDIX 1: International System 10-20 for EEG electrodes and structures of the default network............................................................................................................................40
APPENDIX 2:
Outline of steps in order to obtain the correlation between the EEG signal and BOLD signal...............................................................................................................................41
APPENDIX 3:
Default Mode Network images as identified by ICA in the four states of consciousness evaluated ........................................................................................................................42 APPENDIX 4:
Correlation Coefficients .................................................................................................43
Correlation Coefficients for all the subjects in the:
Wakefulness Condition....................................................................................................xx
Correlation coefficients for all the subjects in the
sedation 1 condition.........................................................................................................xx
Correlation coefficients for all the subjects in the
sedation 2 condition........................................................................................................xx
Correlation coefficients for all the subjects in the
recovery condition ..........................................................................................................xx
APPENDIX 5:
T-test results for theta, alpha, beta1 and beta2 bands in all electrode locations during the wakefulness condition (Bonferroni correction applied).................................................51

40
APPENDIX 1: International System 10-20 for EEG electrodes and structures of
the default network
C
Schematic view of the distribution of electrodes in the international system l 10-20. A:
lateral view, B: top view. In this basic scheme may be added additional recording
electrodes, so, in our study were used FC3 yFC4 (located between F3-C3 yF4-4
respectively, CP3 and CP4, located between C3-C4-P3 and P4 respectively and added
also the midline electrodes Oz-FPz- AFz -CPz -POz. C: schematic view two of the
most important structures of the default network, the precuneus (and directly below the
posterior cingulate cortex), and its location with respect to the recording electrodes.
Left Right

41
APPENDIX 2: Outline of steps in order to obtain the correlation between the EEG signal and BOLD signal

42
APPENDIX 3: Default Mode Network images as identified by ICA in the four states of consciousness evaluated
(Soddu et al., in preparation)

43
APPENDIX 4: CORRELATION COEFFICIENTS
CORRELATION COEFFICIENTS FOR ALL THE SUBJECTS IN THE WAKEFULNESS CONDITION
CENT-PARIET LOCATION
Delta Theta Alpha Beta1 Beta2 Gamma
Subject 1 0.0840 0.1285 0.0801 0.0684 0.1621 0.1639 Subject 2 0.2154 0.3758 0.1312 0.1010 0.0951 0.0647 Subject 3 -0.0788 -0.0696 0.0293 0.0472 -0.0805 -0.0588 Subject 4 0.1930 0.2898 0.2219 0.0610 0.1807 -0.0511 Subject 5 0.1449 0.1623 0.0828 0.2931 0.3154 0.0921 Subject 6 -0.0272 -0.0214 -0.0301 0.1456 0.0975 0.1292 Subject 7 0.2463 0.4422 0.2896 0.3737 0.2760 0.2195 Subject 8 0.0500 -0.0818 -0.0358 0.0870 0.1744 0.0825
FRONTAL LOCATION
Delta Theta Alpha Beta1 Beta2 Gamma
Subject 1 0.0682 0.0795 0.0574 60.0439 0.0971 0.0598 Subject 2 0.2321 0.1610 0.2060 0.0796 0.0750 0.0841 Subject 3 -0.0596 0.0644 -0.1255 0.0595 -0.0303 0.0976 Subject 4 0.0641 0.1965 0.2570 0.0515 0.1670 0.0835 Subject 5 0.1115 0.0799 -0.1087 0.1501 0.0544 -0.1040 Subject 6 0.0952 -0.0643 -0.0535 0.1874 0.1088 0.1455 Subject 7 0.1620 0.1500 0.3192 0.1495 0.0427 -0.0328 Subject 8 0.0593 0.0185 0.0294 -0.0424 0.0541 -0.0979
OCCIPITAL LOCATION
Delta Theta Alpha Beta1 Beta2 Gamma
Subject 1 0.0451 -0.0622 -0.0719 -0.1849 -0.0307 -0.0906 Subject 2 0.0538 -0.0357 -0.0299 -0.0554 -0.1355 -0.0742 Subject 3 0.0949 0.0305 -0.0286 0.0564 0.0144 -0.0592 Subject 4 0.1086 0.0567 -0.0134 0.1385 0.1361 -0.0348 Subject 5 0.1365 0.0710 0.0325 0.1781 0.0821 0.0322 Subject 6 0.1739 0.1933 0.0370 -0.0696 0.0133 0.0444 Subject 7 0.2261 0.2178 0.1436 0.1917 -0.0502 0.1019 Subject 8 0.2726 0.3139 0.1702 -0.0567 0.0712 0.1774
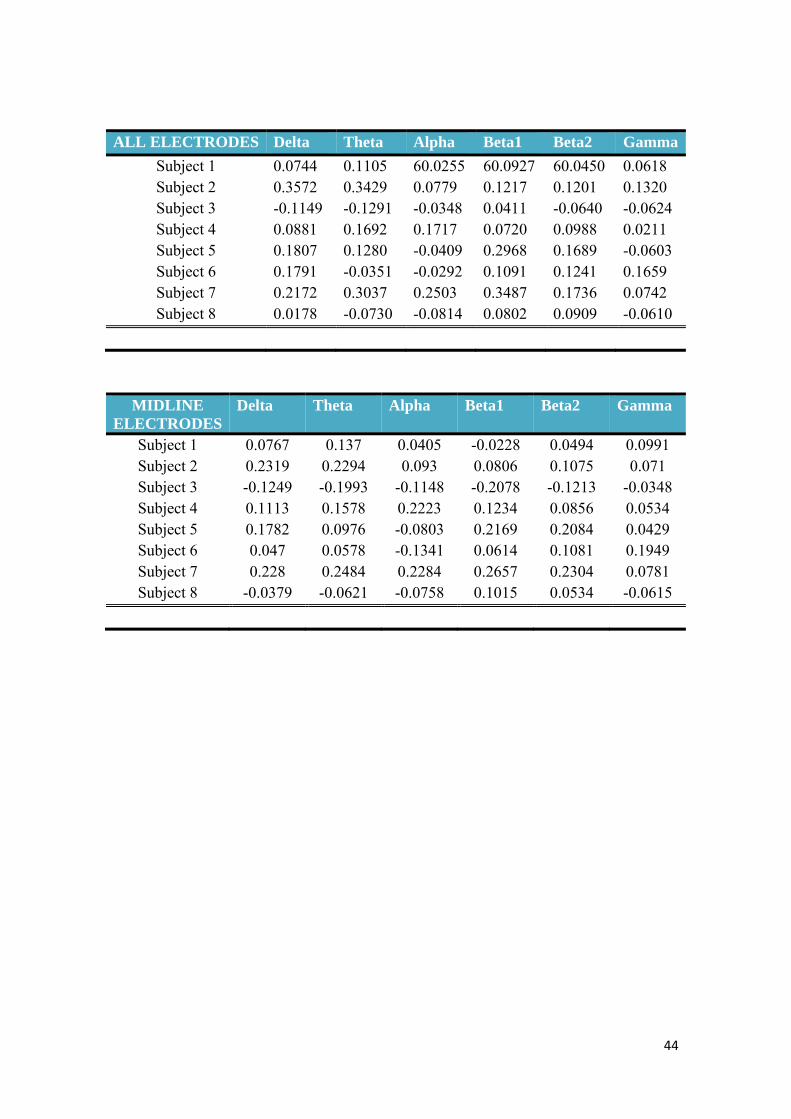
44
ALL ELECTRODES Delta Theta Alpha Beta1 Beta2 Gamma
Subject 1 0.0744 0.1105 60.0255 60.0927 60.0450 0.0618 Subject 2 0.3572 0.3429 0.0779 0.1217 0.1201 0.1320 Subject 3 -0.1149 -0.1291 -0.0348 0.0411 -0.0640 -0.0624 Subject 4 0.0881 0.1692 0.1717 0.0720 0.0988 0.0211 Subject 5 0.1807 0.1280 -0.0409 0.2968 0.1689 -0.0603 Subject 6 0.1791 -0.0351 -0.0292 0.1091 0.1241 0.1659 Subject 7 0.2172 0.3037 0.2503 0.3487 0.1736 0.0742 Subject 8 0.0178 -0.0730 -0.0814 0.0802 0.0909 -0.0610
MIDLINE ELECTRODES
Delta Theta Alpha Beta1 Beta2 Gamma
Subject 1 0.0767 0.137 0.0405 -0.0228 0.0494 0.0991 Subject 2 0.2319 0.2294 0.093 0.0806 0.1075 0.071 Subject 3 -0.1249 -0.1993 -0.1148 -0.2078 -0.1213 -0.0348 Subject 4 0.1113 0.1578 0.2223 0.1234 0.0856 0.0534 Subject 5 0.1782 0.0976 -0.0803 0.2169 0.2084 0.0429 Subject 6 0.047 0.0578 -0.1341 0.0614 0.1081 0.1949 Subject 7 0.228 0.2484 0.2284 0.2657 0.2304 0.0781 Subject 8 -0.0379 -0.0621 -0.0758 0.1015 0.0534 -0.0615

45
CORRELATION COEFFICIENTS FOR ALL THE SUBJECTS IN THE
SEDATION 1 CONDITION
OCCIPITAL ELECTRODES
Delta Theta Alpha Beta1 Beta2 Gamma
Subject 1 -0.0893 0.1130 -0.2047 -0.1404 -0.1784 -0.1048 Subject 2 0.1399 0.0918 -0.0062 0.0319 0.0952 0.1389 Subject 3 -0.0731 0.0332 0.0541 -0.0419 0.0513 -0.0338 Subject 4 0.1396 0.0949 0.0633 -0.0766 -0.0137 0.0386 Subject 5 -0.1607 -0.1757 -0.0459 -0.1035 -0.1002 -0.1851 Subject 6 -0.1509 -0.1079 -0.1216 -0.0724 -0.0563 -0.0851 Subject 7 -0.1037 -0.1603 -0.0729 -0.1776 -0.1427 0.0174 Subject 8 -0.0413 -0.0580 -0.0516 0.0522 -0.1550 -0.0421
CENT-PARIET ELECTRODES
Delta Theta Alpha Beta1 Beta2 Gamma
Subject 1 -0.1245 0.1691 -0.1324 -0.1202 -0.0979 0.0572 Subject 2 0.1677 0.0127 0.0387 -0.0204 0.0655 0.0589 Subject 3 -0.2153 -0.0173 0.0595 0.2362 0.1942 0.0821 Subject 4 0.1069 0.0808 0.0359 -0.0417 -0.1030 0.0132 Subject 5 -0.1623 -0.1486 0.1019 0.0854 -0.1075 -0.2323 Subject 6 -0.1798 -0.1474 -0.1466 -0.1196 -0.0162 -0.0509 Subject 7 -0.1860 -0.1731 -0.1093 0.1012 -0.1077 -0.655 Subject 8 0.0161 0.0310 0.1331 0.1407 -0.0858 -0.0343
FRONTAL ELECTRODES
Delta Theta Alpha Beta1 Beta2 Gamma
Subject 1 -0.1236 0.1098 -0.0849 -0.0756 0.1076 0.1203 Subject 2 0.1711 -0.0132 -0.0198 -0.0329 0.0596 0.0604 Subject 3 -0.2439 -0.0390 -0.1310 0.2233 0.2488 0.1612 Subject 4 0.0929 0.0793 0.0239 0.0250 -0.0886 -0.132 Subject 5 -0.2136 -0.2189 -0.1152 -0.0978 0.1623 -0.2999 Subject 6 0.1818 0.1760 0.1243 0.1647 0.335 0.0804 Subject 7 0.1612 0.2064 0.2415 0.1716 0.1240 0.1383 Subject 8 0.0679 0.0796 0.1035 0.1025 0.0854 0.0313

46
ALL ELECTRODES
Delta Theta Alpha Beta1 Beta2 Gamma
Subject 1 -0.0793 -0.0988 -0.1276 -0.0808 -0.1271 -0.0801 Subject 2 0.1390 0.0837 0.0904 0.0737 0.0562 0.0576 Subject 3 -0.3013 -0.0077 0.0881 0.1536 0.0498 -0.0221 Subject 4 0.0774 0.0584 0.0572 -0.0496 -0.1050 -0.0129 Subject 5 -0.1841 -0.1642 0.0153 0.0839 0.0746 -0.2781 Subject 6 -0.1936 -0.1539 -0.0949 -0.1310 0.0075 -0.0765 Subject 7 -0.2643 -0.2360 -0.1856 -0.1430 -0.1161 -0.1703 Subject 8 0.0771 -0.1007 0.0664 -0.0704 -0.0866 -0.0484
MIDLINE ELECTRODES
Delta Theta Alpha Beta1 Beta2 Gamma
Subject 1 -0.1031 -0.0833 -0.1598 -0.0687 -0.1389 -0.1238 Subject 2 0.0723 0.091 0.0945 0.0693 0.0368 0.0467 Subject 3 -0.0270 -0.0158 0.0751 0.0722 -0.0025 -0.0315 Subject 4 0.1172 0.1346 0.1622 0.0893 0.0499 0.0327 Subject 5 -0.1403 -0.1029 0.0802 0.1214 -0.0703 -0.232 Subject 6 -0.2112 -0.152 -0.086 -0.0779 0.0237 -0.0364 Subject 7 0.2665 -0.235 -0.2099 -0.1328 -0.1128 -0.165 Subject 8 0.1091 -0.0572 0.0342 -0.0134 -0.0826 -0.0614

47
CORRELATION COEFFICIENTS FOR ALL THE SUBJECTS IN THE SEDATION 2 CONDITION
OCCIPITAL ELECTRODES
Delta Theta Alpha Beta1 Beta2 Gamma
Subject 1 0.1229 -0.1561 -0.1510 -0.2431 -0.1247 -0.0583 Subject 2 0.1842 0.1330 0.0144 -0.1937 -0.0514 0.2128 Subject 3 0.0878 0.0444 0.0417 0.0599 -0.656 0.0539 Subject 4 -0.1469 -0.1624 -0.0390 -0.1528 -0.3553 -0.2395 Subject 5 -0.1541 -0.0813 -0.1419 0.0400 0.0788 -0.0689 Subject 6 -0.1004 -0.1763 -0.0864 -0.0239 0.0560 -0.0481 Subject 7 0.1465 -0.0150 -0.1349 -0.2073 -0.1346 0.3095 Subject 8 0.1426 0.0788 -0.1048 -0.0272 0.0841 0.0159
CENT-PARIET ELECTRODES
Delta Theta Alpha Beta1 Beta2 Gamma
Subject 1 -0.1132 -0.1598 -0.2831 -0.3856 -0.2259 -0.0632 Subject 2 -0.1177 -0.0186 -0.0659 -0.0620 -0.0899 -0.0883 Subject 3 0.0778 0.0651 0.0746 0.1034 -0.1388 0.0696 Subject 4 0.1695 -0.1074 0.0602 -0.1029 -0.2897 -0.1958 Subject 5 -0.1484 -0.0808 -0.2404 0.0873 0.1683 0.0514 Subject 6 -0.1838 -0.1766 -0.0610 -0.1287 -0.0041 0.0257 Subject 7 0.0835 0.0721 -0.1130 -0.3403 -0.2299 0.2340 Subject 8 0.1965 -0.0458 -0.1233 0.0389 -0.0613 0.0827
FRONTAL ELECTRODES
Delta Theta Alpha Beta1 Beta2 Gamma
Subject 1 0.1134 -0.0813 -0.1904 -0.3091 -0.3138 -0.1036 Subject 2 0.1451 0.0619 0.0495 0.0932 0.1883 0.1695 Subject 3 0.0877 -0.0332 0.0416 0.0674 -0.0899 -0.0598 Subject 4 0.0392 -0.0567 -0.0832 -0.2177 -0.3215 -0.1989 Subject 5 -0.0313 -0.0426 -0.1091 0.1177 0.1446 0.0769 Subject 6 -0.0893 -0.1629 -0.1086 -0.0840 -0.0328 0.0308 Subject 7 0.1893 0.1619 0.1905 0.2948 0.1833 0.1391 Subject 8 0.1099 0.1312 0.1935 0.0999 0.0676 0.0706

48
ALL ELECTRODES
Delta Theta Alpha Beta1 Beta2 Gamma
Subject 1 0.0492 -0.1109 -0.2214 -0.3091 -0.3016 -0.1373 Subject 2 0.1468 0.1977 0.0193 0.0621 0.1710 0.2079 Subject 3 0.0992 0.0444 0.0452 0.0325 -0.0978 -0.0623 Subject 4 0.1102 -0.1092 -0.0265 -0.2021 -0.3225 -0.2148 Subject 5 -0.0899 -0.0632 -0.0822 0.1826 0.1877 0.0799 Subject 6 -0.0444 -0.1754 -0.0289 -0.0954 -0.0546 -0.0186 Subject 7 0.1565 0.511 -0.2935 -0.4505 -0.2641 0.2656 Subject 8 0.1797 0.0263 -0.2011 -0.1139 -0.0712 0.0494
MIDLINE ELECTRODES
Delta Theta Alpha Beta1 Beta2 Gamma
Subject 1 0.0708 -0.1294 -0.1598 -0.3576 -0.2513 -0.0922 Subject 2 -0.0566 0.0486 0.0611 0.038 0.0312 0.1284 Subject 3 0.0957 -0.0589 0.0104 -0.0444 -0.1019 -0.0077 Subject 4 0.2609 0.0712 0.1101 -0.1078 -0.0334 -0.2131 Subject 5 -0.1335 -0.1013 0.0862 0.2127 0.227 0.0841 Subject 6 -0.0591 -0.1209 0.0546 0.0898 -0.124 0.0603 Subject 7 0.1954 0.0332 -0.3716 -0.5343 -0.2933 0.1541 Subject 8 -0.1157 -0.0535 -0.1632 -0.4341 -0.2125 0.1399

49
CORRELATION COEFFICIENTS FOR ALL THE SUBJECTS IN THE RECOVERY CONDITION
OCCIPITAL ELECTRODES
Delta Theta Alpha Beta1 Beta2 Gamma
Subject 1 -0.1868 -0.0091 0.2078 0.1092 0.1210 -0.1016 Subject 2 -0.0514 0.1215 0.3836 0.2685 0.1291 0.1879 Subject 3 0.0323 0.0783 0.3359 0.0871 -0.0572 -0.0924 Subject 4 0.0694 0.0591 0.1519 0.0125 0.0980 -0.1176 Subject 5 -0.1110 -0.1181 -0.1557 0.0435 0.0267 -0.0770 Subject 6 0.0896 -0.0802 -0.2016 -0.0265 -0.0707 0.0844 Subject 7 -0.1620 0.1093 -0.0615 0.0621 0.0457 -0.0689 Subject 8 -0.0196 -0.1297 -0.1556 -0.1739 -0.0859 0.0182
CENT-PARIET ELECTRODES
Delta Theta Alpha Beta1 Beta2 Gamma
Subject 1 -0.1817 -0.1405 0.1503 -0.0900 0.0945 -0.1159 Subject 2 0.0405 0.0411 0.3853 -0.0591 -0.1582 -0.0944 Subject 3 0.1681 0.1911 0.3514 0.0423 0.0405 -0.0940 Subject 4 -0.0798 -0.0587 0.1402 0.0470 -0.0450 -0.1710 Subject 5 0.0278 0.0827 0.1888 0.2323 0.1065 -0.0761 Subject 6 0.0316 -0.1349 -0.2657 -0.2240 -0.1740 0.1571 Subject 7 0.0260 0.2232 0.0593 -0.0199 -0.0706 0.1020 Subject 8 0.0239 0.0223 -0.0507 -0.1607 -0.2342 -0.0689
FRONTAL ELECTRODES
Delta Theta Alpha Beta1 Beta2 Gamma
Subject 1 -0.1599 -0.1443 0.0277 -0.0649 -0.0850 -0.1281 Subject 2 0.0168 0.0286 0.1328 -0.0888 -0.1709 -0.0913 Subject 3 -0.0691 0.1525 0.2056 0.0724 -0.0376 0.0375 Subject 4 -0.0607 -0.0915 -0.0698 -0.1496 -0.1231 -0.1337 Subject 5 0.0882 -0.1517 -0.0314 -0.0362 -0.0660 -0.1154 Subject 6 0.0979 0.0854 -0.0667 0.0454 0.0203 0.1977 Subject 7 -0.2050 -0.0820 0.0977 0.0952 -0.1682 -0.0877 Subject 8 0.0947 0.0727 0.0697 0.0384 0.1101 0.0996

50
ALL ELECTRODES
Delta Theta Alpha Beta1 Beta2 Gamma
Subject 1 -0.1595 -0.1078 0.3633 -0.0940 0.0470 -0.1130 Subject 2 0.1283 0.1178 0.3486 -0.0541 -0.2145 -0.0964 Subject 3 0.0671 0.1327 0.4041 0.1896 0.0691 -0.0870 Subject 4 -0.0356 -0.0325 0.1336 -0.1148 -0.0495 -0.1155 Subject 5 0.0187 -0.0841 0.1934 0.1846 0.1584 -0.0826 Subject 6 0.0594 -0.1127 -0.2536 0.0540 0.0706 0.1893 Subject 7 -0.0877 0.0467 -0.0435 0.0421 -0.1080 0.0635 Subject 8 0.0792 0.0139 -0.0612 -0.1218 -0.0911 0.1093
MIDLINE ELECTRODES
Delta Theta Alpha Beta1 Beta2 Gamma
Subject 1 -0.1882 -0.1043 0.3088 -0.0746 -0.0673 -0.1265 Subject 2 0.0187 0.147 0.3655 0.1876 -0.1075 -0.0746 Subject 3 -0.1061 0.1595 0.191 0.1403 0.0699 0.0272 Subject 4 0.0363 -0.0317 0.0503 0.0545 0.1209 -0.172 Subject 5 0.155 0.0934 0.181 0.2732 0.0833 -0.1672 Subject 6 0.0421 -0.1623 -0.2814 0.0695 -0.0392 0.1401 Subject 7 -0.076 -0.0692 -0.0405 -0.0179 -0.0253 -0.0456 Subject 8 0.0712 0.0023 -0.0404 -0.0758 -0.1527 0.0877

51
APPENDIX 5. t-test results for theta, alpha, beta1 and beta2 bands in all electrode locations during the wakefulness condition (Bonferroni correction
applied)
Band Mean Std t Theta 0.153 0.202 0.0699Alpha 0.096 0.115 0.0500Beta1 0.147 0.120 0.0100Beta2 0.152 0.121 0.0094
Cent-Pariet
Band Mean Std t Theta 0.085 0.084 0.0237Alpha 0.072 0.170 0.2665Beta1 0.073 0.086 0.0466Beta2 0.071 0.057 0.0098
Frontal
Band Mean Std t Theta 0.098 0.131 0.0722Alpha 0.029 0.086 0.3582Beta1 0.024 0.136 0.6249Beta2 0.023 0.090 0.4913
Occipital
Band Mean Std t Theta 0.102 0.171 0.1367Alpha 0.036 0.118 0.4198Beta1 0.122 0.140 0.0440Beta2 0.083 0.090 0.0346
All
Band Mean Std t Theta 0.083 0.150 0.1617Alpha 0.022 0.146 0.6794Beta1 0.077 0.146 0.1777Beta2 0.090 0.108 0.0506
Midline

52
Acknowledgments
I want to thank all the Coma Science Group team for their welcome and support during
the realization of this work. Professor Laureys for allowing me to perform this stage in
their group, M Noirhomme for his supervision, constant presence and their valuable
advice in the realization of this work, Athene Demertzi for her help and for sharing her
joie de vivre with me, Didier Ledoux for his advice on statistical treatment of data,
Andrea Soddu for their valuable suggestions and discussions about the results, Camille
Chatelle who was always there to ease my work at times of surcharge and finally, to all
for making me so nice to spend some time in their company.