The Debug Perspective in Eclipse for Python A Reference ...pattis/common/handouts/... · The Debug...
13
1 The Debug Perspective in Eclipse for Python A Reference and Tutorial Overview Debugging is the process of locating the source of programming errors (often called bugs) and correcting them. Debuggers are software tools that programmers use to help in this process. Primarily, we use debuggers to control and monitor the execution of our scripts. Specifically, we can use a debugger to run a script selectively, stopping it at interesting locations and examining its state (the values that are stored in its variables, which are stored and modified as a script runs). In this way we can better understand how a script works —or more importantly, help pinpoint exactly where a script fails to work correctly as the first step towards determining what changes we must make to fix it. Thus the process of debugging involves both locating and correcting the source of programming errors. We can instruct a debugger to continually display the current values stored in all (or selected) variables; this process is called observing variables. Then, we can execute our script one line at a time (this process is called single stepping through a script). After each step, we can observe the new values stored in the variables. We can also use the debugger to automatically run the script with unconditional breakpoints set on lines of code, which instructs the debugger to stop the script when it is about to execute any breakpointed line; in addition, we can set a conditional breakpoint to also stop a script when it is about to execute a breakpointed line, but only when some specified condition (a bool expression) evaluates to True when that line is about to be executed. This document explains and demonstrates how to use the Eclipse Debug perspective. While reading this document, look for the symbol, which instructs you to practice the debugger commands that were just discussed. Debuggers are sophisticated tools with many subtle features. Although this document is only a brief introduction, designed for novices, it covers the rudiments of the most important and useful debugger commands. Finally, during the semester we will use the illustrative power of the Debug perspective to help us learn and understand new Python language features. Learn in haste; debug in leisure A debugger is an important tool that can save us lots of time. I estimate that for every hour that you spend learning about the Debug perspective or practicing using it, you will save at least 3 hours later in the quarter, when you are locating and correcting execution errors in your scripts. But debuggers are not a substitute for thinking. They help automate hand simulations, but they do not automate the inductive and deductive processes necessary to locate and fix bugs in a script. So do not be misled; when asked, “What is the most important tool for debugging?”; your answer should be “my brain”. Switching to the Eclipse Debug Perspective Before we can debug a script, we must open its project and ensure it is runnable (no detected errors or warnings on its Edit tab). Then we are ready to run and debug it. To follow along with this handout, first copy onto the desktop the collatz project (do it now), which accessible off the Sample Programs page; in the PyDev perspective, load it into Eclipse as an existing project. Actually, this script is correct: it contains no bugs. But, we will use this script to study the features of the Debug perspective. Before proceeding, please read the comments that describe this script; then, run it a few times, experimenting with it (supplying values to its prompts) and observing its output. We are now ready to switch to the Debug perspective. The button for this perspective, labeled Debug (preceded by a bug icon: see the left margin above) should appear on the top-right tab, next to the button labeled PyDev. If the Debug button is there, click it; if it is not there, you can put it there by clicking the Open Perspective button on the tab to the left of the PyDev button and selecting the Debug perspective (or by selecting Window | Open Perspective | Debug on the pull-down menu). The PyDev and Debug buttons can be reduced to only their icons by right-clicking on either button and unchecking the Show Text option. In the collatz project, click the Debug perspective button. You should see the Eclipse window change to the Debug perspective as illustrated below.
Transcript of The Debug Perspective in Eclipse for Python A Reference ...pattis/common/handouts/... · The Debug...
1
The Debug Perspective in Eclipse for Python A Reference and Tutorial
Overview Debugging is the process of locating the source of programming errors (often called bugs) and
correcting them. Debuggers are software tools that programmers use to help in this process. Primarily, we use debuggers to control and monitor the execution of our scripts. Specifically, we can use a debugger to run a script selectively, stopping it at interesting locations and examining its state (the values that are stored in its variables, which are stored and modified as a script runs). In this way we can better understand how a script works —or more importantly, help pinpoint exactly where a script fails to work correctly as the first step towards determining what changes we must make to fix it. Thus the process of debugging involves both locating and correcting the source of programming errors.
We can instruct a debugger to continually display the current values stored in all (or selected) variables; this process is called observing variables. Then, we can execute our script one line at a time (this process is called single stepping through a script). After each step, we can observe the new values stored in the variables. We can also use the debugger to automatically run the script with unconditional breakpoints set on lines of code, which instructs the debugger to stop the script when it is about to execute any breakpointed line; in addition, we can set a conditional breakpoint to also stop a script when it is about to execute a breakpointed line, but only when some specified condition (a bool expression) evaluates to True when that line is about to be executed.
This document explains and demonstrates how to use the Eclipse Debug perspective. While reading this document, look for the symbol, which instructs you to practice the debugger commands that were just discussed. Debuggers are sophisticated tools with many subtle features. Although this document is only a brief introduction, designed for novices, it covers the rudiments of the most important and useful debugger commands. Finally, during the semester we will use the illustrative power of the Debug perspective to help us learn and understand new Python language features.
Learn in haste; debug in leisure
A debugger is an important tool that can save us lots of time. I estimate that for every hour that you spend learning about the Debug perspective or practicing using it, you will save at least 3 hours later in the quarter, when you are locating and correcting execution errors in your scripts. But debuggers are not a substitute for thinking. They help automate hand simulations, but they do not automate the inductive and deductive processes necessary to locate and fix bugs in a script. So do not be misled; when asked, “What is the most important tool for debugging?”; your answer should be “my brain”.
Switching to the Eclipse Debug Perspective
Before we can debug a script, we must open its project and ensure it is runnable (no detected errors or warnings on its Edit tab). Then we are ready to run and debug it. To follow along with this handout, first copy onto the desktop the collatz project (do it now),
which accessible off the Sample Programs page; in the PyDev perspective, load it into Eclipse as an existing project. Actually, this script is correct: it contains no bugs. But, we will use this script to study the features of the Debug perspective. Before proceeding, please read the comments that describe this script; then, run it a few times, experimenting with it (supplying values to its prompts) and observing its output.
We are now ready to switch to the Debug perspective. The button for this perspective, labeled Debug (preceded by a bug icon: see the left margin above) should appear on the top-right tab, next to the button labeled PyDev. If the Debug button is there, click it; if it is not there, you can put it there by clicking the Open Perspective button on the tab to the left of the PyDev button and selecting the Debug perspective (or by selecting Window | Open Perspective | Debug on the pull-down menu). The PyDev and Debug buttons can be reduced to only their icons by right-clicking on either button and unchecking the Show Text option. In the collatz project, click the Debug perspective button. You should see the Eclipse window
change to the Debug perspective as illustrated below.
2
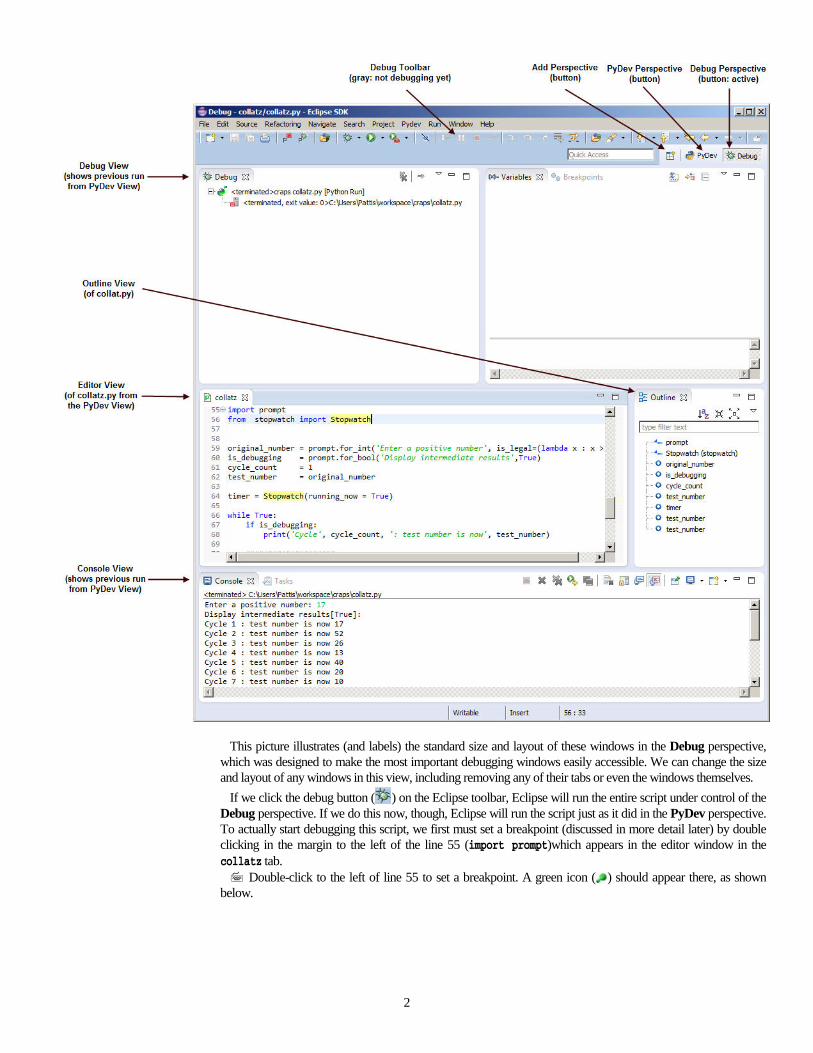
This picture illustrates (and labels) the standard size and layout of these windows in the Debug perspective,
which was designed to make the most important debugging windows easily accessible. We can change the size and layout of any windows in this view, including removing any of their tabs or even the windows themselves.
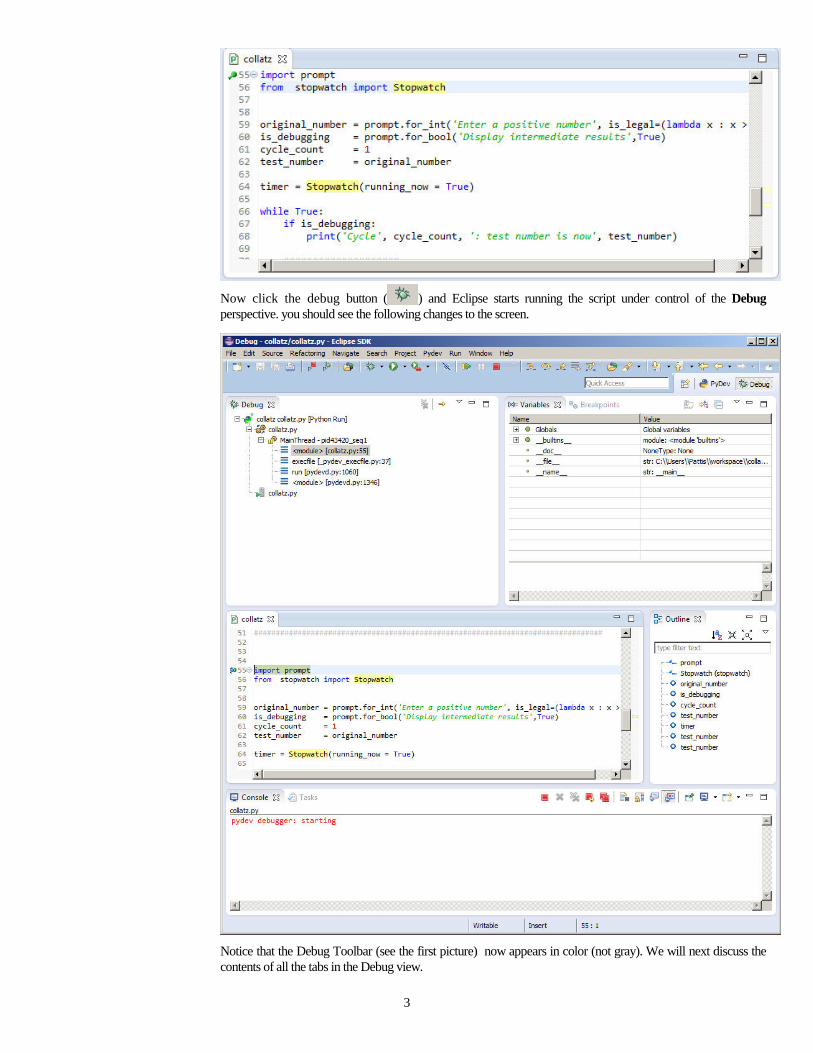
If we click the debug button ( ) on the Eclipse toolbar, Eclipse will run the entire script under control of the Debug perspective. If we do this now, though, Eclipse will run the script just as it did in the PyDev perspective. To actually start debugging this script, we first must set a breakpoint (discussed in more detail later) by double clicking in the margin to the left of the line 55 (import prompt)which appears in the editor window in the collatz tab. Double-click to the left of line 55 to set a breakpoint. A green icon ( ) should appear there, as shown
below.
3
Now click the debug button ( ) and Eclipse starts running the script under control of the Debug perspective. you should see the following changes to the screen.
Notice that the Debug Toolbar (see the first picture) now appears in color (not gray). We will next discuss the contents of all the tabs in the Debug view.
4
The Debug Tab
The window with the Debug tab contains a stack under MainThread - pid43420_seq1, listing all the modules (or functions) executing in a script. They go from the oldest (<module> [pydevd.py:1346], at the bottom) to the youngest (<module> [collatz.py:55]), the one currently executing (at the top). Generally, each module (or function) in the stack lists the line number (e.g., line 55) that the script is executing. The top method is special: its line number shows which line the script Python is about to execute (will execute next). In the picture above, collatz.py is the active module and it is about to execute line line 55. Notice that there is a green arrow in the collatz Editor tab, referring to the line on which we set the breakpoint: 55.
The Debug tab allows us to monitor module execution (and function calls). We can click any line in this stack: the name is then highlighted, a tab in the Editor view displays that module’s (or function’s) code, and the Variables tab (described below) displays the values of that modules (or function’s) variables. Later in the quarter, when we study how to write Python function, we will learn more about interpreting the information in the Debug tab (and more about the editor window and Variables tab, too).
Whenever we start to debug a script with a breakpoint on the first line, we will see one highlighted entry in the Debug tab, indicating the script we are running and the line number it is about to execute. In this picture, it refers to the collatz.py script which is about to execute line 55, shown in the collatz module/tab in the Editor view.
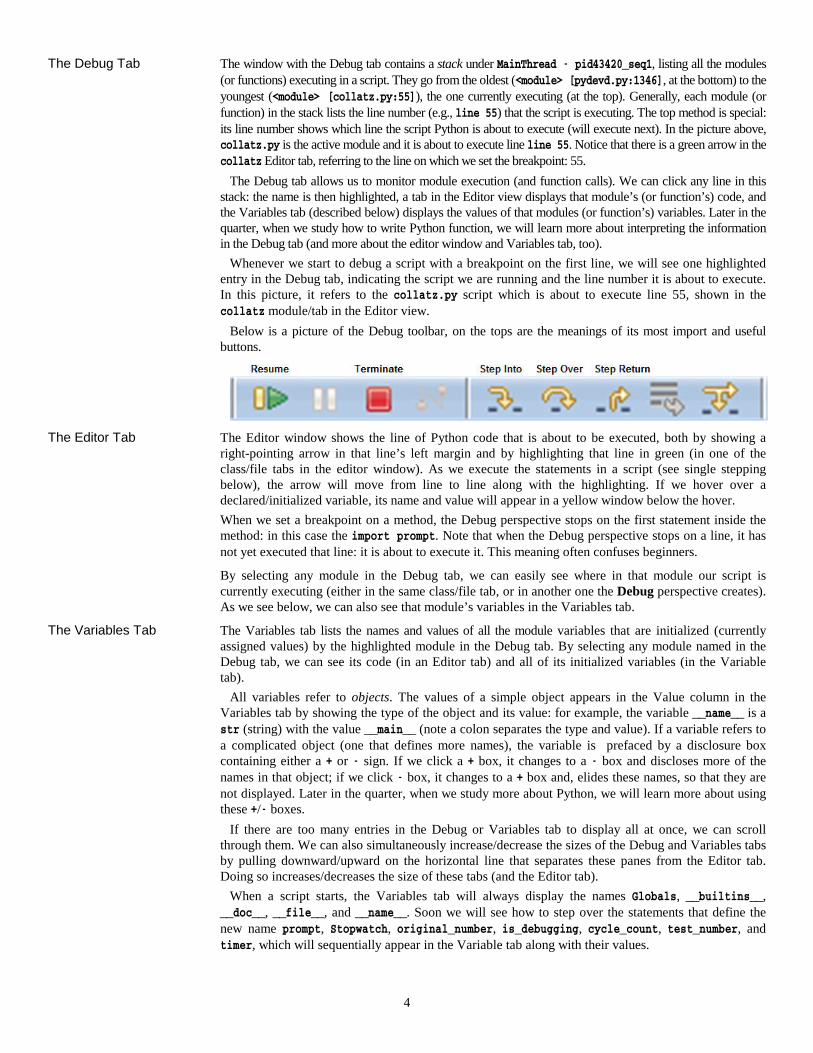
Below is a picture of the Debug toolbar, on the tops are the meanings of its most import and useful buttons.
The Editor Tab The Editor window shows the line of Python code that is about to be executed, both by showing a
right-pointing arrow in that line’s left margin and by highlighting that line in green (in one of the class/file tabs in the editor window). As we execute the statements in a script (see single stepping below), the arrow will move from line to line along with the highlighting. If we hover over a declared/initialized variable, its name and value will appear in a yellow window below the hover. When we set a breakpoint on a method, the Debug perspective stops on the first statement inside the method: in this case the import prompt. Note that when the Debug perspective stops on a line, it has not yet executed that line: it is about to execute it. This meaning often confuses beginners.
By selecting any module in the Debug tab, we can easily see where in that module our script is currently executing (either in the same class/file tab, or in another one the Debug perspective creates). As we see below, we can also see that module’s variables in the Variables tab.
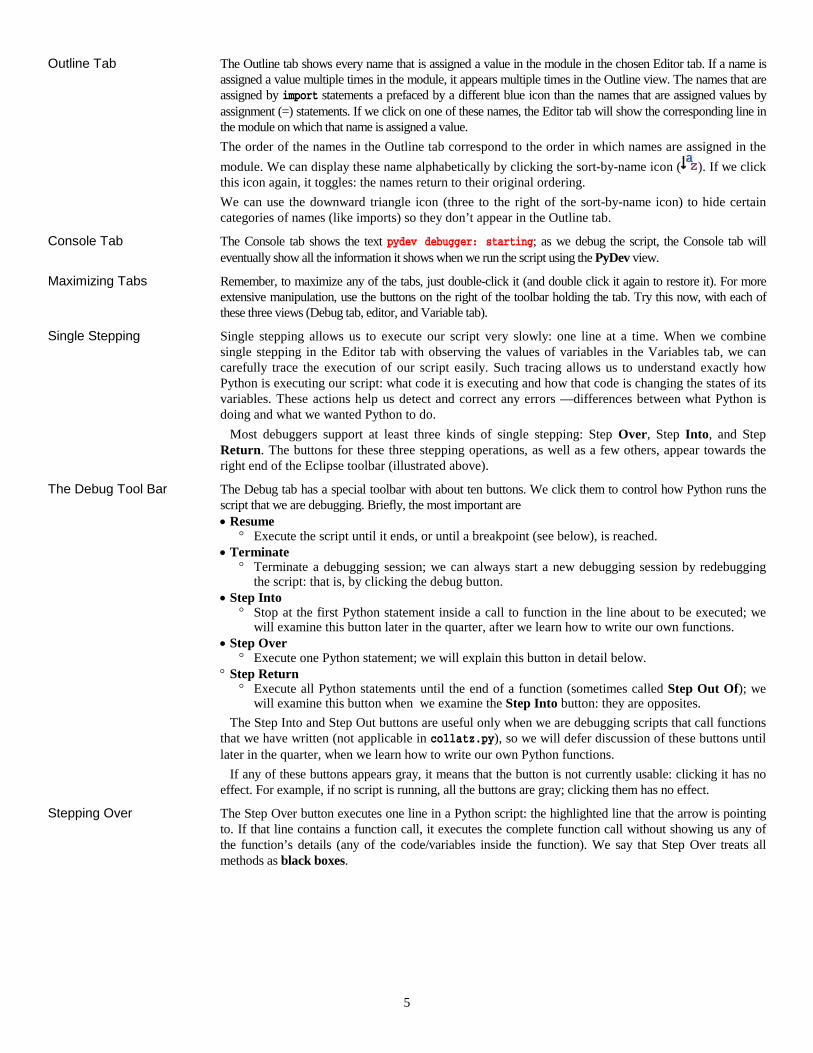
The Variables Tab The Variables tab lists the names and values of all the module variables that are initialized (currently assigned values) by the highlighted module in the Debug tab. By selecting any module named in the Debug tab, we can see its code (in an Editor tab) and all of its initialized variables (in the Variable tab).
All variables refer to objects. The values of a simple object appears in the Value column in the Variables tab by showing the type of the object and its value: for example, the variable __name__ is a str (string) with the value __main__ (note a colon separates the type and value). If a variable refers to a complicated object (one that defines more names), the variable is prefaced by a disclosure box containing either a + or - sign. If we click a + box, it changes to a - box and discloses more of the names in that object; if we click - box, it changes to a + box and, elides these names, so that they are not displayed. Later in the quarter, when we study more about Python, we will learn more about using these +/- boxes.
If there are too many entries in the Debug or Variables tab to display all at once, we can scroll through them. We can also simultaneously increase/decrease the sizes of the Debug and Variables tabs by pulling downward/upward on the horizontal line that separates these panes from the Editor tab. Doing so increases/decreases the size of these tabs (and the Editor tab).
When a script starts, the Variables tab will always display the names Globals, __builtins__, __doc__, __file__, and __name__. Soon we will see how to step over the statements that define the new name prompt, Stopwatch, original_number, is_debugging, cycle_count, test_number, and timer, which will sequentially appear in the Variable tab along with their values.
5
Outline Tab The Outline tab shows every name that is assigned a value in the module in the chosen Editor tab. If a name is assigned a value multiple times in the module, it appears multiple times in the Outline view. The names that are assigned by import statements a prefaced by a different blue icon than the names that are assigned values by assignment (=) statements. If we click on one of these names, the Editor tab will show the corresponding line in the module on which that name is assigned a value. The order of the names in the Outline tab correspond to the order in which names are assigned in the module. We can display these name alphabetically by clicking the sort-by-name icon ( ). If we click this icon again, it toggles: the names return to their original ordering. We can use the downward triangle icon (three to the right of the sort-by-name icon) to hide certain categories of names (like imports) so they don’t appear in the Outline tab.
Console Tab The Console tab shows the text pydev debugger: starting; as we debug the script, the Console tab will eventually show all the information it shows when we run the script using the PyDev view.
Maximizing Tabs Remember, to maximize any of the tabs, just double-click it (and double click it again to restore it). For more extensive manipulation, use the buttons on the right of the toolbar holding the tab. Try this now, with each of these three views (Debug tab, editor, and Variable tab).
Single Stepping Single stepping allows us to execute our script very slowly: one line at a time. When we combine single stepping in the Editor tab with observing the values of variables in the Variables tab, we can carefully trace the execution of our script easily. Such tracing allows us to understand exactly how Python is executing our script: what code it is executing and how that code is changing the states of its variables. These actions help us detect and correct any errors —differences between what Python is doing and what we wanted Python to do.
Most debuggers support at least three kinds of single stepping: Step Over, Step Into, and Step Return. The buttons for these three stepping operations, as well as a few others, appear towards the right end of the Eclipse toolbar (illustrated above).
The Debug Tool Bar The Debug tab has a special toolbar with about ten buttons. We click them to control how Python runs the script that we are debugging. Briefly, the most important are • Resume
° Execute the script until it ends, or until a breakpoint (see below), is reached. • Terminate
° Terminate a debugging session; we can always start a new debugging session by redebugging the script: that is, by clicking the debug button.
• Step Into ° Stop at the first Python statement inside a call to function in the line about to be executed; we
will examine this button later in the quarter, after we learn how to write our own functions. • Step Over
° Execute one Python statement; we will explain this button in detail below. ° Step Return
° Execute all Python statements until the end of a function (sometimes called Step Out Of); we will examine this button when we examine the Step Into button: they are opposites.
The Step Into and Step Out buttons are useful only when we are debugging scripts that call functions that we have written (not applicable in collatz.py), so we will defer discussion of these buttons until later in the quarter, when we learn how to write our own Python functions.
If any of these buttons appears gray, it means that the button is not currently usable: clicking it has no effect. For example, if no script is running, all the buttons are gray; clicking them has no effect.
Stepping Over The Step Over button executes one line in a Python script: the highlighted line that the arrow is pointing to. If that line contains a function call, it executes the complete function call without showing us any of the function’s details (any of the code/variables inside the function). We say that Step Over treats all methods as black boxes.
6
When we use Step Over in a script • The blue arrow/green highlighting indicates the line that Python is about to execute; clicking Step
Over executes that line, at which point and the blue arrow/green highlighting moves to the next line that Python will execute.
• If a variable is assigned for the first time during the execution of the step, it appears in the Variables Tab with its assigned value in the Value column, and both highlighted in yellow.
• If any variable already in the Variables tab is assigned a new value during the execution of a step, the new value appears in the Value column, and both are highlighted in yellow. If a variable’s value does not change during the execution of a step, its background appears normal (stays normal or reverts to normal from yellow).
) In the collatz.py script, the blue arrow/green highlighting refers to line 55 (import prompt). Perform the following steps:
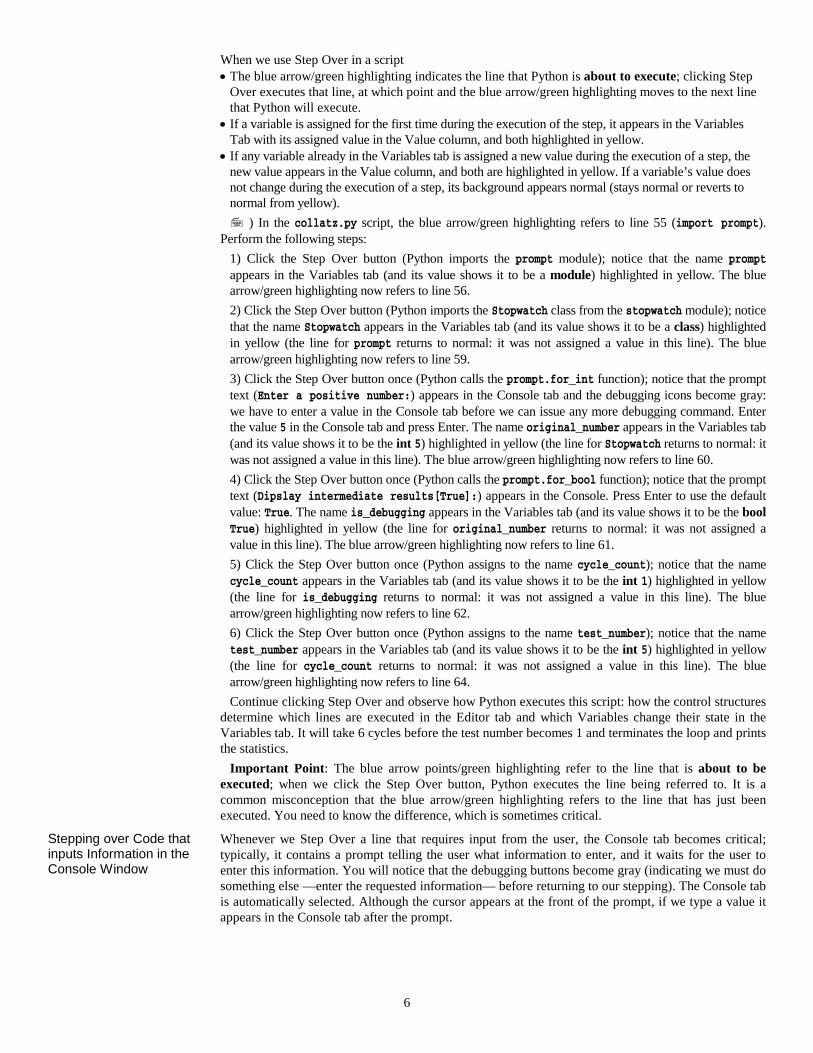
1) Click the Step Over button (Python imports the prompt module); notice that the name prompt appears in the Variables tab (and its value shows it to be a module) highlighted in yellow. The blue arrow/green highlighting now refers to line 56. 2) Click the Step Over button (Python imports the Stopwatch class from the stopwatch module); notice that the name Stopwatch appears in the Variables tab (and its value shows it to be a class) highlighted in yellow (the line for prompt returns to normal: it was not assigned a value in this line). The blue arrow/green highlighting now refers to line 59. 3) Click the Step Over button once (Python calls the prompt.for_int function); notice that the prompt text (Enter a positive number:) appears in the Console tab and the debugging icons become gray: we have to enter a value in the Console tab before we can issue any more debugging command. Enter the value 5 in the Console tab and press Enter. The name original_number appears in the Variables tab (and its value shows it to be the int 5) highlighted in yellow (the line for Stopwatch returns to normal: it was not assigned a value in this line). The blue arrow/green highlighting now refers to line 60. 4) Click the Step Over button once (Python calls the prompt.for_bool function); notice that the prompt text (Dipslay intermediate results[True]:) appears in the Console. Press Enter to use the default value: True. The name is_debugging appears in the Variables tab (and its value shows it to be the bool True) highlighted in yellow (the line for original_number returns to normal: it was not assigned a value in this line). The blue arrow/green highlighting now refers to line 61. 5) Click the Step Over button once (Python assigns to the name cycle_count); notice that the name cycle_count appears in the Variables tab (and its value shows it to be the int 1) highlighted in yellow (the line for is_debugging returns to normal: it was not assigned a value in this line). The blue arrow/green highlighting now refers to line 62. 6) Click the Step Over button once (Python assigns to the name test_number); notice that the name test_number appears in the Variables tab (and its value shows it to be the int 5) highlighted in yellow (the line for cycle_count returns to normal: it was not assigned a value in this line). The blue arrow/green highlighting now refers to line 64. Continue clicking Step Over and observe how Python executes this script: how the control structures
determine which lines are executed in the Editor tab and which Variables change their state in the Variables tab. It will take 6 cycles before the test number becomes 1 and terminates the loop and prints the statistics.
Important Point: The blue arrow points/green highlighting refer to the line that is about to be executed; when we click the Step Over button, Python executes the line being referred to. It is a common misconception that the blue arrow/green highlighting refers to the line that has just been executed. You need to know the difference, which is sometimes critical.
Stepping over Code that inputs Information in the Console Window
Whenever we Step Over a line that requires input from the user, the Console tab becomes critical; typically, it contains a prompt telling the user what information to enter, and it waits for the user to enter this information. You will notice that the debugging buttons become gray (indicating we must do something else —enter the requested information— before returning to our stepping). The Console tab is automatically selected. Although the cursor appears at the front of the prompt, if we type a value it appears in the Console tab after the prompt.
7
Terminating a Debugging Session (and possibly restarting one)
To terminate a debugging session (possibly to begin stepping through the script from the beginning again: it is easy to step too far, which requires going back to the beginning) click the Terminate button on the Debug toolbar. In this case the debugger terminates the script immediately: the blue arrow/green highlighting disappear from the Editor view. The Debug/Console tabs show the script to be terminated.
Another way to terminate a script is to click the Terminate button on the toolbar that holds the Console tab. To start debugging over again, click Terminate and then the debug button again. In the collatz.py script, click the Terminate button. Then, start a new debugging session by
clicking the debug button. Step completely through the script. Again, enter the value 5 when prompted. Observe the entire execution of the script (with this input, it takes six cycles). Observe which lines are executed in the Editor view, which variables are changed in the Variables tab as each line in the script executes (notice state changes appear with a yellow background, which disappears when different states change), and what information is displayed/entered in the Console window.
This is a slow but simple way to execute a script. We will now discuss faster ways to jump to “lines of interest” and possibly step from these lines.
Breakpoints Step Over allows us to observe the statements executed in our scripts. At each step, the Variables tab allows us to observe the changes made to values stored in our variables. Step Over allows (and forces) a very fine-grained view of our script. By setting a breakpoint on a line, we can run the script —at high speed— until that line is about to be executed (instead of tediously single stepping to that line). Often we need to ignore earlier lines in our script; stop somewhere in the middle of it; and then Step Over that line and subsequent lines carefully, observing changes to our variables. This requirement is easily met by setting breakpoints, which come in two varieties: unconditional and conditional. Let us look at each kind of breakpoint separately. We cover unconditional breakpoints first, because they are simpler. Important: We can set breakpoints only on lines containing Python code: not blank lines or or on lines that contain only comments.
Setting Unconditional Breakpoints
When we set an unconditional breakpoint on a line, the Debug perspective will stop the script whenever it is about to execute that line. This might happen when we first click the debug button, or while we debugging the script, after we click the Resume button.
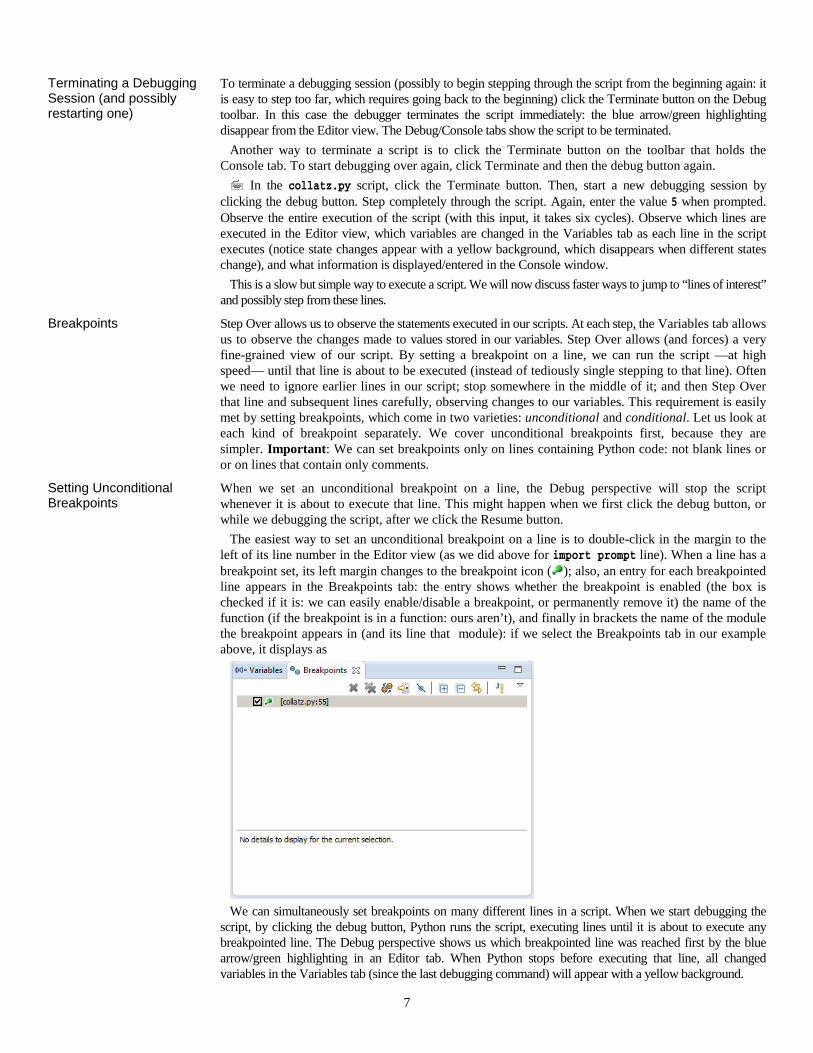
The easiest way to set an unconditional breakpoint on a line is to double-click in the margin to the left of its line number in the Editor view (as we did above for import prompt line). When a line has a breakpoint set, its left margin changes to the breakpoint icon ( ); also, an entry for each breakpointed line appears in the Breakpoints tab: the entry shows whether the breakpoint is enabled (the box is checked if it is: we can easily enable/disable a breakpoint, or permanently remove it) the name of the function (if the breakpoint is in a function: ours aren’t), and finally in brackets the name of the module the breakpoint appears in (and its line that module): if we select the Breakpoints tab in our example above, it displays as
We can simultaneously set breakpoints on many different lines in a script. When we start debugging the
script, by clicking the debug button, Python runs the script, executing lines until it is about to execute any breakpointed line. The Debug perspective shows us which breakpointed line was reached first by the blue arrow/green highlighting in an Editor tab. When Python stops before executing that line, all changed variables in the Variables tab (since the last debugging command) will appear with a yellow background.
8
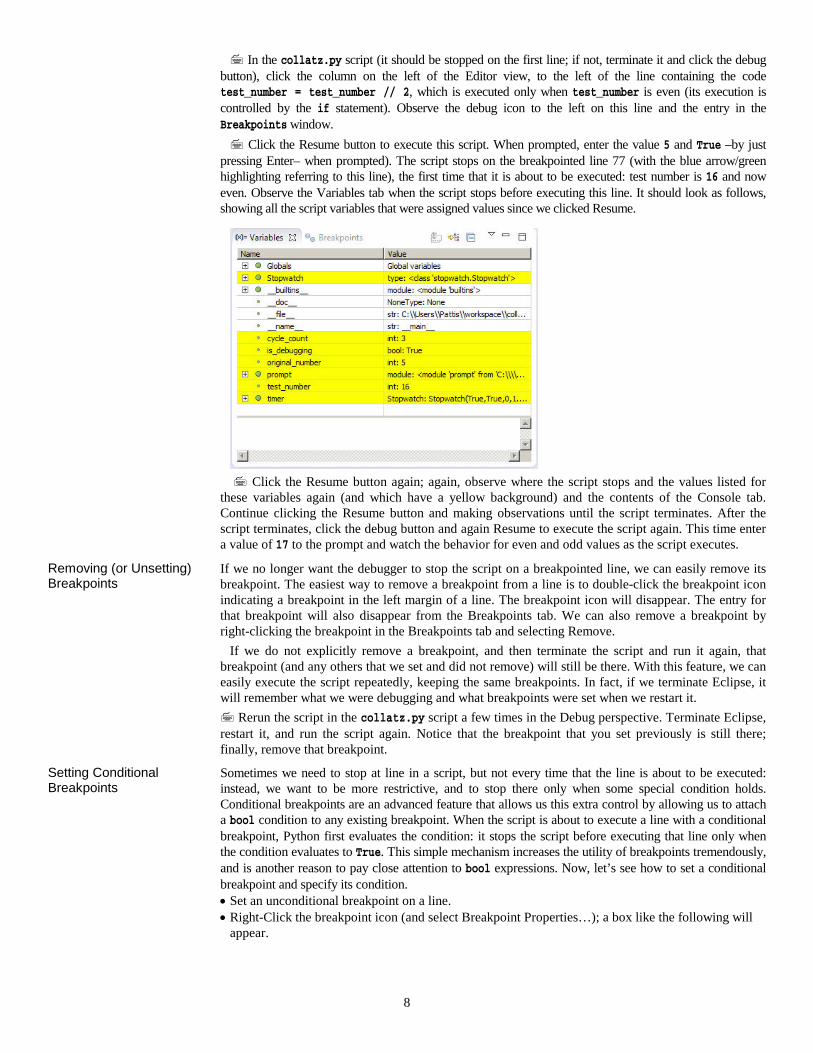
In the collatz.py script (it should be stopped on the first line; if not, terminate it and click the debug button), click the column on the left of the Editor view, to the left of the line containing the code test_number = test_number // 2, which is executed only when test_number is even (its execution is controlled by the if statement). Observe the debug icon to the left on this line and the entry in the Breakpoints window. Click the Resume button to execute this script. When prompted, enter the value 5 and True –by just
pressing Enter– when prompted). The script stops on the breakpointed line 77 (with the blue arrow/green highlighting referring to this line), the first time that it is about to be executed: test number is 16 and now even. Observe the Variables tab when the script stops before executing this line. It should look as follows, showing all the script variables that were assigned values since we clicked Resume.
Click the Resume button again; again, observe where the script stops and the values listed for
these variables again (and which have a yellow background) and the contents of the Console tab. Continue clicking the Resume button and making observations until the script terminates. After the script terminates, click the debug button and again Resume to execute the script again. This time enter a value of 17 to the prompt and watch the behavior for even and odd values as the script executes.
Removing (or Unsetting) Breakpoints
If we no longer want the debugger to stop the script on a breakpointed line, we can easily remove its breakpoint. The easiest way to remove a breakpoint from a line is to double-click the breakpoint icon indicating a breakpoint in the left margin of a line. The breakpoint icon will disappear. The entry for that breakpoint will also disappear from the Breakpoints tab. We can also remove a breakpoint by right-clicking the breakpoint in the Breakpoints tab and selecting Remove.
If we do not explicitly remove a breakpoint, and then terminate the script and run it again, that breakpoint (and any others that we set and did not remove) will still be there. With this feature, we can easily execute the script repeatedly, keeping the same breakpoints. In fact, if we terminate Eclipse, it will remember what we were debugging and what breakpoints were set when we restart it. Rerun the script in the collatz.py script a few times in the Debug perspective. Terminate Eclipse, restart it, and run the script again. Notice that the breakpoint that you set previously is still there; finally, remove that breakpoint.
Setting Conditional Breakpoints
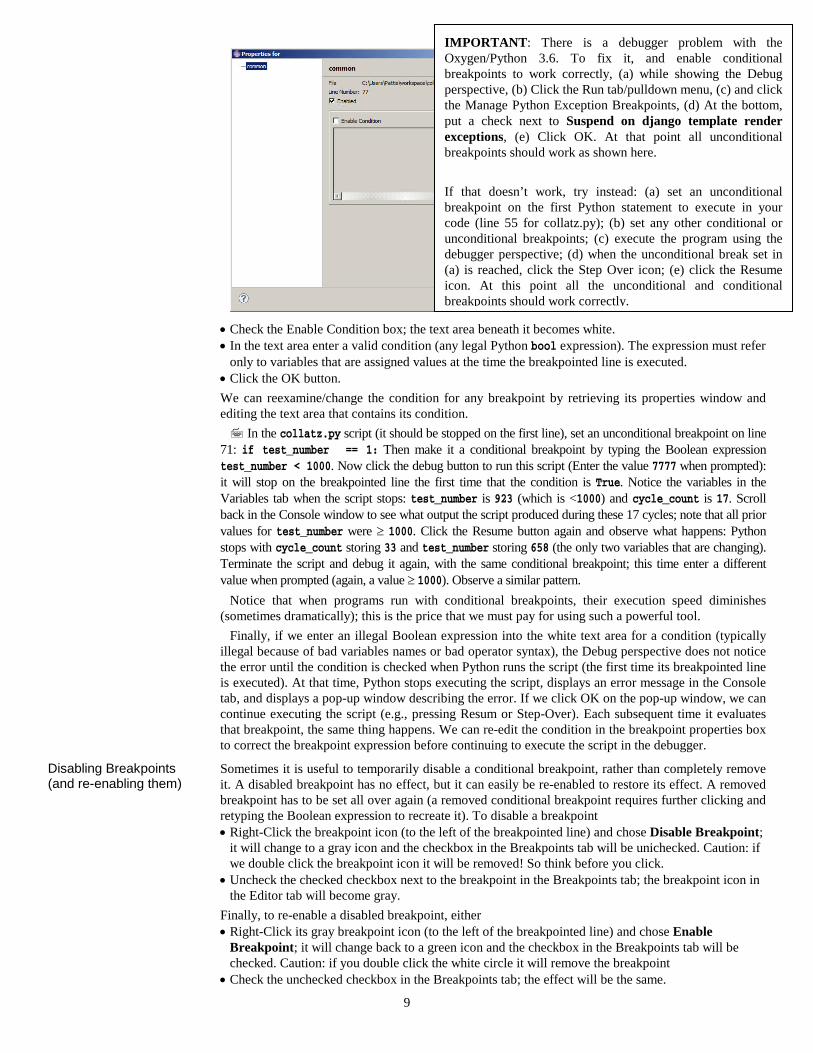
Sometimes we need to stop at line in a script, but not every time that the line is about to be executed: instead, we want to be more restrictive, and to stop there only when some special condition holds. Conditional breakpoints are an advanced feature that allows us this extra control by allowing us to attach a bool condition to any existing breakpoint. When the script is about to execute a line with a conditional breakpoint, Python first evaluates the condition: it stops the script before executing that line only when the condition evaluates to True. This simple mechanism increases the utility of breakpoints tremendously, and is another reason to pay close attention to bool expressions. Now, let’s see how to set a conditional breakpoint and specify its condition. • Set an unconditional breakpoint on a line. • Right-Click the breakpoint icon (and select Breakpoint Properties…); a box like the following will
appear.
9
• Check the Enable Condition box; the text area beneath it becomes white. • In the text area enter a valid condition (any legal Python bool expression). The expression must refer
only to variables that are assigned values at the time the breakpointed line is executed. • Click the OK button. We can reexamine/change the condition for any breakpoint by retrieving its properties window and editing the text area that contains its condition. In the collatz.py script (it should be stopped on the first line), set an unconditional breakpoint on line
71: if test_number == 1: Then make it a conditional breakpoint by typing the Boolean expression test_number < 1000. Now click the debug button to run this script (Enter the value 7777 when prompted): it will stop on the breakpointed line the first time that the condition is True. Notice the variables in the Variables tab when the script stops: test_number is 923 (which is <1000) and cycle_count is 17. Scroll back in the Console window to see what output the script produced during these 17 cycles; note that all prior values for test_number were ≥ 1000. Click the Resume button again and observe what happens: Python stops with cycle_count storing 33 and test_number storing 658 (the only two variables that are changing). Terminate the script and debug it again, with the same conditional breakpoint; this time enter a different value when prompted (again, a value ≥ 1000). Observe a similar pattern.
Notice that when programs run with conditional breakpoints, their execution speed diminishes (sometimes dramatically); this is the price that we must pay for using such a powerful tool.
Finally, if we enter an illegal Boolean expression into the white text area for a condition (typically illegal because of bad variables names or bad operator syntax), the Debug perspective does not notice the error until the condition is checked when Python runs the script (the first time its breakpointed line is executed). At that time, Python stops executing the script, displays an error message in the Console tab, and displays a pop-up window describing the error. If we click OK on the pop-up window, we can continue executing the script (e.g., pressing Resum or Step-Over). Each subsequent time it evaluates that breakpoint, the same thing happens. We can re-edit the condition in the breakpoint properties box to correct the breakpoint expression before continuing to execute the script in the debugger.
Disabling Breakpoints (and re-enabling them)
Sometimes it is useful to temporarily disable a conditional breakpoint, rather than completely remove it. A disabled breakpoint has no effect, but it can easily be re-enabled to restore its effect. A removed breakpoint has to be set all over again (a removed conditional breakpoint requires further clicking and retyping the Boolean expression to recreate it). To disable a breakpoint • Right-Click the breakpoint icon (to the left of the breakpointed line) and chose Disable Breakpoint;
it will change to a gray icon and the checkbox in the Breakpoints tab will be unichecked. Caution: if we double click the breakpoint icon it will be removed! So think before you click.
• Uncheck the checked checkbox next to the breakpoint in the Breakpoints tab; the breakpoint icon in the Editor tab will become gray.
Finally, to re-enable a disabled breakpoint, either • Right-Click its gray breakpoint icon (to the left of the breakpointed line) and chose Enable
Breakpoint; it will change back to a green icon and the checkbox in the Breakpoints tab will be checked. Caution: if you double click the white circle it will remove the breakpoint
• Check the unchecked checkbox in the Breakpoints tab; the effect will be the same.
IMPORTANT: There is a debugger problem with the Oxygen/Python 3.6. To fix it, and enable conditional breakpoints to work correctly, (a) while showing the Debug perspective, (b) Click the Run tab/pulldown menu, (c) and click the Manage Python Exception Breakpoints, (d) At the bottom, put a check next to Suspend on django template render exceptions, (e) Click OK. At that point all unconditional breakpoints should work as shown here. If that doesn’t work, try instead: (a) set an unconditional breakpoint on the first Python statement to execute in your code (line 55 for collatz.py); (b) set any other conditional or unconditional breakpoints; (c) execute the program using the debugger perspective; (d) when the unconditional break set in (a) is reached, click the Step Over icon; (e) click the Resume icon. At this point all the unconditional and conditional breakpoints should work correctly.
10
In the collatz.py script (it should be stopped on the first line), disable the conditional breakpoint that you just set. Then, click the Resume button to run this script: it will not stop on a line with a disabled breakpoint. Then re-enable the breakpoint and restart the script, entering some value ≥ 1000. Now the script stops on the line with the re-enabled breakpoint.
Finally, we can also disable a condition on Properties for pop-up window of a breakpoint, converting it from a conditional breakpoint to an unconditional breakpoint, by unchecking the Enabled box. The condition remains in the text area, though, so by rechecking this box we can restore it to the its original state (as a conditional breakpoint with the original condition). We can easily restore evaluation of the condition by checking the Enable Condition checkbox.
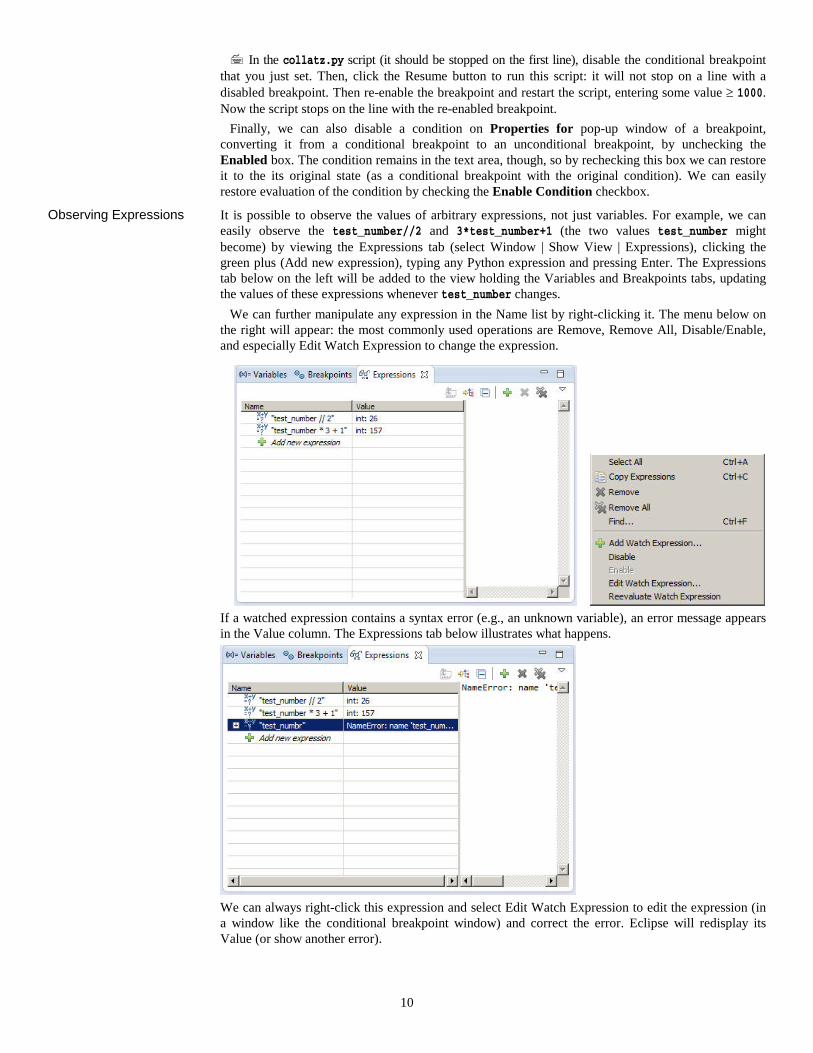
Observing Expressions It is possible to observe the values of arbitrary expressions, not just variables. For example, we can easily observe the test_number//2 and 3*test_number+1 (the two values test_number might become) by viewing the Expressions tab (select Window | Show View | Expressions), clicking the green plus (Add new expression), typing any Python expression and pressing Enter. The Expressions tab below on the left will be added to the view holding the Variables and Breakpoints tabs, updating the values of these expressions whenever test_number changes.
We can further manipulate any expression in the Name list by right-clicking it. The menu below on the right will appear: the most commonly used operations are Remove, Remove All, Disable/Enable, and especially Edit Watch Expression to change the expression.
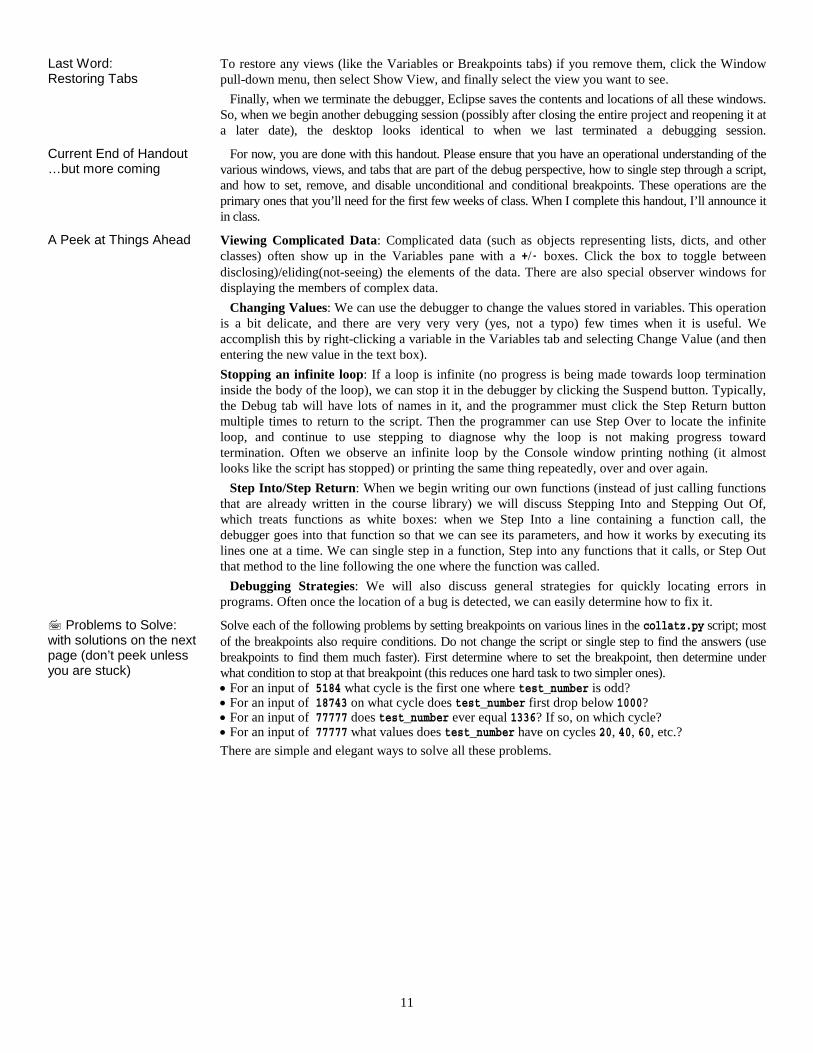
If a watched expression contains a syntax error (e.g., an unknown variable), an error message appears in the Value column. The Expressions tab below illustrates what happens.
We can always right-click this expression and select Edit Watch Expression to edit the expression (in a window like the conditional breakpoint window) and correct the error. Eclipse will redisplay its Value (or show another error).
11
Last Word: Restoring Tabs
To restore any views (like the Variables or Breakpoints tabs) if you remove them, click the Window pull-down menu, then select Show View, and finally select the view you want to see.
Finally, when we terminate the debugger, Eclipse saves the contents and locations of all these windows. So, when we begin another debugging session (possibly after closing the entire project and reopening it at a later date), the desktop looks identical to when we last terminated a debugging session.
Current End of Handout …but more coming
For now, you are done with this handout. Please ensure that you have an operational understanding of the various windows, views, and tabs that are part of the debug perspective, how to single step through a script, and how to set, remove, and disable unconditional and conditional breakpoints. These operations are the primary ones that you’ll need for the first few weeks of class. When I complete this handout, I’ll announce it in class.
A Peek at Things Ahead Viewing Complicated Data: Complicated data (such as objects representing lists, dicts, and other classes) often show up in the Variables pane with a +/- boxes. Click the box to toggle between disclosing)/eliding(not-seeing) the elements of the data. There are also special observer windows for displaying the members of complex data.
Changing Values: We can use the debugger to change the values stored in variables. This operation is a bit delicate, and there are very very very (yes, not a typo) few times when it is useful. We accomplish this by right-clicking a variable in the Variables tab and selecting Change Value (and then entering the new value in the text box). Stopping an infinite loop: If a loop is infinite (no progress is being made towards loop termination inside the body of the loop), we can stop it in the debugger by clicking the Suspend button. Typically, the Debug tab will have lots of names in it, and the programmer must click the Step Return button multiple times to return to the script. Then the programmer can use Step Over to locate the infinite loop, and continue to use stepping to diagnose why the loop is not making progress toward termination. Often we observe an infinite loop by the Console window printing nothing (it almost looks like the script has stopped) or printing the same thing repeatedly, over and over again.
Step Into/Step Return: When we begin writing our own functions (instead of just calling functions that are already written in the course library) we will discuss Stepping Into and Stepping Out Of, which treats functions as white boxes: when we Step Into a line containing a function call, the debugger goes into that function so that we can see its parameters, and how it works by executing its lines one at a time. We can single step in a function, Step into any functions that it calls, or Step Out that method to the line following the one where the function was called.
Debugging Strategies: We will also discuss general strategies for quickly locating errors in programs. Often once the location of a bug is detected, we can easily determine how to fix it.
Problems to Solve: with solutions on the next page (don’t peek unless you are stuck)
Solve each of the following problems by setting breakpoints on various lines in the collatz.py script; most of the breakpoints also require conditions. Do not change the script or single step to find the answers (use breakpoints to find them much faster). First determine where to set the breakpoint, then determine under what condition to stop at that breakpoint (this reduces one hard task to two simpler ones). • For an input of 5184 what cycle is the first one where test_number is odd? • For an input of 18743 on what cycle does test_number first drop below 1000? • For an input of 77777 does test_number ever equal 1336? If so, on which cycle? • For an input of 77777 what values does test_number have on cycles 20, 40, 60, etc.? There are simple and elegant ways to solve all these problems.
12
Solutions Here are the solutions for the problems above. When answering questions about the current cycle_count and test_number, it is convenient to set a breakpoint on the if test_number == 1: line, which occurs directly after their current values are displayed to the console window. • For an input of 5184 what cycle is the first one where test_number is odd?
° Answer: on cycle 7 (test_number is 81) 1) Set a breakpoint at the line starting if test_number == 1: with the following condition: test_number % 2 == 1 2) Set an unconditional breakpoint at the line test_number = 3*test_number + 1; this stops on the first odd number, but AFTER cycle_count has been incremented (so it will show as 8, not 7).
• For an input of 18743 on what cycle does test_number first drop below 1000? ° Answer: on cycle 81 (test_number is 572)
Set a breakpoint at the line starting if test_number == 1: with the following condition: test_number < 1000
• For an input of 77777 does test_number ever equal 1336? If so, on which cycle? ° Answer: on cycle 100 (test_number is 1336)
Set a breakpoint at the line starting if test_number == 1: with the following condition: test_number == 1336
• For an input of 77777 what values does test_number have on cycles 20, 40, 60, etc.? ° Answer: on cycle 20, test_number is 6922; on cycle 40, test_number is 1853; on cycle 60,
test_number is 496; on cycle 80, test_number is 137; on cycle 100, test_number is 1336; Set a breakpoint at the line starting if test_number == 1: with the following condition: cycle_count % 20 == 0
13
Problem Set Use the Debug perspective to Observe the script in the craps.py script (find the Craps Statistics script by following the Sample Programs link on the course homepage). Before proceeding, please read all the comments at the top of that script, which describe it; then, compile and run it a few times. Below are a variety of questions about this script, all of which can be answered by using various combinations of the standard debugger commands: i.e., observing the Variables tab while stepping/running the script under the control of unconditional and conditional breakpoints (similarly to the problems/solutions in the handout above).
For example, question 1 (below) can be solved by observing the variable game (which keeps track of the game number: first, second, third, etc.) and setting a breakpoint at the unique line that is executed when a loss occurs on a first throw of the dice.
Determine both the answers to the questions and a general explanation of the methods (the debugger commands: where and with what conditions) that you used to answer these questions. For the solution you submit, just supply the answers (not the general explanation).
To start the assignment, you will have to download and modify the crap.py script. • Download the craps project zip file onto your desktop and then unzip it. • Open Eclipse and use the Python perspective to start the project. • Open an Editor view of the craps.py script in it. Change blank line 61 to read
dice.standard_rolls_for_debugging() ° By making this change to the script, the Dice will generate a standard sequence of rolls, so its
results will be identical each time that you run the script. This is a very useful feature when the script you are debugging, or trying to gather information about, uses a random number generator.
• Run the script after these change. For the same number of games, you will always get the same statistics. Then switch to the Debug perspective. Ensure that the script runs correctly before setting any breakpoints.
• Make no other changes to the script: this assignment does not require programming. Single step through the script for a few games to better understand the execution of this script and its
control structures. Specifically, watch how the information stored in the variable roll controls what statements the script executes; also observe where/how the script changes game, win_count and lose_count.
Determine how to use debugger commands to help you answer the following questions. Each question requires its own/different debugging session, starting the program from the beginning. Make no changes to the script itself.
1. What number game is the first to be lost on one roll of the dice (e.g., 2, 3, or 12)?
2. What are all the dice rolls in the seventh game (list them in the order thrown)?
3.What number game is the first to be won on a roll of 7? …on a roll of 11?
4.What number game is the first to be lost on a roll of 2? ..on a roll of 3? ..on a roll of 12?
5.What number game is the first to be won by making a point of 5? … a point of 10?
6. What are all the dice rolls in game 101?
7. In what game number does the 712th win occur? (this script can run for a few minutes)
Hints Enter 2000 when prompted Enter # of games to play: all answers correspond to earlier games than this one. This bound is important because a script with breakpoints (especially conditional breakpoints) will run more slowly when compared to the same script without breakpoints (I estimate 10 times as slow with one breakpoint). So, once you set your breakpoints, it may take some time for the debugger to stop the script on the appropriate line (but still only a few seconds): if you set incorrect breakpoints, you do not want the script to execute for more than a minute before you find out.