THE DEATH PENALTY THROUGH THE LENSES OF CRIMINOLOGY ...
136
THE DEATH PENALTY THROUGH THE LENSES OF CRIMINOLOGY/CRIMINAL JUSTICE STUDENTS AND NON-CRCJ STUDENTS by SHIRLEY A. HAMBLET Presented to the Faculty of the Graduate School of The University of Texas at Arlington in Partial Fulfillment of the Requirements for the Degree of MASTER OF ARTS IN CRIMINOLOGY AND CRIMINAL JUSTICE THE UNIVERSITY OF TEXAS AT ARLINGTON December 2006
Transcript of THE DEATH PENALTY THROUGH THE LENSES OF CRIMINOLOGY ...
THE DEATH PENALTY THROUGH THE LENSES OF
CRIMINOLOGY/CRIMINAL JUSTICE
STUDENTS AND NON-CRCJ
STUDENTS
by
SHIRLEY A. HAMBLET
Presented to the Faculty of the Graduate School of
The University of Texas at Arlington in Partial Fulfillment
of the Requirements
for the Degree of
MASTER OF ARTS IN CRIMINOLOGY AND CRIMINAL JUSTICE
THE UNIVERSITY OF TEXAS AT ARLINGTON
December 2006

Copyright © by Shirley A. Hamblet 2006
All Rights Reserved
iii
ACKNOWLEDGEMENTS
I would like to first extend my gratitude and thanks to Dr. Alejandro del
Carmen. His enthusiastic approach to the subject of Criminology/Criminal Justice has
been an inspiration to me and has made the completion of this thesis possible. In
addition, I would like to thank Dr. John W. Stickels and Dr. Rodrigo Paris for their
generous time and support.
The realization of this accomplishment could never have been possible without
the assistance of two very special people. The love and support of my husband, David,
was absolutely essential. He not only encouraged me, but made many sacrifices so that
I could focus my time and energy to the completion of this thesis. My daughter Brandy
has always believed in her “Mom”. Her words of support and encouragement have
meant the world to me. Finally, I would like to acknowledge the countless other
friends, classmates and family members who have believed in me. This
accomplishment is shared with all of you.
October 11, 2006
iv
ABSTRACT
THE DEATH PENALTY THROUGH THE LENSES OF
CRIMINOLOGY/CRIMINAL JUSTICE
STUDENTS AND NON-CRCJ
STUDENTS
Publication No. ______
Shirley A. Hamblet, M.A.
The University of Texas at Arlington, 2006
Supervising Professor: Alejandro del Carmen
The purpose of this study is to examine the possible relationship between level
of knowledge and perception regarding capital punishment among criminology/criminal
justice (CRCJ) students in comparison with non-CRCJ majors. The data for this study
were obtained from a sample of CRCJ and non-CRCJ majors enrolled at the University
of Texas at Arlington. While CRCJ majors appeared to be more knowledgeable
regarding capital punishment, there was little significant difference of opinion
(perception) among CRCJ and non-CRCJ majors.
v
TABLE OF CONTENTS
ACKNOWLEDGEMENTS....................................................................................... iii
ABSTRACT .............................................................................................................. iv
LIST OF TABLES..................................................................................................... x
LIST OF CASES ....................................................................................................... xi
Chapter
1. INTRODUCTION .......................................................................................... 1
1.1 History of the Death Penalty.................................................................... 3
1.2 Deterrence Theory ................................................................................... 11
1.3 The Present Study.................................................................................... 13
2. LITERATURE REVIEW .............................................................................. 17
2.1 The History of Capital Punishment ......................................................... 18
2.1.1 Early Death Penalty Laws ........................................................ 18
2.1.2 Executions throughout the Middle Ages .................................. 20
2.1.3 Executions in England .............................................................. 22
2.1.4 Opposition to Capital Punishment ............................................ 24
2.2 Capital Punishment in the United States ................................................. 25
2.2.1 Beccaria’s Influence in the United States ................................. 27
2.2.2 Capital Punishment during the Civil War:North and South ....................................................................... 30
vi
2.2.3 Race and Capital Punishment ................................................... 31
2.2.3.1 Rape, Race and Capital Punishment ............................ 33
2.2.4 Capital Punishment in the Twentieth Century.......................... 34
2.2.5 The Supreme Court and Capital Punishment............................ 37
2.2.5.1 Abolition and Reinstatement: The Furmanand Gregg decisions ..................................................... 37
2.2.5.2 Capital Punishment, Insanity andMental Retardation ....................................................... 38
2.2.5.3 Age and Capital Punishment........................................ 38
2.2.5.4 Race and the Death Penalty.......................................... 39
2.2.6 Public Executions ..................................................................... 39
2.2.6.1 The Debate over televising executions ........................ 41
2.2.7 Capital Punishment in the Twenty-first Century ...................... 42
2.3 American Death Penalty Knowledge ........................................................... 43
2.3.1 The Marshall Hypothesis.......................................................... 43
2.3.2 The American Public and Testingthe Marshall Hypothesis........................................................... 44
2.3.3 Public Support .......................................................................... 46
2.3.4 Public Opinion and the Willingnessto Pass Judgment ...................................................................... 50
2.3.5 Death Penalty Opinion and Race.............................................. 52
2.3.6 Death Penalty Knowledge and College Students ..................... 57
2.3.6.1 The Later Nineteenth Century Knowledge/Perceptions .................................................................. 57
vii
2.3.6.2 Twenty-first Century Knowledge and Opinions.......... 62
2.3.7 Studies Addressing Knowledge and Perceptionamong Criminology/Criminal Justice Majors.......................... 64
2.3.7.1 The nineteen-eighties ................................................... 64
2.3.7.2 The nineteen-nineties ................................................... 65
2.3.7.3 The twenty-first Century.............................................. 67
3. METHODOLOGY AND DESIGN............................................................... 70
3.1 Construction of the Survey Instrument.................................................... 71
3.1.1 IRB Review and Approval........................................................ 73
3.2 Sampling Method..................................................................................... 73
3.3 Data Collection ........................................................................................ 75
3.3.1 Survey Instrument..................................................................... 75
3.4 Statistical Manipulation ........................................................................... 77
4. FINDINGS...................................................................................................... 79
4.1 Demographics .......................................................................................... 80
4.2 CRCJ Responses and non-CRCJ Responses ........................................... 82
4.2.1 Knowledge Items ...................................................................... 82
4.2.2 Perception/Opinion Items ......................................................... 83
4.2.3 Information Source(s) ............................................................... 86
4.2.3.1 Print Sources ................................................................ 86
4.2.3.2 Television, Radio and Electronic Media...................... 86
4.2.3.3 Interactions with Others ............................................... 87
4.3 Majority Responses and Minority Responses.......................................... 88
viii
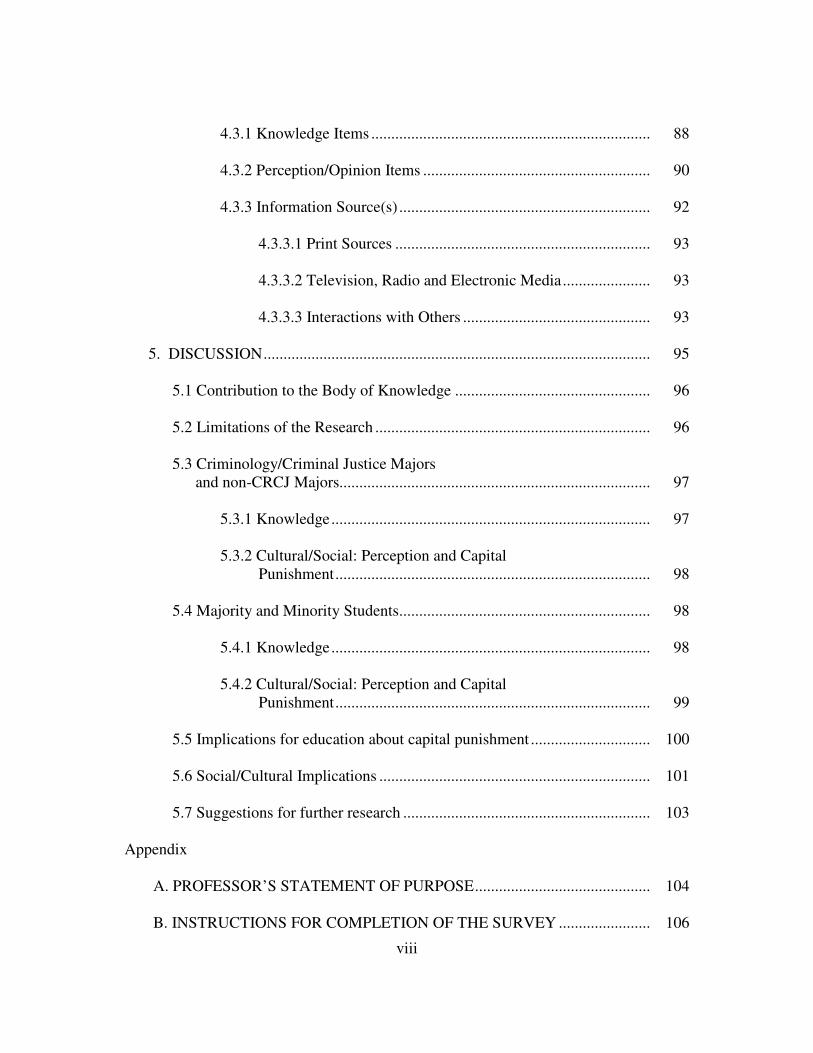
4.3.1 Knowledge Items ...................................................................... 88
4.3.2 Perception/Opinion Items ......................................................... 90
4.3.3 Information Source(s) ............................................................... 92
4.3.3.1 Print Sources ................................................................ 93
4.3.3.2 Television, Radio and Electronic Media...................... 93
4.3.3.3 Interactions with Others ............................................... 93
5. DISCUSSION................................................................................................. 95
5.1 Contribution to the Body of Knowledge ................................................. 96
5.2 Limitations of the Research ..................................................................... 96
5.3 Criminology/Criminal Justice Majorsand non-CRCJ Majors.............................................................................. 97
5.3.1 Knowledge................................................................................ 97
5.3.2 Cultural/Social: Perception and CapitalPunishment............................................................................... 98
5.4 Majority and Minority Students............................................................... 98
5.4.1 Knowledge................................................................................ 98
5.4.2 Cultural/Social: Perception and CapitalPunishment............................................................................... 99
5.5 Implications for education about capital punishment .............................. 100
5.6 Social/Cultural Implications .................................................................... 101
5.7 Suggestions for further research .............................................................. 103
Appendix
A. PROFESSOR’S STATEMENT OF PURPOSE............................................ 104
B. INSTRUCTIONS FOR COMPLETION OF THE SURVEY ....................... 106

ix
C. STUDENT SURVEY .................................................................................... 108
REFERENCES .......................................................................................................... 113
BIOGRAPHICAL INFORMATION......................................................................... 125
x
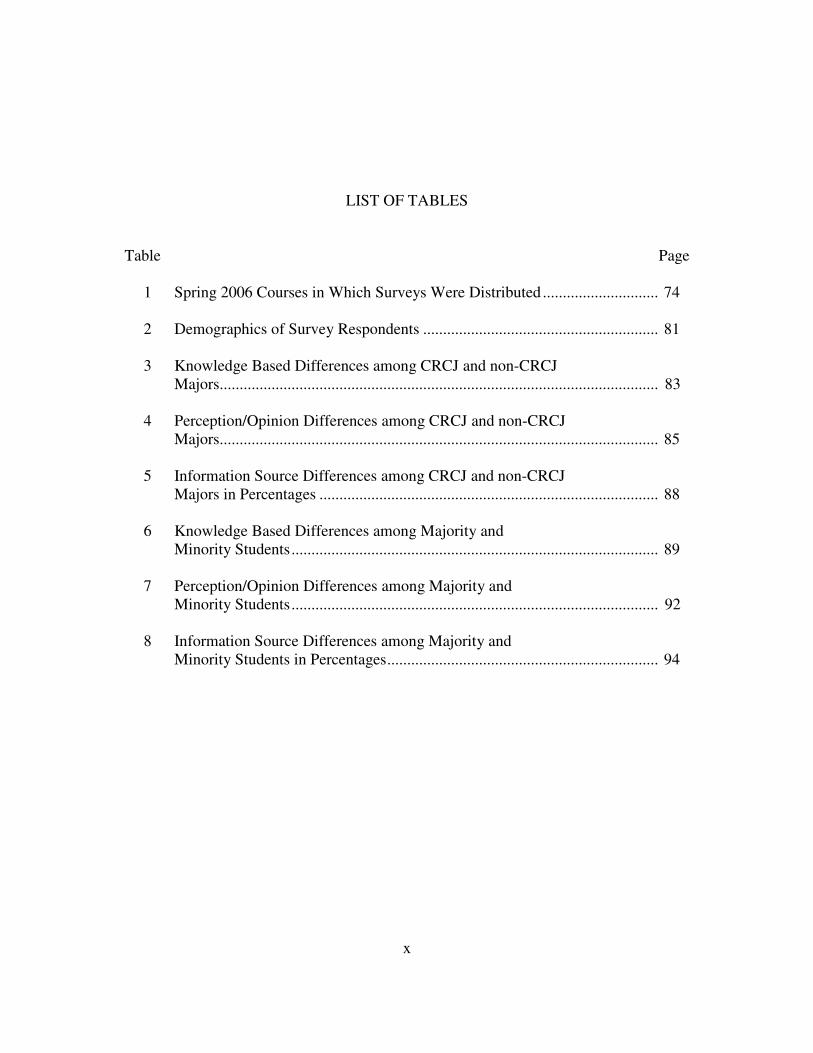
LIST OF TABLES
Table Page
1 Spring 2006 Courses in Which Surveys Were Distributed ............................. 74
2 Demographics of Survey Respondents ........................................................... 81
3 Knowledge Based Differences among CRCJ and non-CRCJMajors.............................................................................................................. 83
4 Perception/Opinion Differences among CRCJ and non-CRCJMajors.............................................................................................................. 85
5 Information Source Differences among CRCJ and non-CRCJMajors in Percentages ..................................................................................... 88
6 Knowledge Based Differences among Majority andMinority Students............................................................................................ 89
7 Perception/Opinion Differences among Majority andMinority Students............................................................................................ 92
8 Information Source Differences among Majority andMinority Students in Percentages.................................................................... 94
xi
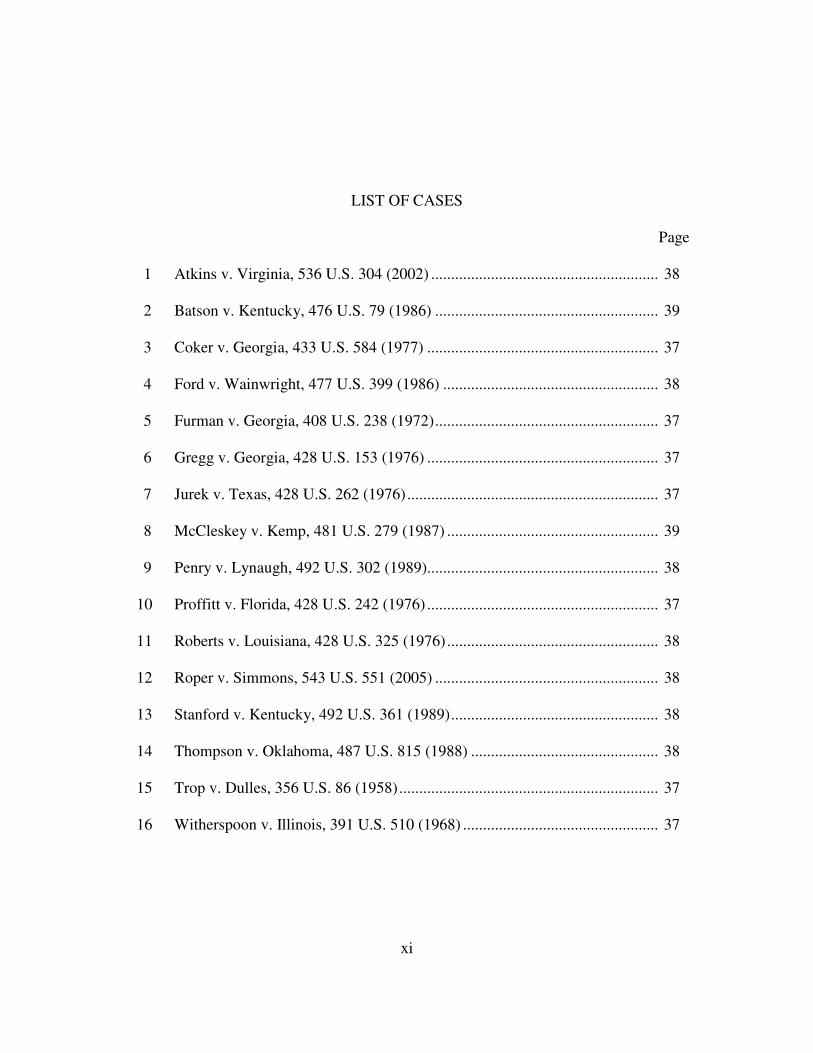
LIST OF CASES
Page
1 Atkins v. Virginia, 536 U.S. 304 (2002) ......................................................... 38
2 Batson v. Kentucky, 476 U.S. 79 (1986) ........................................................ 39
3 Coker v. Georgia, 433 U.S. 584 (1977) .......................................................... 37
4 Ford v. Wainwright, 477 U.S. 399 (1986) ...................................................... 38
5 Furman v. Georgia, 408 U.S. 238 (1972)........................................................ 37
6 Gregg v. Georgia, 428 U.S. 153 (1976) .......................................................... 37
7 Jurek v. Texas, 428 U.S. 262 (1976)............................................................... 37
8 McCleskey v. Kemp, 481 U.S. 279 (1987) ..................................................... 39
9 Penry v. Lynaugh, 492 U.S. 302 (1989).......................................................... 38
10 Proffitt v. Florida, 428 U.S. 242 (1976) .......................................................... 37
11 Roberts v. Louisiana, 428 U.S. 325 (1976)..................................................... 38
12 Roper v. Simmons, 543 U.S. 551 (2005) ........................................................ 38
13 Stanford v. Kentucky, 492 U.S. 361 (1989).................................................... 38
14 Thompson v. Oklahoma, 487 U.S. 815 (1988) ............................................... 38
15 Trop v. Dulles, 356 U.S. 86 (1958)................................................................. 37
16 Witherspoon v. Illinois, 391 U.S. 510 (1968) ................................................. 37
1
CHAPTER 1
INTRODUCTION
The Eighth Amendment to the United States Constitution says “Excessive bail
shall not be required, nor excessive fines imposed” and most importantly “nor cruel and
unusual punishments inflicted”. Whether one believes the death penalty to be cruel and
unusual or a just sentence in the face of an egregious crime, many Americans support
the death penalty without knowing or caring much about the way in which it is carried
out (Bedau, 1997; Furman v. Georgia, 1972; Walker, Spohn & Delone, 2000). Supreme
Court Chief Justice William Brennan observed,
It is tempting to pretend that [those] on death row share a fate in noway connected to our own, that our treatment of them sounds noechoes beyond the chambers in which they die. Such an illusion isultimately corrosive, for the reverberations of injustice are not soeasily confined… the way in which we choose those who will diereveals the depth of moral commitment among the living (Bedau,1997, p. 299).
Chief Justice Brennan’s observation has not been lost on those who have been
wrongly condemned to die. Randall Dale Adams served twelve years on Texas’ death
row before being exonerated (Adams, 1991). His death at the hands of the State of
Texas would have taken place in a bleak room, strapped down to a gurney, with no
chance left for exoneration. In 1996, DNA testing proved that not one of the so called
“Ford Heights Four” was responsible for the rape and murder of a Chicago woman and
her companion. Since then, more than 75 cases of persons wrongfully convicted have
2
surfaced (McCormick, 1998). Still other capital murder defendants must contend with
attorneys who spend little time preparing for trial, sleeping lawyers and courts that
refuse to acknowledge the ineffectiveness of counsel claims that follow (Shapiro, 1997).
Further, the death penalty has become a popular position for politicians who do not
wish to appear soft on crime (Cockburn, 2001). Capital punishment is the most severe
sentence that can be given and one that is impossible for society to correct once
administered. No apology, or compensation of money can give the person back his life
or comfort his family. Therefore, the level of knowledge that future policy-makers have
about the death penalty and how that shapes their perceptions and actions is of vital
importance to every American, for one can never be certain that the mistake of justice
will not befall them.
The question that begs to be answered is whether or not support for the death
penalty has any correlation with knowledge about the death penalty, and if CRCJ and
non-CRCJ students differ in knowledge and support for capital punishment. Supreme
Court Justice Thurgood Marshall, stated in Furman v. Georgia (1972) that Americans
know little about capital punishment. He believed that if the average citizen knew the
facts, almost no-one would support the use of capital punishment. However, he further
hypothesized that if one supported the death penalty for retributive reasons, no amount
of knowledge would change their opinion (Furman v. Georgia, 1972; Walker, et al.,
2000).
Given the gravity of the death penalty and its political nature, it is imperative
that knowledge and perceptions among students who will become tomorrow’s policy-
3
makers and leaders within Texas’ criminal justice system, be examined in relation to
students who major in other disciplines. The purpose of this study is to examine the
possible relationship between level of knowledge and perception regarding capital
punishment among criminology and criminal justice (CRCJ) students in comparison
with non-CRCJ majors. First, the study will attempt to determine whether there is a
difference in level of knowledge of the death penalty among CRCJ majors and non-
CRCJ majors. Second, the study will attempt to determine whether knowledge has any
correlation with perception and opinion regarding the death penalty. The data for this
study were obtained from CRCJ and non-CRCJ undergraduate and graduate students
attending the University of Texas at Arlington during the spring semester of 2006.
1.1 History of the Death Penalty
Capital punishment has roots that extend as far back as Biblical times when
executions served the ends of God. People lived in fear of provoking God and believed
that his wrath would release upon them any number of natural disasters (Johnson,
1998). In ancient Babylon, Hammurabi’s Code mandated the death penalty for 25
crimes including sorcery and making false accusations of murder. Many of the laws of
this time were based on retaliation or lex talionis (Lifton & Mitchell, 2002).
In ancient Greece, death was the prescribed penalty for almost every violation of
law imaginable. One could find himself executed for simply being idle or having stolen
salt (Lifton & Mitchell, 2002). The earliest form of community punishment in Greece
was stoning. However, stoning was only used to punish those crimes that affected the
community (Johnson, 1998). The laws of Greece were so harsh that eventually public
4
sentiment forced the abolition of the death penalty for most crimes (Lifton & Mitchell,
2002).
During the middle ages, executions were public and attended by the masses.
Clergy often blessed the execution and the means of execution were varied. The upper
class could expect to be beheaded, while the lower class were left to suffer by hanging,
drawing and quartering, drowning, being disemboweled (Johnson, 1998; Lifton &
Mitchell, 2002) or breaking on the wheel, a process of hanging the victim by his feet
and an executioner sawing his body in half vertically while still alive and conscious
(Johnson, 1998).
England’s bloody code was the harshest and most punitive in Europe ( Banner,
2002). During the period 1714-1830, English Parliament had created 156 new capital
offenses (Tonry, 1996). Most of these new offenses were property crimes (Dike, 1981;
Tonry, 1996) that targeted the poor (Dike, 1981). By 1819 over 200 crimes were
designated capital offenses (Banner, 2002; del Carmen, 2000; Dike, 1981; Tonry,
1996). Although the bloody codes prevented torture such as the wheel, it implemented
the death penalty for crimes such as cutting down trees in parks (del Carmen, 2000),
theft of turnips, lead, iron bars and gates (Dike, 1981), poaching deer and theft of small
sums of money (Banner, 2002). The English practice of leaving rotting corpses for
others to see is thought to have been done in an attempt to deter others from crime (del
Carmen, 2000; Dike, 1981) but eventually the death penalty in England began to wane
as juries refused to convict (Dike, 1981; Tonry, 1996), the accused began to claim
benefit of clergy, and many of those sentenced to death were never executed (Tonry,
5
1996). In fact, executions in the late eighteenth century varied from between 21 per
year to 53 during the 1790s (Tonry, 1996). By 1829, capital crimes had declined to just
15, and by 1861, just 4 crimes were considered capital offenses (Dike, 1981).
Capital punishment in America was based on English law and was brought to
America during the seventeenth century by the first American colonists (Bedau, 1997).
The first known execution in America occurred in 1622 in Virginia when Daniel Frank
was executed for theft (del Carmen, 2002). The earliest death penalty statutes recorded
are from the Massachusetts Bay colony in 1636. Some of the original crimes for which
one could be executed included witchcraft, idolatry, and blasphemy (Dike, 1981). The
Massachusetts Code of 1648 provided capital punishments for crimes such as sodomy,
man stealing, treason and homicide committed with malice (del Carmen, 2002) and
each offense was justified by use of Biblical quotation (Lifton & Mitchell, 2002).
Between 1642 and 1650, a person in the New Haven Colony denying the existence of
God could receive the death penalty (Inciardi, 1999) while in early Pennsylvania only
murder and treason were punished by death (Lifton & Mitchell, 2002). During this
period death by hanging was the preferred method of execution (Bedau, 1997) and each
colony’s laws differed from the next (Lifton & Mitchell, 2002).
The abolition movement began in the 1700s when Cesare Beccaria, an Italian
mathematician, wrote Des delitti e delles pene (On Crimes and Punishments) (Bedau,
1997; del Carmen, 2002). Beccaria was born in Milan Italy in 1738 to an aristocratic
family, and attended the University of Pavia where he received his degree in 1758 (del
Carmen, 2002). Beccaria advocated penile servitude in place of the death penalty

6
(Bedau, 1997, del Carmen, 2002) and believed that not only was the death penalty not a
right of the state, but that it could only be considered necessary for only two reasons;
that the safety of the nation continued to be in danger should the offender live, if the
offender was in a position by his very existence to provoke a revolution, or if his death
would deter others from crime (Beccaria, 1996).
Another early abolitionist was Benjamin Rush, an American who lectured
against public execution (Bedau, 1997) and was the first to present reasoned arguments
why capital punishment should be abolished (del Carmen, 2002). In addition, Rush
questioned whether the Bible really provided support for capital punishment. Rush was
one of the first to suggest that capital punishment might not have a deterrent effect, but
instead have a brutalizing effect (Bohm, 2003).
In Pennsylvania in 1793, the Quakers pushed for reform insisting that murder be
divided by two degrees; first and second degree murder (Bedau, 1997). In 1794,
Pennsylvania did adopt degrees of murder, but first degree murder still carried a
mandatory death sentence (Dike, 1981; Lifton & Mitchell, 2002). Most states followed
Pennsylvania’s lead and adopted the concept of degrees of murder (Bedau, 1997; Bohm,
2003), but the Quakers’ ultimate goal was to abolish the death penalty completely
(Bedau, 1997; Dike, 1981). As the eighteenth century came to an end at least 1500
persons had been executed in America (Lifton & Mitchell, 2002).
In the nineteenth century, the use of the death penalty flourished. The use of
capital punishment increased by 60% over the entire 17th and 18th centuries combined,
although during the Civil War, usage dropped by two-thirds (Bohm, 2003). It was not
7
until 1835 that New York outlawed public executions, moving the process indoors and
away from the public eye (Bedau, 1997, Bohm, 2003). Other states would soon follow,
with the last public execution held in 1937 in Galene, Missouri (Bohm, 2003).
In 1846, the state of Michigan abolished the death penalty for all crimes (Bedau,
1997; Bohm, 2003; Dike, 1981) and during this period, the death penalty was
eliminated in most European countries (del Carmen, 2002). In addition, Tennessee was
the first state to implement a discretionary death penalty statute for murder in 1838, but
more than a full century would pass before, in 1963, all states would eliminate
mandatory death penalties. In 1852 Rhode Island would repeal the death penalty,
followed by Wisconsin in 1853 (Bedau, 1997; Bohm, 2003). Abolition in Ohio and
Pennsylvania would quickly follow, although many of these states would later reinstate
the death penalty (Bedau, 1997).
The first state-imposed execution would not take place until the Civil War
(Bohm, 2003; Dike, 1981). Nevertheless, in 1890 over 90 percent of executions were
still carried out under local authority (Bohm, 2003). Hanging was the first lawful
means of execution (Bohm, 2003) and would remain so for the first 100 years (Dike,
1981). The electric chair was invented in New York in 1888 (Bedau, 1997), but was
not used until two years later in 1890 (Dike, 1981). This method was followed by firing
squad, lethal gas, and finally, the method preferred today – lethal injection (Bohm,
2003). Lethal injection was first adopted in Oklahoma in 1977 (Bohm, 2003) and first
used in Texas in 1982 (Bedau, 1997). Although hanging had outlived its popularity, the
last hanging in the United States did not take place until 1996 in Delaware (Bedau,

8
1997) and the firing squad is still used in three states (Bohm, 2003). As late as 2001
electrocution was declared unconstitutional by the Georgia Supreme Court and lethal
injection has become the preferred method of execution in all states except Nevada
(Bohm, 2003; Death Penalty Information Center, 2006).
The twentieth century began with the repeal of capital punishment in 9 states.
Although it was believed at the time that all the other states would soon follow, this
never happened. By the 1920s many of the states that had repealed the death penalty
reinstated it (Bedau, 1997). In the South and in some states in the West and Midwest,
over 3,000 men and a few women, mostly black, were subjected to illegal executions
called “lynchings”. Despite the fact that lynching was a capital crime itself, the mostly
white mobs were not deterred. Jesse Jackson would comment “So much for deterrence”
(Lifton & Mitchell, 2002, p. 37).
In no time period in America was the death penalty practiced more than during
the great depression when executions reached their highest levels of the entire twentieth
century (Bedau, 1997). According to Bohm (2003), despite a growing demand for
abolition, in 1935, 199 persons were executed and an average of 167 persons per year
was executed during the nineteen-thirties.
In the 1950s executions began to decline, partly because after World War II,
many allied nations abolished the death penalty (Bohm, 2003). Two cases in the 1950s
galvanized the debate about the death penalty, but not in the same way. A poll
conducted after the executions of accused cold war spies Julius and Ethel Rosenberg
found that over 70 percent of Americans supported the death penalty. This was the
9
highest level of support ever attained for capital punishment (Bohm, 2003; Lifton &
Mitchell, 2002). Caryl Chessman’s case was an entirely different matter. Caryl
Chessman was convicted in 1948 on 17 counts including kidnapping and attempted
rape. What the American people saw was the lack of efficiency and purpose when after
12 years of legal battles, Caryl Chessman was finally executed. Support for the death
penalty began to wane (Bohm, 2003; Lifton & Mitchell, 2002).
The level of support for the death penalty dropped in 1966 to only 42 percent –
the lowest level of support ever recorded (Bedau, 1997, Bohm, 2003, Dike, 1981) and
in 1968 executions ceased as the death penalty was being challenged in the United
States Supreme Court. In 1972, Furman v. Georgia came before the Supreme Court.
The court found that the death penalty had been applied in “an arbitrary and capricious
manner” and therefore its application was unconstitutional. The death penalty itself was
not found to be unconstitutional, but the court felt that there were no legislated
standards and that juries could apply the death penalty to any murder case regardless of
circumstances. They also felt that the death penalty violated the rights of minorities
who were sentenced to death more often than whites (Furman v. Georgia, 1972). This
effectively commuted 629 sentences of death in 40 jurisdictions (Michigan State
University 2006). The moratorium on the death penalty would not be lifted until Gregg
v. Georgia (1976) in which the Supreme Court reaffirmed the constitutionality of the
death penalty (Bedau, 1997). Reforms included bifurcated trials in which guilt and
punishment were assessed separately, automatic appellate review, sentencing guidelines
and proportionality review (Michigan State University, 2001).
10
Gary Gilmore became the first person to be executed after the ruling in Gregg v.
Georgia (1976) and the first since 1967. In 1977 Gary Gilmore died by firing squad in
Utah (Sheldon, 2001). In 1982, Charles Brooks, Jr. was executed in the State of Texas
and became the first to die from a lethal mixture of sodium thiopental, pavulon and
potassium chloride. This method would become known as lethal injection and is the
most widely used today (Lifton & Mitchell, 2002). Currently, 38 states retain the death
penalty as do the federal government and United States military. Since the ruling of
Gregg v. Georgia (1976), 1014 persons have been executed. In 2005, 60 people were
executed in the United States and as of September 9, 2006, 41 persons have been
executed, 20 in Texas alone. Currently, there are 3,370 people waiting on death row,
with almost one-third of those in just two states - California (652) and Texas (404).
There have been 123 death row exonerations since 1973 (Death Penalty Information
Center, 2006).
Debate about the death penalty continues into the twenty-first century. In
January of 2000, Governor Ryan of Illinois placed a moratorium on executions in the
state of Illinois after discovering that the state had executed 12 people, but exonerated
and released 13 people who had been condemned to die. As his last act of office,
Governor Ryan generated an outpouring of controversy when he granted clemency to
the remaining 156 Illinois death row inmates (Death Penalty Information Center, 2006).
His actions ignited anger in victim’s right proponents and elation for persons who
oppose the death penalty (Death Penalty Information Center, 2006). In 2002, the
Supreme Court held that it is unconstitutional to execute defendants who are mentally

11
retarded (Atkins v. Virginia, 2002) and as recently as 2005 the Supreme Court ruled that
the execution of those who commit murder as juveniles is unconstitutional (Roper v.
Simmons, 2005).
1.2 Deterrence Theory
According to del Carmen (2002) deterrence is a frequently used justification that
advocates for the punishment of persons based on the concept that the applied
punishment will discourage or prevent others from engaging in criminal conduct. The
goal of general deterrence is to convince potential criminals that crime brings dreaded
consequence and therefore is not worth the price (Siegel, 1998). In his book “On
Crimes and Punishment”, Beccaria proposed the notion that people make choices based
on the rational calculation of costs and benefits. His stand was that punishment should
not exceed the crime, but rather be fitting to the crime. This, he believed, would deter
persons from committing crime (Beccaria, 1996).
Beccaria’s theory became the basis for modern criminal justice systems, but the
expected decline in crime did not occur (Gibbs, 1968), and deterrence theory was
largely ignored and dismissed until 1968 when Jack Gibbs attempted to test deterrence
(Vold, Bernard & Snipes, 2002). Gibbs used two variables, certainty of punishment and
severity of punishment. Certainty of punishment was defined by the admissions to state
prisons compared to crimes known to the police the prior year. Severity of punishment
was defined as the mean number of months served by all people convicted of given
crimes and in prison during the same year. Gibbs found that although both greater
12
certainty and severity were associated with fewer homicides in 1960, certainty had
twice as great an effect as severity (Gibbs, 1968).
Tittle (1969) discovered that certainty was a more powerful predictor for
deterrence in all seven index crimes in the FBI’s Uniform Crime Reports, except for
homicide (Vold, et al., 2002). Contrary to Gibb’s findings however, the same study
found that greater severity was associated with more crime, and that although the
certainty of imprisonment had a deterrent effect, severity only deterred if certainty was
high (Tittle, 1969). These findings would not go unchallenged, however. Using data
from National Prisoner Statistics and Uniform Crime Reports, Chiricos and Waldo
(1970) found that the inconsistency of findings might be explained better by police
record keeping, and suggested that many sources used to measure deterrence were
inadequate.
Beccaria (1996) said that “the penalty of death is ineffectual because of the
barbarity of the example it gives to men” (p. 58). Some scholars theorize that the death
penalty might have a brutalizing effect rather than deterring crime (Bailey, 1998;
Bedau, 1997; Bohm, 2003; Glaser & Zeigler, 1974; Sellin, 1959; Tittle, 1969; Vold, et
al., 2002), while del Carmen (2002) further suggests that the theory of general
deterrence is too absolute and does not take into account that certain people may be
deterred by certain laws. Radelet and Akers (1996) found that most criminologists do
not believe that the death penalty deters violent crime. In fact, states that have the death
penalty consistently have been found to have higher rates of murder than those states
without it (Bedau, 1997; Glaser & Ziegler, 1974; Vold, et al., 2002). Glaser and Zeigler
13
(1974) found that offenders serving time in death penalty states serve shorter sentences
if they are not executed than offenders serving time in non-death penalty states. This
led the authors to posit that there exists in death penalty states a much lower value of
human life (Glaser & Ziegler, 1974). Another study found that the average number of
felony murders after a highly publicized execution was only slightly lower after the
execution than before, but the findings were not statistically significant (Cochran,
Chamlin & Seth, 1994).
Deterrence is, however, the most socially acceptable reason for supporting the
death penalty and until recently has been the most popular reason people give as a
reason for supporting the death penalty (Bohm, 2003). Bedau (1997) says that during
the seventies the most common reason for support of capital punishment was the
deterrence of crime. However, an increase in support of capital punishment, since a low
in 1966, has not relied on deterrence for support, but more on retribution (Bedau, 1997).
Ellsworth and Ross’ (1983) findings support Bedau’s assertion that deterrence was
becoming less of a factor in support for capital punishment; most proponents still
preferred the death penalty even if life in prison was proven to be a more effective
deterrent.
1.3 The Present Study
According to Black’s Law Dictionary (Garner, 1999) the death penalty is
defined as “state-imposed death as punishment for a serious crime – also termed capital
punishment” (p. 407). For the purposes of this study, the death penalty and capital
punishment are used interchangeably. In addition, the author has extended the

14
definition of the death penalty to include “… death as punishment for a serious
crime…” imposed by any state or national government.
Knowledge is defined by Webster’s New College Dictionary (2001) as “the state
or fact of knowing” (p. 610). The author will refer to “the state or fact of knowing” as
knowledge that any student returning a survey may have attained regarding capital
punishment at any point in his or her lifetime. Knowledge will not be limited to
information students may have acquired in college courses, but from any source
available to the student. Perception is defined by Webster’s New College Dictionary
(2001) as “insight, intuition or knowledge gained by perceiving” (p. 816). The terms
“attitude” and “opinion” may be used interchangeably or simultaneously with the word
“perception”.
In this study, CRCJ or criminology/criminal justice student(s) will refer to either
undergraduate or graduate criminology/criminal justice student(s) whose major is
criminology/criminal justice. In addition, non-CRCJ or non-criminology/criminal
justice student(s) will refer to any undergraduate or graduate student(s) participating in
this study whose major is not CRCJ. Majority refers to students who identify
themselves as Caucasian, while minority includes all other ethnicities. The sample is
taken from the Spring 2006 semester.
Since the sample is taken from university students, it will not be possible to
generalize results to the general population. Also, students included in this study
attended a university in Texas. Their views and knowledge base may not be
representative of students in other universities across the United States. Texas is an

15
active death penalty state so opinions may be more conservative than in other states
where the death penalty is less prevalent or has been abolished. The study is feasible
because the author had access to students from the university through classes offered in
the Spring of 2006.
Filling the gap in the current literature may provide meaningful data for not only
scholarly discourse, but also for politicians and criminal justice professionals. Although
several studies have examined the differences between criminal justice majors’ and
non-majors’ knowledge and perception, none have done so in the state of Texas, an
active death penalty state that has been responsible for almost half the executions thus
far in 2006 (Death Penalty Information Center, 2006). It is anticipated that this study
will further the understanding of how knowledge impacts perceptions and opinions of
the death penalty. Further, it is anticipated that this study may further illuminate the
differences or lack of differences in knowledge and perception of CRCJ and non-CRCJ
majors. Since CRCJ majors and non-majors will become the policy makers of
tomorrow, it is important to understand how knowledge impacts opinion about the most
severe punishment that American society administers. It is also important to understand
whether CRCJ majors have any greater knowledge regarding the death penalty and how
that may impact their opinions about the death penalty. It is anticipated that this study
will add to the existing literature base.
In the next chapter, a review of the literature will be presented. A history of
capital punishment will be presented, followed by more specific information about the
death penalty in the United States, including methods of execution, the debate over
16
abolition in America and controversy about public executions. Since race is such a
relevant area of study within the parameters of death penalty studies, a section on
capital punishment and race is included. Important Supreme Court cases are also
discussed. Studies relating to perception and knowledge among American citizens will
be presented, followed by studies addressing perception and knowledge among college
students, and finally studies that address the knowledge and perceptions of criminal
justice or criminology/criminal justice students. In chapter 3, the author discusses the
design and methodology of the study, while chapter four contains the statistical
findings. Last, in chapter five, the author will include a discussion of the findings,
policy implications and suggestions for further research.
17
CHAPTER 2
LITERATURE REVIEW
The review of the literature will examine first the history of the death penalty,
including early death penalty laws, a description of executions throughout the ages,
focusing first on executions in England and then in the early American colonies,
through the end of the Civil War and up to the twenty-first century. Included in the
literature review are landmark Supreme Court cases that have shaped the direction of
capital punishment in the United States. Key decisions included are Furman v. Georgia
(1972), Gregg v. Georgia (1976), Atkins v. Virginia (2002) and Roper v. Simmons
(2005). Also included in the literature review are a history of the opposition movement
and a history of how capital punishment has been perceived from the viewpoint of
minorities and non-minorities. The literature review concludes with a comparison of
studies examining perception and knowledge in the United States and a review of
studies that have examined the perceptions and knowledge levels among college
students. The objective of the literature review is to present background and studies
that reveal the importance of meaningful research and lack thereof conducted in the
State of Texas among criminology/criminal justice students and their counterparts who
choose to major in other disciplines.
18
2.1 The History of Capital Punishment
The death penalty is one of the oldest forms of punishment (Shelden, 2001).
Some of the oldest laws date back to the Code of Hammaurabi (Lifton & Mitchell,
2002) and were viewed as ways to appease God (Johnson, 1998; Lifton & Mitchell,
2002). Early patriarchs condemned their own family members to death (Death Penalty
Information Center, 2006; Johnson, 1998) and executions were often formal, day-long,
public affairs. Some of the earliest methods of execution included drowning, beating to
death, stoning, crucifixion, burning and impaling (Death Penalty Information Center,
2006; Johnson, 1998). Hanging became common during the 10th century, but by the
16th century, some of the commonly used methods in England were beheading, boiling
and drawing and quartering the condemned (Death Penalty Information Center, 2006).
In America by the end of the Civil War, a more humane method to hanging was being
sought. In response the first electric chair was built in 1888 and used in 1890 for the
first time (Death Penalty Information Center, 2006). Other methods used in America
would be firing squad and gas chamber, before lethal injection would be used for the
first time in Texas in 1982 (Bedau, 1997; Death Penalty Information Center, 2006).
2.1.1 Early Death Penalty Laws
The first death penalty laws date back as far as the Code of Hammaurabi of
Babylon and the fourteenth century’s Hittite Code. Under King Hammaurabi, 25
crimes were codified as capital crimes. These included the crimes of sorcery and
making false accusations of murder (Lifton & Mitchell, 2002). Mosaic law was based
on proportionality and introduced in order to limit the application of the death penalty.
19
Most of these early codes were based on the concept of lex talionis (an eye for an eye)
(Lifton & Mitchell, 2002) and implemented in order to appease God (Johnson, 1998).
In Greece around the year 621 B.C. almost all crimes were punishable by death,
even those as minor as stealing salt. Draco believed that even minor crimes deserved
the penalty of death, and that through this practice only the “good” would survive. The
Draconian code was so harsh, however, that it could not be enforced for long and it was
soon revised (Lifton & Mitchell, 2002).
In the Roman Republic, the Law of the XII tablets called for the death penalty,
but not equally for everyone. If a slave were convicted of killing a freed man, he could
die for his crime, but the freed man would not die for killing the slave. Class had its
distinctions and slaves were viewed as less than human, while juveniles were afforded
lighter punishments for their crimes than were similarly situated adults for the same
offense (Lifton & Mitchell, 2002).
In Europe, capital offenses included sorcery, sexual aberrations and bestiality
(Lifton & Mitchell, 2002). In 1500, England only had 8 capital crimes (del Carmen,
2002). However, between 1714-1830, English Parliament had succeeded in creating
156 new capital crimes (Tonry, 1996) and by 1800, England’s Bloody Code codified
over 200 capital offenses (del Carmen, 2002) including treason, murder, manslaughter,
rape, robbery, burglary, arson, counterfeiting, theft (Banner, 2002), cutting down trees
and robbing a rabbit warren (Death Penalty Information Center, 2006). Under Henry
VIII it is estimated that more than 72,000 persons were executed (Michigan State
University, 2001) and that one could be executed for numerous crimes, including

20
marrying a Jew, not confessing to a crime and for treason (Death Penalty Information
Center, 2006). Most of these new crimes were property crimes (Dike, 1981; Tonry,
1996) that tended to target the poorest citizens (Dike, 1981). These were considered the
harshest laws in all Europe (Banner, 2002). Even so, juries began to refuse to convict
(Death Penalty Information Center, 2006, Dike, 1981; Tonry, 1996) and the accused
began to claim the benefit of clergy to avoid execution. Many of those who were
sentenced to death were never executed (Tonry, 1996) and by 1861 only 4 crimes were
considered capital offenses (Dike, 1981).
2.1.2 Executions throughout the middle ages
Early tribal patriarchs were known for condemning their own family members to
death in order to please God (Death Penalty Information Center, 2006, Johnson, 1998),
and as far back as early Babylon, Hammurabi’s Code delineated 25 crimes for which
one could be executed. During the Imperial Age of Rome, Christians, criminals and
errant slaves were brought before cheering masses in public coliseums and literally
thrown to the lions (Johnson, 1998). After the fall of Rome, there was little formality,
but executions were a daily occurrence. In Nuremberg around the year 1000, the
prosecutor would bring the offender to the public marketplace and conduct a trial. If the
offender was found guilty, the aggrieved party would hang the offender on a post, string
him up on a tree or whatever was close by and leave him to die a slow death by
strangulation (Johnson, 1998). However, by the year 1400, torture was producing
confessions behind prison walls and trials were no longer public. Punishment followed
21
swiftly, but citizens were no longer responsible for carrying out executions. Rather, an
officer of the court was assigned the grim duty (Johnson, 1998).
Executions were celebrated with grand banquets and formal parades, including
the presence of dignitaries. The prisoner was required to forgive his executioner and
then he would be allowed to address the crowd since executions at this time were
public. Many prisoners were simply too frightened to carry out this task and would be
held up by members of the execution party. The method of execution was particularly
brutal. One method was hanging to the near point of death, then cutting down the
prisoner and while still alive and conscious, draw and quarter him. Drawing and
quartering involves the carving out of the intestines and cutting of the person into four
pieces. Breaking on the wheel involved propping the prisoner up, and breaking his
arms and legs in several places. Then the prisoner was turned rapidly on the wheel
scattering his body parts about until he was dead (Johnson, 1998). Another variation
was hanging by the feet and sawing in two vertically. These punishments were reserved
for the common criminal. The more grievous offender could expect his punishment to
be prolonged. Other variations included the addition of pouring burning wax into the
offender’s wounds or the tearing of flesh. Crowds would often encourage greater
violence upon the condemned (Johnson, 1998).
Execution during the Inquisition involved mass executions whereby the
offenders were to be paraded through the village in a grand procession and moved onto
a stage built for the execution itself and before the King. Executions during this time
were day long events, often coinciding with a marriage or coronation, and with the
22
reading of charges sometimes taking hours. The condemned were placed in cages for
all to view and to await their fate. Offenders who resisted were burned alive, while the
more repentant were fortunate enough to be strangled before being burned (Johnson,
1998).
Early legal codes came to endorse the practice of proportionality, and although
meant to curb the excess of execution, this argument – lex talionis – was actually used
to endorse capital punishment. Some of the methods of early executions included
crucifixion, drowning, beating to death, impalement, burning the offender alive (Death
Penalty Information Center, 2006) or stoning (Johnson, 1998). Executions during the
middle ages were well attended public functions. Not only would men and women
attend, but so would children. The condemned were paraded through the streets where
a carnival-like atmosphere prevailed. Church leaders were responsible for ritualizing
the execution, blessing the ceremony and reading biblical passages. Sometimes animals
were executed for having killed or having had sexual intercourse with a human. Their
fate would be much the same as their human counterparts – they would be hanged,
burned or even buried alive for their transgressions (Lifton & Mitchell, 2002).
2.1.3 Executions in England
During the 10th century, hanging was the usual method of execution in England,
but by the 16th century, it would be replaced by a virtual cornucopia of choices. Under
Henry VIII, 72,000 persons would be executed by means such as boiling, burning at the
stake, hanging, beheading, or drawing and quartering (Death Penalty Information
Center, 2006). Executions in England during the time of the Bloody codes differed
23
according to class. Those of the upper class could look forward to a “painless”
beheading. The unfortunate lower classes, however, would endure great torture at the
hands of their executioners. Sometimes when hanging a member of the lower classes,
the executioner would prolong the hanging. At other times the condemned would be
drawn and quartered, broken at the wheel, burned at the stake, disemboweled or
dismembered (Johnson, 1998; Lifton & Mitchell, 2002). Women were drowned unless
they were thought to be witches; tens of thousands of women were burned alive because
they were believed to be witches (Lifton & Mitchell, 2002). The grisly results of
disemboweling and beheading were displayed to the masses and people became
revolted by the practice (Johnson, 1998).
With the change in sensibilities among the public, a cap was placed over the
face of the condemned to conceal his agony and provide some privacy in such a public
death. As in earlier periods, the church ritualized the execution of criminals by saying
special prayers and the ringing of church bells. If the condemned was able, for they
were often inebriated or hung over, from drinking too much the night before or on the
way to the gallows, he was to drop a handkerchief signaling his readiness to die. The
privileged went to their death wearing their best clothes, and often meals were served at
private parties after an execution (Johnson, 1998). The citizenry, including children,
were not only encouraged to attend executions, but to visit condemned prisoners in their
cell, thereby learning what coming to a bad end could bring. It would not be until the
later part of the 19th century that the crowds would disappear from the execution
spectacle, when executions were moved inside and out of public view (Johnson, 1998).
24
2.1.4 Opposition to Capital Punishment
In 428 B.C. the first known debate on the death penalty occurred in Athens,
Greece. During the Polynesian War, Mytilene, an Athenian city, decided to join forces
with Sparta. In order to put down the rebellion, the decision was made to execute the
instigators which happened in short order. Soon, the Athenian Assembly decided to
execute the entire male population of Mytilene. Diodotus, the son of Eucrates,
desperately trying to get the order rescinded engaged in debate with Cleon, who argued
for vengeance saying that the executions would deter further insurrection. Diodotus
argued that Athens should act in its own best interests and not take revenge. Diodotus’
argument resonated and the executions were prevented (Lifton & Mitchell, 2002).
In eighteenth century England, Samuel Romilly, England’s most prominent
prison reformer, began to advocate for abolition of the death penalty because he
believed that the laws were unfairly applied and this erratic application ultimately
undermined the law’s deterrent effects (Tonry, 1996). Over time, executions in
England became less frequent as capital crimes became more numerous. By 1819,
capital crimes numbered more than 220 (del Carmen, 2002; Tonry, 1996), while
executions numbered from 21 per year to a high of 53 per year. Juries were refusing to
convict for the minor offenses which had been classified as capital or chose to convict
of lesser offenses which did not warrant the death penalty. Others would claim benefit
of clergy to save themselves, while the number of those sentenced to death fell as well.
Courts might also look for technical discrepancies which would eliminate the

25
imposition of the death penalty, such as the misstatement of an offender’s occupation or
the misspelling of his name (Tonry, 1996).
It would not be until the middle of the eighteenth century that Cesare Beccaria
would emerge as the catalyst for the abolition of capital punishment (Lifton & Mitchell,
2002; Sellin, 1967). Beccaria believed that life imprisonment was a greater deterrent
than capital punishment, and believed further that the death penalty only served to
increase the barbarity of man (Beccaria, 1996). Beccaria’s On Crimes and Punishment,
published in 1764 had a strong impact on the abolitionist movement. Beccaria believed
that there was no justification for state sponsored execution and that belated
determinations of innocence would be all the more tragic (Beccaria, 1996). Beccaria’s
influence in Europe led to the abolition of capital punishment for most crimes (Lifton &
Mitchell, 2002).
2.2 Capital Punishment in the United States
Capital punishment in America had its roots in English law and was brought to
America by the first colonists (Bedau, 1997). The first known execution took place in
Virginia in 1622 when Daniel Frank was executed for theft (del Carmen, 2002). The
Massachusetts Bay Colony recorded some of the earliest death penalty statutes in 1636.
Witchcraft, idolatry and blasphemy were among the first crimes for which one could be
executed (Dike, 1981). Other crimes punishable by death included sodomy, man
stealing, treason and homicide committed with malice (del Carmen, 2002). However,
not all death penalty law would be created equally and statutes would vary from one
26
colony to another (Lifton & Mitchell, 2002). In early Pennsylvania only murder and
treason were punishable by death (Bedau, 1997).
By 1793 Pennsylvania would see the growth of a reform movement when the
Quakers began to insist that murder be differentiated by degrees. In 1794, Pennsylvania
adopted degrees of murder, with only first degree murder eligible for death (Dike, 1981;
Lifton & Mitchell, 2002). Many other states followed Pennsylvania’s lead (Bedau,
1997; Bohm, 2003), but the Quakers’ ultimate goal was complete abolition of the death
penalty (Bedau, 1997; Dike, 1981). This idea would not be recognized; by the end of
the eighteenth century, over 1500 persons had been executed in America (Lifton &
Mitchell, 2002).
The use of capital punishment continued to flourish in the nineteenth century.
Sixty percent more people were executed in this century than during the entire 17th and
18th centuries combined (Bohm, 2003). These executions had become public, day-long
affairs, but in 1835 New York outlawed public execution and moved the process away
from the prying eyes of the public (Bedau, 1997; Bohm, 2003). Other states would
follow New York’s lead and by 1937, no state held public executions (Bohm, 2003).
During the 19th and 20th centuries, states would abolish and many later reinstate
the death penalty (Bedau, 1997; Bohm, 2003; Dike, 1981). In 1846, Michigan would
abolish the death penalty for all crimes (Bedau, 1997; Bohm, 2003; Dike, 1981) as
would most European nations (del Carmen, 2002). Tennessee became the first state to
implement a discretionary death penalty statute in 1838, but it would not be until 1963
before all states eliminated mandatory death penalty statutes. In 1852 Rhode Island
27
repealed the death penalty, followed just one year later by Wisconsin (Bedau, 1997;
Bohm, 2003). Abolition in Ohio and Pennsylvania followed, but many of these states
would later reinstate the death penalty (Bedau, 1997).
The first state imposed execution would not occur until 1864 (Bohm, 2003;
Dike, 1981). However, by 1890, more than 90 percent of executions were imposed
under local authority (Bohm, 2003). Hanging was the first lawful method of execution,
but would be followed by the electric chair in 1890 (Dike, 1981). Later methods would
include firing squad, lethal gas, and lethal injection (Bohm, 2003). Hanging had fallen
out of favor, but the last hanging did not occur until 1996 in Delaware (Bedau, 1997)
and the firing squad is still legal in three states (Bohm, 2003).
2.2.1 Beccaria’s Influence in the United States
The Catholic Church banned Beccaria’s book. Thus in America, Protestants
would emerge as the leading religious body to oppose capital punishment. Probably
around 1769, George Washington and Thomas Jefferson purchased copies of Beccaria’s
book “On Crimes and Punishment” (Lifton & Mitchell, 2002). Thomas Jefferson was
inspired by Beccaria’s writings (Death Penalty Information Center, 2006; Lifton &
Mitchell, 2002) and, although unsuccessful, introduced a bill to reform Virginia’s
capital punishment statutes, proposing that the death penalty only be applied in cases of
murder and treason. (Death Penalty Information Center, 2006).
Benjamin Rush, founder of the Pennsylvania Prison Society (Michigan State
University, 2001) and signer of the Declaration of Independence, was another early
abolitionist (Death Penalty Information Center, 2006). He believed, like Beccaria, that
28
the death penalty was not a deterrent, but rather had a “brutalizing” effect (Death
Penalty Information Center, 2006). Further, Rush believed that criminality was an
illness and thus an involuntary condition, and that the Bible did not necessarily support
capital punishment (Lifton & Mitchell, 2002).
Benjamin Rush gained the support of influential persons such as Benjamin
Franklin and Pennsylvania Attorney General William Bradford (Lifton & Mitchell,
2002). It would be at Benjamin Franklin’s home where Dr. Rush would read “An
Enquiry into the Effects of Public Punishments upon Criminals and upon Society”. Dr.
Rush’s paper was the first in America to present a reasoned argument against capital
punishment (Sellin, 1967). Benjamin Franklin believed that killing a man for a crime
that did not warrant the death penalty was murder (Lifton & Mitchell, 2002). It would
be Bradford who would lead the effort to consider degrees of murder in the application
of capital punishment. By 1794, Pennsylvania had abolished the death penalty for all
crimes except first degree murder (Death Penalty Information Center, 2006). In 1796,
three other states would decrease the number of capital crimes (Lifton & Mitchell,
2002). The abolitionist movement would gain the strongest hold in the Northeast
United States. Many states began to build more penitentiaries (Death Penalty
Information Center, 2006, Lifton & Mitchell, 2002) and limit the number of crimes
eligible for the ultimate punishment of death. In 1846 Michigan would execute only for
persons convicted of treason, while Rhode Island and Wisconsin abolished capital
punishment in its entirety. Many states passed laws against mandatory death sentences,
while other states retained capital punishment for some crimes, especially crimes that

29
were committed by slaves. By 1963 no crimes in the United States would be subject to
mandatory capital punishment (Death Penalty Information Center, 2006).
Opposition to capital punishment would not remain static, however. Although
between 1907-17 six states would abolish or limit the death penalty, many would
reinstate it. By 1920, five of the six states had reinstated capital punishment. Between
1920 and 1940, many social scientists would influence the resurgence in support of the
death penalty by writing that capital punishment was a necessary social measure.
Throughout the Great Depression and Prohibition, the United States would execute an
average of 167 persons per year – more than in any other decade (Death Penalty
Information Center, 2006).
It would not be until the 1950s that public support for the death penalty would
begin to wane when many allied nations abolished the death penalty. In the forties,
there were 1289 executions. By 1950 executions declined to 715 and to 191 between
1960 and 1976. In 1966 for the first time, a minority of Americans – just 42% -
supported the death penalty. Public sentiment began to influence Supreme Court
decisions around this same time (Death Penalty Information Center, 2006).
In other parts of the world, Canada, Venezuela, Portugal, the Netherlands, Costa
Rica, Brazil and Ecuador would also abolish capital punishment (Death Penalty
Information Center, 2006). According to Amnesty International (2006), the death
penalty has also been abolished in France, Germany, Italy, the Czech Republic,
Hungary, Angola, Sweden, Spain, the United Kingdom, Africa and many others for all
crimes and in yet other countries in which the death penalty has not been abolished by
30
law, it is no longer practiced. Other retentionist countries include Japan, Lebanon,
Jordan, Afghanistan, Vietnam, Thailand and Saudi Arabia (Michigan State University,
2001).
2.2.2 Capital Punishment during the Civil War: North and South
During the Civil War efforts to abolish the death penalty would diminish as
more people became focused on the anti-slavery movement (Death Penalty Information
Center, 2006). Capital punishment was more common in the South and more often
applied to black slaves, who many felt had to be controlled. Conversely, in the North
by 1860, the only capital crimes were murder and treason. Many of the capital crimes
in the South were slave related, such as slave stealing (Banner, 2002). During the
1830s, the state of Virginia proscribed 5 capital crimes for whites, but more than 70 for
black slaves and by 1848 had passed laws requiring that any crime that mandated more
than 3 years prison time for a white person be elevated to the death penalty for blacks.
(Radelet, 1989). By the time of the Civil War, however, every Southern state
proscribed for whites punishments other than death for what had been capital crimes
into the late 1800s. There was little debate about capital punishment, but blacks were
being executed in far greater numbers than where whites. In Virginia, between 1800-
1860, all whites who were hanged were executed for murder. However, only about half
the blacks executed had been convicted of murder. In Louisiana and Kentucky, all the
whites executed were hanged for murder, whereas more blacks were hanged for slave
revolts, rape and attempted murder than suffered the fate for murder (Banner, 2002).
31
After the end of the Civil War, more “humane” methods of execution would be
sought and one of these would become the electric chair (Death Penalty Information
Center, 2006, Bohm, 2003). The electric chair had become a battle between two
corporate giants – Westinghouse and Edison Companies. Edison tried to show that
Westinghouse’ alternating current was too dangerous for use by publicly electrocuting
animals. About this time, the Governor of New York had appointed a three member
panel to find a more humane alternative to hanging. Alfred P. Southwich, a dentist
from Buffalo, persuaded the Governor that electrocution was more humane and
garnered the support of Edison, even though Edison opposed capital punishment
(Bohm, 2003). The first electric chair would be built in 1888 and used for the first time
in 1890 when New York executed William Kemmler (Bohm, 2003; Death Penalty
Information Center, 2006).
2.2.3 Race and Capital Punishment
Stephen Bright (1995), director of the Southern Center of Human Rights said
…only those oblivious to the brutal history of racial discriminationin American history would deny the danger of racial prejudice enter-ing the decisions which lead to the imposition of a death sentence. (p.6)
What Bright was referring to was the imposition of capital punishment upon
African-Americans in disproportionate numbers (Bright, 1995). It is estimated that for
every 533 blacks executed for crimes against whites, only 1 white is executed for a
crime against a black person (Radelet, 1989). Bright also refers to the historical
predecessor of the modern death penalty – lynching (Bright, 1995). According to Sellin
(1959), lynchings occurred almost exclusively in Southern states that retained the death
32
penalty. Illegal lynching was not uncommon after the end of the Civil War (Johnson,
1998; Sellin, 1959), but prior to the end of the Civil War, lynching of African-
Americans was a less common offense because slaves were considered property
(Johnson, 1998). Once free, however, slaves lost their value and were subject to racial
violence and killing by hate groups such as the Ku Klux Klan (Johnson, 1998), who
used the extermination of African-Americans as a way to maintain power and control
over the former slaves (Johnson, 1998; Marquat, Ekland-Olson & Sorensen, 1994).
Lifton and Mitchell (2002) estimate that between 1880 and 1920, 3000 mostly black
men and some women were lynched by white mobs, even though lynching was a capital
crime. Three states led the nation in lynchings: Georgia, Mississippi and Texas (Lifton
& Mitchell, 2002) and those lynched were almost exclusively African-American
(Johnson, 1998; Marquat, et al., 1994).
Several studies have examined race and the application of capital punishment
(Baldus, Woodworth & Pulaski, Jr., 1990; Garfinkel, 1949; Mangum, 1940; Ralph,
Sorensen & Marquat, 1992; Wolfgang, Kelly & Nolde, 1962; Wolfgang & Reidel,
1973; Wolfgang & Reidel, 1975) and have shown that blacks may be subject to more
extreme penalties as a result of prejudice. Some studies show a strong correlation
between capital punishment and race of the victim, but little support for any correlation
between capital punishment and race of the defendant (Baldus, et al., 1990; Garfinkel,
1949; Johnson, 1941; Radelet, 1981; Ralph, et al., 1992). When the victim was white,
the defendant was more likely to receive a sentence of death, while blacks who killed
other blacks were the least likely to receive a sentence of death (Baldus, et al., 1990;
33
Johnson, 1941; Radelet, 1981; Ralph, et al., 1992). Garfinkel (1949) found that white
defendants were more likely than black defendants to receive the death penalty, but like
Baldus, et al. (1990), his findings suggested that the race of the victim had a greater
correlation with the application of the death penalty; only 5 percent of persons
convicted of killing black victims received death compared to 24 percent who killed a
white victim (Garfinkel, 1949). These studies may tend to indicate a racial bias in the
application of the death penalty.
2.2.3.1 Rape, Race and Capital Punishment
In 1965, every man executed in Virginia for rape, was black. This was not an
anomaly. Between 1930-62, in the eighteen states authorizing the death penalty for
rape, 90 percent of those executed for rape were black men, and in five Southern
jurisdictions all persons executed for rape were black men (Baldus, et al., 1990). In
twelve southern states during the years 1945-65, 13 percent of blacks convicted of rape
were executed, while only 2 percent of whites convicted of the same crime received the
death penalty. Walker, et al. (1996) stated that 88.6 percent of those executed during
the years 1930-72 were African-American and that black men who raped white women
were more likely than all other racial combinations to receive the death penalty for rape.
(Wolfgang & Reidel, 1973; Wolfgang & Reidel, 1975).
There is no state since the ruling in Coker v. Georgia (1977) that still executes
for rape alone (Coker v. Georgia, 1977), but scholars suggest that capital punishment is
still being applied to African-Americans in disproportionate numbers (Johnson, 1998;
Marquart, et al., 1994) and that executed African-Americans tend to be significantly
34
younger than their white counterparts (Marquart, et al., 1994). In 1940, Mangum noted
that a greater number of black defendants were being executed than were white
defendants. More recently Johnson (1998) and Shelden (2001) note that while more
than 80 percent of persons executed have been convicted of killing a white person, half
of all murder victims are African-Americans. Other scholars have found that whites are
less likely than African-Americans to be executed once sentence is passed (Mangum,
1940; Wolfgang, et al., 1962). Furman v. Georgia (1972) may have narrowed
discrimination along racial lines, but it certainly did not eliminate it (Wolfgang &
Reidel, 1975).
2.2.4 Capital Punishment in the Twentieth Century
Between 1907 and 1917, known as the “progressive period”, the death penalty
was abolished in six states completely and three others limited the application of death
to treason and first degree murder of a law enforcement officer (Death Penalty
Information Center, 2006). These reforms would, however, be short lived. Fear of
revolution in the United States became very real in the wake of the Russian Revolution.
Americans feared that socialists would challenge capitalism. With the entry of the
United States into World War I, the death penalty would be reinstated in five of these
six states by 1920 (Bohm, 2003; Bedau, 1997; Death Penalty Information Center, 2006;
Lifton & Mitchell, 2002).
From the 1920s through the 1940s, capital punishment became more widely
accepted as leading criminologists began writing articles espousing the benefits of
execution as a necessary social control (Death Penalty Information Center, 2006, Bohm,

35
2003). Primarily in the South over 3,000 men and some women were subjected to
lynching, a form of illegal execution practiced overwhelmingly against African-
Americans. White mobs, well aware that lynching was a capital crime, were not
deterred. Legal executions increased as well. Perhaps as a response to the influences
exerted by influential scholars, more people were legally executed throughout the 1930s
than in any decade previously or since then. An average of 167 persons each year lost
their lives to the executioner during this decade (Death Penalty Information Center,
2006, Bohm, 2003).
By the 1950s, the preference for execution declined as many allied nations
abolished the death penalty (Death Penalty Information Center, 2006). In the United
States, however, the Julius and Ethel Rosenberg spy case inflamed many people,
resulting in an approval rate of 70% in favor of capital punishment. This would be the
highest level of support until the 1980s (Bohm, 2003). The case of Caryl Chessman
was an entirely different matter however. Chessman had been convicted of several
counts of kidnapping as well as attempted rape and sentenced to death. As Chessman’s
fight for his life waged over twelve years, the public’s support for capital punishment
began to subside (Bohm, 2003; Lifton & Mitchell, 2002).
Executions had declined from a high in the 1940s of 1289 to just 191 during the
years 1960-1976. In 1972, the Supreme Court halted executions by their decision in
Furman v. Georgia (1972). However, most states would implement new legislation that
would pass constitutional scrutiny in a consolidated case which would become known
as Greg v. Georgia (1976). In 1977, Gary Gilmore became the first person executed

36
since 1967 (Lifton & Mitchell, 2002). Public support began to decline and for the first
and only time, in 1966, the majority of Americans opposed the death penalty (Death
Penalty Information Center, 2006, Bohm, 2003; Bedau, 1997; Johnson, 1998; Lifton &
Mitchell, 2002).
Technology would become a driving force in the debate about capital
punishment. In the 1970s two television representatives sued for the rights to air an
execution. The Supreme Court denied their request and ruled that the public could be
fully informed without seeing firsthand the horrors of execution. Most Americans
agreed (Lifton & Mitchell, 2002), but this would not stop talk show host Phil Donahue
from making an unsuccessful attempt again in 1994. In 2001, the debate intensified as
Timothy McVeigh’s execution grew near. In the end, 80 percent of the American
public did not want to witness his death and although McVeigh was executed, the
public airing of his death never came to pass (Lifton & Mitchell, 2002).
In the nineties President Clinton would support tougher death penalty
legislation. In 1994, President Clinton signed into law the Violent Crime Control and
Law Enforcement Act (Michigan State University, 2001). Its effect was to expand the
federal death penalty to include 60 crimes, 3 of which do not include the act of murder;
espionage, treason and drug trafficking in large amounts (Death Penalty Information
Center, 2006; Michigan State University, 2001). Following the Oklahoma City
bombing, President Clinton signed into law the Anti-terrorism and Effective Death
Penalty act of 1996. This law speeded up the process of execution and limited review
(Death Penalty Information Center, 2006).

37
2.2.5 The Supreme Court and Capital Punishment
Constitutional challenges to capital punishment abounded during the 1960s as
the Supreme Court was asked to determine what constituted cruel and unusual
punishment, under the eighth amendment. It would be a wartime desertion case, Trop
v. Dulles in 1958 that introduced to the Court the notion of “evolving standards of
decency” and which would determine the course that public opinion would take in the
future of capital punishment (356 U.S. 86). Witherspoon v. Illinois (1968) would
establish the concept of “Witherspoon excludables”, whereby the Supreme Court held
that it was unconstitutional to exclude potential jurors because they express opposition
to the death penalty, but that jurors could be excluded if their opinion would prevent
them from following the law in imposing the death penalty. Coker v. Georgia (1977)
held that the rape of an adult woman, if she is not killed, does not warrant the death
penalty. The following sections discuss other important Supreme Court cases regarding
abolition and reinstatement, age, race, insanity and mental retardation.
2.2.5.1 Abolition and reinstatement: The Furman and Gregg decisions.
In 1972, the Supreme Court found not that the death penalty was
unconstitutional itself, but that its application was discriminatory and arbitrary (Furman
v. Georgia, 1972). Furman v. Georgia (1972) had the effect of temporarily voiding 40
death penalty statutes (Death Penalty Information Center, 2006). By 1976, however,
many states had rewritten their death penalty statutes and capital punishment was being
challenged in the Supreme Court once again with Gregg v. Georgia (1976). Other cases
incorporated into Gregg v. Georgia included Jurek v. Texas (1976), Proffitt v. Florida

38
(1976) and Roberts v. Louisiana (1976). These four cases came to be known as the
Gregg decision and affirmed that new state statutes limiting application and setting
standards for implementation of the death penalty were indeed constitutional. This time
the Supreme Court ruled that with the added discretionary element to the death penalty
statutes, capital punishment was now being administered such that it was constitutional
(Gregg v. Georgia, 1976). The Gregg decision was also responsible for the
implementation of bifurcated trials, automatic appellate review and proportionality
review (Death Penalty Information Center, 2006). Since Gregg v. Georgia (1976), the
Supreme Court has limited the death penalty, but never again abolished it.
2.2.5.2 Capital punishment, insanity and mental retardation
Ford v. Wainwright (1986) held that insane persons may not be executed, while
just three years later, Penry v. Lynaugh (1989) stated that the execution of mentally
retarded offenders was not in violation of the eighth amendment. However, Atkins v.
Virginia (2002) would rescind the ruling in Penry and hold that the execution of
mentally retarded offenders is cruel and unusual under the meaning proscribed by the
eighth amendment.
2.2.5.3 Age and Capital Punishment
Several Supreme Court decisions addressed the age at which offenders could be
constitutionally executed (Roper v. Simmons, 2005; Stanford v. Kentucky, 1989;
Thompson v. Oklahoma, 1988). Thompson v. Oklahoma (1988) held that execution of
offenders fifteen and younger at the time of their crimes is unconstitutional, while
Stanford v. Kentucky (1989) allowed for the execution of offenders who were 16 or 17
39
at the age of offense. Roper v. Simmons (2005) overruled both these cases and stated
that no one under the age of 18 at the time they committed their crimes may be
executed. Roper v. Simmons (2005) stated that in light of juveniles’ diminished
culpability, neither deterrence nor retribution can be considered adequate justification
for the imposition of the ultimate penalty.
2.2.5.4 Race and the Death Penalty
The Supreme Court did not limit itself to issues of mental capacity, age or
insanity. Race was a very important issue and two key cases highlighted the importance
of the Supreme Court’s role. Batson v. Kentucky (1986) ruled that potential jurors
cannot be excluded solely on the basis of one’s race. The Court reasoned that racial
discrimination in the selection of jurors violates the sixth and fourteenth amendments.
In McCleskey v. Kemp (1987), McCleskey introduced a statistical study showing that
the imposition of capital punishment depended in part upon the race of the victim and
accused. The Court, however, ruled that exclusion by race can only be held
unconstitutional when it can be shown that the exclusion was intentional and particular
to the case at hand (McCleskey v. Kemp, 1987).
2.2.6 Public Executions
Early executions were public spectacles intended to deter others from
committing crime (Lifton & Mitchell, 2002). During the Imperial age of Rome,
Christians, criminals and errant slaves would be paraded before cheering crowds before
being thrown to the lions (Johnson, 1998). During the Dark ages executions became
less formal, but were still public. The offender would be dragged to the public square,
40
hanged or strung up and allowed to slowly die by strangulation (Johnson, 1998). In the
middle ages, executions were public and assumed a party-like atmosphere (Lifton &
Mitchell, 2002) and not only were executions public, but during the Biblical era,
communities were expected to participate in the execution by stoning the offender to
death (Johnson, 1998). During the Inquisition, execution was a day long public event,
with the offender placed on public display and often burned alive before the crowd
(Johnson, 1998). In addition to the executions of humans, animals were also executed
publicly (Lifton & Mitchell, 2002).
In the American colonies, scaffolds were built so that the public could easily
witness the entire execution (Johnson, 1998). Public ceremonies for hangings could
take several hours or all day and would include sermons and speeches (Banner, 2002).
Executions were open to the public and the bodies of the executed might be displayed
for hours or days afterward (Lifton & Mitchell, 2002). Children were regularly sent to
executions because the viewing of capital punishment was considered to be a learning
experience (Banner, 2002). In the late 19th century execution began to fall out of favor
(Johnson, 1998; Lifton & Mitchell, 2002) as more penitentiaries were built and
rehabilitation became the preferred method of punishment (Lifton & Mitchell, 2002).
The wealthy and influential began to find execution distasteful (Lifton & Mitchell,
2002) and began to avoid executions (Johnson, 1998). Crowds had gotten out of hand
(Johnson, 1998; Lifton & Mitchell, 2002) and the upper class wanted nothing to do with
the rowdy lower class. Still others objected to the public display of executions because
they sympathized with the condemned (Lifton & Mitchell, 2002).
41
Pennsylvania was the first colony to move execution behind the prison walls
(Banner, 2002; Lifton & Mitchell, 2002) in 1834 (Banner, 2002). Only the relatives of
the condemned and a handful of public officials were allowed to witness the execution
(Banner, 2002). Pennsylvania was followed by New York, New Jersey and
Massachusetts the following year (Banner, 2002). While some believed that moving
execution behind prison walls would diminish its deterrent value, still others feared that
the numbers of executions would increase (Lifton & Mitchell, 2002). In any case,
moving executions out of the public purview did not then, or now, keep crowds from
gathering outside the prison walls (Lifton & Mitchell, 2002).
2.2.6.1 The debate over televising executions
By the 1950s, technology was influencing the debate over public execution and
by the 1970s two representatives for a Dallas, Texas television station had sued for the
right to air an execution. The U.S. Supreme Court ruled that the public could be well
informed without being subject to the spectacle of public execution, while 86% of the
American public expressed their opposition to public execution (Lifton & Mitchell,
2002). Death penalty opponent and talk show host Phil Donahue gained the
cooperation of a death row inmate and attempted to air his execution in 1994, but the
federal courts stopped him.
Sister Helen Prejean favored public execution, predicting that if the public could
see the horrors of execution, the death penalty would be abolished (Lifton & Mitchell,
2002). Journalist Greta Van Susteran agreed and suggested that executions were
barbaric and capital punishment could not withstand the exposure and outrage that

42
public execution would bring (Lifton & Mitchell, 2002). Several influential politicians
also made their opinions known. Senator Mark Hatfield attempted to get a bill through
that would require television coverage of executions, while Harry Connick, District
Attorney of New Orleans, believed that televising executions would certainly increase
deterrence (Lifton & Mitchell, 2002).
With the impending execution of Timothy McVeigh in June of 2001, public
execution once again became a hotly debated topic. Although 80% of Americans
opposed the public execution of McVeigh, Phil Donahue once again attempted to air a
public execution. Mike Wallace, believing that McVeigh’s execution would be clean
and painless, supported the idea, while Cokie Roberts of ABC said that society was
barbaric enough and opposed the idea. Ernest Van den Haag opposed it because he
believed that airing the execution would only shift sympathy from the victims to the
killer. The execution was not televised to the public and McVeigh was executed in
June, 2001 (Lifton & Mitchell, 2002).
2.2.7 Capital Punishment in the Twenty-first Century
The twenty-first century would ring in new controversy and additional
constitutional limits on capital punishment. In 2000, Attorneys Barry Scheck, Peter
Neufeld and Jim Dwyer would publish “Actual Innocence” advocating against the
application of the death penalty. Scheck, Neufeld and Dwyer (2000) would cite cases
of wrongful conviction, “junk” science, mistaken eyewitness identifications, sloppy
police work, prosecutorial misconduct and reliance on jailhouse snitches as reasons why
the death penalty should be abolished.

43
In 2000, Governor George Ryan instituted a moratorium on capital punishment
in the state of Illinois and in 2003 took the controversial step of commuting the death
sentences of all 167 persons on death row in that state – most to life in prison (Death
Penalty Information Center, 2006). The execution of Gary Graham in 2000 in Texas
(Stevenson, 2001) and Stanley “Tookie” Williams in 2005 in California (cnn.com,
2005) would further ignite the capital punishment debate. Not only was Graham only
17 at the time of the crime, but many advocates, and much evidence supported his
assertion that Graham was an innocent man (Stevenson, 2001). The impending
execution of Stanley “Tookie” Williams ignited controversy over whether a life
redeemed was worth saving. Williams would be executed December 13, 2005
(cnn.com, 2005).
The United States Supreme Court would continue to be active in death penalty
issues. The Court in Atkins v. Virginia (2002) banned the execution of the mentally
retarded and in 2005, Roper v. Simmons ended the executions of those persons who
were minors when they committed their crimes (Death Penalty Information Center,
2006). As recently as February 2006, the United States Supreme Court refused to
review the constitutionality of lethal injection (MSNBC.com, 2006).
2.3 American Death Penalty Knowledge
2.3.1 The Marshall Hypothesis
Supreme Court Justice Marshall was troubled by the public’s support of capital
punishment and believed that before public opinion should be considered in forming
constitutional standards that opinion should be scrutinized in two ways. First, death
44
penalty opinion must be based on an informed public that understood the death penalty,
its effects and how it was applied. Second, belief in the death penalty based on
retribution is unacceptable since the eighth amendment was constructed to prevent the
harsh realities of retribution (Bohm, 1987; Sarat & Vidmar, 1976), but those whose
belief in capital punishment was justified on the basis of retribution would not change
their opinions regardless of change in levels of knowledge (Sarat & Vidmar, 1976).
Further, he hypothesized that Americans knew little about the death penalty and if they
were better informed, Americans would find the death penalty unacceptable and
unconstitutional (Bohm, Clark & Aveni, 1991; Sarat & Vidmar, 1976).
2.3.2 The American Public and testing the Marshall Hypothesis
Since Marshall formulated his hypothesis, several researchers have attempted to
test what has become known as the “Marshall Hypothesis”. Sarat and Vidmar (1976)
first surveyed for opinions about the death penalty with 3 questionnaires administered to
200 adult residents of Amherst, Massachusetts and designed to measure support for
retribution, knowledge about the death penalty and support for or opposition to the
death penalty. After presenting a pretest and posttest to the same subjects, the
researchers’ findings indicate that respondents knew more about the way capital
punishment is applied, but little about its effects (Sarat & Vidmar, 1976). In addition,
knowledge tended to change some opinions and attitudes towards the death penalty.
Sarat & Vidmar’s (1976) findings indicated that Justice Marshall’s expectation that an
informed public would differ from an uninformed public were correct. While 40% of
the participants’ support diminished, 60% did not change at all (Sarat & Vidmar, 1976).
45
Another study was conducted by mail survey and obtained as part of the Texas
Crime Poll (Vollum, Longmire & Buffington-Vollum, 2004). Males, the affluent, more
educated and older persons were over-represented in this survey. Vollum, et al. (2004)
found that 82 percent of their sample supported the death penalty, while more than half
supported a moratorium in order to protect the innocent, to ensure competent legal aid
and acceptable levels of appeals (Vollum, et al., 2004). Although more than one-third
of respondents believed that minorities and the poor were not being treated fairly, a
majority were unwilling to support a moratorium based on class or race. Those who
support the death penalty were less likely to support a moratorium and Whites reported
more confidence in the death penalty than did Black respondents. Males and
Protestants expressed more confidence in capital punishment than did females or
Catholics, and those with lower incomes showed less support for capital punishment
and more support for a moratorium than their wealthier counterparts. Persons with less
than a high school diploma were more likely to support a moratorium than any other
education level. Some respondents showed a marked lack of confidence in the capital
punishment process, but nevertheless declined to support a moratorium on capital
punishment. Despite what many respondents felt to be the facts about capital
punishment, many still supported it based on a matter of principle (Vollum, et al.,
2004).
Ellsworth and Gross (1994) suggest that not only do people know little about the
death penalty, but that they hold strong opinions about capital punishment and do not
want to be bothered with more information. According to the Gallup Poll conducted in
46
1991, most people who cite deterrence as their main reason for supporting capital
punishment would still support it even if it were proven that the death penalty does not
reduce crime (Gallup & Newport, 1991). Although deterrence has been assumed to be
more socially acceptable, some scholars have suggested that changing social norms
have made retribution a socially acceptable reason for supporting the death penalty
(Ellsworth & Gross, 1994). Further, those who are opposed to the death penalty more
often oppose it only because they believe it is wrong, not because it may be applied
unfairly or that innocent persons could be executed (Ellsworth & Gross, 1994). This
may tend to indicate that for many persons, capital punishment is emotionally charged
and may have little to do with utility, knowledge or rational reasoning.
Bohm (1987) indeed argues that the reason most Americans knew little about
the death penalty during the years 1968-1977 was because the death penalty had ceased
to be a salient issue; it was not used once during those years (Bohm, 1987). Further,
Bohm (1987) asserts that there is little clarity about what support for the death penalty
actually means, and that when respondents are asked to apply the death penalty
themselves that support drops significantly.
2.3.3 Public Support
Scholars have found that while the majority of the American public favors
capital punishment, not everyone supports it to the same degree. Baumer, Messner and
Rosenfeld (2003) found that support varied across region with some regions reporting
as little as 50 percent and others as high as 90 percent. Metropolitan areas with either
relatively high or low levels of educational attainment report less support for capital

47
punishment. Conservative political climate, and regions where homicide rates are high
and numbers of African-Americans are greater report more support for the death
penalty. Overall, Baumer, et al. (2003) found that support averaged seventy percent.
Another study sampled 500 adult residents of the San Francisco Bay area during
the fall of 1974 using stratified random sampling (Ellsworth & Ross, 1983). Ellsworth
and Ross (1983) found that the majority would not support capital punishment for all
persons convicted. The majority of respondents were not knowledgeable about the
death penalty and indicated that even if their belief in deterrence was wrong, their
opinion would not change. Respondents tended to favor those responses which were
consistent with their attitude, although the majority did agree that more evidence would
be needed to convict someone on a capital charge (Ellsworth & Ross, 1983).
Researchers have found that married, white males, those who were parents,
conservative Republicans (Fox, Radelet & Bonsteel, 1990-91) southerners or westerners
showed greater support for capital punishment, while females (Whitehead &
Blankenship, 2000), those living in lower income neighborhoods and in households
head by females were less likely to support capital punishment. Male divorce rate and
unemployment had seemed to have no correlation with death penalty support (Baumer,
et al., 2003). Fox, et al.’s (1990-91) findings stemmed from their examination of the
National Opinion Research Center’s General Social Surveys (GSS) for the years 1972
through 1988.
Based on a mail survey of 1,000 Tennessee households, Whitehead and
Blankenship (2000) found that 65 percent of females and 80 percents of males support
48
the death penalty. Further, 26 percent of females support the option of life without
parole (LWOP), while only 12 percent of males support this option. An almost equal
percentage – 41 percent of men and 40 percent of women cite deterrence as their most
important reason for supporting the death penalty, followed by retribution, religion and
incapacitation. Both the majority of male and female respondents (74 percent and 54
percent respectively) say they would support capital punishment even if they believed
that innocent persons had been executed, while similar numbers of male and female
participants would continue to oppose capital punishment even if new information were
available supporting the utility of capital punishment (Whitehead & Blankenship,
2000).
Unever, Cullen and Roberts (2005) examined respondents to two surveys (2000
National Election Study and information gathered by the Gallup poll in 2000) in order
to assess weakly held attitudes about capital punishment. The NES data indicated that
almost one-third of respondents’ views about the death penalty were not strongly held
views. Persons who exhibited racial resentment, were authoritarians and attentively
watched local and national newscasts were less likely to weakly support the death
penalty. In fact, the factor most strongly correlated with strong death penalty support
was racial resentment. People who attended church more often were more likely to
show weak opposition to capital punishment (Unever, et al., 2005).
The Gallup poll data indicated that while one-third (34.5 percent) of Americans
strongly supported the death penalty, African-Americans were 3.4 times more likely
than Whites or those with higher incomes to have reservations about the death penalty.

49
Further, the two variables most positively associated with having reservations about
capital punishment were if one believed that capital punishment was applied unfairly or
that innocent persons had been executed (Unever, et al., 2005). The May 2006 Gallup
poll indicates that support for the death penalty has declined from 80 percent in 1994 to
just 65 percent. Further, when life without parole is offered as an option, more (48%)
choose life without parole than those who choose capital punishment (47%) (Death
Penalty Information Center, 2006).
Steele and Wilcox (2003) discovered that the majority of prison inmates do not
generally support the death penalty (53 percent). However, when the crime considered
was a serial killing, child abuse or molestation, inmate support increased. Opposition to
the death penalty was based on the belief that capital punishment does not deter violent
crime, while support for the death penalty seemed to be based on early family values
and opinions. This data might tend to indicate that death penalty opinion is not shaped
by interactions with other inmates, but by early family socialization (Steele & Wilcox,
2003).
Fear of violent crime has been hypothesized to lead to increased fear of
victimization and thus may have some effect on attitudes towards capital punishment
(Rankin, 1979). Rankin (1979) examined the General Social Surveys from 1972-76 in
order to track the public’s changing attitude toward capital punishment. Rankin (1979)
hypothesized that the increase in violent crime may have led to a more punitive attitude
towards criminals, thus resulting in higher support for the death penalty. Rankin (1979)
found no significant relationship between fear of victimization and support for the death
50
penalty. del Carmen, Polk, Segal and Bing (2000) were conducting a study involving
fear of crime on a North Texas campus when, in the midst of administering the surveys,
a violent sexual assault did in fact occur. Before the assault, fear of violent crime was
reported by 31.7 percent of the respondents. Afterward, the percentage fearing violent
crime was 41.2 percent. Although males have been known to profess less fear of
victimization (del Carmen, et al., 2000; Rankin, 2000), they also show higher levels of
support for the death penalty (Fox, et al., 1990-91; Vogel & Vogel, 2003; Vollum, et al.,
2004). Thus, while high levels of crime may affect fear of victimization, indications are
that fear of victimization does not lead to increased support of capital punishment.
2.3.4 Public opinion and the willingness to pass judgment
Other scholars have examined support for capital punishment for juveniles, and
found significant support for alternatives to capital punishment (Boots, Hiede &
Cochran, 2004; Moon, Wright, Cullen & Pealer, 2000; Vogel, 2003) Although Moon,
et al. (2000) found that more than 80 percent of their sample favored the death penalty
for adults, only 53.5 percent favored the death penalty for juveniles. Support for capital
punishment for juveniles was strongest among younger, less educated males, who were
more politically conservative and more affluent. The strongest indicators of support for
the juvenile death penalty were age and gender. In addition, race was also statistically
significant with whites more likely to be in favor of capital punishment for juveniles.
The majority however, failed to favor the death penalty when the option of LWOP or
LWOP with restitution was available (Moon, et al., 2000).

51
Vogel and Vogel (2002) conducted a telephone survey in the state of California
examining the minimum age at which survey respondents would be willing to sentence
a juvenile to death and also how willing were respondents to support LWOP as an
alternative to the death penalty. Respondents were less willing to execute juveniles than
adults, but one-quarter of the sample was willing to allow the execution of juveniles
who committed their crimes at the age of fifteen or less. Mirroring other studies, males
with higher incomes and who were more politically conservative were more likely to
support the death penalty for juveniles. Of those respondents who were willing to
support the execution of juveniles, almost half would support LWOP as an alternative
sentence to capital punishment (Vogel & Vogel, 2002). This may be an indication that
given acceptable alternatives to capital punishment, the public might be willing to
consider other sentencing options for juveniles.
Vogel (2003) addressed the alternative sentence of life without the possibility of
parole (LWOP) among those who support the death penalty for both adults and
juveniles. The author found that support for capital punishment tends to fall
dramatically when offered an alternative to death; 45 percent of respondents who
support the death penalty viewed LWOP as a reasonable alternative to capital
punishment, while respondents with higher incomes tended to oppose LWOP and
support the death penalty (Vogel, 2003).
Another study examined jury pool surveys administered in Hillsborough
County, Florida in 2000 (Boots, et al., 2004). The majority of respondents (83.4
percent) supported the death penalty for adults legally convicted of murder. A majority,

52
but much lesser percentage (63.5) supported the use of capital punishment for juveniles
who were 16 years of age or older, while just over one-third (34.9 percent) would
extend the use of the death penalty to offenders who committed their crimes at the age
of 15 years or less (Boots, et al., 2004).
Only 29 percent of respondents agreed with executing the mentally retarded, but
a majority (57 percent) supported the use of capital punishment against the mentally
incompetent (Boots, et al., 2004). Boots, et al.’s (2004) findings did not reveal societal
consensus across income levels, southern v. non-southern heritage, age, or religious
affiliation. The only observed differences were between blacks and whites, males and
females and liberals and conservatives. The only way in which the data contradicted
the “evolving standards of decency” so often cited by the United States Supreme Court
was in that a majority of respondents supported the execution of the mentally
incompetent (Boots, et al., 2004). These data may tend to indicate that support for the
death penalty varies when different offender populations are considered, and slightly
among sex, politically ideology and race.
2.3.5 Death Penalty Opinion and Race
Many people believe that the death penalty has been used in a racially and
discriminatory manner. In fact, blacks are executed at 3 ½ times their number in the
population and comprise 40 percent of those on death row. Further, the death penalty is
used almost exclusively to punish those who kill whites (Dieter, 1994). Therefore,
assessing racial attitudes and perceptions about capital punishment among black and
white respondents by using public surveys has been of particular interest to leading
53
scholars (Arthur, 1998; Baker, Lambert & Jenkins, 2005; Barkan & Cohn, 1994; Cohn,
Barkan & Haltemen, 1991; Cochran & Chamlin, 2006; Hagan & Alboneti, 1982;
Hawkins, 1981; Hurwitz & Peffley, 2000; Smith, Dykema-Engblade, Walker, Niven &
McGough, 2000; Soss, Langhein & Metelko, 2003; Young, 1992; Young, 2004).
Researchers conducting a national survey have found that not only do African-
Americans perceive greater inequities in the criminal justice process (Hagan &
Albonetti, 1982), but that whites and blacks differ in their reasons for supporting more
punitive sentences (Arthur, 1998; Barkan & Cohn, 1994; Cohn, et al., 1991). Arthur
(1998) found that people who feel that criminals are not punished harshly enough are
more likely to believe in capital punishment. Several studies found that more whites
than blacks hold more punitive attitudes and thus show greater support for capital
punishment (Arthur, 1998; Cohn, et al., 1991), but Hawkins’ (1981) study found that for
most crimes, blacks are more punitive. Black women are more punitive than men, and
greater education among whites leads to less support for capital punishment (Cohn, et
al., 1991).
African-Americans have been found to be 3.4 times more likely than whites in
higher income brackets to have reservations about the death penalty (Unever, et al.,
2005), but blacks who are more likely to support capital punishment are likely to do so
because of the fear of becoming a victim of crime (Arthur, 1998; Cohn, et al., 1991), or
because their trust in the police is high (Young, 1991), while whites who harbor racial
prejudice are more likely to support the death penalty (Arthur, 1998; Barkan & Cohn,
1994; Cohn et al., 1991; Soss, et al., 2003; Unever, et al., 2005; Young, 2004) and to
54
feel that convicting an innocent person is a less serious mistake than letting a guilty
defendant go free (Young, 2004). Arthur’s (1998) study found that persons who are
opposed to public assistance and believe that a person’s race does not impede his
success are more likely to support the death penalty. Finally, Barkan and Cohn (2005)
found that after eliminating prejudice there was little difference among blacks and
whites in support of capital punishment. Cochran and Chamlin’s (2006) study
somewhat supports Barkan and Cohn’s findings. In two studies of venirepersons and
GSS data, the researchers found that although whites profess support for capital
punishment in greater numbers than blacks, support for the death penalty has risen in
both groups equally over the last three decades.
Further, whites who support capital punishment are more likely to blame
poverty (Cohn, et al., 1991; Young, 1991) and individual attributes for crime (Cohn, et
al., 1991; Soss, et al., 2003), perceive that capital punishment is necessary for
maintaining social order (Baker, et al., 2005; Soss, et al., 2003) to buy into racial
stereotyping of African-Americans and to be apathetic to the needs of minorities
(Arthur, 1998; Barkan & Cohn, 1994; Hurwitz & Peffley, 2000). Young (1991) found
that when support is high among African-Americans, the factor that most influences
greater degree of support is trust in police (Young, 1991), but blacks still perceive
greater sentencing inequities than do whites (Baker, et al., 2005; Young, 1991).
African-Americans have also been found to blame criminality on personal disposition
(Hawkins, 1981). Income and education did not affect support among blacks for capital
punishment, only whites (Young, 1991).
55
African-Americans and whites differ in their perceptions of criminal justice.
Blacks are more likely to perceive injustice than are whites (Hagen & Albonetti, 1982).
However, Anthony (1999) found that race is a relevant factor in both blacks’ and
whites’ death penalty attitudes, but that Blacks were more flexible in their opinions
about the death penalty Persons living in the central city and blacks who are of the
professional managerial class are the most likely group to perceive injustice. Members
of the “surplus” population are more likely to perceive injustice, with workers
perceiving more injustice than employers and African-Americans more than whites
(Hagan & Albonetti, 1982). White males are the most likely to support capital
punishment, while black females are the least likely (Young, 1992).
Bohm, Clark and Aveni (1990) found that race determined more than group
which subjects agreed with statements regarding incapacitation (blacks agreed more
than whites). Blacks, both male and female, agreed with statements regarding general
deterrence more than whites, both male and female. Blacks in the experimental group,
were also more likely to agree that the death penalty is discriminatory or that innocent
persons have been executed than blacks or whites in the control group. Whites in the
experimental group agreed more with statements about discrimination or innocence than
blacks in the control group. Participation in the death penalty class had no effect on
five of the six reasons students gave for supporting the death penalty, and according to
Bohm, et al. (1990) may have had a polarizing effect. Blacks opposed capital
punishment more than whites despite greater victimization, but victimized blacks
supported capital punishment more than those who had never been victimized.

56
Administrative (discrimination and innocence) reasons were the only considerations
that were affected significantly by participation in the class (knowledge) (Bohm, et al.,
1990).
Bohm, Vogel and Maisto (1993) returned to the subjects of death penalty classes
conducted in the spring terms of 1988 and 1989 in order to determine whether subjects
would retain their newly “informed” death penalty opinions or return to previously held
views. Their findings contradicted Justice Marshall’s belief that an informed public
would oppose capital punishment. By the follow up, both blacks and whites had
rebounded to their pretest positions, indicating that classroom manipulation (i.e. the
special death penalty class) may have only a short-term effect and not be an effective
method for changing perception and opinion about the death penalty (Bohm, et al.,
1993).
Using the same subjects enrolled in the Spring of 1988 and 1989 as an
experimental group (n=120) and a control group of students enrolled in other courses
during the same time periods (n=102), Bohm and Vogel (1994) attempted to compare
factors that might be associated with “uninformed” and “informed” opinions about
capital punishment. Their findings indicated that acquiring information about the death
penalty is not likely to change core factors, because these factors appear to be
assimilated to support already held beliefs about capital punishment. Acquisition of
knowledge about the death penalty only made a difference for crime victims, who were
less likely to favor capital punishment and for death penalty proponents who did not
readily believe that there was a chance of executing an innocent person or that makeup

57
of the jury had any effect upon who received the death penalty. In addition, those who
say retribution is the reason they support capital punishment, are unlikely to change
their opinions, no matter what evidence is laid before them (Bohm & Vogel, 1994).
In a study by Smith, et al. (2000) when minorities argued against capital
punishment, they were more influential and better able to change opinions than were
African-Americans who argued in favor of the death penalty. Further, majority
members who were exposed to individual minority members exhibited less change in
opinion than majority members who were exposed to minority members who had
support from fellow minority members (Smith, et al., 2000).
2.3.6 Death Penalty Knowledge and College Students
Student opinion has been the subject of a series of death penalty studies (Bohm,
1989; Bohm, 1990; Bohm, et al., 1990; Bohm, et al., 1991; Bohm & Vogel, 2004;
Bohm, et al., 1993; Bohm & Vogel, 1994; Cochran & Chamlin, 2005; Edens, Colwell,
Desforges & Fernandez, 2005; Elliot & Robinson, 1991; Firment & Geiselman, 1997;
Honeyman & Ogloff, 1996; Kelly, 1997; Lambert & Clarke, 2001; Lester,
Maggioncalda-Aretz & Stark, 1997; Maxwell & Rivera-Vazquez, 1998; Morsbach &
Morsbach, 1967; Neser, van der Westhuizen & Ladikos, 1986; Robinson, 1993;
Pasupuleti, Lambert & Cluse-Tolar, 2005; Vidmar & Dittenhoffer, 1981; Wright, Bohm
& Jamieson, 1995).
2.3.6.1 The Later nineteenth century knowledge/perceptions
Morsbach and Morsbach (1967) conducted a cross-cultural study of South
African university students to determine if perceptions and opinions about the death
58
penalty differed among the elites of South Africa (defined as White Africans and
English-speaking university students). Public execution was opposed by all groups, but
execution itself was seen as necessary by the African speaking students who believed
that execution should be used not only for murder, but for treason, sexual assault and
for murders perpetrated by the insane (Morsbach & Morsbach, 1967). English-speaking
law students, while agreeing with the utility of the death penalty, were more likely to
believe that insane persons or those with ill friends or relatives should not be executed.
Those with the strongest abolitionist views were the English-speaking divinity students,
who believed that murderers could be rehabilitated and that one should not be executed
if he had confessed or the evidence against him been circumstantial. English-speaking
Arts and Science students were more likely to believe that most murderers were not
responsible for their crimes. In addition, this group was also more likely to believe that
innocent persons had been condemned in the past and therefore that the death penalty
should not be implemented (Morsbach & Morsbach, 1967).
In 1981, Vidmar and Dittenhoffer published a study of 39 Western Ontario,
Canada undergraduates, ranging in age from 19 to 32 years of age. In a similar design
to most of Bohm’s studies (Bohm, 1989; Bohm, 1990; Bohm, et al., 1990; Bohm, et al.,
1993; Bohm & Vogel, 1994; Wright, et al., 1995), a post-questionnaire was
administered to attain the level of knowledge and attitudes towards capital punishment.
Afterward, 21 students volunteered to participate in further studies, and the remaining
18 students served as the control group. The experimental group was asked to read an
essay and supplementary readings. At the conclusion of the experiment small
59
discussion groups were formed, and a questionnaire identical to the first was
administered to the experimental group, with the addition of a second part which
assessed how much the students became involved with the study. The control group
was approached and asked to fill out a second questionnaire. The average time spent on
involvement with the experimental group was 3.6 hours per subject. Most subjects
reported that they knew little and had read little or nothing before the experiment about
capital punishment, confirming Justice Marshall’s hypothesis that the public knows
little about the death penalty (Vidmar & Dittenhoffer, 1981). With more time spent
studying and analyzing capital punishment, the experimental group changed from
approximately 33 percent in opposition to 71 percent opposing the death penalty.
However, the data fell short of statistical significance, but found that those most
strongly in support of capital punishment are least likely to change their opinions
(Vidmar & Dittenhoffer, 1981).
Some studies have addressed juries and their willingness to convict or acquit in
capital cases (Elliot & Robinson, 1991; Robinson, 1993). It has long been assumed that
jurors who are “death qualified are more likely to convict than so called “Witherspoon
excludables” (Elliot & Robinson, 1991). Elliot and Robinson (1991) surveyed a group
of undergraduates and found that the greater one’s opposition to capital punishment, the
more evidence one would require in order to convict. However, when the results were
compared as far as verdict and punishment outcome, no discernable differences between
death qualified (DQ) and Witherspoon excludable (WE) jurors were noted, tending to
60
indicate in this study that both death qualified jurors and Witherspoon excludables may
be equally effective (Elliot & Robinson, 1991).
Robinson (1993) surveyed 602 students from two universities in the San
Francisco area and found that the majority (up to 60 percent) of individuals who are
currently being excluded from serving on capital juries would impose the death penalty
when the offense is severe enough. His experiment, however, hinged on guilt far
beyond any doubt, not just reasonable doubt, leaving to question whether jurors could
impose capital punishment when the burden of proof is not beyond all doubt, but simply
beyond a reasonable doubt (Robinson, 1993).
Bohm, et al. (1991) surveyed two groups of students; a control group of 82 and
an experimental group of 190 students. They found that after increasing death penalty
knowledge death penalty support decreased among the experimental group who
participated in a death penalty class. As predicted by Justice Marshall, most
participants had little knowledge about the death penalty prior to the class, and no
effective change was apparent among those students who supported the death penalty
based on retribution. Opposition to capital punishment never exceeded 50 percent.
White support for the death penalty was higher than black support.
Honeyman and Ogloff (1996) surveyed a group of 305 university and
community college students in the Vancouver, Canada area. Survey respondents were
given a scenario depicting the murder of a convenience store clerk, juror guidelines in
administering the death penalty and told that if all the answers were “yes” to the
questions presented in the juror guidelines, then they must vote for a sentence of death.
61
Of subjects who were deemed “death qualified”, 65 percent recommended death and 35
percent recommended life imprisonment. Seventy-five percent of those who heard
arguments only recommending capital punishment, chose the death penalty. However,
only 53 percent of those hearing only arguments against capital punishment, chose the
death penalty. Only 10 excludables chose the death penalty (25 percent), while 30
excludables (75 percent) chose life in prison. The authors concluded that arguments
supporting capital punishment can be influential in jurors’ recommendations to the
court, while arguments against capital punishment did not influence juror
recommendations (Honeyman & Ogloff, 1996).
Firment & Geiselman (1997) also conducted a study examining university (103
male and 99 female) students and the differences between Witherspoon excludables and
death qualified respondents. In addition, attitudes towards capital punishment and the
juvenile death penalty were examined. More death qualified respondents believed
retribution was an acceptable reason to support the death penalty than did “Witherspoon
excludables”. Ninety-one percent of the total respondents said they would support the
death penalty for murder under certain circumstances. Seventy-eight percent said that
capital punishment is not too extreme a penalty for certain crimes, while 56 percent says
that society is entitled to use capital punishment on the basis of revenge. However,
Firment and Geiselman (1997) note that the typical profile of their sample was a 20 year
old male, with little or no death penalty knowledge, politically moderate, fearful of
victimization and had a negative view of the criminal justice system.
62
Lester, et al. (1997) examined the differences between college students’ and
high school students’ attitudes towards the death penalty. While the two groups agreed
that the most serious crimes deserved the death penalty, the high school students were
more punitive on the less serious crimes, qualifying more crimes as deserving of capital
punishment. Neither age or gender was a significant factor for either the college
students or the high school students.
Kelly’s (1997) study was composed of 117 college students enrolled in
introductory psychology courses. The purpose of the study was to test the hypothesis
that death qualification of jurors is related to the polarization of jurors’ attitudes towards
capital punishment. Kelly (1997) found that those who are most often chosen for death
penalty juries, will be those persons most likely to experience attitude polarization in
reaction to the process of death qualification.
2.3.6.2 Twenty-first century knowledge and opinions
Another study sought to examine whether knowledge would have a lasting
impact on death penalty opinion. Bohm and Vogel (2004) examined a group of death
penalty class participants 10 years after the initial study. All participants had attended a
medium size university in Alabama and responses were obtained by repeated mailings.
What the researchers found was that for most respondents, death penalty opinion had
rebounded to the participants’ original pretest responses. This could be an indication
that lasting change comes only from repeated and prolonged exposure or as the authors’
suggested, life experiences since taking the class may not have shaped respondents’
current opinions.
63
Psychopathy was examined in another study assessing how likely a potential
juror was to support the death penalty when the offender was described as psychopathic
compared to either psychotic or not mentally disordered at all. Edens, et al. (2005)
conducted a survey study at a University in the Southwest and found that when the
“offender” was described as psychopathic, 60 percent of participants would recommend
a death sentence, compared to 30 percent if he was psychotic or 38 percent if the
offender was not mentally disordered. In fact, the degree to which a defendant was
perceived to be psychopathic and degree to which the offender was considered
dangerous, correlated positively with the extent to which the respondent supported the
death penalty (Edens, et al., 2005).
Pasupuleti, et al. (2005) examined the differences in opinion and perception
between social work majors and students majoring in other disciplines. Two significant
differences were noted. First, social workers were less likely than other majors to seek
retribution. Second, social work students were also far less likely than their non-social
work counterparts to show support for the death penalty. The results have to be
approached with caution, however, because a disproportionate number of the social
work majors were female.
Cochran and Chamlin (2005) sought to replicate Bohm’s earlier studies
measuring the effects of knowledge on change. Respondents were 70 undergraduate
students from a large urban West-Central Florida university. All participated in a
special topics course on the death penalty. Cochran and Chamlin (2005) found that
death penalty supporters were less informed than death penalty opponents. Death

64
penalty knowledge resulted in greater opposition to capital punishment and
retributionists were found to be no more resistant to change than those who did not
support retribution. Further, subjects who did not favor life without parole and
supported retribution assessed their knowledge level as higher.
2.3.7 Studies addressing Knowledge and Perception among Criminology/CriminalJustice Majors
2.3.7.1 The nineteen-eighties
An opinion poll was conducted in 1986 (Neser, et al., 1986) among criminology,
police science and penology students to measure student opinion on the implementation
of capital punishment. Almost 85% believed that the retention of capital punishment in
South Africa was important and that any other alternative to the death penalty was
unacceptable. Among retentionists, more than 78 percent believed that abolishing the
death penalty would lead to increased crime, while 69 percent of abolitionists believed
it would have no effect on the crime rate. Demographically, this study found that
females, older students, and those with higher incomes significantly oppose the capital
punishment in greater numbers, while there was no significant difference found with
respect to race or level of education.
Bohm (1989) attempted to test the Marshall hypothesis among university
students who participated in a special death penalty class during the Spring of 1987.
The duration of the class was one month and the text for the class was Bedau’s Death
Penalty in America, third edition (1982). In addition, the class included guest speakers,
lectures by the professor and discussions among the students. Most of the subjects
(n=50) were criminal justice majors or minors and had already had previous exposure to

65
information about the death penalty. Identical questionnaires were completed at the
beginning and at completion of the course, seeking information about death penalty
opinion, knowledge and demographic characteristics of study participants. Bohm
(1989) found that 82 percent of the “uninformed” students favored the death penalty for
some people convicted of murder. However, upon completion, 26 percent of the
“informed” students changed their opinion from being in favor of capital punishment to
opposing it (Bohm, 1989).
2.3.7.2 The nineteen-nineties
Bohm (1990) published a study using information gleaned from the May 1988
semester. At the beginning of the term, death penalty opinion was obtained from the
subjects who included an experimental group of majority criminal justice students
enrolled in a special death penalty course and a control group of students majoring in
other disciplines. During the pretest, Bohm (1990) found that the criminal justice
majors were more likely to have stronger opinions than non-criminal justice majors. In
fact, the death penalty class resulted in almost no change in criminal justice majors’
opinions and only a small effect on the non-criminal justice majors’ opinions. Most
change in opinion occurred on the days when discrimination and arbitrary application of
the death penalty were the topics of discussion. In sum, while black students were more
likely to change their opinion than white students, support for the death penalty
decreased and opposition increased by only five percent (Bohm, 1990). Bohm’s (1990)
findings may tend to indicate that knowledge does not significantly change one’s

66
opinion about capital punishment, and that Justice Marshall may have been wrong in
concluding that an educated public would turn away from the death penalty.
Another study (Wright, et al., 1995) found that conducting a special death
penalty class did appear to change death penalty opinion. Expanded questionnaires
included personal involvement questions about whether one would be able to pull the
lever that executed a first degree murderer or serve on a jury and pass down the death
sentence. Although the experimental and control groups were similar in demographic
characteristics, the experimental group was composed of 84 percent criminal justice
majors compared to 35.3 percent in the control group. Students completed
questionnaires at the beginning of the semester and at the end. On the pretest, the
control group answered 38 percent of the knowledge questions correctly compared to 57
percent of the experimental group. Although post-tests demonstrated that both groups’
knowledge about the death penalty increased, the experimental group answered almost
twice as many questions correct as did the control group. Support for capital
punishment diminished significantly for the experimental group on the post-test, but
increased slightly for control group subjects. Informed or uninformed, less than a
majority of either would be willing to directly apply the sentence of death to an
offender, but the majority could convict if serving on a jury. Further, the experimental
group increased support for the alternative of life without parole. The findings suggest
that the experimental stimulus of the death penalty class caused a significant number of
persons to change their opinions if life without parole were an alternative to capital
punishment (Wright, et al., 1995).
67
Maxwell and Rivera-Vazquez (1998) examined the instrumental and symbolic
perspectives of capital punishment by using a sample of Puerto Rican students majoring
in different social science disciplines: criminology, political science, public
administration, social work and sociology. The more that subjects believed that capital
punishment had been applied unfairly or that innocent persons had been convicted, the
less likely subjects were to support the death penalty. Further, the more those subjects
believed that the death penalty served as a deterrent and protection for society, the more
likely they were to support the death penalty (Maxwell & Rivera-Vazquez, 1998). No
differentiation was made between responses of the criminology students and those
students who were majoring in other disciplines.
2.3.7.3 The twenty-first century
Lambert and Clarke (2001) conducted a study to assess how the effect of
knowledge regarding sentencing innocent persons to death and data regarding
deterrence would impact one’s opinion about the death penalty. Three essays were give
to 730 students at a 4 year university in Michigan; one focused on the odds of
sentencing innocent persons to death, one on death penalty deterrence research and the
last on general reasons for punishing offenders (control essay). Approximately 45% of
the subjects were criminal justice majors, while the remaining 55% majored in various
other fields of study. While most of the respondents supported the death penalty, there
was no statistically significant difference in the three essay groups in terms of support
before reading the essays. After reading the essays, the control group reported no
statistically significant change. However, for both the deterrence and innocence essay

68
groups, there was a reduction in support for capital punishment, but only statistically
significant for the innocence essay. However, the innocence essay only resulted in a
weak reduction in support for the death penalty. Lambert and Clarke (2001) did not
discuss findings in regard to the possible differences between criminal justice students
and those who majored in other disciplines, but rather reported all majors as a total
group. Further, the study could tend to indicate that short essays may have little long-
term effect and further change might involve more prolonged discussion.
Anders (2003) examined the racial differences in perception among criminology
and criminal justice students. Overall, minority and majority students differed very
little in terms of knowledge about capital punishment. However, the difference in
perception was much more pronounced with minorities more likely to feel that the death
penalty was unfairly applied to other minorities. In addition, minorities were more
likely to perceive that crimes against whites were punished more harshly. Majority
students appeared to be more punitive towards offenders than minorities. White
students were more likely to support the death penalty even if evidence were presented
showing that capital punishment did not act as a deterrent to murder. The responses
when broken down into male/female were similar in nature and few were statistically
significant (Anders, 2003).
As suggested through a review of the existing studies, there is a current paucity
of research in the literature base addressing the differences between CRCJ majors’ and
non-majors’ opinions and perceptions about capital punishment and its possible
deterrent effects. Although a few studies have addressed the differences in perception
69
and knowledge, none have done so using a sample of students from the state of Texas,
the most active death penalty state in the nation (Death Penalty Information Center,
2006). This study will attempt to address the possible differences in perception and
knowledge about the death penalty comparing CRCJ majors and non-CRCJ majors
from the University of Texas at Arlington.
70
CHAPTER 3
METHODOLOGY AND DESIGN
Research was conducted through the use of self-report surveys assessing two
independent test populations; Criminology/Criminal justice (CRCJ) students and
students majoring in other disciplines (non-CRCJ). The first population,
criminology/criminal justice majors consisted of 60 (n=60) respondents (49 percent)
while the second population (non-CRCJ majors) consisted of 62 (n=62) respondents (51
percent). Five respondents did not report a major. Further, the sample was divided into
majority (n=68) and minority students (n=57), with only two respondents not stating an
ethnicity. The total number of participants for this study was 127 (N=127) students,
with each sample set exceeding the requirements needed in order to achieve statistically
significant results. Power sampling was used in this study to attain a statistically
appropriate sample size. The sample size for each condition (CRCJ = 62, non-CRCJ =
60) exceeds that required for Cohen’s power sampling as defined by Keppel, Saufley,
Jr. and Tokunaga (1992) as an approximation of the amount of respondents desired in
order to reveal a correlation to the desired degree of power (.05). Though not every
question was completed, all respondents completed at least part of the survey resulting
in a 100 percent response rate.
This study was conducted in order to examine the possible differences in
knowledge and perception regarding capital punishment among students majoring in
71
criminology/criminal justice (CRCJ) and students majoring in other disciplines (non-
CRCJ). In addition, an examination of majority and minority students was conducted.
Since the nature of the study was exploratory, a one-shot case study was utilized. In
this chapter, the author discusses the survey instrument, IRB submission and approval,
sampling method, implementation of the survey, and statistical manipulation used to
process the data.
3.1 Construction of the Survey Instrument
The survey used in this study was derived in part from a survey used by
Pasupuleti et al. (2005) which was used to measure differences of view among social
work students and students in other majors. Among the survey questions were two
measures of deterrence, four retribution measures, one law and order, two incapacitation
and one measure each for morality, mercy, emotional, innocence and brutalization. In
addition, questions numbered 1, 2, 8 and 9 measure knowledge, while the remainder of
the questions through number 14 measure perception and opinion. Questions numbered
1 through 14 are presented as statements using a Likert scale. The Likert scale is
defined by Babbie (2004) as a scale designed in order “to determine the relative
intensity of different items” (p. 169). Response categories ranged from agree strongly
(1) to disagree strongly (5). The remainder of the survey questions were general
demographic questions with the exception of number 15 which asks respondents to
identify their sources of information about the death penalty.
Knowledge was tested on four statements; “the death penalty is a more effective
deterrent than life imprisonment”, “after the execution of a murderer, violent crime in
72
that state declines for several weeks”, “it costs more money to incarcerate someone for
life without parole than it does to execute that person”, and “most convicted murderers
would kill again if given the opportunity”.
The remainder of the statements measure perception and opinion and include:
“murderers deserve the death penalty since they took a life”, “I become angry when a
convicted murderer does not receive the death penalty”, “16 year olds convicted of first
degree murder deserve the death penalty”, “I believe in the idea of an “eye for an eye, a
life for a life’”, “the death penalty is necessary to maintain law and order”, “the death
penalty serves little purpose other than to demonstrate society’s cruelty”, “showing
mercy is more important than seeking revenge”, “it saddens me when a person is
executed, regardless of the crime they committed”, “there is a good possibility that an
innocent person will be executed” and “executions set a violent example that leads to
further violence in society”. A question taken in part from Anders’ (2003) study was
intended to measure information source(s) by asking respondents to check all sources of
information available to the student. Choices offered were, family, friends, neighbors,
television, radio, magazines, internet, college/campus newspaper, newspapers (city or
other than campus), religious institution, and other.
In addition to sex, race, age, major, and student rank included in the Pasupuleti,
et al. (2005) study, other demographic questions were added. Other questions taken
from Anders’ (2003) study included “Do you live on campus?”, “What is your marital
status?”, “Are you registered to vote?”, “What is the size of the town or city in which
you live?”, “What is your school enrollment status?”, and “What is your cumulative

73
GPA at UTA?”. Levels of measurement included nominal as well as ordinal data. The
survey instrument in its entirety can be found in appendix C.
3.1.1 IRB Review and Approval
In March, 2006, IRB form 1A (Application for exemption of a research protocol
to the Institutional Review Board for the Protection of Human subjects (IRB)), the
survey, Professor’s Statement of Purpose, Instructions for Completion of the Survey
and a copy of the Spring 2006 class schedule were presented to the University’s
Institutional Review Board for consideration. Permission to begin the research was
granted by the University’s Office of Research Integrity and Compliance (IRB) on April
5, 2006 and research began in mid-April, 2006.
3.2 Sampling Method
Convenience sampling defined by Patten (2005) as the selection of individuals
because they are available to the researcher, was used to gather data for this study.
Because of the type of sampling utilized in this study, results cannot be generalized to
the general public or to the entire student body and must be approached with caution.
However, since the aim of this study was exploratory, the sampling method used was
appropriate. A total of 6 CRCJ classes were chosen randomly (2 each lower, upper and
graduate level) from 49 available courses offered during the 2006 spring semester, and
included both day and evening classes. Participants chosen for this study were 127
(n=127) students enrolled in one of these six Criminology/Criminal Justice classes for
the Spring, 2006 semester, which typically runs from the middle of January through the

74
first or second week of May. Participants were chosen from a population of
approximately 25,000 students from the University of Texas at Arlington.
Courses selected for this survey were from the department of
criminology/criminal justice offered through the college of liberal arts. Less than one-
half of students enrolled in these courses were criminology/criminal justice majors
(49%). Because all the students surveyed were taking courses within the department of
criminology/criminal justice and were samples of convenience introduce threats to
external validity. Therefore the results cannot be generalized to either the general
public or to the entire student body. The study is, however, exploratory in nature and
provides a basis for the examination of the possible differing levels of knowledge and
perception regarding the death penalty among criminology/criminal justice students and
non-CRCJ students. A summary of the courses selected is included in table 1.
TABLE 1. SPRING 2006 COURSES IN WHICH SURVEYS WERE DISTRIBUTEDCourse Title Level
Introduction to the Criminal JusticeSystem, Section 002
Sophomore
Introduction to the Criminal JusticeSystem, Section 003
Sophomore
Victimology, Section 501 JuniorSocial Science and Mental HealthForensics, Section 001
Senior
Research in Criminal Justice, Section 501 GraduateEthical Issues in Criminal Justice, Section501
Graduate
University of Texas at Arlington, Online Schedule of Classes,www.https://epprd.uta.edu/psp/EP89PRD/EMPLOYEE/EMPL/h/signon.html/

75
3.3 Data Collection
From mid-April, 2006 until the first week in May, 2006, the researcher obtained
permission from 6 professors within the criminology/criminal justice department to
administer surveys during the soonest convenient class period. Self-report surveys were
then given to two populations; criminology/criminal justice students and students
majoring in other disciplines. The researcher explained the purpose of the data
collection through a reading of a statement of purpose and asked if there were any
questions (the Statement of Purpose can be found in Appendix A). All participants
were assured by the researcher that their participation was completely voluntary and
anonymous. Further, it was stressed that the participant was under no obligation to
participate and if at any time, any participant no longer wished to participate, no penalty
would incur. Respondents were encouraged not to participate if they had already done
so in a previous class. In addition, instruction for the completion of the survey was
offered by the researcher, and once again participants were asked if there were any
pending questions. When there were no more questions, the researcher asked the
survey participants to begin. Twenty minutes was allowed for completion of the survey
and upon completion surveys were collected by the researcher.
3.3.1 Survey Instrument
The survey instrument first included a page again detailing the purpose of the
study, and stressing that participation was completely voluntary and anonymous and
thanking the respondent for his/her participation (Instructions for Completion of the
Survey can be found in Appendix B). The instruction sheet was followed by survey
76
questions pertaining to measures for deterrence, retribution, law and order,
incapacitation, morality, mercy, emotional, innocence, brutalization, information and
demographic questions.
Statements numbered 1, 2, 8 and 9 are designed to measure knowledge, while
the remainder of the questions through number 14 measure perception and opinion. A
Likert scale is used to measure items 1-14. Response categories ranged from agree
strongly (1) to disagree strongly (5). Question 15 asks respondents to identify where
they receive information about the death penalty. Respondents are asked to mark all
that apply and questions are coded into SPSS, 1 for “yes” if the respondent checked it,
and 2 for “no” if the respondent did not. Choices offered were, family, friends,
neighbors, television, radio, magazines, internet, college/campus newspaper,
newspapers (city or other than campus), religious institution, and other. The remainder
of the survey included general demographic questions.
Four statements tested respondents’ knowledge about capital punishment.
Those statements were, “the death penalty is a more effective deterrent than life
imprisonment”, “after the execution of a murderer, violent crime in that state declines
for several weeks”, “it costs more money to incarcerate someone for life without parole
than it does to execute that person”, and “most convicted murderers would kill again if
given the opportunity”.
The remaining 10 statements measure perception and opinion and include:
“murderers deserve the death penalty since they took a life”, “I become angry when a
convicted murderer does not receive the death penalty”, “16 year olds convicted of first
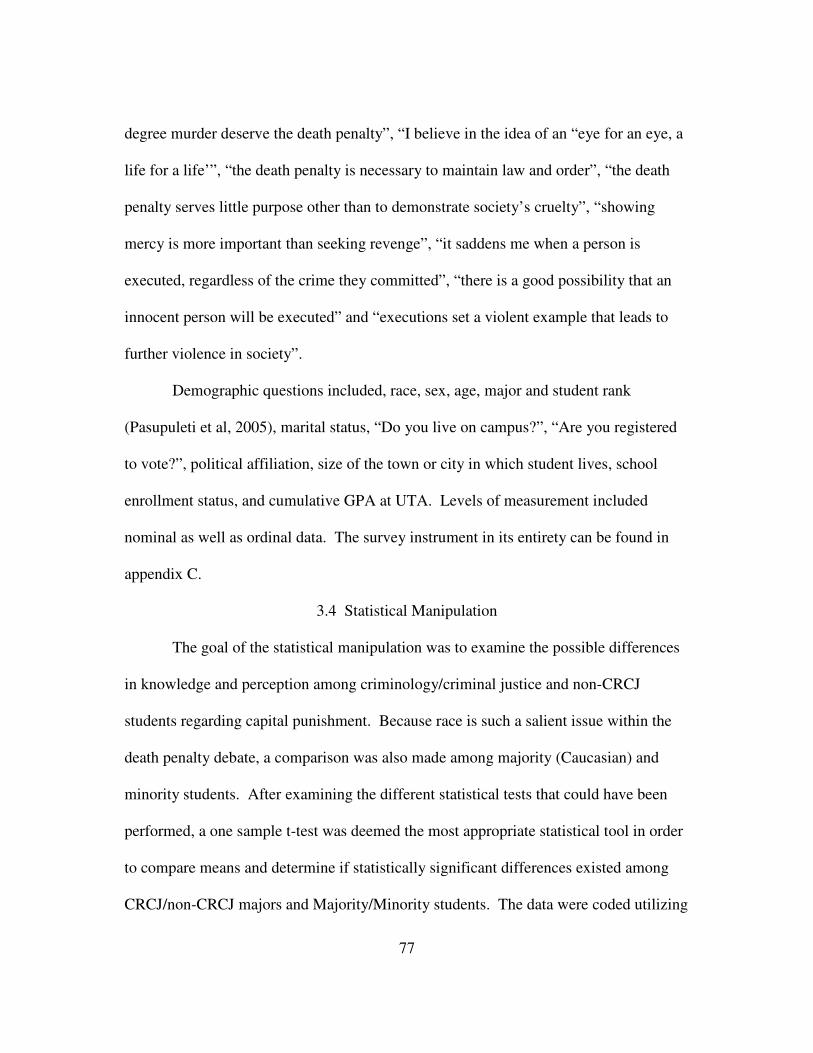
77
degree murder deserve the death penalty”, “I believe in the idea of an “eye for an eye, a
life for a life’”, “the death penalty is necessary to maintain law and order”, “the death
penalty serves little purpose other than to demonstrate society’s cruelty”, “showing
mercy is more important than seeking revenge”, “it saddens me when a person is
executed, regardless of the crime they committed”, “there is a good possibility that an
innocent person will be executed” and “executions set a violent example that leads to
further violence in society”.
Demographic questions included, race, sex, age, major and student rank
(Pasupuleti et al, 2005), marital status, “Do you live on campus?”, “Are you registered
to vote?”, political affiliation, size of the town or city in which student lives, school
enrollment status, and cumulative GPA at UTA. Levels of measurement included
nominal as well as ordinal data. The survey instrument in its entirety can be found in
appendix C.
3.4 Statistical Manipulation
The goal of the statistical manipulation was to examine the possible differences
in knowledge and perception among criminology/criminal justice and non-CRCJ
students regarding capital punishment. Because race is such a salient issue within the
death penalty debate, a comparison was also made among majority (Caucasian) and
minority students. After examining the different statistical tests that could have been
performed, a one sample t-test was deemed the most appropriate statistical tool in order
to compare means and determine if statistically significant differences existed among
CRCJ/non-CRCJ majors and Majority/Minority students. The data were coded utilizing

78
the Statistical Package for the Social Sciences (SPSS) and in chapter four, the findings
that resulted from the statistical manipulation will be explained.
79
CHAPTER 4
FINDINGS
Descriptive statistics were utilized to analyze the data collected for this study.
According to Babbie (2004, p. 442), descriptive statistics are “statistical computations
describing either the characteristics of a sample or the relationship among variables in a
sample”. Further, Babbie (2004) notes that descriptive statistics summarize
observations. The data collected for this study were analyzed using a t test. Sweet and
Grace-Martin (2003) describe a t test as a method of comparing the means of two
groups. The t test is most appropriate for this study because two groups are being
compared (CRCJ majors and non-CRCJ majors). By using this method, it is expected
that not only will differences be found in survey responses between CRCJ majors and
non-majors, but between majority and minority students.
The findings of this study are described and presented in three sections. The
first will present the demographic findings of the respondents surveyed in terms of
percentages. Knowledge and perception differences among CRCJ and non-CRCJ
students are discussed next, followed by differences in information sources. Last,
knowledge, perception and information source(s) differences among majority and
minority students is discussed. In sections two and three, data is presented through one
sample t test comparisons of the means of each group. These last two sections are
further separated into knowledge, perception/opinion and information source(s).
80
The survey instrument contained a total of 27 questions and had a total of 127
respondents. The instrument was designed to measure knowledge and perception and
was administered to both graduate and undergraduate students enrolled in one of six
criminology/criminal justice courses during the Spring of 2006. Slightly more than half
(51%) of the students surveyed, however, majored in a discipline other than
criminology/criminal justice. There was a 100% response rate since surveys were only
given to those who agreed to participate. Responses were measured in a Likert scale,
ranging from agree strongly (1) to disagree strongly (5).
4.1 Demographics
The majority of respondents in this survey were female (53%), 30 years or age
or less (88%), identified themselves as Caucasian (54%), and were either single or
divorced (92%). The majority were full time students (85%), with more than half the
respondents reporting that they were either sophomores or juniors in class standing
(26% and 35% respectively). More than half the respondents (51%) were majors in
fields other than criminology/criminal justice, with most reporting GPAs of 3.1 or
higher (63%). Most respondents were registered to vote (83%), with the greatest
percentage reporting “Republican” as their political affiliation (41%). For a complete
summary of demographics, refer to table 2.
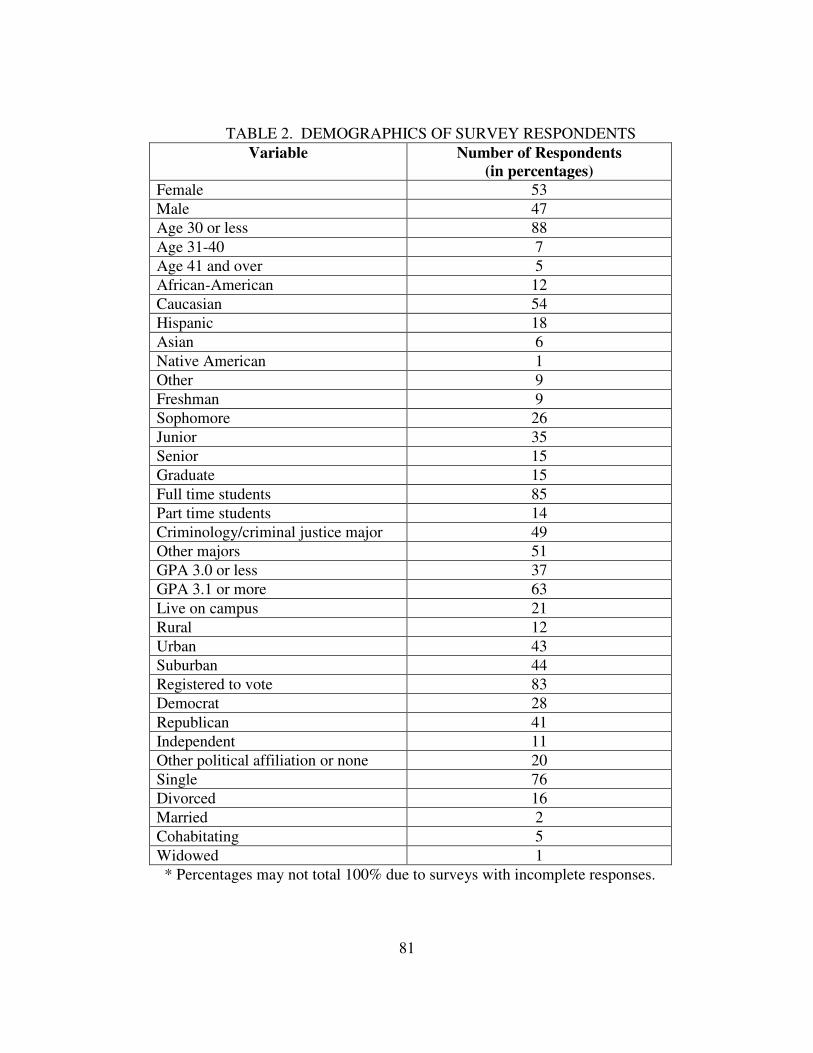
81
TABLE 2. DEMOGRAPHICS OF SURVEY RESPONDENTSVariable Number of Respondents
(in percentages)Female 53Male 47Age 30 or less 88Age 31-40 7Age 41 and over 5African-American 12Caucasian 54Hispanic 18Asian 6Native American 1Other 9Freshman 9Sophomore 26Junior 35Senior 15Graduate 15Full time students 85Part time students 14Criminology/criminal justice major 49Other majors 51GPA 3.0 or less 37GPA 3.1 or more 63Live on campus 21Rural 12Urban 43Suburban 44Registered to vote 83Democrat 28Republican 41Independent 11Other political affiliation or none 20Single 76Divorced 16Married 2Cohabitating 5Widowed 1* Percentages may not total 100% due to surveys with incomplete responses.
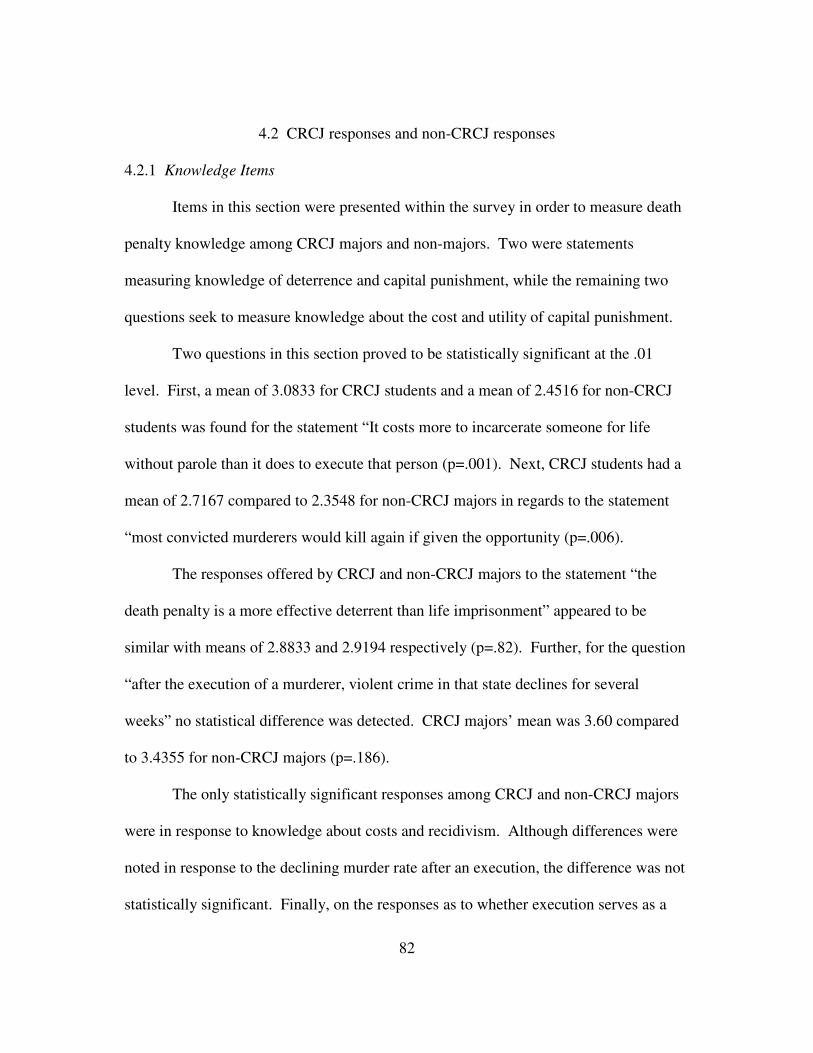
82
4.2 CRCJ responses and non-CRCJ responses
4.2.1 Knowledge Items
Items in this section were presented within the survey in order to measure death
penalty knowledge among CRCJ majors and non-majors. Two were statements
measuring knowledge of deterrence and capital punishment, while the remaining two
questions seek to measure knowledge about the cost and utility of capital punishment.
Two questions in this section proved to be statistically significant at the .01
level. First, a mean of 3.0833 for CRCJ students and a mean of 2.4516 for non-CRCJ
students was found for the statement “It costs more to incarcerate someone for life
without parole than it does to execute that person (p=.001). Next, CRCJ students had a
mean of 2.7167 compared to 2.3548 for non-CRCJ majors in regards to the statement
“most convicted murderers would kill again if given the opportunity (p=.006).
The responses offered by CRCJ and non-CRCJ majors to the statement “the
death penalty is a more effective deterrent than life imprisonment” appeared to be
similar with means of 2.8833 and 2.9194 respectively (p=.82). Further, for the question
“after the execution of a murderer, violent crime in that state declines for several
weeks” no statistical difference was detected. CRCJ majors’ mean was 3.60 compared
to 3.4355 for non-CRCJ majors (p=.186).
The only statistically significant responses among CRCJ and non-CRCJ majors
were in response to knowledge about costs and recidivism. Although differences were
noted in response to the declining murder rate after an execution, the difference was not
statistically significant. Finally, on the responses as to whether execution serves as a
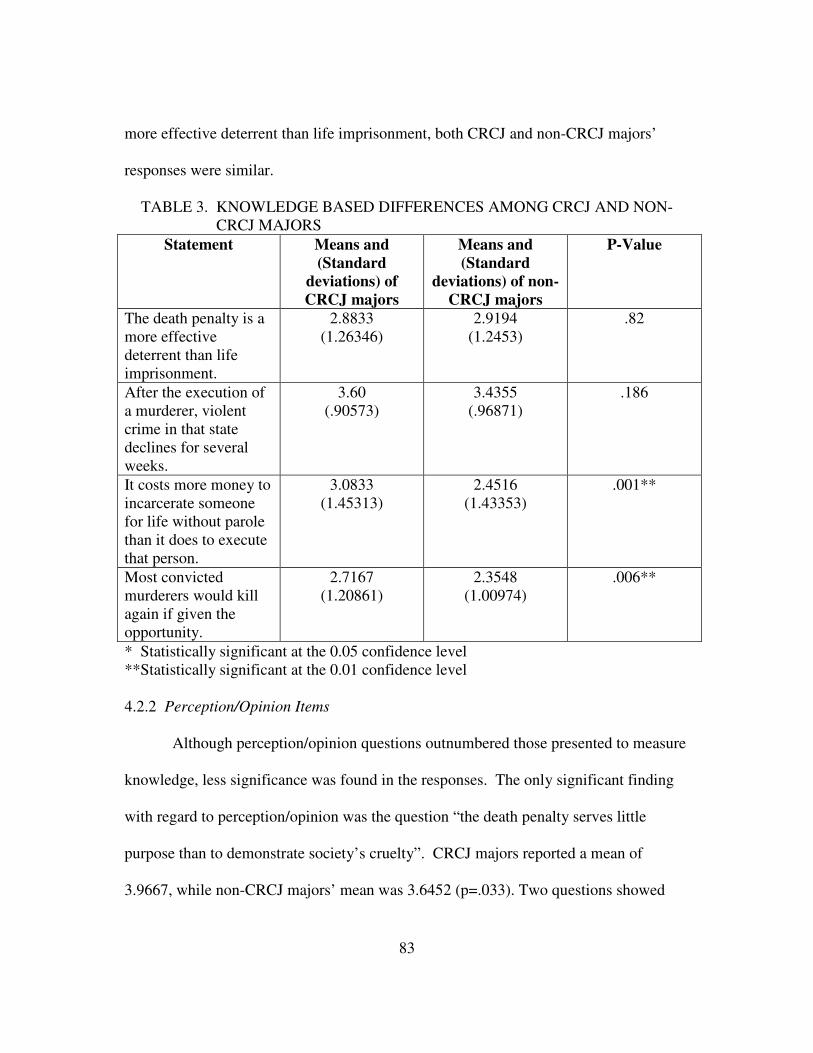
83
more effective deterrent than life imprisonment, both CRCJ and non-CRCJ majors’
responses were similar.
TABLE 3. KNOWLEDGE BASED DIFFERENCES AMONG CRCJ AND NON-CRCJ MAJORS
Statement Means and(Standard
deviations) ofCRCJ majors
Means and(Standard
deviations) of non-CRCJ majors
P-Value
The death penalty is amore effectivedeterrent than lifeimprisonment.
2.8833(1.26346)
2.9194(1.2453)
.82
After the execution ofa murderer, violentcrime in that statedeclines for severalweeks.
3.60(.90573)
3.4355(.96871)
.186
It costs more money toincarcerate someonefor life without parolethan it does to executethat person.
3.0833(1.45313)
2.4516(1.43353)
.001**
Most convictedmurderers would killagain if given theopportunity.
2.7167(1.20861)
2.3548(1.00974)
.006**
* Statistically significant at the 0.05 confidence level**Statistically significant at the 0.01 confidence level
4.2.2 Perception/Opinion Items
Although perception/opinion questions outnumbered those presented to measure
knowledge, less significance was found in the responses. The only significant finding
with regard to perception/opinion was the question “the death penalty serves little
purpose than to demonstrate society’s cruelty”. CRCJ majors reported a mean of
3.9667, while non-CRCJ majors’ mean was 3.6452 (p=.033). Two questions showed
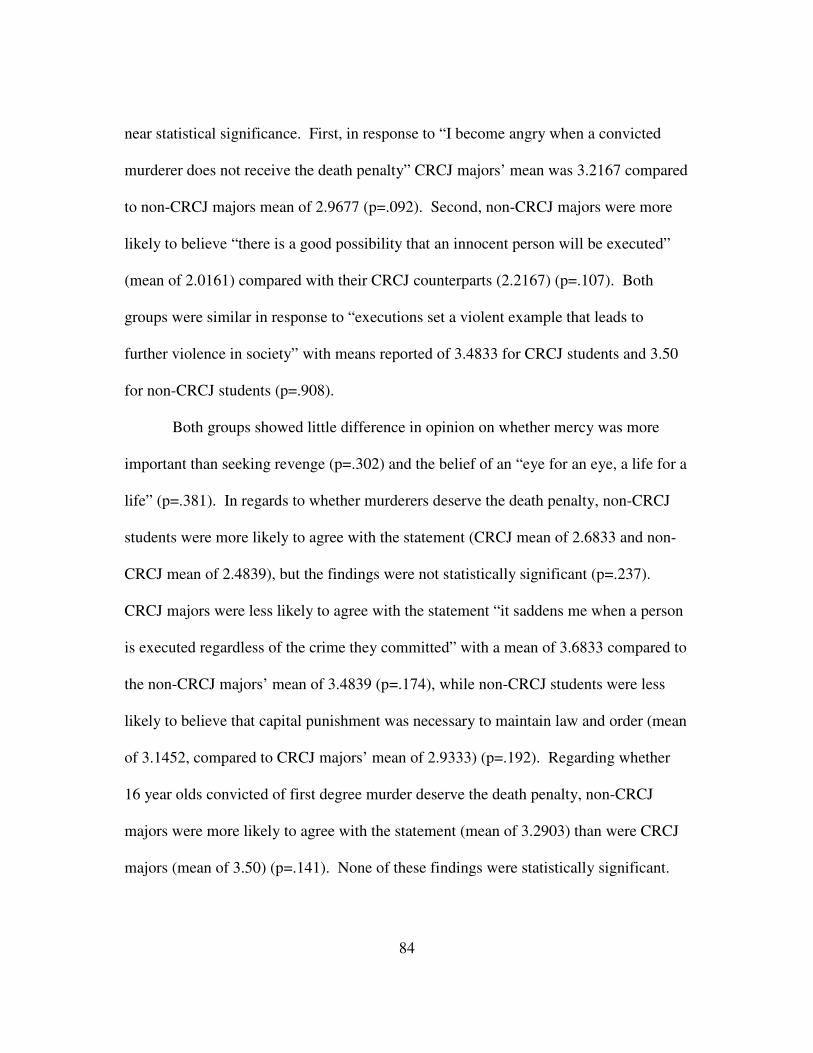
84
near statistical significance. First, in response to “I become angry when a convicted
murderer does not receive the death penalty” CRCJ majors’ mean was 3.2167 compared
to non-CRCJ majors mean of 2.9677 (p=.092). Second, non-CRCJ majors were more
likely to believe “there is a good possibility that an innocent person will be executed”
(mean of 2.0161) compared with their CRCJ counterparts (2.2167) (p=.107). Both
groups were similar in response to “executions set a violent example that leads to
further violence in society” with means reported of 3.4833 for CRCJ students and 3.50
for non-CRCJ students (p=.908).
Both groups showed little difference in opinion on whether mercy was more
important than seeking revenge (p=.302) and the belief of an “eye for an eye, a life for a
life” (p=.381). In regards to whether murderers deserve the death penalty, non-CRCJ
students were more likely to agree with the statement (CRCJ mean of 2.6833 and non-
CRCJ mean of 2.4839), but the findings were not statistically significant (p=.237).
CRCJ majors were less likely to agree with the statement “it saddens me when a person
is executed regardless of the crime they committed” with a mean of 3.6833 compared to
the non-CRCJ majors’ mean of 3.4839 (p=.174), while non-CRCJ students were less
likely to believe that capital punishment was necessary to maintain law and order (mean
of 3.1452, compared to CRCJ majors’ mean of 2.9333) (p=.192). Regarding whether
16 year olds convicted of first degree murder deserve the death penalty, non-CRCJ
majors were more likely to agree with the statement (mean of 3.2903) than were CRCJ
majors (mean of 3.50) (p=.141). None of these findings were statistically significant.
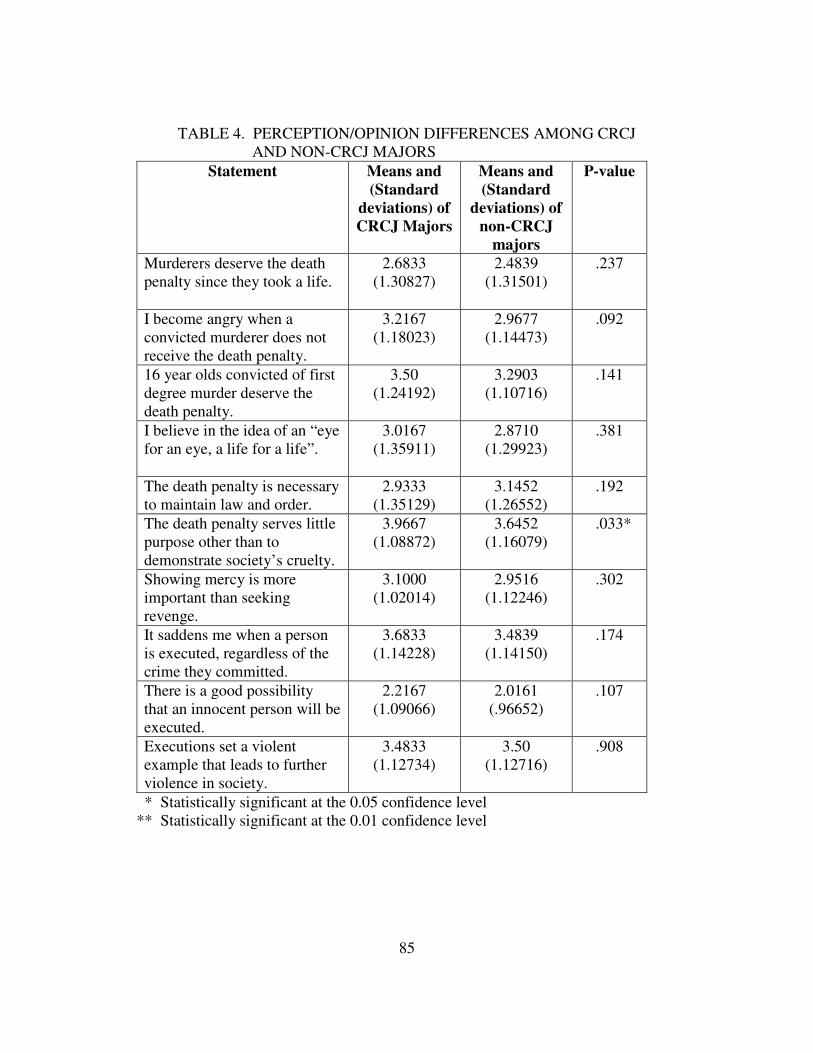
85
TABLE 4. PERCEPTION/OPINION DIFFERENCES AMONG CRCJAND NON-CRCJ MAJORS
Statement Means and(Standard
deviations) ofCRCJ Majors
Means and(Standard
deviations) ofnon-CRCJ
majors
P-value
Murderers deserve the deathpenalty since they took a life.
2.6833(1.30827)
2.4839(1.31501)
.237
I become angry when aconvicted murderer does notreceive the death penalty.
3.2167(1.18023)
2.9677(1.14473)
.092
16 year olds convicted of firstdegree murder deserve thedeath penalty.
3.50(1.24192)
3.2903(1.10716)
.141
I believe in the idea of an “eyefor an eye, a life for a life”.
3.0167(1.35911)
2.8710(1.29923)
.381
The death penalty is necessaryto maintain law and order.
2.9333(1.35129)
3.1452(1.26552)
.192
The death penalty serves littlepurpose other than todemonstrate society’s cruelty.
3.9667(1.08872)
3.6452(1.16079)
.033*
Showing mercy is moreimportant than seekingrevenge.
3.1000(1.02014)
2.9516(1.12246)
.302
It saddens me when a personis executed, regardless of thecrime they committed.
3.6833(1.14228)
3.4839(1.14150)
.174
There is a good possibilitythat an innocent person will beexecuted.
2.2167(1.09066)
2.0161(.96652)
.107
Executions set a violentexample that leads to furtherviolence in society.
3.4833(1.12734)
3.50(1.12716)
.908
* Statistically significant at the 0.05 confidence level** Statistically significant at the 0.01 confidence level

86
4.2.3 Information Source(s)
This section will cover information sources among CRCJ and non-CRCJ majors
expressed in percentages. The most often cited sources of information among both
CRCJ and non-CRCJ majors are television, city or other than campus newspapers, and
the Internet.
4.2.3.1 Print Sources
The most often chosen print source chosen by CRCJ majors and non-CRCJ
majors alike were newspapers (city or other than campus) with 58 percent of each
population reporting this source. College/campus newspaper was chosen by 26 percent
of non-CRCJ majors, while 40 percent of CRCJ majors say they receive information
from campus publications. Magazines were the least chosen source by both groups
with just 20 percent of CRCJ majors and 16 percent of non-CRCJ majors selecting this
source of information.
4.2.3.2 Television, radio and electronic media
Television was by far the most chosen source by both groups among all
categories. Seventy-five percent of CRCJ majors and 82 percent of non-CRCJ majors
get at least some of their information about capital punishment from television. The
Internet was chosen by 53 percent of CRCJ majors and 55 percent of non-CRCJ majors,
while radio was the least chosen source among this category with just 35 percent of
CRCJ majors and 29 percent of non-CRCJ majors choosing this option as one way of
receiving information about the death penalty.
87
4.2.3.3 Interactions with others
Finally, in their interactions with other people, CRCJ and non-CRCJ majors
both report more often getting information from family members (38 percent and 47
percent respectively), followed by friends (32 percent for each population). Few
respondents say they receive information from neighbors. Only 8 percent of CRCJ
majors and 7 percent of non-CRCJ majors receive information from their neighbors.
More non-CRCJ majors (18 percent) receive information from a religious institution
than do CRCJ majors (5 percent). A greater number of CRCJ majors receive
information from “other” (27 percent) than do non-CRCJ majors (15 percent). Table 5
contains a complete summary of responses among CRCJ and non-CRCJ students.
Overall, while CRCJ majors and non-CRCJ majors reported some differences in
information source among religious institution, college/campus newspaper and other, no
significant differences were noted in use of any of the other variables. A similar
number of both groups reported using newspapers (city or other than campus), the
Internet and friends as sources of information. Small differences were noted among the
remaining variables: family, neighbors, television, radio and magazines.
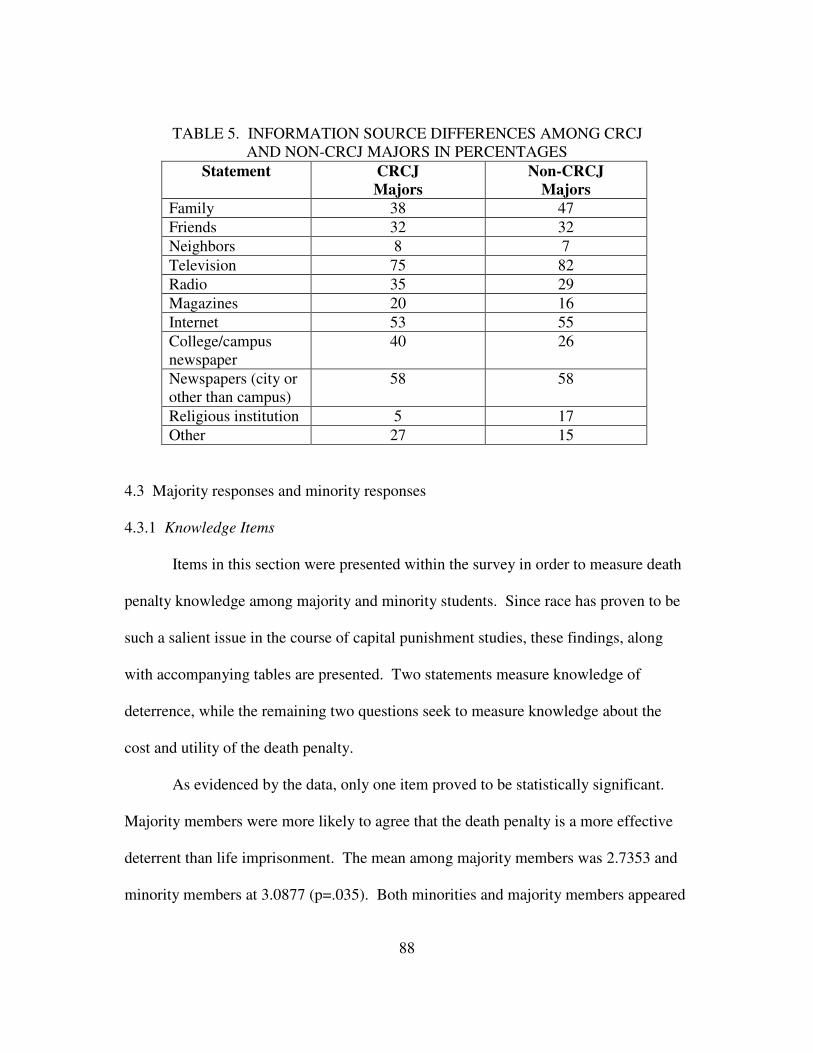
88
TABLE 5. INFORMATION SOURCE DIFFERENCES AMONG CRCJAND NON-CRCJ MAJORS IN PERCENTAGES
Statement CRCJMajors
Non-CRCJMajors
Family 38 47Friends 32 32Neighbors 8 7Television 75 82Radio 35 29Magazines 20 16Internet 53 55College/campusnewspaper
40 26
Newspapers (city orother than campus)
58 58
Religious institution 5 17Other 27 15
4.3 Majority responses and minority responses
4.3.1 Knowledge Items
Items in this section were presented within the survey in order to measure death
penalty knowledge among majority and minority students. Since race has proven to be
such a salient issue in the course of capital punishment studies, these findings, along
with accompanying tables are presented. Two statements measure knowledge of
deterrence, while the remaining two questions seek to measure knowledge about the
cost and utility of the death penalty.
As evidenced by the data, only one item proved to be statistically significant.
Majority members were more likely to agree that the death penalty is a more effective
deterrent than life imprisonment. The mean among majority members was 2.7353 and
minority members at 3.0877 (p=.035). Both minorities and majority members appeared

89
to be similarly knowledgeable about the costs of capital punishment, with a mean of
2.75 and 2.7544 stated for majority and minority members respectively (p=.981).
No statistically significant difference was reported for the question of whether
violent crime declines in a state after an execution. Majority members’ mean was
3.4706, while minority members’ mean was 3.5789 (p=.399). Finally, with a p-value of
.791 “most convicted murderers would kill again if given the opportunity” was not
statistically significant among majority students (2.5588) and minority students
(2.5965).
TABLE 6. KNOWLEDGE BASED DIFFERENCES AMONG MAJORITY ANDMINORITY STUDENTS
Statement Means and(Standard
deviations) ofMajority students
Means and(Standard
deviations) ofMinority students
P-value
The death penalty is amore effectivedeterrent than lifeimprisonment.
2.7353(1.27686)
3.0877(1.22883)
.035*
After the execution ofa murderer, violentcrime in that statedeclines for severalweeks.
3.4706(.96924)
3.5789(.96265)
.399
It costs more money toincarcerate someonefor life without parolethan it does to executethat person.
2.75(1.57759)
2.7544(1.37945)
.981
Most convictedmurderers would killagain if given theopportunity.
2.5588(1.21413)
2.5965(1.06670)
.791
* Statistically significant at the 0.05 confidence level** Statistically significant at the 0.01 confidence level
90
4.3.2 Perception/Opinion Items
Based on a review of the data, it is apparent that opinions and perceptions about
capital punishment differed significantly for almost every question posed among
minority and majority members. Of the three questions that did not report statistical
significance, responses were more dissimilar than similar with one question
approaching statistical significance.
The findings tend to suggest that majorities and minorities view the death
penalty very differently. First, minorities’ tended to agree less with the statement that
“murderers deserve the death penalty since they took a life”. While majorities’ mean
was 2.3235, minorities’ mean was 2.9649 (p=.000). Further, minorities (1.8246)
believed more than majority students (2.2941) that there is a good possibility that an
innocent person will be executed (p=.000). With a mean of 3.7353 for majority
students and a mean of 3.1754 for minorities, minority students were more likely to
believe that executions set a violent example that can lead to further violence (p=.000).
Minorities (3.4737) were also more likely than majority students (4.1176) to perceive
that little purpose other than demonstrating society’s cruelty was served by the
application of the death penalty (p=.000).
The data tends to indicate that minorities may have weaker retributive attitudes.
Fewer minorities (3.3158) believed in the idea of “an eye for an eye” than did majority
students (2.6912) (p=000). Next, minorities (3.3509) were more likely to express
sadness when a person was executed than were majority students (.3.75) (p=.004).

91
Also, minorities (2.8246) expressed more interest in showing mercy rather than seeking
revenge than did majorities (3.1618) (p=.025).
Statistical significance was not achieved on three statements. However, one
item “I become angry when a convicted murderer does not receive the death penalty”
approaches statistical significance. The mean for majority students was 3.000 and for
minority students 3.2807 (p=.077). Minorities’ mean of 3.5439 and majorities’ mean of
3.3235 in regards to whether 16 year olds deserved the death penalty did not approach
statistical significance at .102. No statistical significance among minorities (3.1754)
and majority members (2.8971) was found as to whether capital punishment is
necessary in the interest of maintaining law and order (p=.122).

92
TABLE 7. PERCEPTION/OPINION DIFFERENCES AMONG MAJORITYAND MINORITY STUDENTS
Statement Means and(Standard
deviations) ofMajority students
Means and(Standard
deviations) ofMinority students
P-value
Murderers deserve the deathpenalty since they took a life.
2.3235(1.2748)
2.9649(1.26724)
.000**
I become angry when aconvicted murderer does notreceive the death penalty.
3.000(1.14605)
3.2807(1.17647)
.077
16 year olds convicted of firstdegree murder deserve thedeath penalty.
3.3235(1.28645)
3.5439(1.00125)
.102
I believe in the idea of an “eyefor an eye, a life for a life”.
2.6912(1.36324)
3.3158(1.22704)
.000**
The death penalty is necessaryto maintain law and order.
2.8971(1.31739)
3.1754(1.33795)
.122
The death penalty serves littlepurpose other than todemonstrate society’s cruelty.
4.1176(1.09992)
3.4737(1.0708)
.000**
Showing mercy is moreimportant than seekingrevenge.
3.1618(1.04539)
2.8246(1.10393)
.025*
It saddens me when a personis executed, regardless of thecrime they committed.
3.75(1.21403)
3.3509(1.00873)
.004*
There is a good possibilitythat an innocent person will beexecuted.
2.2941(1.09352)
1.8246(.90874)
.000**
Executions set a violentexample that leads to furtherviolence in society.
3.7353(1.10112)
3.1754(1.11999)
.000**
* Statistically significant at the 0.05 confidence level**Statistically significant at the 0.01 confidence level
4.3.3 Information Sources(s)
A review of the data suggested that less difference was found in respondent’s
information sources. Like CRCJ and non-CRCJ students, both minorities and

93
majority’s three most cited sources of information are television, city or other than
campus newspapers and the Internet.
4.3.3.1 Print Sources
Majority and minority students both chose newspapers (city or other than
campus) as the most often chosen print source of information. Fifty-eight percent of
Majority students chose city newspapers, while 56 percent of minority students chose
city newspapers. The college/campus newspaper was chosen by 35 percent of majority
students and 32 percent of minority students, while an identical percentage in each
population chose magazines as a source of information (18 percent for each population).
4.3.3.2 Television, radio and electronic media
More respondents chose television as a source of information about capital
punishment than any other choice offered. More than three-fourths of each group chose
television as a source of information. The Internet was chosen by 52 percent of
majority students and 54 percent of minorities, followed by radio at 31 percent
(majority) and 33 percent (minority).
4.3.3.3 Interactions with others
Majority students are more likely to receive information from family (49
percent) than from any other source in this category, while the same percentage of
minority students receive information from friends and family (33 percent). Thirty-two
percent of majority students receive information from friends, while few in either group
receive information from their neighbors (4 percent of majority students and 11 percent
of minorities). Just 9 percent of minority students learn about capital punishment

94
through their religious institution, while 13 percent of majority students report religious
institution as a source of information. Other is reported by 25 percent of majority
students and 12 percent of minority students.
Taken as a whole, majority and minority students reported more similarities in
information sources than differences. Students who were part of the majority more
often chose family, and religious institution, while minorities were more likely to
receive information from neighbors. Similar percentages were noted among the
remaining variables: friends, television, radio, magazines, the Internet, college/campus
newspaper and city newspapers. Table 8 contains a complete summary of responses
among minority and majority students. Chapter 5 provides a qualitative interpretation
of the findings and suggestions for other avenues of research.
TABLE 8. INFORMATION SOURCE DIFFERENCES AMONGMAJORITY AND MINORITY STUDENTS IN PERCENTAGESStatement Majority
StudentsMinorityStudents
Family 49 33Friends 32 33Neighbors 4 11Television 79 77Radio 31 33Magazines 18 18Internet 52 54College/campusnewspaper
35 32
Newspapers (city orother than campus)
59 56
Religious institution 13 9Other 25 12
95
CHAPTER 5
DISCUSSION
The findings of this study serve as an interpretation of the differences between
CRCJ/non-CRCJ majors and minority/majority students in relation to knowledge and
perceptions regarding capital punishment. The primary goal of this study was to
examine the possible relationship of perception and knowledge regarding the death
penalty among criminology/criminal justice majors and their non-CRCJ counterparts.
To attain that goal, knowledge and perception were measured through the
implementation of a survey previously utilized by Pasupuleti, et al. (2005) in an
examination of the differences among social work majors and non-social work majors.
In addition, demographic questions were added as well as a question to measure
information source(s) among students.
As illustrated in chapter 2, a review of the literature explored the history of
capital punishment from early Biblical times up to present-day America. Essential
Supreme Court cases were examined, as well as studies examining capital punishment
and race. In addition, opinion studies presented to the general public, and studies that
addressed differences among University students, including criminology/criminal
justice students were reviewed.
A survey was presented to students in six criminology/criminal justice classes at
the University of Texas at Arlington. Data were analyzed using SPSS, analyzing
96
descriptive statistics and the utilization of t tests for comparison of the means among
criminology/criminal justice majors and non-CRCJ majors and among majority and
minority students. While knowledge about the death penalty appeared to differ among
CRCJ and non-CRCJ majors, perception showed very little significant difference.
Knowledge among minority and majority students differed little, but most perception
questions were significantly different at the 0.05 level.
5.1 Contribution to the Body of Knowledge
It is anticipated that this research will make a significant contribution to the
body of knowledge in the field of criminology/criminal justice. The literature review
suggests that although studies have been conducted that compare the differences among
criminology/criminal justice students, none were found that had been conducted in the
State of Texas, the most active death penalty state in the nation (Death Penalty
Information Center, 2006). Since the University is a commuter school, it is expected
that many students have roots in the state of Texas and will become the future leaders
among the criminal justice community, including police officers, attorneys and prison
officials. The results of this study suggest that, although perceptions may not differ
much among CRCJ majors and their non-CRCJ major counterparts, CRCJ majors may
be more knowledgeable about the death penalty. The findings may have educational
and social/cultural implications.
5.2 Limitations of the Research
The author acknowledges the limitations present in the current study. First, the
sample was one of convenience and not randomized. Although more than half the
97
respondents were non-CRCJ majors, all were chosen from CRCJ courses that were
available to the researcher. In addition, the University is a large commuter college and
may not share characteristics common to other Universities. The sample chosen was
from a University in the State of Texas. It may well be that Texans and those who
attend college in Texas harbor more punitive attitudes towards offenders. Thus, it may
not be possible to generalize results to the general population, the entire student body or
to other Universities. The author recognizes the exploratory nature of the study and
acknowledges the limitations therein.
5.3. Criminology/Criminal Justice Majors and non-CRCJ Majors
5.3.1 Knowledge
Criminology/criminal justice majors appeared to have more knowledge about
the death penalty than did non-CRCJ majors. CRCJ majors knew more about the costs
of the death penalty and that most convicted killers would not repeat their crime if given
the chance to do so. Consistent with the informed opinions of most experts in the field
of criminology (Radelet & Akers, 1996) both CRCJ and non-CRCJ majors were almost
equally as likely to know that the death penalty is not a more effective deterrent than
being imprisoned for life. Further, more CRCJ majors disagreed with the statement that
the execution of a murderer has a short-term effect on the felony murder rate. Cochran,
et al. (1994) found some evidence that felony murders may have been slightly lower
after a highly publicized execution, but their findings were not significant. Since most
executions in Texas are no longer highly publicized, it would be expected that little
deterrent value could result. These results were expected and were likely due to CRCJ

98
students enrolling in more criminology/criminal justice classes, and working or
conversing with other people working in the field of criminal justice. While knowledge
yielded some significant results, perceptions were similar among both groups.
5.3.2 Cultural/Social: Perception and Capital Punishment
Counter to Bohm’s (1990) findings, CRCJ students were less likely to express
anger and the opinion that murderers deserve to die than their non-CRCJ counterparts.
Despite that finding, non-CRCJ students were the most likely to express sadness over an
execution and to agree that showing mercy was more important than revenge. CRCJ
students were more likely to see the death penalty as a law and order utilitarian
measure. An almost identical result among both groups was achieved with reference to
whether executions set an example that leads others in society to commit violent acts.
The only significant finding was that non-CRCJ majors were more likely to agree that
the death penalty serves little purpose other than the demonstration of society’s cruelty.
The findings tend to indicate that CRCJ and non-CRCJ majors hold similar views on the
death penalty regardless of their level of knowledge.
5.4 Majority and Minority Students
5.4.1 Knowledge
Minority students were more knowledgeable about the lack of deterrent effect of
capital punishment. Both majority and minority students had similar knowledge in
regard to the costs and likelihood of murderers repeating their crimes if given the
opportunity. Although more minority students believed that violent crime declined after
the execution of an offender, the results were not significant. Knowledge among both
99
groups was more similar than different. With that in mind, it is interesting to note that
perceptions about capital punishment yielded a different result.
5.4.2 Cultural/Social: Perceptions and Capital Punishment
Race is one of the more relevant issues in the debate on capital punishment.
Therefore, the findings in regard to perception are instructive and of far-reaching
consequences culturally and socially. Consistent with other studies on race and capital
punishment, majority and minorities differ in their feelings about capital punishment
(Arthur, 1998; Barkan & Cohn, 1994; Cohn, et al., 1991; Soss, et al., 2003; Unever, et
al., 2005; Young, 2004). Although both groups reported similar knowledge about
capital punishment, seven of ten questions were statistically significant, with an eighth
question approaching statistical significance. The pattern of findings tends to indicate
that minorities are less punitive than are majority students, consistent with studies
showing that whites are more likely to support the death penalty than minorities
(Arthur, 1998; Baker, et al., 2005; Hagen & Albonetti, 1982; Unever, et al., 2005).
Minority students more often expressed sadness when a person was executed, and to
believe that an innocent person was likely to be executed. Further, the death penalty
was viewed by minorities as an example of society’s cruelty and a violent example that
was likely to promote further violence in society. Finally, the only three questions
which did not reach statistical significance were in regard to anger over a convicted
murderer who does not receive the death penalty (approaches statistical significance),
whether 16 year old murderers deserved to die and the notion that the death penalty is a
necessary law and order measure.

100
5.5 Implications for Education about Capital Punishment
Justice Marshall asserted that Americans knew little about the death penalty, but
if they did possess greater knowledge, support for capital punishment would be greatly
diminished. In support of Justice Marshall’s theories about support for capital
punishment, researchers have found that at least some students who take special death
penalty courses are both able to increase their level of knowledge and challenge their
perceptions of capital punishment (Bohm, 1989; Bohm, 1990; Bohm, et al., 1990;
Bohm, et al., 1991; Wright, et al., 1995).
CRCJ students may have more knowledge about capital punishment because of
greater classroom and/or field experience, as well as socializing with others who hold
positions in police departments, correctional facilities or in the community supervision
field. Further, because they are criminology/criminal justice majors, CRCJ students
may pay more attention to news reports, read more news articles and generally discuss
the death penalty more than non-CRCJ students. The data tend to indicate that although
CRCJ students may have more death penalty knowledge than non-CRCJ students,
perceptions and opinions about capital punishment are not necessarily influenced by the
information CRCJ students are receiving; little significant difference exists between
CRCJ and non-CRCJ students.
Given the gravity of capital punishment and the reasonable expectation that
criminology/criminal justice students will become policymakers, educators and criminal
justice professionals, educators should be challenging students’ perceptions about
capital punishment by engaging students in meaningful dialogue to seek an
101
understanding of why students form certain perceptions about the death penalty.
University educators could encourage students to take part in death penalty debate and
research, while criminology/criminal justice departments might also promote interest by
offering an elective course in capital punishment.
In furtherance of that goal, more applied experience should be available to
CRCJ students so that opinions are not formed from reading and classroom experience
alone. Students might gain a greater understanding of capital punishment by visiting a
prison where the death penalty is administered and engaging in meaningful dialogue
with the criminal justice personnel most closely connected with the practice of carrying
out executions. Prison chaplains, corrections officers and wardens may be able to
provide for students different points of view. Further, students might benefit from
respectful discussion with willing family members of victims and offenders. Through a
thorough examination of the death penalty, CRCJ students may gain a greater, more
balanced, understanding of the nature and costs of government-sponsored execution.
5.6 Social/Cultural Implications
As supported by the previous literature, minority and majority students feel very
differently about the death penalty (Arthur, 1998; Barkan & Cohn, 1994; Cohn, et al.,
1991; Hagen & Albonetti, 1982). Because both groups indicated similar levels of
knowledge about capital punishment, the data may tend to indicate that support for the
death penalty is based on personal experience rather than level of knowledge. Blacks
are grossly overrepresented in the criminal justice system, are more likely to be
sentenced to death (Radelet, 1981) and have historically experienced the horrors of
102
slavery, illegal lynching and the indignity of segregation and prejudice. Most persons
who are part of the majority (Caucasian) may have little ability to empathize.
Thus, it may fall to criminal justice agencies, courts and communities to
challenge the racial divide that exists in relation to death penalty perception. County
and District Courts could address the inequities and prejudices in the application of the
death penalty by providing better avenues to legal assistance for the poor, often
minority, defendants. Minorities are more likely to be impoverished and thus, be
assigned court-appointed attorneys who have little or no death penalty experience. This
leaves the defendant with little ability to assert what limited rights are afforded to them.
Courts should select seasoned trial attorneys experienced in death penalty litigation and
increase monetary allowances for preparation of the defendant’s case. Providing
quality, competent legal aid to the poor and minorities could help to shrink the racial
divide that exists in relation to the harsh realities of the death penalty.
Police departments must be vigilant in their policies that minorities are not
experiencing discrimination. Review of policy, meeting with leaders and members of
the community on a regular basis and showing sincere concern will engender greater
trust in police and prosecutors among both minority and majority citizens. City leaders
can hold open council meetings where residents can bring forth concerns and seek
answers to problems.
Churches and other local organizations can build bridges between neighboring
citizens, help assess what needs are not being met and strive to find common solutions
across ethnicities. Some of the ways in which religious and local organizations can
103
achieve greater understanding among majority/minority groups are through gaining the
support of the populace through implementation of community centers, boys’ and girls’
clubs, big brother/big sister programs and other programs designed to benefit the entire
community. Local leaders, individuals and officers of the courts face a tremendous
challenge if they are to overcome racial stereotypes and prejudices endemic in society
and the court systems.
5.7 Suggestions for further research
Future policy-makers in the field of criminal justice come from several different
fields of study, not just those majoring in criminology/criminal justice. For instance,
political science majors may well find themselves employed in the field of
criminology/criminal justice and active in the formulation of policy. A meaningful
comparison of knowledge and perceptions held by political science majors and
criminology/criminal justice majors could reveal differences in opinions and
knowledge. In addition, comparing students based on life history might reveal factors
which shape early opinion and perception of crime and capital punishment.

104
APPENDIX A
PROFESSOR’S STATEMENT OF PURPOSE
105
The death penalty through the lenses ofcriminology/criminal Justice students
and non-CRCJ students
Professor’s Statement of Purpose
Class:
This study is being conducted by a graduate student in the Criminology/Criminal JusticeDepartment under the direction of Alex del Carmen, Ph.D., a faculty member in theDepartment of Criminology/Criminal Justice. They asked if I would be willing toadminister this survey during one of my class periods and I agreed.
The purpose of this study is to examine the possible differences among CRCJ majors’and non-CRCJ majors’ knowledge and perceptions regarding the death penalty. Youshould know that your participation in this survey is completely voluntary. Noquestions on this survey will enable the researchers to directly identify you. You maychoose not to answer any question(s) or choose not to participate in the survey withoutconsequence. If you have already participated in this survey in another class, please donot fill in this survey. This survey should take approximately 20 minutes to complete.When you have completed the survey, please return it to me.
Thank you for agreeing to be a part of this important research project.

106
APPENDIX B
INSTRUCTIONS FOR COMPLETION OF THE SURVEY

107
The Death Penalty through the lenses ofCriminology/criminal justice students
and non-CRCJ students
The purpose of this study is to examine the possible differences among CRCJ majors’and non-CRCJ majors’ knowledge and perceptions regarding the death penalty. Yourparticipation in this survey is completely voluntary. No questions on this survey willenable the researchers to directly identify you. You may choose not to answer anyquestion or choose not to participate in the survey without consequence. If you havealready participated in this survey in another class, please do not fill in this survey. Thesurvey should take approximately 20 minutes to complete.
Thank you for agreeing to be a part of this important research project!
Instructions for Completion of the Survey
Please answer each question by marking only one answer and/or by printing therequested information in the space provided.
Please complete the survey during class time and return it to your professor.
Do NOT give this survey to anyone else to complete. You have been selected becauseof the particular class you are in.

108
APPENDIX C
STUDENT SURVEY
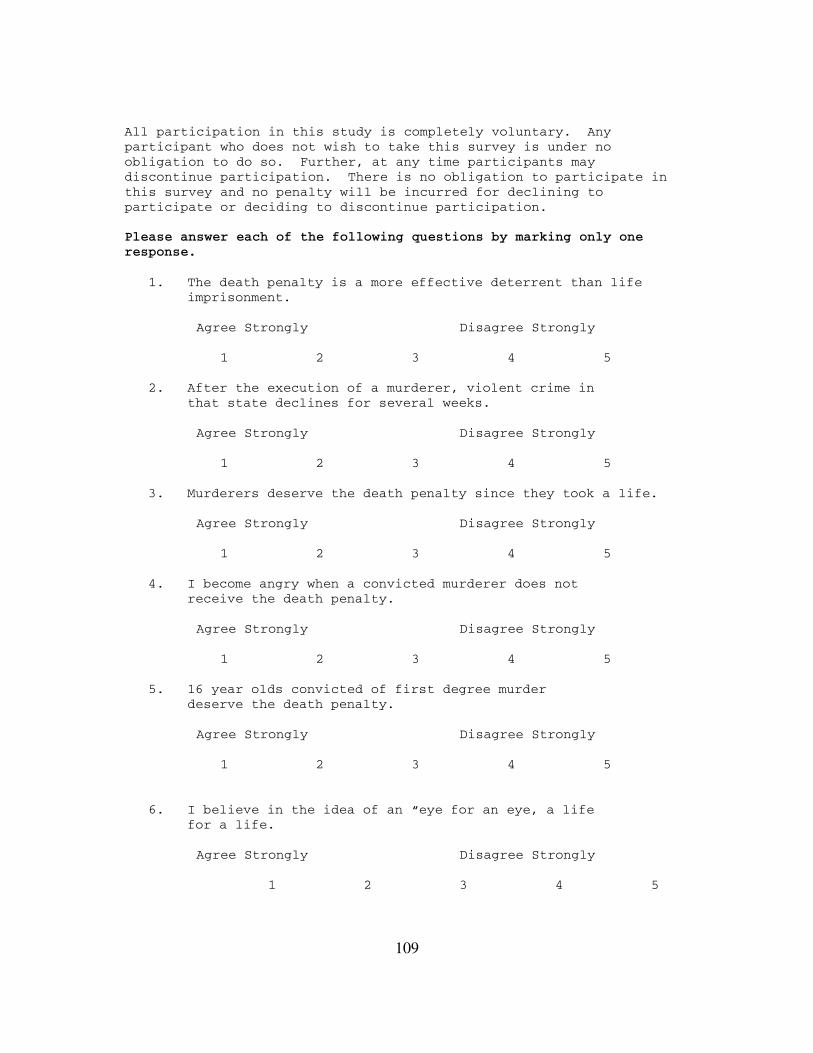
109
All participation in this study is completely voluntary. Anyparticipant who does not wish to take this survey is under noobligation to do so. Further, at any time participants maydiscontinue participation. There is no obligation to participate inthis survey and no penalty will be incurred for declining toparticipate or deciding to discontinue participation.
Please answer each of the following questions by marking only oneresponse.
1. The death penalty is a more effective deterrent than lifeimprisonment.
Agree Strongly Disagree Strongly
1 2 3 4 5
2. After the execution of a murderer, violent crime inthat state declines for several weeks.
Agree Strongly Disagree Strongly
1 2 3 4 5
3. Murderers deserve the death penalty since they took a life.
Agree Strongly Disagree Strongly
1 2 3 4 5
4. I become angry when a convicted murderer does notreceive the death penalty.
Agree Strongly Disagree Strongly
1 2 3 4 5
5. 16 year olds convicted of first degree murderdeserve the death penalty.
Agree Strongly Disagree Strongly
1 2 3 4 5
6. I believe in the idea of an “eye for an eye, a lifefor a life.
Agree Strongly Disagree Strongly
1 2 3 4 5
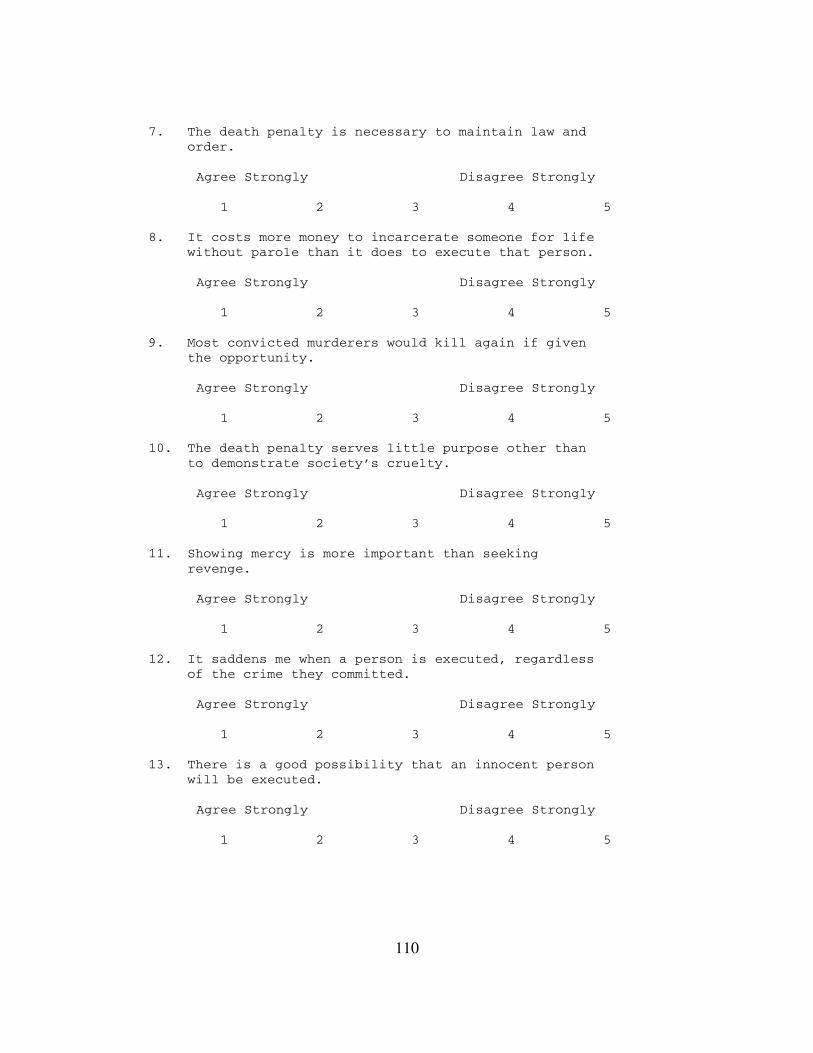
110
7. The death penalty is necessary to maintain law andorder.
Agree Strongly Disagree Strongly
1 2 3 4 5
8. It costs more money to incarcerate someone for lifewithout parole than it does to execute that person.
Agree Strongly Disagree Strongly
1 2 3 4 5
9. Most convicted murderers would kill again if giventhe opportunity.
Agree Strongly Disagree Strongly
1 2 3 4 5
10. The death penalty serves little purpose other thanto demonstrate society’s cruelty.
Agree Strongly Disagree Strongly
1 2 3 4 5
11. Showing mercy is more important than seekingrevenge.
Agree Strongly Disagree Strongly
1 2 3 4 5
12. It saddens me when a person is executed, regardlessof the crime they committed.
Agree Strongly Disagree Strongly
1 2 3 4 5
13. There is a good possibility that an innocent personwill be executed.
Agree Strongly Disagree Strongly
1 2 3 4 5

111
14. Executions set a violent example that leads tofurther violence in society.
Agree Strongly Disagree Strongly
1 2 3 4 5
INFORMATION SOURCE
15. Where do you get most of your information about thedeath penalty?
(Please mark all that apply)
{ } Family { } Friends { } Neighbors{ } Television { } Radio { } Magazines{ } Internet { } College/campus newspaper{ } Newspapers (city or other than campus){ } Other { } religious institution
16. Your sex: { } Male { } Female
17. Your age at last birthday:
{ } 18-24 years { } 25-30 years { } 31-35 years{ } 36-40 years { } 41-45 years { } 46-50 years{ } 51-55 years { } 56-60 years { } 61 & older
18. Do you identify yourself as:
{ } African American { } Caucasian { } Asian{ } Native American { } Hispanic{ } Pacific Islander { } Other
19. Your student status:
{ } Freshman { } Sophomore { } Junior { } Senior{ } Graduate
20. Do you live on campus? { } Yes { } No
21. What is your marital status?
{ } Single { } Married { } Separated{ } Divorced { } Cohabitating { } Widowed
22. Are you registered to vote? { } Yes { } No
23. What best describes your political affiliation?
{ } Democrat { } Republican{ } Independent { } Other { } None

112
24. What is the size of the town or city in which youlive?
{ } Rural { } Urban { } Suburban
25. What is your school enrollment status?
{ } Full time { } Part time
26. What is your major? _____________________________ .
27. What is your cumulative GPA at UTA?
{ } less than 1.5 { } 1.5 to 2.0 { } 2.1 to 2.5{ } 2.6 to 3.0 { } 3.1 to 3.5 { } 3.6 to 4.0
113
REFERENCES
Adams, R. (1991). Adams v. Texas. New York, N.Y.: St. Martin’s Press.
Amnesty International. (2006). List of Abolitionist and Retentionist Countries,
2006. Retrieved 7 March, 2006. Retrieved from
http://www.web.amnesty.org/ai.nsf/index/ACT500052000.
Anders, M. (2003). Racial Differences in Perceptions Regarding the Deterrent
Effects of the Death Penalty among Criminology and Criminal Justice Students
(Master’s thesis, University of Texas at Arlington, 2003), (UMI No. 1414731).
Anthony, K. (1999). The Relationship between Race, Racial Identity, and the
Death Penalty Attitudes of Blacks and Whites. Dissertation Abstracts International,
(UMI No. 9955898).
Arthur, J. (1998). Racial Attitudes and Opinions about Capital Punishment:
Preliminary Findings. International Journal of Comparative and Applied Criminal
Justice, 22(1), 131-144.
Atkins v. Virginia, 536 U.S. 304 (2002).
Babbie, E. (2004). The Practice of Social Research. (10th ed.), Belmont, CA.:
Wadsworth.
Bailey, W. (1998). Deterence, Brutalization, and the Death Penalty.
Criminology, 36(4), 711-733.
Baker, D., Lambert, E. & Jenkins, M. (2005). Racial Differences in Death
Penalty Support and Opposition: A Preliminary Study of White and Black College
Students. Journal of Black Studies, 35(4), 201-224.
114
Baldus, D., Woodworth, G. & Pulaski, C. (1990). Equal Justice and the Death
Penalty: A Legal and Empirical Analysis. Boston, MA.: Northeastern University Press.
Banner, S. (2002). The Death Penalty: An American History. Cambridge, MA:
Harvard University Press.
Barkan, S. & Cohn, S. (1994). Racial Prejudice and Support for the Death
Penalty by Whites. Journal of Research in Crime and Delinquency, 31(2), 202-209.
Batson v. Kentucky, 476 U.S. 79 (1986).
Baumer, E., Messner, S. & Rosenfeld, R. (2003). Explaining Spatial Variation
in Support for Capital Punishment: A Multilevel Analysis. American Journal of
Sociology, 108(4), 844-875.
Beccaria, C. (1996). On Crimes and Punishment. New York, N.Y.: Marsilio
Publishers.
Bedau, H. (1997). The Death Penalty in America. Garden City, N.Y.:
Doubleday.
Bohm, R. (1987). American Death Penalty Attitudes: A Critical Examination of
Recent Evidence. Criminal Justice and Behavior, 14(3), 380-396.
Bohm, R. (1989). The Effects of Classroom Instruction and Discussion on
Death Penalty Opinions: A Teaching Note. Journal of Criminal Justice, 17(2), 123-131.
Bohm, R. (1990). Death Penalty Opinions: A Classroom Experience and Public
Commitment. Sociological Inquiry, 60(3), 285-297.
Bohm, R., Clark, L. & Aveni, A. (1990). The Influence of Knowledge on
Reasons for Death Penalty Opinions: An Experimental Test. Justice Quarterly, 7(1),
175-188.
115
Bohm, R., Clark, L., & Aveni, A. (1991). Knowledge and Death Penalty
Opinion: A Test of the Marshall Hypothesis. Journal of Research in Crime and
Delinquency, 28(3), 360-387.
Bohm, R., Vogel, R. & Maisto, A. (1993). Knowledge and Death Penalty
Opinion: A Panel Study. Journal of Criminal Justice, 21(1), 29-45.
Bohm, R. & Vogel, B. (2004). More than Ten Years After: The Long-term
Stability of Informed Death Penalty Opinions. Journal of Criminal Justice, 32, 307-327.
Bohm, R. & Vogel, R. (1994). A Comparison of Factors Associated with
Uninformed and Informed Death Penalty Opinions. Journal of Criminal Justice, 22(2),
125-143.
Bohm, R. (2003). Deathquest II: An Introduction to the Theory and Practice of
Capital Punishment in the United States. Cincinnati, Ohio; Anderson Publishing Co.
Boots, D., Heide, K. & Cochran, J. (2004). Death Penalty Support for Special
Offender Populations of Legally Convicted Murderers: Juveniles, the Mentally
Retarded, and the Mentally Incompetent. Behavioral Sciences and the Law, 22, 223-
238.
Bright, S. (1995). Discrimination, Death and Denial: The Tolerance of Racial
Discrimination in Infliction of the Death Penalty. Santa Clara Law Review, 35, 901-
950.
Chiricos, T. & Waldo, G. (1970). Punishment and Crime: An Examination of
Some Empirical Evidence. Social Forces, 18(2), 200-217.
Cochran, J. & Chamlin, M. (2005). Can Information Change Public Opinion?
Another Test of the Marshall Hypotheses. Journal of Criminal Justice, 33, 573-584.
Cochran, J. & Chamlin, M. (2006). The Enduring Divide in Death Penalty
Support. Journal of Criminal Justice, 34, 85-99.

116
Cochran, J., Chamlin, M. & Seth, M. (1994). Deterrence or Brutalization? An
Impact Assessment of Oklahoma’s Return to Capital Punishment. Criminology, 32,
107-134.
Cockburn, A. (2001). Hate Versus Death, Nation, 272(10), 9-11.
Coker v. Georgia, 433 U.S. 584 (1977).
Cohn, S., Barkan, S. & Halteman, W. (1991). Punitive Attitudes toward
Criminals: Racial Consensus or Racial Conflict? Social Problems, 38(2), 287-296.
Death Penalty Information Center. (2006). What’s New. Retrieved September
10, 2006. Available from http://www.deathpenaltyinfo.org; Internet.
del Carmen, A. (2000). Corrections: Blueprints. Madison, WI: Coursewise
Publishing.
del Carmen, A. (2002) Corrections. Cincinnati, Ohio: Atomic Dog Publishing.
del Carmen, A., Polk, O., Segal, C. & Bing, R. (2000). Fear of Crime on
Campus: Examining Fear Variables of CRCJ Majors and nonmajors in pre- and post-
serious crime environments. Journal of Security Administration, 23(1), 21-36.
Dieter, R. (1994). Secondary Smoke Surrounds the Capital Punishment Debate.
Criminal Justice Ethics, 13(1), 2-11.
Dike, S. (1981). Capital Punishment in the United States. Criminal Justice
Abstracts, 13(2, 3 & 4), 283-311, 426-447, 577-597.
Edens, J., Colwell, L., Desforges, D. & Fernandez, K. (2005). The Impact of
Mental Health Evidence on Support for Capital Punishment: Are Defendants Labeled
Psychopathic Considered More Deserving of Death? Behavioral Sciences and the Law,
23, 603-625.
Elliot, R. & Robinson, R. (1991). Death Penalty Attitudes and the Tendency to
Convict or Acquit: Some Data. Law and Human Behavior, 15(4), 389-404.

117
Ellsworth, P. & Ross, L. (1983). Public Opinion and Capital Punishment: A
Close Examination of the Views of Abolitionists and Retentionists. Crime &
Delinquency, January, 116-169.
Ellsworth, P. & Gross, S. (1994). Hardening of the Attitudes: Americans’
Views on the Death Penalty. Journal of Social Issues, 50(2), 19-52.
Firment, K. & Geiselman, E. (1997). University Students’ Attitudes and
Perceptions of the Death Penalty. American Journal of Forensic Psychology, 15(3), 65-
89.
Ford v. Wainwright, 477 U.S. 399 (1986).
Fox, J., Radelet, M. & Bonsteel, J. (1990-91). Death Penalty Opinion in the
Post-Furman Years. Review of Law & Social Change, 18, 499-528.
Furman v. Georgia, 408 U.S. 238, 1972.
Gallup, A. & Newport, F. (1991). Death Penalty Support Remains Strong. The
Gallup Poll Monthly 309 (1991), 40-45.
Garfinkel, H. (1949). Research Note on Inter- and Intra-Racial Homicides. The
Gallup Poll Monthly 309, 40-45.
Garner, B. (Ed.) (1999). Black’s Law Dictionary. (7th ed.), St. Paul, MN: West
Group.
Gibbs, J. (1968). Crime, Punishment and Deterrence. Southeastern Social
Science Quarterly, 48, 515-530.
Glaser, D. & Zeigler, M. (1974). Use of the Death Penalty v. Outrage at
Murder. Crime and Delinquency, 20, 333-338.
Gregg v. Georgia, 428 U.S. 153, 1976.
Hagen, J. & Albonetti, C. (1982). Race, Class and the Perception of Criminal
Injustice in America. American Journal of Sociology, 88(2), 329-355.
118
Hawkins, D. (1981). Causal Attribution and Punishment for Crime. Deviant
Behavior, 2(3), 207-230.
High Court Rejects Broader Death Penalty Review (2006). MSNBC. Retrieved
February 27, 2006 from
http://www.msnbc.com/id/11590821/print/1/displaymode/1098/.
Honeyman, J. & Ogloff, R. (1996). Capital Punishment: Arguments for Life
and Death. Canadian Journal of Behavioural Science, 28, 27-35.
Hurwitz, J. & Peffley, M. (2000). Public Perceptions of Race and Crime: The
Role of Racial Stereotypes. American Journal of Political Science, 41(2), 375-401.
Inciardi, J. (1999). Criminal Justice. (6th ed.), Fort Worth, Texas: Harcourt
Brace College Publishers.
Johnson, G. (1941). The Negro and Crime. Annals of the American Academy,
217, 375-401.
Johnson, R. (1998). Deathwork. (2nd ed.), Belmont, CA: Wadsworth.
Jurek v. Texas 428 U.S. 262, 1976.
Kelly, D. (1997). Attitude Polarization in the Context of the Death
Qualification Process: The Moderating Effects of Attitude Structure (Capital
Punishment). Dissertation Abstracts International, (UMI No. 9724280).
Keppel, G., Saufley, W. & Tokunaga, H. (1992). Introduction to Design and
Analysis: A Student’s Handbook. (2nd ed.), New York, N.Y.; W.H. Freeman and
Company.
Lambert, E. & Clarke, A. (2001). The Impact of Information on an Individual’s
Support of the Death Penalty: A Partial Test of the Marshall Hypothesis among College
Students. Criminal Justice Policy Review, 12(3), 215-234.
119
Lester, D. Maggioncalda-Aretz, M. & Stark, S. (1997). Adolescents’ Attitudes
Toward the Death Penalty. Adolescence, 32(126), 447.
Lifton, R. & Mitchell, G (2002). Who Owns Death? Capital Punishment, The
American Conscience, and the End of Executions. New York, N.Y., HarperCollins
Publishers, Inc.
Mangum, C. (1940). The Legal Status of the Negro. Chapel Hill, N.C., North
Carolina Press.
Marquart, J., Ekland-Olson, S. & Sorensen, J. (1994). The Rope, the Chair and
the Needle: Capital Punishment in Texas, 1923-1990. Austin, Texas, University of
Texas Press.
Maxwell, S. & Rivera-Vazquez, O. (1998). Assessing the Instrumental and
Symbolic Elements in Attitudes toward the Death Penalty Using a Sample of Puerto
Rican Students. International Journal of Comparative and Applied Criminal Justice,
22(2), 329-339.
McCleskey v.Kemp 481 U.S. 279, 1987.
McCormick, J. (1998). The Wrongly Condemned: How Many Capital Cases
End in False Convictions? Newsweek, 132(19), 64-65.
Michigan State University Comm Tech Lab and Death Penalty Information
Center. (2001). Death Penalty Curricula for High School. Retrieved March 4, 2006.
Available from http://deathpenatlyinfo.msu.edu; Internet.
Moon, M., Wright, J., Cullen, F. & Pealer, J. (2000). Putting Kids to Death:
Specifying Public Support for Juvenile Capital Punishment. Justice Quarterly, 17(4),
663-684.
Morsbach, H. & Morsbach, G. (1967). Attitudes toward Capital Punishment in
South Africa. British Journal of Criminology, 7(4), 394-403.
120
Neser, J., van der Westhuizen, J. & Ladikos, T. (1986). To Hang or Not to
Hang, That is the Question. South African Journal of Criminal Law and Criminology,
10(2), 129-134.
Pasupuleti, S., Lambert, E. & Cluse-Tolar, T. (2005). Undergraduate Views of
Capital Punishment: Are Social Work Students Different from Other Students? Journal
of Social Work Values and Ethics, 2(2), Retrieved March 9, 2006 from
http://www.socialworker.com/jswve/content/view/20/37/.
Patten, M. (2005). Proposing Empirical Research: A Guide to the
Fundamentals. Los Angeles, CA: Pyrczak Publishing.
Penry v. Lynaugh, 492 U.S. 302 (1989).
Profitt v. Florida 428 U.S. 242, 1976.
Radelet, M. (1981). Racial Characteristics and the Imposition of the Death
Penalty. American Sociological Review, 46, 918-927.
Radelet, M. (1989). Executions of Whites for Crimes Against Blacks:
Exceptions to the Rule? The Sociological Quarterly, 30, 535.
Radelet, M. & Akers, R. (1996). Deterrence and the Death Penalty: The Views
of the Experts. Journal of Criminal Law & Criminology, 87(1), 1-14.
Ralph, P., Sorensen, J. & Marquart, J. (1992). A Comparison of Death-
Sentenced and Incarcerated Murderers in Pre-Furman Texas. Justice Quarterly, 9, 185-
209.
Rankin, J. (1979). Changing Attitudes toward Capital Punishment. Social
Forces, 58(1), 194-211.
Roberts v. Louisiana, 428 U.S. 325 (1976).

121
Robinson, R. (1993). What Does Unwilling to Impose the Death Penalty Mean
Anyway? Another Look at Excludable Jurors. Law and Human Behavior, 17(4), 471-
477.
Roper v. Simmons 543 U.S. 551 (2005).
Sarat, A. & Vidmar, N. (1976). Law and Society: Public Opinion, the Death
Penalty, and the Eighth Amendment: Testing the Marshall Hypothesis. Wisconsin Law
Review, 1976(1), 171-197.
Scheck, B., Neufeld, P. & Dwyer, J. (2000). Actual Innocence: Five Days to
Execution and Other Dispatches from the Wrongfully Convicted. New York, N.Y.:
Doubleday.
Sellin, J. (1959). The Death Penalty: A Report for the Model Penal Code
Project of the American Law Institute. Philadelphia, PA: American Law Institute.
Sellin, J. (1967). Capital Punishment. New York, N.Y.: Harper and Row.
Shapiro, B. (1997). Law and Order: Sleeping Lawyer Syndrome. The Nation,
Retrieved April 12, 2006. Available from http://past.thenation.com/issue/970407.
Shelden, R. (2001). Controlling the Dangerous Classes: A Critical Introduction
to the History of Criminal Justice. Needham Heights, MA: Allyn & Bacon.
Siegel, L. (1998). Criminology. (6th ed.), Belmont, CA: Wadsworth, 2000.
Smith, C., Dykema-Engblade, A., Walker, A., Niven, T. & McGough, T. (2000).
Asymmetrical Social Influence in Freely Interacting Groups Discussing the Death
Penalty: A Shared Representations Interpretation. Group Processes & Intergroup
Relations, 3(4), 387-401.
Soss, J., Langbein, L. & Metelko, A. (2003). Why do White Americans Support
the Death Penalty? The Journal of Politics, 65(2), 397-421.
Stanford v. Kentucky, 492 U.S. 361 (1989).
122
Steele, T. & Wilcox, N. (2003). A View from the Inside: The Role of
Redemption, Deterrence, and Masculinity on Inmate Support for the Death Penalty.
Crime & Delinquency, 49(2), 285-312.
Stevenson, B., (2001). Capital Punishment: Murder Most Foul. Crisis (January-
February), 20-21. Retrieved March 24, 2006.
Sweet, S. & Grace-Martin, K. (2003). Data Analysis with SPSS: A First Course
in Applied Statistics. 2nd ed. Boston, MA: Allyn and Bacon.
Thompson v. Oklahoma, 487 U.S. 815 (1988).
Tittle, C. (1969). Crime Rates and Legal Sanctions. Social Problems, 16, 409-
423.
Tonry, M. (1996). Sentencing Matters. New York, N.Y.: Oxford University
Press.
Trop v. Dulles, 356 U.S. 86 (1958).
Turabian, K. (1996). A Manual for Writers of Term Papers, Theses, and
Dissertations (6th ed.). Chicago: The University of Chicago Press.
Unever, J., Cullen, F. & Roberts, J. (2005). Not Everyone Strongly Supports the
Death Penalty: Assessing Weakly-held Attitudes about Capital Punishment. American
Journal of Criminal Justice, 29(2), 187-219.
University of Texas at Arlington, Online Schedule of Classes. (2006). Retrieved
April 1, 2006 from University of Texas at Arlington website:
https://epprd.uta.edu/psp/EP89PRD/EMPLOYEE/EMPL/h/signon.html/.
Vidmar, N. & Dittenhoffer, T. (1981). Informed Public Opinion and Death
Penalty Attitudes. Canadian Journal of Criminology, 23(1), 43-56.
123
Vogel, B. (2003). Support for Life in Prison without the Possibility of Parole
Among Death Penalty Proponents. American Journal of Criminal Justice, 27(2), 263-
275.
Vogel, B. & Vogel, R. (2003). The Age of Death: Appraising Public Opinion of
Juvenile Capital Punishment. Journal of Criminal Justice, 31, 169-183.
Vold, G., Bernard, T. & Snipes, J. (2002). Theoretical Criminology. (5th ed.),
New York, N.Y.: Oxford University Press.
Vollum, S., Longmire, D. & Buffington-Vollum, J. (2004). Confidence in the
Death Penalty and Support for its Use: Exploring the Value-expressive Dimension of
Death Penalty Attitudes. Justice Quarterly, 21(3), 521-546.
Walker, S., Spohn, C. & Delone, M. (1996). The Color of Justice: Race,
Ethnicity, and Crime in America. 2nd ed. Belmont, CA: Wadsworth.
Warden: Williams Frustrated at End (2005). Retrieved September 9, 2006.
CNN. Available from
http://cnn.worldnews.printthis.clickability.com/pt/cpt?action=cpt&title=CNN.com+-
+Ward.
Webster’s II New College Dictionary. (2001). New York, N.Y.: Houghton
Mifflin Company.
Whitehead, J. & Blankenship, M. (2000). The Gender Gap in Capital
Punishment Attitudes: An Analysis of Support and Opposition. American Journal of
Criminal Justice, 25(1), 1-13.
Witherspoon v. Illinois, 391 U.S. 510, 1968.
124
Wolfgang, M., Kelly, A. & Nolde, H. (1962). Comparisons of the Executed and
the Commuted Among Admissions on Death Row. Journal of Criminal Law,
Criminology and Police Science, 53, 301.
Wolfgang, M. & Reidel, M. (1973). Race, Judicial Discretion, and the Death
Penalty. Annals of the American Academy, 407, 119-133.
Wolfgang, M. & Reidel, M. (1975). Rape, Race and the Death Penalty in
Georgia. American Journal of Orthopsychiatry, 45, 658-668.
Wright, H., Bohm, R. & Jamieson, K. (1995). A Comparison of Uninformed and
Informed Death Penalty Opinions: A Replication and Expansion. American Journal of
Criminal Justice, 20(1), 57-87.
Young, R. (1991). Race, Conceptions of Crime and Justice, and Support of the
Death Penalty. Social Psychology Quarterly, 54(1), 67-75.
Young, R. (1992). Religious Orientation, Race, and Support for the Death
Penalty. Journal for the Scientific Study of Religion, 31(1), 76-87.
Young, R. (2004). Guilty Until Proven Innocent: Conviction, Orientation,
Racial Attitudes, and Support for Capital Punishment. Deviant Behavior, 25, 151-167.

125
BIOGRAPHICAL INFORMATION
The author graduated Magna Cum Laude from the University of North Texas
with a Bachelor of Science degree in Criminal Justice in 2003. It was at the University
of North Texas where Shirley first developed an interest in the death penalty.
Subsequently, the author earned a Master of Arts in Criminology/Criminal Justice from
the University of Texas at Arlington in December, 2006. It is her hope to continue to
learn more about capital punishment and to advocate for death penalty reform. The
author and her husband have one daughter, Brandy, who lives in Austin, Texas. Shirley
resides in Grand Prairie, Texas with her husband, David, and their cats Tommy and
Callie.