The data book of surveillance results for hazardous ... · fishery products in this survey were...
177
The data book of surveillance results for hazardous chemicals in food (2013~2014)
Transcript of The data book of surveillance results for hazardous ... · fishery products in this survey were...

The data book of surveillance
results for hazardous chemicals
in food
(2013~2014)

This version is an abridged translation of the original Japanese document
(http://www.maff.go.jp/j/syouan/seisaku/risk_analysis/survei/pdf/chem_25-26.pdf) and is provided
for reference purposes only. If there are any discrepancies between this version and the original
document, the original Japanese document prevails.

i
Executive summary
This book is a compilation of analytical results of the surveillance for hazardous
chemicals in foods carried out in 2013 and 2014 by the Food Safety and Consumer
Affairs Bureau, Ministry of Agriculture, Forestry and Fisheries (MAFF), Japan.
Specifically, it contains results of the surveillance for chemical hazard occurrence in
foods following “the midterm surveillance and monitoring plan of chemical hazards
for food safety”1 and “the annual surveillance and monitoring plan of chemical
hazards for food safety”2. In addition, this book contains analytical results of
pesticide residues surveys and of other studies performed to consider necessity of
risk reduction measures together with results of our data analysis.
It also contains results of the surveys conducted in 2012 and before, on which we
have finalized our data analysis recently. The number of analytical results is as
follows.
(The number of analytical results)
Chemical substances in raw
commodities Chemical substances
formed in
transportation and/or
food processing
Pesticide
residues Total
Metals Mycotoxins Others
Agricultural
products 4,004 4,426 1308 - 9,122 18,860
Livestock
products 160 - 100 - - 260
Fishery
products - 160 - - 160
Processed
foods 703 848 1,881 8,420 - 11,852
Total 4,867 5,274 3,449 8,420 9,122 31,132
Note: The number of analytical results is counted as two if two chemical hazards are
analyzed for a test sample.
“Metals” under the category of “Chemical substances in raw commodities” are
heavy metals and arsenic. “Others” are dioxins, polybrominated diphenyl ethers
(PBDEs), perfluorooctanesulfonic acid (PFOA) and perfluorooctane sulfonate
(PFOS).
“Chemical substances formed in transportation and/or food processing” are
acrylamide, polycyclic aromatic hydrocarbons (PAHs), 3-chloropropane-1,2-diol
(3-MCPD) esters, glycidyl esters and trans fatty acids.
1 http://www.maff.go.jp/j/press/syouan/seisaku/101222.html 2 http://www.maff.go.jp/j/syouan/seisaku/risk_analysis/survei/h25.html
http://www.maff.go.jp/j/syouan/seisaku/risk_analysis/survei/h26.html

ii
Agricultural products
(1) Heavy metals
① Cadmium MAFF is taking action to reduce cadmium concentrations in agricultural
products at its production in order to reduce dietary intake of cadmium.
Domestically produced wheat and soybean (dry) (1,800 samples each),
were collected to analyze cadmium concentration and to verify
effectiveness of the measures taken in main cultivation areas. The result
showed that cadmium concentrations both in wheat and soybean were
significantly lower than those collected in 2000-2002.
MAFF estimated dietary intake of cadmium for Japanese people using
cadmium occurrence data in agricultural products and it revealed that the
contribution of these agricultural products to the whole cadmium intake
was small.3
MAFF continues the effort to introduce cadmium reduction measures
included in “the manual for developing practices to suppress cadmium
absorption by soybean”, and encourages development of more effective
cadmium reduction measures and feasibility studies in the field level.
② Lead Citrus fruits, pome fruits, stone fruits, berries and other small fruits, and
tropical and subtropical fruits (total 101 samples) were analyzed to know
lead occurrence in domestically produced agricultural products and to
contribute the discussion on the revision of maximum levels for lead in
foods in Codex.
The result showed that lead concentrations were low. MAFF continues surveillance of lead occurrence in food, especially in the
selected commodities for revision of maximum levels for lead in Codex.
(2) Mycotoxins4 Deoxynivalenol (DON) and nivalenol (NIV) are formed by genus Fusarium
fungi, which are pathogen of Fusarium Head Blight of wheat and barley, and
can be found at a high concentration in wheat and barley depending on climate
condition. Therefore, MAFF promotes good agricultural practices following
“Guidelines for reduction of deoxynivalenol and nivalenol contamination in
wheat and barley (published in December 2008)”.
Domestically produced wheat (240 samples) and domestically produced barley
(199 samples) were analyzed to know nationwide occurrence and annual
3 http://www.maff.go.jp/j/press/syouan/nouan/160223.html 4 Target substances of the surveillance for mycotoxins were following ten species;
Deoxynivalenol (DON), 3-acetyl-deoxynivalenol (3-Ac-DON),
15-acetyl-deoxynivalenol (15-Ac-DON), nivalenol (NIV), 4-acetyl-nivalenol
(4-Ac-NIV), T-2 toxin, HT-2 toxin, zearalenone, aflatoxins, ochratoxin A.

iii
variation of mycotoxins concentrations such as DON and NIV and to verify
the effectiveness of good agricultural practices following the guidelines. Mean concentrations of DON and NIV in wheat and barley produced in 2014
were at the lowest level comparing with mean values5 of those in each
production year since 2002. No samples in this surveillance had a value higher
than the provisional maximum level (1.1 mg/kg)6 for DON in wheat.
MAFF continues ongoing surveillance of mycotoxins such as DON and NIV
in wheat and barley.
(3) Dioxins Agricultural products (68 samples), livestock products (100 samples) and
fishery products (160 samples) were analyzed to know dioxins7 levels in
domestic agricultural, livestock and fishery products based on “the Basic
Guidelines for Promotion of Measures against Dioxins” (adopted by the
Meeting of Ministers concerning Measures against Dioxins in March 30,
1999). The concentrations of dioxins detected in agricultural, livestock and
fishery products in this survey were within the range of previous analytical
results8.
For agricultural products, the concentrations of dioxins were not statistically
significantly different from the analytical results in 2010 regarding non-head
leafy vegetables (e.g. spinach, komatsuna) grown outdoor, which may be more
susceptible to the surrounding environment. For livestock products, the
concentrations of dioxins in pork were statistically significantly lower than the
analytical results in 2012. For fishery products, the concentrations of dioxins
in Yellowtail (wild) were statistically significantly lower than the analytical
results in 20119 , while the concentrations of dioxins in Hair tail, Atka
mackerel, Yellowtail (cultured), Greater amberjack (cultured) and Common
mackerel were not statistically significantly different between this survey and
that in 2010-20119.
MAFF will continue surveillance of dioxins to know annual change of their
concentrations in agricultural, livestock and fishery products.
(4) PBDEs, PFOA and PFOS Surveillance was conducted to know which food category contains PBDEs,
PFOA and PFOS, which are known to be environmentally persistent, and to
5 http://www.maff.go.jp/j/syouan/seisaku/risk_analysis/priority/kabidoku/tyosa/index.html 6 The provisional limit based on the Food Sanitation Act (Act No. 233 of December 24,
1947) is 1.1 ppm (mg/kg). 7 Dioxins means polychlorinated dibenzo-p-dioxin (PCDD), polychlorinated dibenzofuran
(PCDF), coplanar-PCB; dioxin-like PCBs (Co-PCB) 8 http://www.maff.go.jp/j/syouan/seisaku/risk_analysis/survei/result.html#kannkyouchuu 9 Hair tail and Atka mackerel were investigated in 2010. Yellowtail (wild), Yellowtail
(cultured), Greater amberjack (cultured) and Common mackerel were investigated in
2011.

iv
consider the necessity of more detailed investigations. The surveillance was
conducted in four areas of Japan (Tokyo, Osaka, Nagoya and Fukuoka). Food
samples representing 17 food groups, used for the National Health and
Nutrition Survey10, and packed drinking water were analyzed. For each food
group, collected samples were cooked and processed if necessary, then mixed
and homogenized in proportion to the consumption amount.
Results showed that concentrations of PBDEs were low in the food groups
other than “Fats and Oils” and “Fishes and shellfishes”, and concentrations of
PFOA and PFOS were low in the food groups other than “Fishes and
shellfishes” and “Algae”. We estimated dietary intake of PBDEs, PFOA and
PFOS using the data, which indicated that a health concern was low for the
population with ordinary dietary habits and further detailed investigations
should not be necessary.11
MAFF makes efforts in collecting relevant information such as possibility of
food contamination and health effects about PBDEs and perfluoroalkyl
compounds including their related chemicals both in Japan and from overseas.
(5) Pesticide Residues Twenty two domestically grown agricultural products (1929 samples) were
analyzed for pesticide residues (9122 analytical results) to check proper use of
pesticides in combination with the surveys about pesticide application by
farmers.
There was no sample exceeding the maximum residue limits established based
on the Food Sanitation Act except the two samples (Kabu ‘turnips’ (leaves),
Negi ‘welsh onion’). In the cases where a pesticide use had been found
improper from the survey results of pesticide application including the two
cases of exceeding the residue limit, MAFF instructed the farmers to follow
good agricultural practices (GAPs) through the prefectural governments.
MAFF continues similar investigations for the guidance of proper pesticide
use.
10 http://www.mhlw.go.jp/bunya/kenkou/kenkou_eiyou_chousa.html 11 http://www.maff.go.jp/j/syouan/seisaku/papers_posters/pdf/108th_eisei3.pdf
v
Processed food
(1) Lead Canned fruits (Satsuma mandarins, peaches, European pears, cherries) (103
samples) were analyzed to know lead levels in canned fruits in the domestic
market and to prepare for the revision of maximum levels for lead in foods
discussed in Codex Alimentarius Commission. The analytical results showed
that a part of samples contained a high level of lead.
A further investigation revealed that the cause of the high level of lead was
probably leaching-out of lead impurities in tin-plate steel used as a raw
material of cans rather than contamination of raw fruits or the manufacturing
process.
Currently, related food business operators are voluntarily replacing with
low-lead cans. MAFF will conduct a survey to verify the effectiveness of the
voluntary action by the food business operators. Besides, MAFF will conduct
investigations of lead levels in the food items about which Codex Alimentarius
Commission discusses revision of maximum levels for lead.
(2) Mycotoxins Roasted peanut with shell and roasted peanut without shell (total 94 samples),
peanut butter (11 samples), brown sugar (87 samples), wasanbonto (10
samples) and others were analyzed to provisionally know aflatoxins levels in
processed foods made of domestic agricultural products.
Aflatoxins level of higher than the regulatory limit (total aflatoxins: 10
µg/kg)12 was not detected from any sample analyzed.
(3) Acrylamide MAFF promotes measures in “the Guidelines for Reduction of Acrylamide in
Foods (issued November 2013)” to decrease acrylamide levels in foods, and
supports voluntary actions for acrylamide reduction by food business operators.
MAFF has also continued surveillance of a wide range of foods to know
acrylamide levels in foods retailed in Japan and to verify effectiveness of the
measures taken by the food business operators.
One thousand six hundred nine samples were analyzed to know the latest
acrylamide levels in processed foods retailed in Japan. French fries,
uncentrifugal sugar, confectioneries made from potatoes or cereals such as
snacks, Mugicha ‘barley tea’ (roasted barley), Hojicha ‘roasted green tea’
(tea leaves), roasted coffee beans and soluble coffee/instant coffee contained
acrylamide at high levels comparable with the previous results. In addition,
nuts-based processed products and some variety of fried foods also contained
relatively high levels of acrylamide. On the other hand, the acrylamide levels
12 The regulatory limit for Aflatoxins based on the Food Sanitation Act ((Act No. 233 of
December 24, 1947) is 10 µg/kg for total aflatoxins (Sum of aflatoxin B1, B2, G1 and G2).
vi
of french fries and snacks were statistically significantly lower than the
analytical results in the previous surveys13.14
MAFF continues surveillance of up-to-date acrylamide levels on food items
whose acrylamide levels were high in the previous surveys, to verify the
effectiveness of the mitigation measures taken by food business operators.
Besides, MAFF will enhance provision of information to the consumers
regarding tips for acrylamide reduction at home.15
(4) Polycyclic Aromatic Hydrocarbons (PAHs) Edible vegetable oils and fats (112 samples), processed meat products with
direct fire cooking (Yakitori16, other roasted chicken meat17, beef and pork
products18) (99 samples) and processed fishery products with direct fire
cooking (30 samples) were analyzed to know PAH levels in processed foods
retailed in Japan.
Most samples contained PAHs at levels comparable to those reported
overseas19, whereas a part of the samples contained PAHs at relatively high
levels.
MAFF continues to collect information about PAHs in processed foods
with direct fire cooking both in Japan and from overseas.
(5) 3-MCPD fatty acid esters and Glycidyl fatty acid esters Edible vegetable oils and fats, butter, margarine, shortening, lard, fish oil
supplements, infant formula (powder) and similar products (total 360 samples)
were analyzed to know occurrence of 3-MCPD fatty acid esters and Glycidyl
fatty acid esters in edible vegetable oils and fats and foods with a high fat
content.
As reported overseas, these substances were contained in edible vegetable oils
and fats and foods with a high fat content retailed in Japan, and their
concentrations were relatively lower than the analytical results reported
overseas.20
13 Surveillance in 2007 for french fries and
Surveillance during 2004 – 2007 for potato snacks 14 http://www.maff.go.jp/j/syouan/seisaku/acryl_amide/a_syosai/nousui/ganyu.html 15 http://www.maff.go.jp/j/fs/acrylamide.html 16 Roast chicken meat (thigh) skewered, cooked with a direct fire 17 Chicken meat product not skewered, grilled in a flame, whose surface color is light gray 18 Products cooked with a direct fire; “Karubi”, “Tontoro”, “Yakibuta”, Hamburg steak
made of beef or pork, which includes those cooked with indirect heating such as a
hotplate and scorched 19 WHO FOOD ADDITIVES SERIES: 55, Safety evaluation of certain contaminants in
foods, Prepared by the Sixty-fourth meeting of the Joint FAO/WHO Expert Committee
on Food Additives (JECFA). pp 70-71 20 http://www.maff.go.jp/j/syouan/seisaku/mcpde/

vii
MAFF will continue to collect information in Japan and from overseas about
occurrence data of 3-MCPD fatty acid esters and Glycidyl fatty acid esters in
foods, their metabolic mechanisms, reduction technologies and others.
(6) Trans fatty acids Margarine, shortening, fat spread and compound margarine (total 115
samples) were analyzed to know the latest trans fatty acids levels in foods with
a high fat content retailed in Japan.
The concentrations in margarine, shortening and fat spread tended to be lower
than the analytical results 21 in 2006 conducted by the Food Safety
Commission.
MAFF will conduct surveillance for trans fatty acids in processed foods to
provide consumers and food business operators with accurate information.
21 http://www.maff.go.jp/j/syouan/seisaku/trans_fat/t_kihon/content.html#table

viii
Conclusions The levels of hazardous chemicals in agricultural, livestock and fishery products and
processed foods were below the limits of quantification in most of the samples in
this survey. Besides, the possibility of adverse health effects was considered low for
most of the foods investigated, thus, they were considered safe.
Whereas, the concentrations of some hazardous chemicals were high in most of or
part of the samples and these food items may not be negligible as sources of
exposure to the hazardous chemicals if the amount of consumption is large.
Therefore, MAFF continues surveillance of hazardous chemicals in agricultural,
livestock and fishery products and processed foods in 2015 and later. MAFF also
encourages studies about reduction measures against those chemicals to which the
exposure is high considering their toxicity. Furthermore, MAFF verifies the
effectiveness of the already implemented measures against hazardous chemicals.
The analytical results obtained through the surveillance have been used as and
served for basic data for the ever conducted risk assessments and various risk
management measures such as setting the standards and developing the guidelines in
Japan and overseas. MAFF contains active use of the data from surveillance in
future as well.

ix
Table of contents
EXECUTIVE SUMMARY ...................................................... I
TABLE OF CONTENTS ......................................................................... IX
INDEX BY HAZARDS ........................................................................... XIII
1. INTRODUCTION ............................................................ 1
2. SURVEILLANCE ........................................................... 2
2.1. HAZARDOUS CHEMICALS OF HIGH PRIORITY FOR RISK MANAGEMENT
BY MAFF ................................................................................... 2
2.1.1. Objective of the surveillance ..................................................... 2
2.1.2. Selection of surveillance targets ............................................... 2
2.2. PESTICIDE RESIDUES ................................................................... 8
2.2.1. Objective of the survey ............................................................. 8
2.2.2. Selection of targets ................................................................... 8
2.3. REQUIREMENTS TO THE TESTING LABORATORIES .......................... 10
3. ANALYTICAL RESULTS (BY FOOD ITEM) ............... 11
3.1. AGRICULTURAL PRODUCTS ......................................................... 14
3.1.1. Cereals ................................................................................... 14
3.1.1.1. Husked rice ............................................................................. 14
3.1.1.2. Wheat ..................................................................................... 16
3.1.1.3. Barley ...................................................................................... 17
3.1.2. Pulses (except immature pulses) ............................................ 19
3.1.2.1. Soybeans (dry) ........................................................................ 19
3.1.2.2. Azuki beans ............................................................................ 19
3.1.2.3. Kidney beans .......................................................................... 20
3.1.2.4. Peanuts ................................................................................... 20
3.1.3. Vegetables .............................................................................. 21
3.1.3.1. Kabu ‘turnip’ (root and leaves) ................................................ 21
3.1.3.2. Daikon ‘Japanese radish’ (leaves) .......................................... 23
3.1.3.3. Hakusai ‘Chinese cabbage’..................................................... 23

x
3.1.3.4. Cabbage ................................................................................. 25
3.1.3.5. Komatsuna .............................................................................. 25
3.1.3.6. Chingensai ‘green bok choy’ ................................................... 26
3.1.3.7. Broccoli (flower buds) .............................................................. 27
3.1.3.8. Syungiku ‘garland chrysanthemum’ ........................................ 29
3.1.3.9. Head lettuce (crisphead type) ................................................. 29
3.1.3.10. Spinach ................................................................................... 31
3.1.3.11. Nira ‘Chinese chive’ ................................................................ 33
3.1.3.12. Negi ‘welsh onion’ ................................................................... 34
3.1.3.13. Tamanegi ‘bulb onion’ ............................................................. 36
3.1.3.14. Nasu ‘egg plant’ ...................................................................... 38
3.1.3.15. Bell pepper/Sweet pepper ....................................................... 40
3.1.3.16. Kidney beans (green pod) ....................................................... 42
3.1.3.17. Edamame ‘soybeans (immature)’............................................ 43
3.1.3.18. Melons (except watermelons) ................................................. 45
3.1.3.19. Other vegetables ..................................................................... 46
3.1.4. Fruits ....................................................................................... 47
3.1.4.1. Citrus fruits (Flavorful acid citrus, Kumquat, Tangors, Navel
orange, Pummelos, Other citruses)......................................... 47
3.1.4.2. Pome fruits (Japanese pear, European pear, Biwa ‘loquat’,
Kaki ‘Japanese persimon’) ...................................................... 47
3.1.4.3. Stone fruits (Cherry, Plum, Nectarine, Prune, Peach) ............. 53
3.1.4.4. Berries and other small fruits (Blueberry, Blackberry,
Boysenberry) ........................................................................... 55
3.1.4.5. Tropical and subtropical fruits (Pineapple, Fig, Papaya,
Mango) .................................................................................... 55
3.1.5. Other agricultural products ...................................................... 56
3.1.5.1. Green tea (green leaves) ........................................................ 56
3.2. LIVESTOCK PRODUCTS ............................................................... 57
3.2.1. Cattle milk ............................................................................... 57
3.2.2. Beef, Pork, Chicken meat, Chicken egg .................................. 57
3.3. FISHERY PRODUCTS .................................................................. 58
3.3.1. Fishes ..................................................................................... 58
3.4. PROCESSED AND COOKED PRODUCTS ......................................... 59
3.4.1. Processed cereal-based products ........................................... 59
xi
3.4.1.1. Bread and bun ........................................................................ 59
3.4.1.2. Yaki-fu and Age-fu ‘wheat gluten bread (baked, fried)’ ........... 59
3.4.2. Processed potato-based products .......................................... 60
3.4.2.1. French fries ............................................................................. 60
3.4.3. Processed pulse-based products ............................................ 61
3.4.4. Uncentrifugal sugars ............................................................... 62
3.4.5. Processed nut-based products ............................................... 64
3.4.6. Processed fruit-based products .............................................. 65
3.4.6.1. Canned fruits ........................................................................... 65
3.4.7. Processed and cooked seaweed-based products ................... 66
3.4.7.1. Ready-to-eat hijiki-based products .......................................... 66
3.4.8. Processed and cooked fish-based products ........................... 67
3.4.9. Processed and cooked meat-based products ......................... 70
3.4.10. Dairy products ......................................................................... 73
3.4.11. Oils and fats ............................................................................ 77
3.4.11.1. Edible vegetable oils and fats ................................................. 77
3.4.11.2. Other foods with a high fat content ......................................... 93
3.4.12. Foods for infants ................................................................... 101
3.4.12.1. Infant formula (powder) and similar products ........................ 101
3.4.12.2. Ready-to-eat hijiki-based products for infants ....................... 112
3.4.12.3. Infant confectionary ............................................................... 113
3.4.13. Confectionaries ..................................................................... 114
3.4.13.1. Biscuits ................................................................................. 114
3.4.13.2. Snacks .................................................................................. 114
3.4.13.3. Rice crackers ........................................................................ 114
3.4.13.4. Wa-nama/hannama-gashi ‘Japanese cakes’ ........................ 115
3.4.13.5. You-nama/hannama-gashi ‘Western style cakes’ ................. 115
3.4.14. Beverages and ingredients of beverages .............................. 116
3.4.14.1. Mugicha ‘barley tea’ (roasted barley) .................................... 116
3.4.14.2. Hojicha ‘roasted green tea’ (tea leaves) ................................ 116
3.4.14.3. Coffee ................................................................................... 116
3.4.14.4. Fruits drinks .......................................................................... 117
3.4.15. Seasonings ........................................................................... 118
3.4.15.1. Vinegar ................................................................................. 118
3.4.16. Other processed and cooked products ................................. 119
3.4.16.1. Retortable pouched foods (curry) .......................................... 119
3.4.16.2. Other cooked foods ............................................................... 120

xii
3.5. OTHERS ................................................................................. 121
4. SAMPLING AND METHODS OF ANALYSIS ........... 129
4.1. METALS ................................................................................. 129
4.1.1. Cadmium ............................................................................... 129
4.1.2. Cadmium, Lead, Mercury, Arsenic ........................................ 129
4.2. MYCOTOXINS .......................................................................... 131
4.2.1. DON, NIV, their acetylated derivatives .................................. 131
4.2.2. T-2 toxin, HT-2 Toxin, Zearalenone ...................................... 131
4.2.3. Aflatoxins .............................................................................. 131
4.2.4. Ochratoxin A ......................................................................... 132
4.3. DIOXINS ................................................................................. 133
4.4. PBDES ................................................................................. 134
4.5. PFOA AND PFOS .................................................................. 145
4.6. ACRYLAMIDE .......................................................................... 146
4.7. POLYCYCLIC AROMATIC HYDROCARBONS (PAHS) ...................... 148
4.8. 3-MCPD FATTY ACID ESTERS ................................................... 149
4.9. GLYCIDYL FATTY ACID ESTERS .................................................. 150
4.10. TRANS FATTY ACIDS, SATURATED FATTY ACIDS, CONJUGATED
LINOLEIC ACIDS (CLA) ............................................................ 151
4.11. PESTICIDE RESIDUES ............................................................. 152
ABBREVIATIONS........................................................... 153

xiii
Index by hazards
1. Chemical substances in raw commodities
1.1. Metals (cadmium, lead, mercury, arsenic)
Cadmium
Agricultural products
Cereals
Wheat 16
Pulses (except immature pulses)
Soybeans (dry) 19
Citrus fruits
(Flavorful acid citrus, Kumquat, Tangors, Navel orange,
Pummelos, Other citruses) 47
Pome fruits
European pear 49, Biwa ‘loquat’ 51
Stone fruits
(Cherry, Plum, Nectarine, Prune) 53
Berries and other small fruits
(Blueberry, Blackberry, Boysenberry) 55
Tropical and subtropical fruits
(Pineapple, Fig, Papaya, Mango) 55
Livestock products
Cattle milk 57
Processed and cooked products
Dairy products
Butter, Cheese, Cream, Other dairy products 73
Foods for infants
Infant formula (powder) and similar products 101
Beverages
Fruits drinks 117

xiv
Lead
Agricultural products
Citrus fruits
(Flavorful acid citrus, Kumquat, Tangors, Navel orange,
Pummelos, Other citruses) 47
Pome fruits
European pear 49, Biwa ’loquat’ 51
Stone fruits
(Cherry, Plum, Nectarine, Prune) 53
Berries and other small fruits
(Blueberry, Blackberry, Boysenberry) 55
Tropical and subtropical fruits
(Pineapple, Fig, Papaya, Mango) 55
Livestock products
Cattle milk 57
Processed and cooked products
Processed fruit-based products
Canned fruits 65
Dairy products
Butter, Cheese, Cream, Other dairy products 73
Foods for infants
Infant formula (powder) and similar products 101
Beverages
Fruits drinks 117
Mercury
Agricultural products
Citrus fruits
(Flavorful acid citrus, Kumquat, Tangors, Navel orange,
Pummelos, Other citruses) 47
Pome fruits
European pear 49, Biwa ‘loquat’ 51
Stone fruits
(Cherry, Plum, Nectarine, Prune) 53
Berries and other small fruits
(Blueberry, Blackberry, Boysenberry) 55

xv
Tropical and subtropical fruits
(Pineapple, Fig, Papaya, Mango) 55
Livestock products
Cattle milk 57
Processed and cooked products
Dairy products
Butter, Cheese, Cream, Other dairy products 73
Foods for infants
Infant formula (powder) and similar products 101
Beverages
Fruits drinks 117
Arsenic
<Total arsenic>
Agricultural products
Citrus fruits
(Flavorful acid citrus, Kumquat, Tangors, Navel orange,
Pummelos, Other citruses) 47
Pome fruits
European pear 49, Biwa ‘loquat’ 51
Stone fruits
(Cherry, Plum, Nectarine, Prune) 53
Berries and other small fruits
(Blueberry, Blackberry, Boysenberry) 55
Tropical and subtropical fruits
(Pineapple, Fig, Papaya, Mango) 55
Livestock products
Cattle milk 57
Processed and cooked products
Processed and cooked seaweed-based products
Rready-to-eat hijiki-based products (Ready-to-eat hijiki-based product sold
in sealed bag, Ready-to-eat hijiki-based dish, Ready-to-eat hijiki-based
product for care food, Hijiki powder product) 66
Dairy products
Butter, Cheese, Cream, Other dairy products 73
Foods for infants

xvi
Infant formula (powder) and similar products 101, Ready-to-eat hijiki-based
products for infants 112
Beverages
Fruits drinks 117
<Inorganic arsenic>
Processed and cooked products
Processed and cooked seaweed-based products
Ready-to-eat hijiki-based products (Ready-to-eat hijiki-based product sold in
sealed bag, Ready-to-eat hijiki-based dish, Ready-to-eat hijiki-based product
for care food, Hijiki powder product) 66
Foods for infants
Ready-to-eat hijiki-based products for infants 112
1.2. Mycotoxins
Deoxynivalenol (DON)
Agricultural products
Cereals
Wheat 16, Barley 17
Pulses (except immature pulses)
Azuki beans 19, Kidney beans 20
3-acetyl-deoxynivalenol (3-Ac-DON)
Agricultural products
Cereals
Wheat 16, Barley 17
15-acetyl-deoxynivalenol (15-Ac-DON)
Agricultural products
Cereals
Wheat 16, Barley 17
Nivalenol (NIV)
Agricultural products
Cereals
Wheat 16, Barley 17

xvii
4-acetyl-nivalenol (4-Ac-NIV)
Agricultural products
Cereals
Wheat 16, Barley 17
T-2 toxin
Agricultural products
Cereals
Wheat 16, Barley 17
Pulses (except immature pulses)
Azuki beans 19, Kidney beans 20
HT-2 toxin
Agricultural products
Cereals
Wheat 16, Barley 17
Pulses (except immature pulses)
Azuki beans 19, Kidney beans 20
Zearalenone
Agricultural products
Cereals
Wheat 16, Barley 17
Pulses (except immature pulses)
Azuki beans 19, Kidney beans 20
Aflatoxins
Agricultural products
Cereals
Barley 17
Pulses (except immature pulses)
Peanuts 20
Processed and cooked products
Processed pulse-based products
Roasted peanuts with shell and roasted peanuts without shell 61,
Peanut butter 61
Uncentrifugal sugars

xviii
Brown sugar 62, Wasanbonto (traditional non-centrifugal soft white cane
sugar) 62, Tomitsu ‘sugar syrup including molasses’ 62
Seasonings
Vinegar
Sugarcane vinegar 118
Ochratoxin A
Agricultural products
Cereals
Barley 17
1.3. Others
Dioxins
Agricultural products
Vegetables
Daikon ‘Japanese radish’ (leaves) 23, Cabbage 25,
Komatsuna 25, Broccoli (flower buds) 27, Spinach 31,
Negi ‘welsh onion’ 34, Nasu ‘egg plant’ 38,
Other vegetables 46, Green tea (green leaves) 56
Livestock products
Cattle milk 57, Beef, Pork, Chicken meat, Chicken egg 57
Fishery products
Hair tail, Atka mackerel, Yellowtail, Greater amberjack, Common
mackerel 58
Polybrominated diphenyl ethers (PBDEs)
Agricultural products
Cereals
Husked rice 124, Polished rice 124
Processed and cooked products
Oils and fats
Butter 125, Edible vegetable oils and fats 125, Margarine and shortening 126
Others (17 food groups and drinking water)
Cereals, Potatoes, Sugars and sweeteners, Pulses, Nuts and seeds, Vegetables,
Fruits, Mushrooms, Algae, Fish, mollusks and crustacean, Meat, Eggs, Milk

xix
and milk products, Fats and oils, Confectionaries, Beverages, Seasonings and
spices, Drinking water 122
Perfluorooctanoic acid (PFOA) and perfluorooctane sulfonic acid (PFOS)
Others (17 food groups and drinking water)
Cereals, Potatoes, Sugars and sweeteners, Pulses, Nuts and seeds, Vegetables,
Fruits, Mushrooms, Algae, Fish, mollusks and crustacean, Meat, Eggs, Milk
and milk products, Fats and oils, Confectionaries, Beverages, Seasonings and
spices, Drinking water 127

xx
2. Chemical substances formed in transportation and/or food
processing
Acrylamide
Processed and cooked products
Processed cereal-based products
Bread and bun (French bread, soft roll) 59
Yaki-fu and Age-fu ‘wheat gluten bread (baked, fried)’ 59
Processed potato-based products
French fries 60
Uncentrifugal sugars
Uncentrifugal sugar 63
Processed nut-based products 64
Foods for infants
Infant confectionary 113
Confectionaries
Biscuit 114, Snack 114, Rice cracker 114, Japanese cake 115,
Western style cake 115
Beverages and ingredients of beverages
Mugicha ‘barley tea’ (roasted barley) 116, Hojicha ‘roasted green tea’ (tea
leaves) 116,
Coffee 116
Other processed and cooked products
Retortable pouched food (curry) 119, Other cooked foods
(Tenpura, Other fried foods, Okonomiyaki, Takoyaki) 120
Polycyclic aromatic hydrocarbons (PAHs)
Processed and cooked products
Processed and cooked fish-based products 68
Processed and cooked meat-based products 70
Oils and fats
Edible vegetable oils and fats 77

xxi
3-MCPD fatty acid esters
Processed and cooked products
Dairy products
Butter 73
Oils and fats
Edible vegetable oils and fats 85
Other foods with a high fat content (Margarine, Shortening,
Lard, Fish oil supplement) 93
Foods for infants
Infant formula (powder) and similar products (infant formula (powder),
Follow-up formula (powder), Formula for special medical purposes intended
for infants (powder)) 102
Glycidyl fatty acid esters
Processed and cooked products
Dairy products
Butter 74
Oils and fats
Edible vegetable oils and fats 86
Other foods with a high fat content (Margarine, Shortening,
Lard, Fish oil supplement) 94
Foods for infants
Infant formula (powder) and similar products (infant formula (powder),
Follow-up formula (powder), Formula for special medical purposes intended
for infants (powder)) 104
Trans fatty acids
Processed and cooked products
Oils and fats
Margarine 100, Shortening 100, Fat spread 100,
Compound margarine 100

xxii
3. Pesticide residues
Pesticide residues
Agricultural products
Cereals
Husked rice 14
Vegetables
Kabu ‘turnip’ (root) 21, Kabu ‘turnip’ (leaves) 22,
Hakusai ‘Chinese cabbage’ 23, Komatsuna 25,
Chingensai ‘green bok choy’ 26, Broccoli (flower buds) 27,
Syungiku ‘garland chrysanthemum’ 29,
Head lettuce (crisphead type) 29, Spinach 31,
Nira ‘Chinese chive’ 33, Negi ‘welsh onion’ 34,
Tamanegi ‘bulb onion’ 36, Nasu ‘egg plant’ 38,
Bell pepper/Sweet pepper 40, Kidney beans (green pod) 42,
Edamame ‘soybeans (immature)’ 43, Melon (except Watermelons) 45
Pome fruits
Japanese pear 47, European pear 50,
Kaki ‘Japanese persimon’ 51
Stone fruits
Peach 53

1
1. Introduction
In July 2003, MAFF established the Food Safety and Consumer Affairs Bureau. The
Bureau designs and implements policies for improving the safety of domestic
agricultural, livestock and fishery products and foods.
Science-based appropriate measures must be taken to improve food safety at
necessary steps in the process spanning primary food commodities production such
as agriculture, livestock and fishery industry, transporting, processing/manufacturing
and consumption. This idea is shared worldwide and designated as basic principles
in “the Working Principles for Risk Analysis for Food Safety for Application by
Governments” by Codex Alimentarius Commission, which sets elaborates and
adopts international food related standards, as well as in the Food Safety Basic Act
of Japan1.
For appropriate and consistent implementation of food safety administration based
on the basic principles, the Food Safety and Consumer Affairs Bureau developed
“the Standard Operating Procedure (SOP) for Food Safety Risk Management in the
Ministry of Agriculture, Forestry and Fisheries and Ministry of Health, Labour and
Welfare”2 and has implemented food safety policies based on the SOP.
In order to ensure food safety, chemicals in foods need to be analyzed and it should
be proved that their concentrations are low enough that they do not affect human
health. Concentrations of a chemical in foods as well as food consumption rates and
toxicity of the chemical are very important scientific data to judge whether reduction
measures are necessary and if so, to judge what kind of measures are appropriate.
Therefore, MAFF has conducted surveillance for hazardous chemicals in foods. In
October 2012, MAFF published the analytical results of surveillance during 2003 –
2010 (8 years) as a data book on its website. Afterwards MAFF has compiled the
results every two years. This book contains the analytical results in 2013 and 2014.3
1 http://www.fsc.go.jp/hourei/kihonhou_saishin.pdf 2 http://www.maff.go.jp/j/syouan/seisaku/risk_analysis/sop/index.html 3 It also contains the results of the surveys for pesticide residues in 2013 and 2014, and the
results of the surveys conducted in 2012 and before, on which we have finalized our data
analysis recently.

2
2. Surveillance
Objective, selection of food, requirements to analytical laboratories and others are as
follows.
2.1. Hazardous chemicals of high priority for risk management by MAFF
2.1.1. Objective of the surveillance
In order to ensure food safety, evidence needs to be shown using analytical results of
surveyed chemicals in foods. If the concentrations in foods are high, reduction
measures against these chemicals may be necessary. Therefore, MAFF conducted
surveillance for chemicals which were selected in the procedure indicated in the next
section (2.1.2).
Collected information from the surveillance is not for regulatory purposes over
farmers and producers but for judging whether reduction measures are necessary and
if so, judging what kind of measures are appropriate. Thus, farmers and producers
are not specified in sampling of foods.
2.1.2. Selection of surveillance targets
Before surveillance starts, the targets of surveillance, or which chemical substances
in what kind of food, should be decided considering many aspects such as collected
information on various chemicals, their reduction measures by international bodies
and other countries, the extent to which consumers, food business operators and
farmers are interested in and other aspects. MAFF has developed and published “the
priority list of chemical hazards in food and feed (priority list)” and regularly
reviewed and updated it (first publication in 2006, updated in 20114, 20165).
This book compiles the results of surveillance in 2013 and 2014. The target
substances are selected based on the priority list6. The content of the list are as
follows;
Hazards requiring immediate risk management actions such as surveillance
and development of risk reduction measures
Arsenic, Cadmium, Aflatoxins, Zealarenon, T-2 toxin and HT-2 toxin,
Fumonisins, Acrylamide, Polycyclic Aromatic Hydrocarbons (PAHs),
Furan, Histamine
4 http://www.maff.go.jp/j/press/syouan/seisaku/101222.html 5 http://www.maff.go.jp/j/press/syouan/seisaku/160108.html

3
Hazards requiring collection of data for deciding on the need of continuing
risk management, and hazards for which risk management measures have
already been implemented
Lead, Mercury (total mercury and methylmercury), Dioxins and Coplanar
PCBs, Polybrominated Diphenyl Ethers (PBDEs), Perfluorooctanoic Acid
(PFOA) and Perfluorooctane sulfonate (PFOS), Persistent organic
pollutants used as pesticides, Ochratoxin A, Deoxynivalenol (including its
acetylated derivatives) and Nivalenol, Patulin, Paralytic shellfish poison,
Diarrheic shellfish poison, Ciguatoxins, Domoic acid, Brevetoxin, Nitrate
nitrogen, Chloropropanols (3-MCPD, 1,3-DCP, 3-MCPD fatty acid ester),
Trans fatty acids
Out of the substances in the list, following ones are designated as the hazards to be
surveyed in combination with target food category (food category and feed) during
2011-2015 considering food consumption rates, previous surveillance for occurrence,
existence of appropriate methods of analysis. They are compiled as a midterm plan6
as follows;
Substances to be surveyed during the term
Cadmium (agricultural products, fishery products, feed), Lead (feed), Total
mercury (feed), Dioxins (agricultural products, livestock products, fishery
products, feed), Zealarenone (agricultural products, feed), T-2 toxin and
HT-2 toxin (agricultural products), DON (including its acetylated
derivatives) (agricultural products), DON (feed), NIV (agricultural
products), Fumonisins (feed), Histamine (processed and cooked fish-based
products), Acrylamide (processed products), Chloropropanols (processed
products), PAHs (processed products), Furan (processed products)
Substances to be surveyed as far as possible during the term
Arsenic (agricultural products), Lead (agricultural products),
Methylmercury (fishery products), PBDEs (not decided7), PFOA and
PFOS (not decided8), Aflatoxins (agricultural products), Ochratoxin A
(agricultural products), Patulin (fruit for juice), Fumonisins (agricultural
products), Nitrate nitrogen (agricultural products), Trans fatty acids
(processed foods)
Based on the midterm plan, an annual plan was developed8, where target food items,
target substances, number of samples were specified considering the latest scientific
knowledge and interests of related parties. The number of samples is decided based
on statistics considering the information to be obtained.
6 http://www.maff.go.jp/j/press/syouan/seisaku/101222.html 7 Surveillance is to be conducted for specific food categories after specifying the food
categories which have a large contribution to the exposure of consumers by total diet
studies and other means. 8 http://www.maff.go.jp/j/syouan/seisaku/risk_manage/index.html#survey_year

4
Food items, chemical names, number of samples in the survey in 2013 and 2014 are
shown in the table below. Food items with a blank in “number of samples” indicate
no survey was conducted in the year.
Chemical Food
category Food
Number of
samples
2013 2014
Cadmium Agricultural
products
Wheat9 600 600
Soybeans (dry)10 600
Cadmium, Lead, Total
mercury, Total arsenic
Agricultural
products
Citrus fruits 30
Pome fruits (European pear,
Biwa ‘loquat’) 11
Stone fruits 30
Berries and other small fruits 5
Tropical and subtropical fruits 25
Livestock
products Cattle milk 40
Processed
and cooked
products
Butter 10
Cheese 10
Cream 10
Other dairy products 10
Infant formula (powder) and
similar products 20
Fruits drinks 30
Lead
Processed
and cooked
products
Canned fruits 103
Total arsenic, Inorganic
arsenic
Processed
and cooked
products
Ready-to-eat hijiki-based
products (including products
for infants)
120
Deoxynivalenol (DON),
3-Ac-DON, 15-Ac-DON,
Nivalenol (NIV), 4-Ac-NIV,
T-2 toxin, HT-2 toxin,
Zearalenone
Agricultural
products
Wheat 120 120
Barley 100 99
DON, T-2 toxin,
HT-2 toxin, Zearalenone
Agricultural
products
Azuki beans 62
Kidney beans 44
9 Six hundred results in 2012 are also included. 10 Six hundred results in 2011 and 2012 are also included.

5
Chemical Food
category Food
Number of
samples
2013 2014
Aflatoxins Agricultural
products
Barley 86
Peanuts 15
Aflatoxins
Processed
and cooked
products
Roasted peanuts with shell,
Roasted peanuts without shell 94
Peanut butter 11
Brown sugar 87
Wasanbonto (traditional
non-centrifugal soft white
cane sugar)
10
Tomitsu ‘sugar syrup
including molasses’ 6
Sugarcane vinegar 4
Ochratoxin A Agricultural
products Barley 86
Dioxins Agricultural
products
Daikon ‘Japanese radish’
(leaves) 5
Cabbage 10
Komatsuna 8
Broccoli (flower buds) 4
Spinach 19
Negi ‘welsh onion’ 9
Nasu ‘egg plant’ 1
Other vegetables 11
Green tea (green leaves) 1
Dioxins
Livestock
products
Cattle milk 20
Beef 20
Pork 20
Chicken meat 20
Chicken egg 20
Fishery
products
Tachiuo ‘hair tail (Trichiurus
lepturus)’ 30
Hokke ‘Atka mackerel
(Pleurogrammus azonus,
Hexagrammredae)’
30
Buri ‘yellowtails (Seriola
quinqueradiata)’ (wild) 30
Buri ‘yellowtails (Seriola
quinqueradiata)’ (cultured) 30

6
Chemical Food
category Food
Number of
samples
2013 2014
Dioxins Fishery
products
Kanpachi ‘greater amberjack
(s. purpurascens)’ (cultured) 20
Masaba ‘common mackerel
(Scomber japonicus)’ 20
Polybrominated diphenyl
ethers (PBDEs)
Agricultural
products
Husked rice 10
Polished rice 30
Processed
and cooked
products
Butter 10
Edible vegetable oils and fats 30
Margarine, Shortening 10
Cereals, Pulses, Nuts and seeds, Vegetables,
Fruits, Algae, Fishes and shellfishes, Meats,
Eggs, Milks, Fats and oils, Confectionaries,
Seasonings and spices 11
13 26
Perfluorooctanoic acid
(PFOA), Perfluorooctane
sulfonic acid (PFOS)
Cereals, Pulses, Nuts and seeds, Vegetables,
Fruits, Algae, Fishes and shellfishes, Meats,
Eggs, Milks, Fats and oils, Confectionaries,
Seasonings and spices 11
13 26
Acrylamide
Processed
and cooked
products
Bread and bun 120
Yaki-fu and Age-fu ‘wheat
gluten bread (baked, fried)’ 30
French fries 120
Uncentrifugal sugar 108
Processed nut-based products 122
Infant confectionary 60
Biscuits 60
Snacks 120
Rice crackers 60
Japanese cakes 120
Western style cakes 120
Mugicha ‘barley tea’ (roasted
barley) 59
Hojicha ‘roasted green tea’
(tea leaves) 60
Roasted coffee beans 60
11 For PBDE, PFOA and PFOS, the results of Total Diet Study in 2012 are also included.

7
Chemical Food
category Food
Number of
samples
2013 2014
Acrylamide
Processed
and cooked
products
Soluble coffee/Instant coffee 60
Retortable pouched foods
(curry) 60
Tenpura 120
Other fried foods 120
Okonomiyaki, Takoyaki 30
Polycyclic aromatic
hydrocarbons (PAHs)
Processed
and cooked
products
Processed fishery products
with direct fire cooking 30
Steamed fish 3
Edible charcoal used as food
additives 3
Polycyclic aromatic
hydrocarbons (PAHs)
Processed
and cooked
products
Yakitori ‘grilled chicken’ 29
Processed chicken meat
product with direct fire
cooking, whose surface color
is light gray
30
processed beef and pork
products with direct fire
cooking
40
Steamed chicken 3
Steamed livestock meat 6
Edible vegetable oils and fats 112
3-MCPD fatty acid esters,
glycidyl fatty acid esters
Processed
and cooked
products
Butter 5 20
Edible vegetable oils and fats 12 74
Margarine 15 50
Shortening 3 30
Lard 3 20
Fish oil supplements 4 30
Infant formula (powder) and
similar products 21 40
Trans fatty acids
Processed
and cooked
products
Margarine 46
Shortening 24
Fat spread 33
Compound margarine 12
12 Forty five results in 2012 are also included.

8
2.2. Pesticide residues
2.2.1. Objective of the survey
The objective of the survey is to monitor pesticide use by Japanese business farmers
and pesticide residues in agricultural products at the production stage and obtain
basic information for developing pesticide risk management policy and to improve
safety of agricultural products by promotion of proper pesticide use through
guidance based on the result of the survey.
2.2.2. Selection of targets
Target agricultural products were selected13 among major agricultural products with
a large amount of production considering records of previous surveys and of
detection of pesticides as shown in the table below.
For pesticide residues, analytical targets were selected from the pesticides which
were used for the selected agricultural products and applicable methods of analysis
were already developed.
Food
Number of
samples
2013 2014
Husked rice 50 51
Kabu ‘turnip’ (root) 49
Kabu ‘turnip’ (leaves) 49
Hakusai ‘Chinese cabbage’ 47 50
Komatsuna 49
Chingensai ‘green bok choy’ 49
Broccolies (flower buds) 49 50
Syungiku ‘garland
chrysanthemum’ 96 50
Head lettuce (crisphead type) 45 49
Spinach 98 49
Nira ‘Chinese chive’ 96 48
Negi ‘welsh onion’ 98 57
Tamanegi ‘bulb onion’ 51
Nasu ‘egg plant’ 50 50
Bell pepper/Sweet pepper 51 51
Kidney beans (green pod) 49 51
13 http://www.maff.go.jp/j/nouyaku/n_monitor.html

9
Food
Number of
samples
2013 2014
Edamame ‘soybeans
(immature)’ 49 50
Melons (except
Watermelons) 50 49
Japanese pear 46 46
European pear 4 3
Kaki ‘Japanese persimon’ 50
Peach 50

10
2.3. Requirements to the testing laboratories
The analytical results of this study are used for judgment of the necessity of risk
management measures and of developing appropriate risk management measure.
Besides, they are also used to reflect the situation of Japan upon the discussion in
international bodies such as Codex about standard settings and development of
codes of practices. Therefore, these analytical results must be reliable.
Following general criteria are applied to the testing laboratories and the analytical
methods used.
A testing laboratory must be capable of verifying its performance objectively. Thus,
MAFF requires testing laboratories to be assessed by the third party as well as to use
internal quality control procedures.14
A chemical analysis must be done using an analytical method with which nearly the
same data are always obtained by any laboratory which is proved to have sufficient
capability. Thus, an analytical method which is validated to have results within a
particular range when a sample is analyzed with the same method in different
conditions (e.g. different laboratories, different date, etc.) at several times.
A method used should be different depending on to how low concentration you need
to measure. When a method which can only reach a higher level than you really
need to know is used, eating a food whose analytical result indicating “not detected”
might possibly give you an adverse health effect. On the other hand, when a method
which can reach a much lower level than you need to know is used, it may require
much longer time and higher cost, which is a waste. When ordering analyses,
therefore, you need to indicate clearly to how low concentration the analytical
results should be available.
MAFF clearly indicates requirement of the limit of quantification, the minimum
concentration to which analytical results can reach with appropriate reliability, in the
specifications of the surveys.
14 Participating in a proficiency testing program for a target analyte and food category, if
available, and showing a satisfactory result. In proficiency testing programs,
participating laboratories receive samples from the test organizing body and they submit
their own analytical results to the organizer. The collected analytical results are
compared with an assigned value and each participating laboratory can verify the quality
of analytical results.

11
3. Analytical results
The analytical results of the surveillance for hazardous chemicals (contaminants and
pesticide residues on the priority list) in foods in 2013 and 2014 are shown as
follows. It also contains the results of the surveys conducted in 2012 and before, on
which we have finalized our data analysis recently.15
Descriptions about the data are explained as follows.
Minimum
The lowest concentration value among analytical results of samples. Nothing is
indicated when all the samples were below the limit of quantification.
Maximum
The highest concentration value among analytical results of samples. Nothing is
indicated when all the samples were below the limit of quantification.
Mean
Arithmetic mean of analytical results. It is calculated referring to the procedure
indicated by GEMS/Food16 using the analytical results of each chemical tested in
this surveillance.
15 Total 600 results of cadmium in wheat in 2012, total 1200 results of cadmium in soybean
in 2011 and 2012, total 558 results of PBDEs in 2012, respective 18 results of PFOA and
PFOS in 2012, respective 45 results of 3-MCPD fatty acid esters and glycidyl fatty acid
esters in edible vegetable fats and oils in 2012. 16 WHO, GEMS/Food, Instructions for Electronic Submission of Data on Chemical
Contaminants in Food and the Diet, 2011

12
For a mean value, mean1 is indicated when the proportion of the samples less
than the limit of quantification to the whole samples is less than 60%; mean2 and
mean3 are calculated and mean2 is indicated when the proportion of the samples
less than the limit of quantification is above 60%.17
mean1: setting all results below the limit of quantification equal to half the
limit of quantification.
mean2: setting all results below the limit of quantification equal to the limit of
quantification. (UB)
mean3: setting all results below the limit of quantification equal to zero. (LB)
Median
A value ranked in the middle when sorting several values in ascending order.
Median is indicated only when more than 50% of the samples have a quantifiable
concentration. When the number of samples is even, the average of the middle
two values is indicated.
Analytical results of dioxins
The data is based on the press release of the annual surveillance results18 of
dioxins from MAFF.
Dioxins is a generic term for many chemical substances which have different
toxicity levels. Thus the toxicity of each substance of dioxins is expressed as
Toxicity Equivalency (TEQ), where the toxicity of the most toxic dioxin
compound, 2,3,7,8-TCDD, is set as 1 and the toxicity of other dioxin members is
converted as such and expressed in TEQ unit.
All the dioxins concentrations in this book are expressed in TEQ base
(pg-TEQ/g). For TEQ calculation, the Toxic Equivalency Factors19 proposed by
the WHO in 2005 are used.
17 Exception; For the total diet studies for PBDEs, PFOA and PFOS, mean values by setting
all results below the limit of quantification equal to zero irrespective of the proportion of
the number of samples below the limit of quantification, Lower Bound (LB), and mean
values by setting all results below the limit of detection equal to the limit of detection and
all results between the limit of detection and the limit of quantification equal to the limit
of quantification, Upper Bound (UB) were calculated for four areas. For 3-MCPD fatty
acid esters and Glycidyl fatty acid esters, mean values were obtained for the indirect
method by setting all results below the limit of detection equal to half the limit of
detection. For the direct method, in addition to mean3 (LB), another mean (UB) was
calculated by setting all results below the limit of detection equal to the limit of detection
and those between the limit of detection and the limit of quantification equal to the limit
of quantification. For trans fatty acids, mean values were calculated by setting all results
below the limit of detection equal to zero. 18 http://www.maff.go.jp/j/syouan/seisaku/risk_analysis/survei/result.html 19 http://www.who.int/ipcs/assessment/tef_values.pdf
13
Analytical results of pesticide residues
Pesticide name
The pesticides for which analytical method(s) was already established are
selected among the pesticides which were applied to agricultural products for
the survey.
The number of samples
The number of agricultural product samples served for the analysis. More than
one pesticide may be analyzed for one sample. The total number of analyses
for agricultural products is the sum of the number of samples for each
pesticide.
Limit of quantification
A limit of quantification for an analytical method can be different in different
years of survey. In such a case, the maximum value among several limits of
quantification in different years is indicated as “limit of quantification” in a
table. This leads to counting “the number of results below the limit of
quantification” by comparing analytical results of each year with the limit of
quantification indicated in the table.
Pesticide Maximum Residue Limits (MRLs)
The most recent MRLs during the survey years are indicated. Thus, they may
not be the same as the current MRLs. Units are indicated in mg/kg rather than
ppm.
The number of samples below the MRL
The sum of the number of samples compliant with the MRL at the time of the
survey.

14
3.1. Agricultural products
3.1.1. Cereals
3.1.1.1. Husked rice
Pesticide residues
Table 1 Analytical results of pesticide residues in husked rice (2013, 2014)
Pesticide name Type* No of
samples LOQ
(mg/kg)
No of samples
below LOQ
Pesticide MRL
(mg/kg)
No of samples
below MRL
Azoxystrobin F 9 0.01 9 0.2 9
Benfuresate H 3 0.02 3 0.05 3
Bromobutide H 33 0.02 28 0.7 33
Buprofezin I 8 0.02 6 0.5 8
Butachlor H 10 0.02 10 0.1 10
Cafenstrole H 6 0.02 6 0.02 6
Carpropamid F 1 0.02 1 1 1
Clomeprop H 3 0.02 3 0.02 3
Clothianidin I 30 0.02 29 0.7 30
Cyhalofop-butyl H 4 0.02 4 0.1 4
Daimuron H 8 0.03 8 0.1 8
Diclocymet F 1 0.02 1 0.5 1
Dimethametryn H 1 0.01 1 0.1 1
Dinotefuran I 47 0.01 26 2 47
Etofenprox I 23 0.01 22 0.5 23
Fenitrothion I 15 0.05 15 0.2 15
Fenobucarb I 2 0.02 2 1.0 2
Ferimzone F 20 0.02 11 2 20
Fludioxonil F 3 0.01 3 0.05 3
Flutolanil F 7 0.01 6 2.0 7
Imidacloprid I 10 0.02 10 1 10
Indanofan H 2 0.02 2 0.05 2
Mefenacet H 5 0.02 5 0.05 5
Metalaxyl F 23 0.02 23 0.1 23
Oxadiazon H 2 0.02 2 0.02 2
Oxaziclomefone H 16 0.01 16 0.05 16

15
Pesticide name Type* No of
samples LOQ
(mg/kg)
No of samples
below LOQ
Pesticide MRL
(mg/kg)
No of samples
below MRL
Phthalide F 33 0.02 30 1 33
Pretilachlor H 16 0.01 16 0.03 16
Pyriminobac-methyl H 10 0.01 10 0.05 10
Pyroquilon F 8 0.02 8 0.2 8
Quinoclamine H 2 0.01 2 0.03 2
Simetryn H 1 0.01 1 0.05 1
Thiamethoxam I 8 0.02 8 0.3 8
Thifluzamide F 4 0.02 4 0.5 4
Thiobencarb
(benthiocarb) H 1 0.01 1 0.2 1
Tricyclazole F 15 0.05 13 3 15
Uniconazole-P P 1 0.01 1 0.1 1
*Type of pesticide; F: fungicide, H: herbicide, I: insecticide, P: plant growth regulator

16
3.1.1.2. Wheat
Cadmium
Table 2 Analytical results of cadmium in wheat (2012-2014)
Chemical name
No of samples
LOQ (mg/kg)
No of samples
below LOQ
Minimum (mg/kg)
Maximum (mg/kg)
Mean (mg/kg)
Median (mg/kg)
Cadmium 1800 0.01 112 < 0.01 0.50 0.05 0.03
Mycotoxins
Table 3 Analytical results of mycotoxins in wheat (2013)
Chemical name
No of samples
LOQ (mg/kg)
No of samples
below LOQ
Minimum (mg/kg)
Maximum (mg/kg)
Mean (mg/kg)
Median (mg/kg)
DON 120 0.0021 34 < 0.0021 0.48 0.015 0.0056
3-Ac-DON 120 0.003 109 < 0.003 0.025 0.004 -
15-Ac-DON 120 0.0020 120 - - 0.0020 -
NIV 120 0.005 65 < 0.005 0.084 0.008 -
4-Ac-NIV 120 0.0024 120 - - 0.0024 -
T-2 toxin 120 0.0009 110 < 0.0009 0.0031 0.0010 -
HT-2 toxin 120 0.0009 92 < 0.0009 0.029 0.0018 -
Zearalenone 120 0.0008 98 < 0.0008 0.013 0.0013 -
Table 4 Analytical results of mycotoxins in wheat (2014)
Chemical name
No of samples
LOQ (mg/kg)
No of samples
below LOQ
Minimum (mg/kg)
Maximum (mg/kg)
Mean (mg/kg)
Median (mg/kg)
DON 120 0.003 42 < 0.003 0.14 0.015 0.006
3-Ac-DON 120 0.005 117 < 0.005 0.006 0.005 -
15-Ac-DON 120 0.003 120 - - 0.003 -
NIV 120 0.005 83 < 0.005 0.11 0.008 -
4-Ac-NIV 120 0.003 119 < 0.003 0.003 0.003 -
T-2 toxin 120 0.0010 117 < 0.0010 0.018 0.0012 -
HT-2 toxin 120 0.0010 100 < 0.0010 0.069 0.0024 -
Zearalenone 120 0.0010 108 < 0.0010 0.027 0.0015 -

17
3.1.1.3. Barley
Mycotoxins
Table 5 Analytical results of mycotoxins in barley (2013)
Chemical name
No of samples
LOQ (mg/kg)
No of samples
below LOQ
Minimum (mg/kg)
Maximum (mg/kg)
Mean (mg/kg)
Median (mg/kg)
DON 100 0.0022 23 < 0.0022 0.12 0.013 0.0063
3-Ac-DON 100 0.0024 56 < 0.0024 0.020 0.0033 -
15-Ac-DON 100 0.0025 100 - - 0.0025 -
NIV 100 0.004 23 < 0.004 0.089 0.015 0.010
4-Ac-NIV 100 0.0023 92 < 0.0023 0.012 0.0026 -
T-2 toxin 100 0.0005 90 < 0.0005 0.018 0.0009 -
HT-2 toxin 100 0.0008 92 < 0.0008 0.039 0.0018 -
Zearalenone 100 0.0009 94 < 0.0009 0.013 0.0011 -
Table 6 Analytical results of mycotoxins in barley (2014)
Chemical name
No of samples
LOQ (mg/kg)
No of samples
below LOQ
Minimum (mg/kg)
Maximum (mg/kg)
Mean (mg/kg)
Median (mg/kg)
DON 99 0.003 40 < 0.003 0.22 0.011 0.004
3-Ac-DON 99 0.005 90 < 0.005 0.030 0.006 -
15-Ac-DON 99 0.003 97 < 0.003 0.005 0.003 -
NIV 99 0.005 44 < 0.005 0.26 0.014 0.005
4-Ac-NIV 99 0.003 88 < 0.003 0.030 0.004 -
T-2 toxin 99 0.0010 94 < 0.0010 0.017 0.0012 -
HT-2 toxin 99 0.0010 93 < 0.0010 0.11 0.0025 -
zearalenone 99 0.0010 91 < 0.0010 0.23 0.0041 -
Table 7 Analytical results of mycotoxins in barley (2014)
Chemical name
No of samples
LOQ (µg/kg)
No of samples
below LOQ
Minimum (µg/kg)
Maximum (µg/kg)
Mean (µg/kg)
Median (µg/kg)
Total aflatoxins* 86 - 86 - - 0 -
Aflatoxin B1 86 0.03 86 - - 0.03 -
Aflatoxin B2 86 0.03 86 - - 0.03 -
Aflatoxin G1 86 0.04 86 - - 0.04 -

18
Chemical name
No of samples
LOQ (µg/kg)
No of samples
below LOQ
Minimum (µg/kg)
Maximum (µg/kg)
Mean (µg/kg)
Median (µg/kg)
Aflatoxin G2 86 0.03 86 - - 0.03 -
Ochratoxin A 86 0.06 86 - - 0.06 -
*An aflatoxin concentration below the LOQ was set equal to zero.

19
3.1.2. Pulses (except immature pulses)
3.1.2.1. Soybeans (dry)
Cadmium
Table 8 Analytical results of cadmium in soybeans (dry) (2011-2013)
Chemical name
No of samples
LOQ (mg/kg)
No of samples
below LOQ
Minimum (mg/kg)
Maximum (mg/kg)
Mean (mg/kg)
Median (mg/kg)
Cadmium 1800 0.02 8 < 0.02 0.87 0.11 0.10
3.1.2.2. Azuki beans
Mycotoxins
Table 9 Analytical results of mycotoxins in Azuki beans (2014)
Chemical name
No of samples
LOQ (mg/kg)
No of samples
below LOQ
Minimum (mg/kg)
Maximum (mg/kg)
Mean (mg/kg)
Median (mg/kg)
DON 62 0.01 60 < 0.01 0.01 0.01 -
T-2 toxin 62 0.001 48 < 0.001 0.013 0.002 -
HT-2 toxin 62 0.0006 21 < 0.0006 0.023 0.0034 0.0014
Zearalenone 62 0.01 34 < 0.01 0.16 0.02 -

20
3.1.2.3. Kidney beans
Mycotoxins
Table 10 Analytical results of mycotoxins in kidney beans (2014)
Chemical name
No of samples
LOQ (mg/kg)
No of samples
below LOQ
Minimum (mg/kg)
Maximum (mg/kg)
Mean (mg/kg)
Median (mg/kg)
DON 44 0.01 41 < 0.01 0.03 0.01 -
T-2 toxin 44 0.001 29 < 0.001 0.023 0.002 -
HT-2 toxin 44 0.0006 18 < 0.0006 0.037 0.0034 0.0009
Zearalenone 44 0.01 43 < 0.01 0.02 0.01 -
3.1.2.4. Peanuts
Mycotoxins
Table 11 Analytical results of aflatoxins in peanuts (2014)
Chemical name
No of samples
LOQ (µg/kg)
No of samples
below LOQ
Minimum (µg/kg)
Maximum (µg/kg)
Mean (µg/kg)
Median (µg/kg)
Total aflatoxins* 15 - 15 - - 0 -
Aflatoxin B1 15 0.1 15 - - 0.1 -
Aflatoxin B2 15 0.1 15 - - 0.1 -
Aflatoxin G1 15 0.1 15 - - 0.1 -
Aflatoxin G2 15 0.1 15 - - 0.1 -
*An aflatoxin concentration below the LOQ was set equal to zero.

21
3.1.3. Vegetables
3.1.3.1. Kabu ‘turnip’ (root and leaves)
Pesticide residues
Table 12 Analytical results of pesticide residues in Kabu ‘turnip’ (root) (2014)
Pesticide name Type* No of
samples LOQ
(mg/kg)
No of samples
below LOQ
Pesticide MRL
(mg/kg)
No of samples
below MRL
Acephate I 11 0.01 11 1.0 11
Acetamiprid I 7 0.02 7 0.1 7
Alachlor H 2 0.01 2 0.01 2
Azoxystrobin F 6 0.01 6 1 6
Captan F 2 0.01 2 5 2
Chlorfenapyr I 1 0.02 1 0.2 1
Cyazofamid F 11 0.02 11 0.3 11
Diazinon I 10 0.02 10 0.1 10
Dinotefuran I 9 0.01 4 0.5 9
Flubendiamide I 2 0.01 2 0.3 2
Iprodione F 2 0.05 2 5.0 2
Malathion I 3 0.03 3 0.5 3
Metalaxyl (including
metalaxyl-M) F 7 0.02 7 0.3 7
Methamidophos - 11 0.01 11 0.5 11
Methomyl I 6 0.02 6 0.5 6
Metolachlor
(including
S-metolachlor) H 1 0.02 1 0.1 1
Phenthoate I 9 0.02 9 0.02 9
Spinosad I 4 0.02 4 0.1 4
Tefluthrin I 29 0.02 29 0.1 29
Tolfenpyrad I 20 0.02 17 1 20
*Type of pesticide; F: fungicide, H: herbicide, I: insecticide

22
Table 13 Analytical results of pesticide residues in Kabu ‘turnip’ (leaves) (2014)
Pesticide name Type* No of
samples LOQ
(mg/kg)
No of samples
below LOQ
Pesticide MRL
(mg/kg)
No of samples
below MRL
Acephate I 11 0.01 11 10 11
Acetamiprid I 7 0.02 6 5 7
Alachlor H 2 0.01 2 0.01 2
Azoxystrobin F 6 0.01 4 15 6
Captan F 2 0.01 2 5 2
Chlorfenapyr I 1 0.02 0 15 1
Cyazofamid F 11 0.02 4 20 11
Diazinon I 10 0.02 10 0.1 10
Dinotefuran I 9 0.01 2 5 9
Flubendiamide I 2 0.01 1 25 2
Iprodione F 2 0.05 2 5.0 2
Malathion I 3 0.03 3 0.5 3
Metalaxyl (including
metalaxyl-M) F 7 0.02 7 0.3 7
Methamidophos - 11 0.01 11 5 11
Methomyl I 6 0.02 5 2 6
Metolachlor
(including
S-metolachlor) H 1 0.02 1 0.05 1
Phenthoate I 9 0.02 8 0.02 8
Spinosad I 4 0.02 3 3 4
Tefluthrin I 29 0.02 29 0.5 29
Tolfenpyrad I 20 0.02 9 25 20
*Type of pesticide; F: fungicide, H: herbicide, I: insecticide

23
3.1.3.2. Daikon ‘Japanese radish’ (leaves)
Dioxins
Table 14 Analytical results of dioxins in Daikon ‘Japanese radish’ (leaves) (2013)
Food No of
samples
Dioxins concentration (pg-TEQ/g wet weight)
Minimum Maximum Mean Median
Daikon ‘Japanese
radishes’ (leaves) 5 0.0012 0.030 0.016 0.014
Note: A dioxin concentration below the LOD was set equal to zero.
3.1.3.3. Hakusai ‘Chinese cabbage’
Pesticide residues
Table 15 Analytical results of pesticide residues in Hakusai ‘Chinese cabbage’ (2013, 2014)
Pesticide name Type* No of
samples LOQ
(mg/kg)
No of samples
below LOQ
Pesticide MRL
(mg/kg)
No of samples
below MRL
Acephate I 24 0.01 23 5 24
Acetamiprid I 21 0.02 20 0.5 21
Azoxystrobin F 16 0.01 15 3 16
Boscalid F 25 0.02 21 40 25
Butamifos H 1 0.01 1 0.01 1
Captan F 7 0.01 6 5 7
Carbaryl I 1 0.05 1 1.0 1
Chlorfenapyr I 16 0.02 15 2 16
Chlorfluazuron I 3 0.05 3 2.0 3
Chlorothalonil F 47 0.01 42 2 47
Clothianidin I 40 0.01 40 0.3 40
Cyazofamid F 22 0.02 22 2 22
Cyhalothrin I 1 0.05 1 1.0 1
Cymoxanil F 1 0.02 1 0.2 1
Cypermethrin I 2 0.05 2 5.0 2
Diazinon I 5 0.02 5 0.1 5
Dimethoate I 3 0.1 3 1 3
Dimethomorph F 5 0.02 3 2 5
Dinotefuran I 10 0.01 5 2 10
Etofenprox I 6 0.02 5 5 6

24
Pesticide name Type* No of
samples LOQ
(mg/kg)
No of samples
below LOQ
Pesticide MRL
(mg/kg)
No of samples
below MRL
Fenvalerate I 35 0.05 32 3.0 35
Flubendiamide I 39 0.01 28 5 39
Flucythrinate I 1 0.03 1 0.50 1
Flufenoxuron I 5 0.02 5 0.5 5
Fluvalinate I 2 0.01 2 1.0 2
Imidacloprid I 45 0.02 44 0.5 45
Indoxacarb
(including
indoxacarb MP) I 23 0.02 23 1 23
Iprodione F 20 0.05 20 5.0 20
Isoxathion I 2 0.03 2 0.1 2
Kresoxim-methyl F 6 0.02 6 2 6
Lufenuron I 18 0.05 18 1 18
Malathion I 33 0.03 33 2.0 33
Mandipropamid F 1 0.01 1 25 1
Metalaxyl (including
metalaxyl-M) F 23 0.02 23 0.3 23
Methamidophos - 24 0.01 23 2 24
Methomyl I 27 0.02 23 2 27
Methoxyfenozide I 3 0.02 3 7 3
Oxolinic acid F 35 0.01 24 2 35
Pendimethalin H 5 0.01 5 0.2 5
Permethriin I 6 0.02 6 5.0 6
Phenthoate I 3 0.02 3 0.02 3
Pyridalyl I 21 0.02 18 1 21
Spinosad I 17 0.02 17 1 17
Teflubenzuron I 1 0.02 1 0.5 1
Tefluthrin I 6 0.02 6 0.1 6
Thiamethoxam I 40 0.02 39 3 40
Thiodicarb I 1 0.01 1 2 1
Tolclofos-methyl F 2 0.01 2 2.0 2
Tolfenpyrad I 14 0.02 13 2 14
Tralomethrin I 1 0.01 1 0.5 1

25
Pesticide name Type* No of
samples LOQ
(mg/kg)
No of samples
below LOQ
Pesticide MRL
(mg/kg)
No of samples
below MRL
Trifluralin H 4 0.01 4 0.05 4
*Type of pesticide; F: fungicide, H: herbicide, I: insecticide
3.1.3.4. Cabbage
Dioxins
Table 16 Analytical results of dioxins in cabbage (2013)
Food No of
samples
Dioxins concentration (pg-TEQ/g wet weight)
Minimum Maximum Mean Median
Cabbage 10 0 0.0019 0.00020 0.0000045
Note: A dioxin concentration below the LOD was set equal to zero.
3.1.3.5. Komatsuna
Dioxins
Table 17 Analytical results of dioxins in komatsuna (2013)
Food No of
samples
Dioxins concentration (pg-TEQ/g wet weight)
Minimum Maximum Mean Median
Komatsuna 8 0.00013 0.0062 0.0033 0.0035
Note: A dioxin concentration below the LOD was set equal to zero.
Pesticide residues
Table 18 Analytical results of pesticide residues in komatsuna (2014)
Pesticide name Type* No of
samples LOQ
(mg/kg)
No of samples
below LOQ
Pesticide MRL
(mg/kg)
No of samples
below MRL
Acephate I 3 0.01 1 5.0 3
Acetamiprid I 14 0.02 9 5 14
Alachlor H 1 0.01 1 0.01 1
Azoxystrobin F 2 0.01 1 15 2
Chlorfenapyr I 4 0.02 3 5 4
Clothianidin I 2 0.01 1 1 2
Cyazofamid F 9 0.02 4 15 9
Cypermethrin I 13 0.05 7 5.0 13
Diazinon I 9 0.02 9 0.1 9

26
Pesticide name Type* No of
samples LOQ
(mg/kg)
No of samples
below LOQ
Pesticide MRL
(mg/kg)
No of samples
below MRL
Dinotefuran I 18 0.01 3 10 18
Flufenoxuron I 10 0.02 5 10 10
Imidacloprid I 4 0.02 4 5 4
Metalaxyl (including
metalaxyl-M) F 6 0.02 4 1 6
Methamidophos - 3 0.01 1 0.7 3
Methomyl I 2 0.02 2 2 2
Pirimiphos-methyl I 3 0.01 2 1.0 3
Pyridalyl I 2 0.02 2 15 2
Spinosad I 6 0.02 6 10 6
Tefluthrin I 9 0.02 9 0.5 9
Thiamethoxam I 2 0.02 0 5 2
Tralomethrin I 1 0.01 0 0.5 1
Trifluralin H 3 0.01 3 0.05 3
*Type of pesticide; F: fungicide, H: herbicide, I: insecticide
3.1.3.6. Chingensai ‘green bok choy’
Pesticide residues
Table 19 Analytical results of pesticide residues in Chingensai ‘green bok choy’ (2014)
Pesticide name Type* No of
samples LOQ
(mg/kg)
No of samples
below LOQ
Pesticide MRL
(mg/kg)
No of samples
below MRL
Acephate I 1 0.01 1 5.0 1
Acetamiprid I 21 0.02 13 5 21
Azoxystrobin F 2 0.01 2 40 2
Captan F 1 0.01 1 5 1
Chlorfenapyr I 11 0.02 5 10 11
Clothianidin I 10 0.01 6 5 10
Cyazofamid F 10 0.02 3 3 10
Cypermethrin I 10 0.05 3 5.0 10
Diazinon I 2 0.02 2 0.1 2
Dinotefuran I 20 0.01 2 10 20
Flufenoxuron I 6 0.02 4 5 6

27
Pesticide name Type* No of
samples LOQ
(mg/kg)
No of samples
below LOQ
Pesticide MRL
(mg/kg)
No of samples
below MRL
Imidacloprid I 3 0.02 3 5 3
Lufenuron I 1 0.05 1 5 1
Metalaxyl (including
metalaxyl-M) F 10 0.02 7 2 10
Methamidophos - 1 0.01 1 0.5 1
Methomyl I 3 0.02 3 2 3
Oxolinic acid F 11 0.01 1 2 11
Pyridalyl I 5 0.02 2 15 5
Spinosad I 14 0.02 13 2 14
Tefluthrin I 4 0.02 4 0.5 4
Thiamethoxam I 8 0.02 3 5 8
Tralomethrin I 1 0.01 1 0.5 1
*Type of pesticide; F: fungicide, H: herbicide, I: insecticide
3.1.3.7. Broccoli (flower buds)
Dioxins
Table 20 Analytical results of dioxinsin in broccoli (flower buds) (2013)
Food No of
samples
Dioxins concentration (pg-TEQ/g wet weight)
Minimum Maximum Mean Median
Broccolies (flower
buds) 4 0 0.00011 0.000027 0.0000015
Note: A dioxin concentration below the LOD was set equal to zero.
Pesticide residues
Table 21 Analytical results of pesticide residues in broccoli (flower buds) (2013, 2014)
Pesticide name Type* No of
samples LOQ
(mg/kg)
No of samples
below LOQ
Pesticide MRL
(mg/kg)
No of samples
below MRL
Acephate I 18 0.01 17 5.0 18
Acetamiprid I 14 0.02 14 2 14
Azoxystrobin F 6 0.01 4 5 6
Boscalid F 5 0.02 5 5 5
Chlorfenapyr I 21 0.02 20 3 21

28
Pesticide name Type* No of
samples LOQ
(mg/kg)
No of samples
below LOQ
Pesticide MRL
(mg/kg)
No of samples
below MRL
Chlorfluazuron I 5 0.05 5 2.0 5
Chlorothalonil F 21 0.01 21 5 21
Chromafenozide I 2 0.02 2 2 2
Clothianidin I 27 0.01 26 1 27
Cyazofamid F 15 0.02 15 1 15
Diazinon I 7 0.02 7 0.1 7
Dinotefuran I 15 0.01 14 2 15
EPN I 3 0.03 3 0.1 3
Fenvalerate I 2 0.05 2 2.0 2
Flubendiamide I 28 0.01 22 5 28
Flufenoxuron I 3 0.02 3 5 3
Imidacloprid I 5 0.02 5 5 5
Indoxacarb
(including
indoxacarb MP)
I 8 0.02 8 0.2 8
Isoxathion I 3 0.03 3 0.1 3
Lufenuron I 3 0.05 3 2 3
Malathion I 4 0.03 4 5.0 4
Mandipropamid F 1 0.01 1 5 1
Metalaxyl (including
metalaxyl-M) F 12 0.02 12 0.5 12
Methamidophos - 18 0.01 18 1.0 18
Methomyl I 29 0.02 29 2 29
Oxolinic acid F 14 0.01 14 0.2 14
Permethriin I 9 0.02 9 2.0 9
Phenthoate I 8 0.02 8 0.06 8
Pyridalyl I 14 0.02 14 2 14
Spinosad I 9 0.02 9 2 9
Teflubenzuron I 10 0.02 9 1 10
Thiamethoxam I 20 0.02 19 5 20
Tolclofos-methyl F 5 0.01 5 2.0 5
Tolfenpyrad I 12 0.02 12 1 12

29
Pesticide name Type* No of
samples LOQ
(mg/kg)
No of samples
below LOQ
Pesticide MRL
(mg/kg)
No of samples
below MRL
Trifluralin H 7 0.01 7 0.05 7
*Type of pesticide; F: fungicide, H: herbicide, I: insecticide
3.1.3.8. Syungiku ‘garland chrysanthemum’
Pesticide residues
Table 22 Analytical results of pesticide residues in Syungiku ‘garland chrysanthemum’
(2013, 2014)
Pesticide name Type* No of
samples LOQ
(mg/kg)
No of samples
below LOQ
Pesticide MRL
(mg/kg)
No of samples
below MRL
Acetamiprid I 21 0.02 17 5 21
Azoxystrobin F 39 0.01 16 30 39
Captan F 2 0.01 2 5 2
Chlorfenapyr I 4 0.02 0 20 4
Dinotefuran I 47 0.01 9 20 47
Emamectin benzoate I 5 0.01 5 0.5 5
Flufenoxuron I 49 0.02 25 10 49
Isoxathion I 21 0.03 21 0.1 21
Kresoxim-methyl F 27 0.02 12 20 27
Nitenpyram I 9 0.01 3 5 9
Permethriin I 8 0.02 7 3.0 8
*Type of pesticide; F: fungicide, H: herbicide, I: insecticide
3.1.3.9. Head lettuce (crisphead type)
Pesticide residues
Table 23 Analytical results of pesticide residues in head lettuce (crisphead type) (2013, 2014)
Pesticide name Type* No of
samples LOQ
(mg/kg)
No of samples
below LOQ
Pesticide MRL
(mg/kg)
No of samples
below MRL
Acephate I 12 0.01 11 5.0 12
Acetamiprid I 4 0.02 4 5 4
Azoxystrobin F 27 0.01 22 30 27
Boscalid F 5 0.02 5 40 5
Butamifos H 1 0.01 1 0.01 1

30
Pesticide name Type* No of
samples LOQ
(mg/kg)
No of samples
below LOQ
Pesticide MRL
(mg/kg)
No of samples
below MRL
Chlorfenapyr I 18 0.02 15 20 18
Chlorothalonil F 25 0.01 25 1 25
Clothianidin I 59 0.01 52 20 59
Cyazofamid F 12 0.02 8 10 12
Cyhalothrin I 2 0.05 2 2.0 2
Cypermethrin I 2 0.05 2 2.0 2
Diazinon I 5 0.02 5 0.1 5
Diethofencarb F 9 0.05 8 5.0 9
Dimethomorph F 1 0.02 1 10 1
Dinotefuran I 11 0.01 7 25 11
Etofenprox I 1 0.02 1 2 1
Fenvalerate I 14 0.05 14 2.0 14
Flubendiamide I 44 0.01 34 15 44
Flufenoxuron I 7 0.02 6 10 7
Fluvalinate I 2 0.01 2 3.0 2
Imidacloprid I 14 0.02 12 3 14
Indoxacarb
(including
indoxacarb MP) I 7 0.02 7 14 7
Iprodione F 13 0.05 12 10 13
Isoxathion I 1 0.03 1 0.1 1
Lufenuron I 3 0.05 3 10 3
Malathion I 17 0.03 17 2.0 17
Mandipropamid F 6 0.01 6 25 6
Methamidophos - 12 0.01 11 1.0 12
Methomyl I 26 0.02 23 5 26
Methoxyfenozide I 3 0.02 2 30 3
Oxamyl I 2 0.01 1 0.50 2
Oxolinic acid F 35 0.01 32 5 35
Pendimethalin H 1 0.01 1 0.2 1
Permethriin I 4 0.02 4 3.0 4
Procymidone F 13 0.03 6 5 13
Pyridalyl I 21 0.02 18 20 21

31
Pesticide name Type* No of
samples LOQ
(mg/kg)
No of samples
below LOQ
Pesticide MRL
(mg/kg)
No of samples
below MRL
Spinosad I 5 0.02 5 10 5
Tefluthrin I 5 0.02 5 0.5 5
Thiamethoxam I 49 0.02 43 3 49
Thiodicarb I 3 0.01 3 5 3
Tolclofos-methyl F 6 0.01 5 2.0 6
Tolfenpyrad I 10 0.02 9 10 10
Tralomethrin I 1 0.01 1 0.5 1
Trifluralin H 2 0.01 2 0.1 2
*Type of pesticide; F: fungicide, H: herbicide, I: insecticide
3.1.3.10. Spinach
Dioxins
Table 24 Analytical results of dioxins in spinach (2013)
Food No of
samples
Dioxins concentration (pg-TEQ/g wet weight)
Minimum Maximum Mean Median
Spinach 19 0.00077 0.071 0.016 0.0057
Note: A dioxin concentration below the LOD was set equal to zero.
Pesticide residues
Table 25 Analytical results of pesticide residues in spinach (2013, 2014)
Pesticide name Type* No of
samples LOQ
(mg/kg)
No of samples
below LOQ
Pesticide MRL
(mg/kg)
No of samples
below MRL
Acephate I 1 0.01 1 6 1
Acetamiprid I 2 0.02 2 3 2
Alachlor H 9 0.01 9 0.01 9
Cadusafos I 2 0.01 2 0.1 2
Captan F 14 0.01 14 5 14
Chlorfenapyr I 2 0.02 2 3 2
Clothianidin I 3 0.01 0 3 3
Cyazofamid F 23 0.02 13 25 23
Cypermethrin I 25 0.05 24 2.0 25
Diazinon I 30 0.02 30 0.1 30

32
Pesticide name Type* No of
samples LOQ
(mg/kg)
No of samples
below LOQ
Pesticide MRL
(mg/kg)
No of samples
below MRL
Dichlorvos I 1 0.01 1 0.1 1
Dinotefuran I 8 0.01 3 15 8
Fenitrothion I 5 0.02 5 0.2 5
Flufenoxuron I 50 0.02 20 10 50
Imidacloprid I 34 0.02 18 15 34
Iprodione F 1 0.05 1 5.0 1
Isoxathion I 1 0.03 1 0.1 1
Lenacil H 13 0.03 13 0.3 13
Malathion I 3 0.03 3 2.0 3
Metalaxyl (including
metalaxyl-M) F 13 0.02 12 2 13
Methamidophos - 1 0.01 1 0.5 1
Methomyl I 26 0.02 24 5 26
Permethriin I 5 0.02 5 2.0 5
Phenthoate I 3 0.02 3 0.1 3
Simeconazole F 2 0.02 2 0.1 2
Spinosad I 5 0.02 4 10 5
Teflubenzuron I 2 0.02 2 5 2
Tefluthrin I 10 0.02 7 0.5 10
Thiamethoxam I 3 0.02 1 10 3
Tolclofos-methyl F 2 0.01 2 2.0 2
*Type of pesticide; F: fungicide, H: herbicide, I: insecticide

33
3.1.3.11. Nira ‘Chinese chive’
Pesticide residues
Table 26 Analytical results of pesticide residues in Nira ‘chinese chive’ (2013, 2014)
Pesticide name Type* No of
samples LOQ
(mg/kg)
No of samples
below LOQ
Pesticide MRL
(mg/kg)
No of samples
below MRL
Acetamiprid I 46 0.02 30 5 46
Azoxystrobin F 42 0.01 20 70 42
Butamifos H 1 0.01 1 0.05 1
Clothianidin I 48 0.01 17 15 48
Cypermethrin I 39 0.05 27 6.0 39
Diazinon I 3 0.02 2 0.1 3
Dimethoate I 26 0.1 25 1 26
Dinotefuran I 12 0.01 3 10 12
Fludioxonil F 21 0.03 11 10 21
Imidacloprid I 1 0.02 1 1 1
Kresoxim-methyl F 62 0.02 22 25 62
Linuron H 14 0.02 13 0.2 14
Methidathion I 17 0.02 16 0.1 17
Methomyl I 8 0.02 8 2 8
Pendimethalin H 16 0.01 15 0.05 16
Permethriin I 1 0.02 1 3.0 1
Profenofos I 1 0.02 1 0.05 1
Prothiofos I 9 0.03 8 0.1 9
Spinosad I 27 0.02 25 5 27
Tebuconazole F 1 0.05 1 10 1
Thiamethoxam I 3 0.02 3 2 3
Tolclofos-methyl F 10 0.01 9 2.0 10
Tolfenpyrad I 19 0.02 10 10 19
Triflumizole F 11 0.05 11 5.0 11
*Type of pesticide; F: fungicide, H: herbicide, I: insecticide

34
3.1.3.12. Negi ‘welsh onion’
Dioxins
Table 27 Analytical results of dioxins in Negi ‘welsh onion’ (2013)
Food No of
samples
Dioxins concentration (pg-TEQ/g wet weight)
Minimum Maximum Mean Median
Welsh onion, "Negi" 9 0.00092 0.012 0.0052 0.0038
Note: A dioxin concentration below the LOD was set equal to zero.
Pesticide residues
Table 28 Analytical results of pesticide residues in Negi ‘welsh onion’ (2013, 2014)
Pesticide name Type* No of
samples LOQ
(mg/kg)
No of samples
below LOQ
Pesticide MRL
(mg/kg)
No of samples
below MRL
Acetamiprid I 21 0.02 21 4.5 21
Azoxystrobin F 75 0.01 64 10 75
Bifenthrin I 1 0.01 0 0.5 1
Butamifos H 6 0.01 6 0.03 6
Cadusafos I 4 0.01 4 0.01 4
Captan F 1 0.01 1 5 1
Chlorfenapyr I 7 0.02 7 3 7
Chlorothalonil F 55 0.01 46 5 55
Clothianidin I 61 0.01 46 0.7 61
Cyanophos I 2 0.02 2 0.05 2
Cyazofamid F 7 0.02 5 2 7
Cypermethrin I 43 0.05 41 5.0 43
Diazinon I 33 0.02 33 0.1 33
Diflubenzuron I 6 0.02 6 1 6
Dimethoate I 23 0.1 23 1 23
Dimethomorph F 5 0.02 5 15 5
Dinotefuran I 37 0.01 24 15 37
Disulfoton
(ethylthiometon) I 2 0.01 2 0.5 2
EPN I 18 0.03 18 0.1 18
Etofenprox I 3 0.02 2 2 2
Fenitrothion I 15 0.02 15 0.2 15

35
Pesticide name Type* No of
samples LOQ
(mg/kg)
No of samples
below LOQ
Pesticide MRL
(mg/kg)
No of samples
below MRL
Flubendiamide I 15 0.01 13 3 15
Flufenoxuron I 8 0.02 8 10 8
Flutolanil F 14 0.01 10 1 14
Imidacloprid I 12 0.02 12 0.7 12
Indoxacarb
(including
indoxacarb MP) I 1 0.02 1 2 1
Iprodione F 30 0.05 27 5.0 30
Isoxathion I 9 0.03 9 0.1 9
Kresoxim-methyl F 16 0.02 13 2 16
Linuron H 4 0.02 4 0.2 4
Lufenuron I 8 0.05 8 2 8
Malathion I 9 0.03 9 8.0 9
Mandipropamid F 1 0.01 0 7 1
Mepanipyrim F 3 0.02 1 10 3
Mepronil F 1 0.02 1 0.01 1
Metalaxyl (including
metalaxyl-M) F 32 0.02 32 0.2 32
Methomyl I 23 0.02 23 2 23
Myclobutanil F 5 0.05 5 1 5
Oxolinic acid F 14 0.01 14 3 14
Pendimethalin H 40 0.01 40 0.2 40
Permethriin I 12 0.02 11 3.0 12
Phenthoate I 7 0.02 7 0.05 7
Procymidone F 1 0.03 1 5 1
Pyridalyl I 22 0.02 20 5 22
Simeconazole F 16 0.02 16 0.2 16
Spinosad I 20 0.02 20 2 20
Tebuconazole F 10 0.05 10 0.7 10
Teflubenzuron I 1 0.02 1 1 1
Tefluthrin I 5 0.02 5 0.5 5
Thiamethoxam I 15 0.02 11 2 15
Thiodicarb I 1 0.01 1 2 1

36
Pesticide name Type* No of
samples LOQ
(mg/kg)
No of samples
below LOQ
Pesticide MRL
(mg/kg)
No of samples
below MRL
Tolclofos-methyl F 1 0.01 1 2.0 1
Tolfenpyrad I 35 0.02 28 5 35
Triadimefon F 1 0.02 1 0.1 1
Triadimenol - 1 0.02 1 0.2 1
Triflumizole F 6 0.05 6 1.0 6
Trifluralin H 13 0.01 13 0.1 13
*Type of pesticide; F: fungicide, H: herbicide, I: insecticide
3.1.3.13. Tamanegi ‘bulb onion’
Pesticide residues
Table 29 Analytical results of pesticide residues in Tamanegi ‘bulb onion’ (2014)
Pesticide name Type* No of
samples LOQ
(mg/kg)
No of samples
below LOQ
Pesticide MRL
(mg/kg)
No of samples
below MRL
Acephate I 22 0.01 21 0.5 22
Acetamiprid I 2 0.02 2 0.2 2
Azoxystrobin F 1 0.01 1 10 1
Boscalid F 14 0.02 14 5 14
Butamifos H 1 0.01 1 0.02 1
Captan F 5 0.01 5 5 5
Chlorothalonil F 27 0.01 27 0.5 27
Chlorpropham H 1 0.03 1 0.05 1
Chlorpyrifos I 4 0.02 4 0.05 4
Cyazofamid F 4 0.02 4 0.05 4
Cyfluthrin I 6 0.05 6 2.0 6
Cyhalothrin I 19 0.05 19 0.5 19
Cymoxanil F 9 0.02 9 2 9
Cypermethrin I 24 0.05 24 0.1 24
Diazinon I 12 0.02 12 0.05 12
Diflubenzuron I 5 0.02 5 0.05 5
Dimethenamid
(including
dimethenamid-P) H 9 0.01 9 0.01 9
Dimethomorph F 3 0.02 3 2 3

37
Pesticide name Type* No of
samples LOQ
(mg/kg)
No of samples
below LOQ
Pesticide MRL
(mg/kg)
No of samples
below MRL
Fenitrothion I 2 0.02 2 0.2 2
Flucythrinate I 5 0.03 5 0.10 5
Fludioxonil F 3 0.03 3 0.5 3
Fluvalinate I 1 0.01 1 0.1 1
Imidacloprid I 1 0.02 1 0.07 1
Iprodione F 5 0.05 5 0.5 5
Isoxathion I 4 0.03 4 0.1 4
Kresoxim-methyl F 16 0.02 16 0.02 16
Mandipropamid F 3 0.01 3 0.1 3
Metalaxyl (including
metalaxyl-M) F 16 0.02 16 2 16
Methamidophos - 22 0.01 22 0.3 22
Methomyl I 3 0.02 3 0.2 3
Oxolinic acid F 35 0.01 35 0.1 35
Pendimethalin H 26 0.01 26 0.2 26
Permethriin I 3 0.02 3 3.0 3
Phenthoate I 2 0.02 2 0.02 2
Procymidone F 21 0.03 21 0.5 21
Prothiofos I 28 0.03 28 0.1 28
Pyridalyl I 1 0.02 1 0.05 1
Tebuconazole F 22 0.05 22 0.2 22
Thiobencarb
(benthiocarb) H 2 0.02 2 0.02 2
Trifluralin H 2 0.01 2 0.05 2
*Type of pesticide; F: fungicide, H: herbicide, I: insecticide

38
3.1.3.14. Nasu ‘egg plant’
Dioxins
Table 30 Analytical results of dioxins in Nasu ‘egg plant’ (2013)
Food No of
samples
Dioxins concentration (pg-TEQ/g wet weight)
Minimum Maximum Value
Nasu ‘Egg plant’ 1 - - 0
Note: A dioxin concentration below the LOD was set equal to zero.
Pesticide residues
Table 31 Analytical results of pesticide residues in Nasu ‘egg plant’ (2013, 2014)
Pesticide name Type* No of
samples LOQ
(mg/kg)
No of samples
below LOQ
Pesticide MRL
(mg/kg)
No of samples
below MRL
Acephate I 11 0.01 10 5.0 11
Acetamiprid I 32 0.02 29 2 32
Acrinathrin I 8 0.01 8 0.5 8
Azoxystrobin F 15 0.01 14 3 15
Bifenthrin I 1 0.01 1 0.5 1
Boscalid F 4 0.02 3 3 4
Buprofezin I 8 0.05 8 1 8
Captan F 8 0.01 8 5.0 8
Chlorfenapyr I 54 0.02 49 1 54
Chlorfluazuron I 5 0.05 5 2.0 5
Chlorothalonil F 55 0.01 46 2 55
Chromafenozide I 1 0.02 1 0.5 1
Clothianidin I 32 0.01 32 1 32
Cyazofamid F 13 0.02 13 0.5 13
Cyenopyrafen I 13 0.01 12 0.7 13
Cyflufenamid F 14 0.02 14 0.3 14
Cymoxanil F 5 0.02 5 0.5 5
Cypermethrin I 12 0.05 12 0.5 12
Diazinon I 3 0.02 3 0.1 3
Diethofencarb F 12 0.05 12 5.0 12
Difenoconazole F 1 0.01 1 0.6 1
Dinotefuran I 29 0.01 22 2 29
Etofenprox I 7 0.02 7 2 7

39
Pesticide name Type* No of
samples LOQ
(mg/kg)
No of samples
below LOQ
Pesticide MRL
(mg/kg)
No of samples
below MRL
Etoxazole I 2 0.03 2 0.5 2
Fenarimol F 1 0.1 1 0.5 1
Fenitrothion I 8 0.02 8 0.2 8
Fenobucarb I 1 0.01 1 0.5 1
Fenpropathrin I 1 0.02 1 2 1
Fenpyroximate I 6 0.02 6 0.5 6
Fenvalerate I 1 0.05 1 1.0 1
Flubendiamide I 16 0.01 15 1 16
Fludioxonil F 3 0.03 3 1 3
Flufenoxuron I 16 0.02 15 2 16
Fluvalinate I 2 0.01 2 0.5 2
Fosthiazate I 1 0.02 1 0.2 1
Hexythiazox I 1 0.02 1 2 1
Imidacloprid I 30 0.02 27 2 30
Indoxacarb
(including
indoxacarb MP) I 8 0.02 7 0.5 8
Iprodione F 12 0.05 11 5.0 12
Kresoxim-methyl F 5 0.02 5 3 5
Lufenuron I 6 0.05 6 0.5 6
Malathion I 6 0.03 6 0.5 6
Mandipropamid F 1 0.01 1 2 1
Mepanipyrim F 12 0.02 9 5 12
Metalaxyl (including
metalaxyl-M) F 4 0.02 3 1 4
Methamidophos - 11 0.01 11 1.0 11
Methoxyfenozide I 1 0.02 1 2 1
Myclobutanil F 6 0.05 6 1 6
Permethriin I 12 0.02 11 1.0 12
Procymidone F 5 0.03 4 5 5
Pyridalyl I 26 0.02 23 1 26
Pyriproxyfen I 2 0.02 2 1 2
Spinosad I 12 0.02 12 2 12

40
Pesticide name Type* No of
samples LOQ
(mg/kg)
No of samples
below LOQ
Pesticide MRL
(mg/kg)
No of samples
below MRL
Tebufenpyrad I 8 0.01 8 0.5 8
Thiacloprid I 5 0.03 5 1 5
Thiamethoxam I 19 0.02 19 0.7 19
Tolfenpyrad I 16 0.02 13 2 16
Tralomethrin I 1 0.01 1 0.5 1
Triadimefon F 2 0.02 2 0.05 2
Triadimenol - 2 0.02 2 0.5 2
Trichlorfon I 2 0.01 1 1.0 2
Triflumizole F 40 0.05 40 1.0 40
*Type of pesticide; F: fungicide, H: herbicide, I: insecticide
3.1.3.15. Bell pepper/Sweet pepper
Pesticide residues
Table 32 Analytical results of pesticide residues in bell pepper/sweet pepper (2013, 2014)
Pesticide name Type* No of
samples LOQ
(mg/kg)
No of samples
below LOQ
Pesticide MRL
(mg/kg)
No of samples
below MRL
Acephate I 1 0.01 1 5.0 1
Acetamiprid I 26 0.02 22 1 26
Acrinathrin I 5 0.01 5 1 5
Azoxystrobin F 18 0.01 13 3 18
Boscalid F 5 0.02 2 10 5
Cadusafos I 8 0.01 8 0.01 8
Captan F 1 0.01 1 5 1
Chlorfenapyr I 27 0.02 18 1 27
Chlorfluazuron I 4 0.05 4 2.0 4
Chlorothalonil F 35 0.01 30 7 35
Chromafenozide I 1 0.02 0 1 1
Clothianidin I 14 0.01 11 3 14
Cyazofamid F 6 0.02 6 1 6
Cyenopyrafen I 3 0.01 3 1 3
Cyflufenamid F 13 0.02 9 1 13

41
Pesticide name Type* No of
samples LOQ
(mg/kg)
No of samples
below LOQ
Pesticide MRL
(mg/kg)
No of samples
below MRL
Cypermethrin I 3 0.05 3 2.0 3
Diazinon I 7 0.02 7 0.1 7
Dinotefuran I 26 0.01 14 3 26
Etofenprox I 7 0.02 6 5 7
Fenarimol F 4 0.1 4 0.5 4
Fenpropathrin I 4 0.02 3 2 4
Fenpyroximate I 4 0.02 4 1 4
Flubendiamide I 20 0.01 11 3 20
Fludioxonil F 1 0.03 1 5 1
Flufenoxuron I 10 0.02 6 1 10
Fosthiazate I 2 0.02 2 0.1 2
Hexythiazox I 4 0.02 4 2 4
Imidacloprid I 30 0.02 29 3 30
Indoxacarb
(including
indoxacarb MP) I 2 0.02 2 1 2
Iprodione F 15 0.05 11 10 15
Kresoxim-methyl F 6 0.02 5 2 6
Lufenuron I 6 0.05 5 1 6
Malathion I 5 0.03 5 0.5 5
Metalaxyl (including
metalaxyl-M) F 12 0.02 11 2 12
Methamidophos - 1 0.01 1 2.0 1
Methomyl I 1 0.02 1 0.7 1
Myclobutanil F 24 0.05 21 1 24
Oxamyl I 2 0.01 2 2.0 2
Permethriin I 11 0.02 8 3.0 11
Procymidone F 19 0.03 4 5 19
Pyridaben I 4 0.03 2 3 4
Pyridalyl I 22 0.02 13 2 22
Spinosad I 7 0.02 7 2 7
Thiacloprid I 2 0.03 2 5 2
Thiamethoxam I 3 0.02 3 1 3

42
Pesticide name Type* No of
samples LOQ
(mg/kg)
No of samples
below LOQ
Pesticide MRL
(mg/kg)
No of samples
below MRL
Tolclofos-methyl F 1 0.01 1 2.0 1
Tolfenpyrad I 4 0.02 2 3 4
Triflumizole F 19 0.05 10 5.0 19
*Type of pesticide; F: fungicide, H: herbicide, I: insecticide
3.1.3.16. Kidney beans (green pod)
Pesticide residues
Table 33 Analytical results of pesticide residues in kidney beans (green pod) (2013, 2014)
Pesticide name Type* No of
samples LOQ
(mg/kg)
No of samples
below LOQ
Pesticide MRL
(mg/kg)
No of samples
below MRL
Acetamiprid I 30 0.02 26 3 30
Azoxystrobin F 20 0.01 14 3 20
Chlorfenapyr I 2 0.02 1 0.5 2
Chlorfluazuron I 3 0.05 2 2.0 3
Clothianidin I 4 0.01 3 0.5 4
Cypermethrin I 10 0.05 10 0.5 10
Diazinon I 5 0.02 5 0.2 5
Dimethoate I 1 0.1 1 1 1
Dinotefuran I 2 0.01 1 2 2
Etofenprox I 9 0.02 7 5 9
Fenitrothion I 3 0.02 3 0.5 3
Fenpyroximate I 11 0.02 6 2 11
Fludioxonil F 36 0.03 26 5 36
Flufenoxuron I 6 0.02 4 1 6
Hexythiazox I 2 0.02 2 2 2
Imidacloprid I 29 0.02 28 3 29
Iprodione F 1 0.05 1 5.0 1
Isoxathion I 4 0.03 4 0.1 4
Malathion I 13 0.03 13 2.0 13
Metolachlor
(including
S-metolachlor) H 9 0.02 9 0.3 9
Permethriin I 5 0.02 5 3.0 5

43
Pesticide name Type* No of
samples LOQ
(mg/kg)
No of samples
below LOQ
Pesticide MRL
(mg/kg)
No of samples
below MRL
Phenthoate I 6 0.02 6 0.05 6
Pyridalyl I 7 0.02 4 3 7
Pyriproxyfen I 1 0.02 1 0.2 1
Thiamethoxam I 4 0.02 4 0.3 4
Triadimefon F 1 0.02 1 0.2 1
Triadimenol - 1 0.02 1 1 1
*Type of pesticide; F: fungicide, H: herbicide, I: insecticide
3.1.3.17. Edamame ‘soybeans (immature)’
Pesticide residues
Table 34 Analytical results of pesticide residues in Edamame ‘soybeans (immature)’ (2013,
2014)
Pesticide name Type* No of
samples LOQ
(mg/kg)
No of samples
below LOQ
Pesticide MRL
(mg/kg)
No of samples
below MRL
Acephate I 3 0.01 3 0.5 3
Acetamiprid I 5 0.02 2 3 5
Azoxystrobin F 7 0.01 3 5 7
Cadusafos I 1 0.01 1 0.01 1
Chromafenozide I 1 0.02 1 5 1
Clothianidin I 38 0.01 37 2 38
Cyazofamid F 4 0.02 3 5 4
Cypermethrin I 43 0.05 35 5.0 43
Diazinon I 11 0.02 11 0.1 11
Diethofencarb F 12 0.05 12 5.0 12
Dinotefuran I 14 0.01 7 2 14
Etofenprox I 32 0.02 22 5 32
Fenitrothion I 23 0.02 23 0.5 23
Fenpyroximate I 5 0.02 3 2 5
Flubendiamide I 3 0.01 1 5 3
Flucythrinate I 3 0.03 3 2.0 3
Fludioxonil F 23 0.03 23 5 23

44
Pesticide name Type* No of
samples LOQ
(mg/kg)
No of samples
below LOQ
Pesticide MRL
(mg/kg)
No of samples
below MRL
Flutolanil F 1 0.01 1 2.0 1
Hexythiazox I 3 0.02 3 2 3
Imidacloprid I 3 0.02 3 3 3
Iprodione F 4 0.05 4 5.0 4
Isoxathion I 4 0.03 4 0.1 4
Linuron H 8 0.02 8 0.2 8
Malathion I 7 0.03 7 2.0 7
Metalaxyl (including
metalaxyl-M) F 22 0.02 22 0.2 22
Methamidophos - 3 0.01 3 0.5 3
Methomyl I 12 0.02 12 0.5 12
Metolachlor
(including
S-metolachlor) H 7 0.02 7 0.3 7
Oxamyl I 3 0.01 3 0.2 3
Pendimethalin H 7 0.01 7 0.2 7
Permethriin I 11 0.02 9 3.0 11
Pyridaben I 1 0.03 1 2 1
Pyridalyl I 2 0.02 0 5 2
Teflubenzuron I 1 0.02 1 1 1
Thiamethoxam I 28 0.02 28 0.3 28
Thiobencarb
(benthiocarb) H 7 0.02 7 0.03 7
Trifluralin H 5 0.01 5 0.05 5
*Type of pesticide; F: fungicide, H: herbicide, I: insecticide

45
3.1.3.18. Melons (except watermelons)
Pesticide residues
Table 35 Analytical results of pesticide residues in melons (except watermelons) (2013, 2014)
Pesticide name Type* No of
samples LOQ
(mg/kg)
No of samples
below LOQ
Pesticide MRL
(mg/kg)
No of samples
below MRL
Acetamiprid I 15 0.02 15 0.5 15
Acrinathrin I 5 0.01 5 0.2 5
Alanycarb I 1 0.01 1 2 1
Azoxystrobin F 19 0.01 19 1 19
Bifenthrin I 3 0.01 3 0.2 3
Boscalid F 2 0.02 2 2 2
Buprofezin I 1 0.05 1 0.5 1
Butamifos H 1 0.01 1 0.05 1
Captan F 3 0.01 3 5 3
Chlorothalonil F 53 0.01 53 2 53
Clothianidin I 21 0.01 18 0.3 21
Cyazofamid F 9 0.02 9 0.05 9
Cyenopyrafen I 3 0.01 3 0.05 3
Cyflufenamid F 8 0.02 8 0.02 8
Cymoxanil F 11 0.02 11 0.1 11
Cypermethrin I 5 0.05 5 2.0 5
Diazinon I 10 0.02 10 0.1 10
Difenoconazole F 4 0.01 4 0.1 4
Dinotefuran I 19 0.01 5 1 19
Etofenprox I 8 0.02 7 2 8
Etoxazole I 11 0.03 11 0.2 11
Fenitrothion I 5 0.02 5 0.05 5
Fenpyroximate I 3 0.02 3 1 3
Flufenoxuron I 15 0.02 15 0.02 15
Fluvalinate I 8 0.01 8 0.1 8
Fosthiazate I 10 0.02 10 0.5 10
Imicyafos I 4 0.01 4 0.05 4
Imidacloprid I 54 0.02 51 0.4 54

46
Pesticide name Type* No of
samples LOQ
(mg/kg)
No of samples
below LOQ
Pesticide MRL
(mg/kg)
No of samples
below MRL
Iprodione F 22 0.05 22 10 22
Kresoxim-methyl F 6 0.02 6 1 6
Mepanipyrim F 1 0.02 1 2 1
Metalaxyl (including
metalaxyl-M) F 12 0.02 11 0.7 12
Permethriin I 6 0.02 6 0.1 6
Procymidone F 17 0.03 3 3 17
Pyridaben I 15 0.03 15 0.05 15
Pyridalyl I 9 0.02 9 0.05 9
Simeconazole F 4 0.02 4 0.1 4
Spinosad I 13 0.02 13 0.3 13
Tebufenpyrad I 7 0.01 7 0.1 7
Thiacloprid I 10 0.03 9 1 10
Thiamethoxam I 6 0.02 6 0.3 6
Tolclofos-methyl F 1 0.01 1 0.1 1
Triadimefon F 1 0.02 1 0.1 1
Triadimenol - 1 0.02 1 0.5 1
Triflumizole F 26 0.05 26 2.0 26
Trifluralin H 1 0.01 1 0.05 1
*Type of pesticide; F: fungicide, H: herbicide, I: insecticide
3.1.3.19. Other vegetables20
Dioxins
Table 36 Analytical results of dioxins in other vegetables (2013)
Food No of
samples
Dioxins concentration (pg-TEQ/g wet weight)
Minimum Maximum Mean Median
Other vegetables 11 0.000006 0.022 0.0086 0.0083
Note: A dioxin concentration below the LOD was set equal to zero.
20 Hakusai ‘Chinese cabbage’, Chingensai ‘Green bok choy’, Syungiku ‘Garland
chrysanthemum’, Head lettuce (crisphead type), Nira ‘Chinese chive’, Nozawana
‘Turnip green’, Wakegi ‘Tufted stone leek’, Mizuna ‘Potherb mustard’, Hiroshimana
‘Non-heading Chinese cabbage’, Nabana ‘Turnip rape’, Leaf lettuce

47
3.1.4. Fruits
3.1.4.1. Citrus fruits (Flavorful acid citrus21, Kumquat, Tangors22, Navel oranges, Pummelos23, Other citruses24)
Metals
Table 37 Analytical results of metals in citrus fruits (2013)
Chemical name
No of samples
LOQ (mg/kg)
No of samples
below LOQ
Minimum (mg/kg)
Maximum (mg/kg)
Mean (mg/kg)
Median (mg/kg)
Lead 30 0.01 30 - - 0.01 -
Cadmium 30 0.01 30 - - 0.01 -
Total mercury 30 0.01 30 - - 0.01 -
Total arsenic 30 0.01 30 - - 0.01 -
3.1.4.2. Pome fruits (Japanese pear, European pear, Biwa ‘Loquat’, Kaki ‘Japanese persimon’)
(1) Japanese pear
Pesticide residues
Table 38 Analytical results of pesticide residues in Japanese pear (2013, 2014)
Pesticide name Type* No of
samples LOQ
(mg/kg)
No of samples
below LOQ
Pesticide MRL
(mg/kg)
No of samples
below MRL
Acetamiprid I 37 0.02 20 2 37
Acrinathrin I 6 0.01 2 0.5 6
Alanycarb I 36 0.01 36 2 36
Azoxystrobin F 8 0.01 4 2 8
Bifenthrin I 18 0.01 7 0.5 18
Bitertanol F 1 0.02 1 0.6 1
Boscalid F 65 0.02 39 3 65
Buprofezin I 9 0.05 9 6 9
Captan F 72 0.01 52 25 72
21 Yuzu, Lemons, Sudachi 22 Iyo, Mandarin, Shiranuhi (Dekopon) 23 Buntan, Banpeiyu 24 Hassaku, Hyuga-natsu
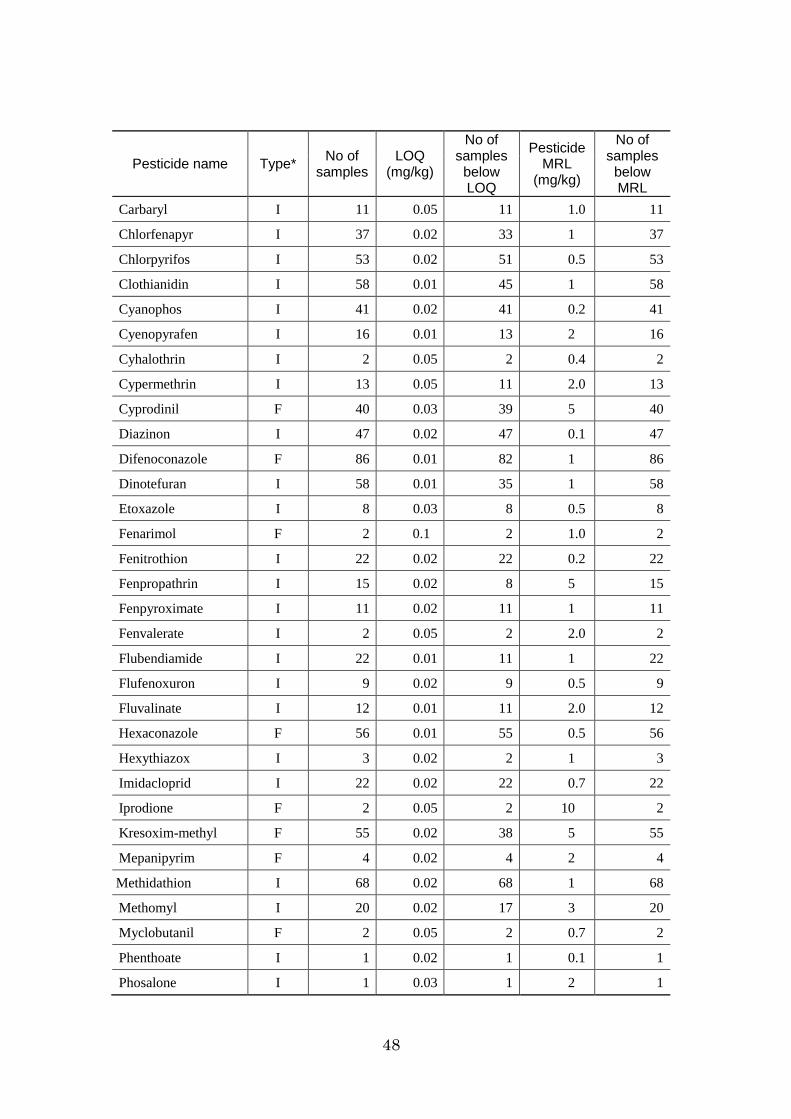
48
Pesticide name Type* No of
samples LOQ
(mg/kg)
No of samples
below LOQ
Pesticide MRL
(mg/kg)
No of samples
below MRL
Carbaryl I 11 0.05 11 1.0 11
Chlorfenapyr I 37 0.02 33 1 37
Chlorpyrifos I 53 0.02 51 0.5 53
Clothianidin I 58 0.01 45 1 58
Cyanophos I 41 0.02 41 0.2 41
Cyenopyrafen I 16 0.01 13 2 16
Cyhalothrin I 2 0.05 2 0.4 2
Cypermethrin I 13 0.05 11 2.0 13
Cyprodinil F 40 0.03 39 5 40
Diazinon I 47 0.02 47 0.1 47
Difenoconazole F 86 0.01 82 1 86
Dinotefuran I 58 0.01 35 1 58
Etoxazole I 8 0.03 8 0.5 8
Fenarimol F 2 0.1 2 1.0 2
Fenitrothion I 22 0.02 22 0.2 22
Fenpropathrin I 15 0.02 8 5 15
Fenpyroximate I 11 0.02 11 1 11
Fenvalerate I 2 0.05 2 2.0 2
Flubendiamide I 22 0.01 11 1 22
Flufenoxuron I 9 0.02 9 0.5 9
Fluvalinate I 12 0.01 11 2.0 12
Hexaconazole F 56 0.01 55 0.5 56
Hexythiazox I 3 0.02 2 1 3
Imidacloprid I 22 0.02 22 0.7 22
Iprodione F 2 0.05 2 10 2
Kresoxim-methyl F 55 0.02 38 5 55
Mepanipyrim F 4 0.02 4 2 4
Methidathion I 68 0.02 68 1 68
Methomyl I 20 0.02 17 3 20
Myclobutanil F 2 0.05 2 0.7 2
Phenthoate I 1 0.02 1 0.1 1
Phosalone I 1 0.03 1 2 1

49
Pesticide name Type* No of
samples LOQ
(mg/kg)
No of samples
below LOQ
Pesticide MRL
(mg/kg)
No of samples
below MRL
Prothiofos I 3 0.03 3 0.1 3
Pyridaben I 1 0.03 1 1 1
Silafluofen I 14 0.05 10 1 14
Simeconazole F 2 0.02 2 0.5 2
Tebuconazole F 13 0.05 12 5 13
Tebufenpyrad I 2 0.01 2 0.5 2
Teflubenzuron I 4 0.02 4 0.5 4
Tetradifon I 2 0.03 2 1 2
Thiacloprid I 40 0.03 37 2 40
Thiamethoxam I 28 0.02 26 1 28
Thiodicarb I 20 0.01 15 3 20
Tolfenpyrad I 50 0.02 47 2 50
Tralomethrin I 11 0.01 9 0.5 11
Triflumizole F 2 0.05 2 2.0 2
*Type of pesticide; F: fungicide, H: herbicide, I: insecticide
(2) European pear
Metals
Table 39 Analytical results of metals in European pear (2013)
Chemical name
No of samples
LOQ (mg/kg)
No of samples
below LOQ
Minimum (mg/kg)
Maximum (mg/kg)
Mean (mg/kg)
Median (mg/kg)
Lead 10 0.01 10 - - 0.01 -
Cadmium 10 0.01 9 < 0.01 0.02 0.01 -
Total mercury 10 0.01 10 - - 0.01 -
Total arsenic 10 0.01 10 - - 0.01 -

50
Pesticide residues
Table 40 Analytical results of pesticide residues in European pear (2013, 2014)
Pesticide name Type* No of
samples LOQ
(mg/kg)
No of samples
below LOQ
Pesticide MRL
(mg/kg)
No of samples
below MRL
Acetamiprid I 7 0.02 2 2 7
Alanycarb I 1 0.01 1 2 1
Azoxystrobin F 1 0.01 1 2 1
Bifenthrin I 1 0.01 1 0.5 1
Boscalid F 6 0.02 5 3 6
Captan F 6 0.01 6 25 6
Chlorpyrifos I 6 0.02 5 0.5 6
Clothianidin I 2 0.01 0 1 2
Cyanophos I 4 0.02 4 0.2 4
Cyenopyrafen I 5 0.01 5 2 5
Cyfluthrin I 5 0.05 5 1.0 5
Cyhalothrin I 4 0.05 3 0.4 4
Diazinon I 5 0.02 5 0.1 5
Difenoconazole F 2 0.01 1 1 2
Fenpropathrin I 2 0.02 1 5 2
Flubendiamide I 4 0.01 4 1 4
Fluvalinate I 2 0.01 2 2.0 2
Hexaconazole F 1 0.01 1 0.5 1
Kresoxim-methyl F 3 0.02 1 5 3
Methidathion I 3 0.02 3 1 3
Phenthoate I 2 0.02 2 0.1 2
Tebuconazole F 4 0.05 2 5 4
Thiacloprid I 3 0.03 3 2 3
Tralomethrin I 5 0.01 4 0.5 5
Trifloxystrobin F 1 0.02 1 5 1
*Type of pesticide; F: fungicide, H: herbicide, I: insecticide

51
(3) Biwa ‘loquat’
Metals
Table 41 Analytical results of metals in Biwa ‘loquat’ (2013)
Chemical name No of
samples LOQ
(mg/kg)
No of samples
below LOQ
Value (mg/kg)
Lead 1 0.01 1 < 0.01
Cadmium 1 0.01 0 0.02
Total mercury 1 0.01 1 < 0.01
Total arsenic 1 0.01 1 < 0.01
(4) Kaki ‘Japanese persimon’
Pesticide residues
Table 42 Analytical results of pesticide residues in Kaki ‘Japanese persimon’ (2014)
Pesticide name Type* No of
samples LOQ
(mg/kg)
No of samples
below LOQ
Pesticide MRL
(mg/kg)
No of samples
below MRL
Acephate I 22 0.01 22 2.0 22
Acetamiprid I 23 0.02 19 1 23
Acrinathrin I 1 0.01 1 1 1
Alanycarb I 14 0.01 14 2 14
Azoxystrobin F 3 0.01 2 1 3
Bifenthrin I 2 0.01 2 0.5 2
Boscalid F 5 0.02 4 1 5
Buprofezin I 10 0.05 10 1 10
Captan F 14 0.01 12 5 14
Chlorfenapyr I 4 0.02 4 1 4
Chlorfluazuron I 1 0.05 1 2.0 1
Clothianidin I 11 0.01 11 0.5 11
Cyanophos I 1 0.02 1 0.2 1
Cypermethrin I 17 0.05 17 2.0 17
Diazinon I 2 0.02 2 0.1 2
Difenoconazole F 19 0.01 13 0.7 19
Dinotefuran I 38 0.01 5 2 38
Etofenprox I 1 0.02 1 2 1
Fenarimol F 4 0.1 4 1.0 4

52
Pesticide name Type* No of
samples LOQ
(mg/kg)
No of samples
below LOQ
Pesticide MRL
(mg/kg)
No of samples
below MRL
Fenitrothion I 19 0.02 19 0.2 19
Fenpropathrin I 4 0.02 1 2 4
Fenpyroximate I 7 0.02 7 0.5 7
Fenvalerate I 2 0.05 2 1.0 2
Flubendiamide I 11 0.01 7 0.7 11
Fluvalinate I 4 0.01 1 1.0 4
Hexaconazole F 1 0.01 1 0.5 1
Imidacloprid I 3 0.02 3 1 3
Kresoxim-methyl F 18 0.02 18 5 18
Malathion I 1 0.03 1 0.5 1
Methamidophos - 22 0.01 22 1 22
Methidathion I 39 0.02 39 0.2 39
Myclobutanil F 1 0.05 1 1 1
Phenthoate I 1 0.02 1 0.1 1
Prothiofos I 26 0.03 26 0.2 26
Silafluofen I 4 0.05 1 2 4
Simeconazole F 2 0.02 2 0.2 2
Tebuconazole F 24 0.05 23 1 24
Tebufenpyrad I 1 0.01 1 0.5 1
Thiamethoxam I 4 0.02 3 1 4
Tralomethrin I 1 0.01 1 0.5 1
Trifloxystrobin F 1 0.02 1 1 1
Triflumizole F 3 0.05 3 2.0 3
*Type of pesticide; F: fungicide, H: herbicide, I: insecticide

53
3.1.4.3. Stone fruits (Cherry, Plum, Nectarine, Prune, Peach)
Metals
Table 43 Analytical results of metals in stone fruits (2013)
Chemical name
No of samples
LOQ (mg/kg)
No of samples
below LOQ
Minimum (mg/kg)
Maximum (mg/kg)
Mean (mg/kg)
Median (mg/kg)
Lead 30 0.01 29 < 0.01 0.02 0.01 -
Cadmium 30 0.01 30 - - 0.01 -
Total mercury 30 0.01 30 - - 0.01 -
Total arsenic 30 0.01 30 - - 0.01 -
Pesticide residues
Table 44 Analytical results of pesticide residues in peach (2013)
Pesticide name Type* No of
samples LOQ
(mg/kg)
No of samples
below LOQ
Pesticide MRL
(mg/kg)
No of samples
below MRL
Acetamiprid I 41 0.02 29 2 41
Acrinathrin I 15 0.01 15 0.2 15
Alanycarb I 4 0.01 4 2 4
Azoxystrobin F 5 0.01 4 0.05 5
Bifenthrin I 3 0.01 3 0.03 3
Bitertanol F 3 0.02 2 1.0 3
Boscalid F 15 0.02 13 0.2 15
Buprofezin I 32 0.05 32 1 32
Captan F 1 0.01 1 15 1
Chlorfenapyr I 1 0.02 1 0.05 1
Chlorothalonil F 14 0.01 13 2 14
Chlorpyrifos I 27 0.02 27 1.0 27
Clothianidin I 15 0.01 8 0.7 15
Cyanophos I 2 0.02 2 0.2 2
Cyenopyrafen I 2 0.01 2 0.1 2
Cyfluthrin I 3 0.05 3 1.0 3
Diazinon I 11 0.02 11 0.1 11
Diflubenzuron I 2 0.02 2 0.05 2
Dinotefuran I 15 0.005 8 3 15

54
Pesticide name Type* No of
samples LOQ
(mg/kg)
No of samples
below LOQ
Pesticide MRL
(mg/kg)
No of samples
below MRL
Etoxazole I 1 0.03 1 0.05 1
Fenarimol F 2 0.1 2 1.0 2
Fenitrothion I 10 0.02 10 0.2 10
Fenpropathrin I 8 0.02 8 1 8
Fenvalerate I 1 0.05 1 5.0 1
Flubendiamide I 17 0.01 17 0.05 17
Flufenoxuron I 13 0.02 13 0.1 13
Hexaconazole F 11 0.01 11 0.1 11
Imidacloprid I 9 0.02 7 0.5 9
Iprodione F 5 0.05 4 10 5
Kresoxim-methyl F 15 0.02 15 1 15
Malathion I 5 0.03 5 0.5 5
Methidathion I 10 0.02 10 0.2 10
Methomyl I 6 0.02 6 2 6
Oxolinic acid F 7 0.01 7 0.3 7
Permethriin I 14 0.02 14 2.0 14
Spinosad I 11 0.02 11 0.2 11
Tebuconazole F 28 0.05 28 1 28
Tebufenozide I 4 0.01 4 0.05 4
Teflubenzuron I 3 0.02 3 0.3 3
Thiacloprid I 24 0.03 21 1 24
Thiodicarb I 6 0.01 6 2 6
Tolfenpyrad I 3 0.02 3 0.2 3
Tralomethrin I 6 0.01 6 0.5 6
Trifloxystrobin F 1 0.02 1 0.2 1
Triflumizole F 3 0.05 3 2.0 3
*Type of pesticide; F: fungicide, H: herbicide, I: insecticide

55
3.1.4.4. Berries and other small fruits (Blueberry, Blackberry, Boysenberry)
Metals
Table 45 Analytical results of metals in berries and other small fruits (2013)
Chemical name
No of samples
LOQ (mg/kg)
No of samples
below LOQ
Minimum (mg/kg)
Maximum (mg/kg)
Mean (mg/kg)
Median (mg/kg)
Lead 5 0.01 5 - - 0.01 -
Cadmium 5 0.01 5 - - 0.01 -
Total mercury 5 0.01 5 - - 0.01 -
Total arsenic 5 0.01 5 - - 0.01 -
3.1.4.5. Tropical and subtropical fruits (Pineapple, Fig, Papaya, Mango)
Metals
Table 46 Analytical results of metals in tropical and subtropical fruits (2013)
Chemical name
No of samples
LOQ (mg/kg)
No of samples
below LOQ
Minimum (mg/kg)
Maximum (mg/kg)
Mean (mg/kg)
Median (mg/kg)
Lead 25 0.01 25 - - 0.01 -
Cadmium 25 0.01 25 - - 0.01 -
Total mercury 25 0.01 25 - - 0.01 -
Total arsenic 25 0.01 25 - - 0.01 -

56
3.1.5. Other agricultural products
3.1.5.1. Green tea (green leaves)
Dioxins
Table 47 Analytical results of dioxins in green tea (green leaves) (2013)
Food No of
samples
Dioxins concentration (pg-TEQ/g wet weight)
Minimum Maximum Value
Green tea (green leaves) 1 - - 0.011
Note: A dioxin concentration below the LOD was set equal to zero.

57
3.2. Livestock products
3.2.1. Cattle milk
Metals
Table 48 Analytical results of metals in cattle milk (2013)
Chemical name
No of samples
LOQ (mg/kg)
No of samples
below LOQ
Minimum (mg/kg)
Maximum (mg/kg)
Mean (mg/kg)
Median (mg/kg)
Lead 40 0.01 40 - - 0.01 -
Cadmium 40 0.01 40 - - 0.01 -
Total mercury 40 0.01 40 - - 0.01 -
Total arsenic 40 0.01 40 - - 0.01 -
Dioxins
Table 49 Analytical results of dioxins in cattle milk (2014)
Food No of
samples
Dioxins concentration (pg-TEQ/g)
Minimum Maximum Mean Median
Cattle milk 20 0.000030 0.046 0.0080 0.0019
Note: A dioxin concentration below the LOD was set equal to zero.
3.2.2. Beef, Pork, Chicken meat, Chicken egg
Dioxins
Table 50 Analytical results of dioxins in beef, pork, chicken meat and chicken egg (2014)
Food No of
samples
Dioxins concentration (pg-TEQ/g)
Minimum Maximum Mean Median
Beef 20 0.00041 1.1 0.20 0.15
Pork 20 0.000099 0.063 0.0057 0.00055
Chicken meat 20 0.0022 0.12 0.034 0.024
Chicken egg 20 0.00019 0.13 0.044 0.037
Note: A dioxin concentration below the LOD was set equal to zero.

58
3.3. Fishery products
3.3.1. Fishes
Dioxins
Table 51 Analytical results of dioxins in fishes (2013, 2014)
Food No of
samples
Dioxins concentration (pg-TEQ/g)
Minimum Maximum Mean Median
Tachiuo ‘hair tail (Trichiurus
lepturus)’ 30 0.24 3.3 0.83 0.48
Hokke ‘Atka mackerel
(Pleurogrammus azonus,
Hexagrammredae)’ 30 0.30 3.2 1.0 0.72
Buri ‘yellowtails (Seriola
quinqueradiata)’ (wild) 30 1.9 5.1 3.2 3.2
Buri ‘yellowtails (Seriola
quinqueradiata)’ (cultured) 30 1.2 4.7 2.8 2.8
Kanpachi ‘greater amberjack
(s. purpurascens)’ (cultured) 20 1.4 3.8 2.4 2.1
Masaba ‘common mackerel
(Scomber japonicus)’ 20 0.45 1.8 1.1 1.2
Note: A dioxin concentration below the LOQ was set equal to zero.
Hair tail and Atka mackerel and yellowtails (wild and cultured) were investigated
in 2013.
Greater amberjack (cultured) and common mackerel were investigated in 2014.

59
3.4. Processed and cooked products
3.4.1. Processed cereal-based products
3.4.1.1. Bread and bun
Acrylamide
Table 52 Analytical results of acrylamide in bread and bun (2013)
Food No of
samples LOQ
(mg/kg)
No of samples
below LOQ
Minimum (mg/kg)
Maximum (mg/kg)
Mean (mg/kg)
Median (mg/kg)
French bread 60 0.007 10 < 0.007 0.038 0.012 0.011
Soft roll 60 0.007 10 < 0.007 0.097 0.018 0.012
3.4.1.2. Yaki-fu and Age-fu ‘wheat gluten bread (baked, fried)’
Acrylamide
Table 53 Analytical results of acrylamide in Yaki-fu and Age-fu ‘wheat gluten bread (baked,
fried)’ (2014)
Chemical name
No of samples
LOQ (mg/kg)
No of samples
below LOQ
Minimum (mg/kg)
Maximum (mg/kg)
Mean (mg/kg)
Median (mg/kg)
Acrylamide 30 0.030 3 < 0.030 0.40 0.12 0.10

60
3.4.2. Processed potato-based products
3.4.2.1. French fries
Acrylamide
Table 54 Analytical results of acrylamide in french fries (2013)
Food No of
samples LOQ
(mg/kg)
No of samples
below LOQ
Minimum (mg/kg)
Maximum (mg/kg)
Mean (mg/kg)
Median (mg/kg)
French fries 120 0.03 0 0.04 1.1 0.27 0.18
Purchased in
July 60 0.03 0 0.04 1.1 0.29 0.20
Purchased in
October 60 0.03 0 0.04 0.89 0.25 0.16

61
3.4.3. Processed pulse-based products
Mycotoxins
Table 55 Analytical results of aflatoxins in roasted peanuts with shell and roasted peanuts
without shell (2014)
Chemical name
No of samples
LOQ (µg/kg)
No of samples
below LOQ
Minimum (µg/kg)
Maximum (µg/kg)
Mean (µg/kg)
Median (µg/kg)
Total aflatoxins* 94 - 94 - - 0 -
Aflatoxin B1 94 0.1 94 - - 0.1 -
Aflatoxin B2 94 0.1 94 - - 0.1 -
Aflatoxin G1 94 0.1 94 - - 0.1 -
Aflatoxin G2 94 0.1 94 - - 0.1 -
*An aflatoxin concentration below the LOQ was set equal to zero.
Table 56 Analytical results of aflatoxins in peanut butter (2014)
Chemical name
No of samples
LOQ (µg/kg)
No of samples
below LOQ
Minimum (µg/kg)
Maximum (µg/kg)
Mean (µg/kg)
Median (µg/kg)
Total aflatoxins* 11 - 9 0 0.2 0.027 -
Aflatoxin B1 11 0.1 9 < 0.1 0.2 0.1 -
Aflatoxin B2 11 0.1 11 - - 0.1 -
Aflatoxin G1 11 0.1 11 - - 0.1 -
Aflatoxin G2 11 0.1 11 - - 0.1 -
*An aflatoxin concentration below the LOQ was set equal to zero.

62
3.4.4. Uncentrifugal sugars
Mycotoxins
Table 57 Analytical results of aflatoxins in brown sugar (2014)
Chemical name No of
samples LOQ
(µg/kg)
No of samples
below LOQ
Minimum (µg/kg)
Maximum (µg/kg)
Mean (µg/kg)
Median (µg/kg)
Total aflatoxins* 87 - 10 0 2.5 0.31 0.24
Aflatoxin B1 87 0.04 10 < 0.04 2.1 0.28 0.24
Aflatoxin B2 87 0.04 58 < 0.04 0.23 0.05 -
Aflatoxin G1 87 0.04 83 < 0.04 0.22 0.04 -
Aflatoxin G2 87 0.05 87 - - 0.05 -
*An aflatoxin concentration below the LOQ was set equal to zero.
Table 58 Analytical results of aflatoxins in Wasanbonto (traditional non-centrifugal soft
white cane sugar) (2014)
Chemical name No of
samples LOQ
(µg/kg)
No of samples
below LOQ
Minimum (µg/kg)
Maximum (µg/kg)
Mean (µg/kg)
Median (µg/kg)
Total aflatoxins* 10 - 10 - - 0 -
Aflatoxin B1 10 0.04 10 - - 0.04 -
Aflatoxin B2 10 0.04 10 - - 0.04 -
Aflatoxin G1 10 0.04 10 - - 0.04 -
Aflatoxin G2 10 0.05 10 - - 0.05 -
*An aflatoxin concentration below the LOQ was set equal to zero.
Table 59 Analytical results of aflatoxins in Tomitsu ‘sugar syrup including molasses’ (2014)
Chemical name
No of samples
LOQ (µg/kg)
No of samples
below LOQ
Minimum (µg/kg)
Maximum (µg/kg)
Mean (µg/kg)
Median (µg/kg)
Total aflatoxins* 6 - 0 0.07 0.45 0.23 0.16
Aflatoxin B1 6 0.04 0 0.07 0.38 0.21 0.16
Aflatoxin B2 6 0.04 4 < 0.04 0.05 0.04 -
Aflatoxin G1 6 0.04 5 < 0.04 0.04 0.04 -
Aflatoxin G2 6 0.05 6 - - 0.05 -
*An aflatoxin concentration below the LOQ was set equal to zero.

63
Acrylamide
Table 60 Analytical results of acrylamide in uncentrifugal sugar (2013)
Food No of
samples LOQ
(mg/kg)
No of samples
below LOQ
Minimum (mg/kg)
Maximum (mg/kg)
Mean (mg/kg)
Median (mg/kg)
Uncentrifugal
sugar 108 0.007 0 0.04 0.80 0.31 0.29

64
3.4.5. Processed nut-based products
Acrylamide
Table 61 Analytical results of acrylamide in processed nut-based products (2014)
Chemical name
No of samples
LOQ (mg/kg)
No of samples
below LOQ
Minimum (mg/kg)
Maximum (mg/kg)
Mean (mg/kg)
Median (mg/kg)
Acrylamide 122 0.030 54 < 0.030 4.7 0.16 0.034

65
3.4.6. Processed fruit-based products
3.4.6.1. Canned fruits
Metals
Table 62 Analytical results of lead in canned fruits (2013)
Chemical name
No of samples
LOQ (mg/kg)
No of samples
below LOQ
Minimum (mg/kg)
Maximum (mg/kg)
Mean (mg/kg)
Median (mg/kg)
Lead 103 0.01 14 < 0.01 0.19 0.06 0.03

66
3.4.7. Processed and cooked seaweed-based products
3.4.7.1. Ready-to-eat hijiki-based products
Arsenic
Table 63 Analytical results of total arsenic in ready-to-eat hijiki-based products (2014)
Food No of
samples LOQ
(mg/kg)
No of samples
below LOQ
Minimum (mg/kg)
Maximum (mg/kg)
Mean (mg/kg)
Median (mg/kg)
Ready-to-eat
hijiki-based
products sold in
sealed bag
50
(16)
(22)
(< 16)
31
(140)
8.2
(29)
3.4
(17)
Ready-to-eat
hijiki-based dishes 50
(16)
(20)
(< 16)
12
(154)
4.3
(36)
3.5
(27)
Ready-to-eat
hijiki-based
products for care
food
5
(16)
(5) - -
3.2
(16) -
Hijiki powder
products 5
16
0
55
156
115
112
Note: Concentrations on a dry weight basis (weight of freeze dried sample) are in the
bracket. Hijiki powder products were not freeze dried.
Table 64 Analytical results of inorganic arsenic in ready-to-eat hijiki-based products (2014)
Food No of
samples LOQ
(mg/kg)
No of samples
below LOQ
Minimum (mg/kg)
Maximum (mg/kg)
Mean (mg/kg)
Median (mg/kg)
Ready-to-eat
hijiki-based
products sold in
sealed bag
50
(0.3)
(1)
(< 0.3)
16
(74)
4.7
(15)
4.6
(9.7)
Ready-to-eat
hijiki-based dishes 50
(0.3)
(0)
0.52
(2.7)
4.7
(49)
1.9
(14)
1.7
(9.3)
Ready-to-eat
hijiki-based
products for care
food
5
(0.3)
(0)
0.4
(2.5)
1.4
(4.1)
0.7
(3.3)
0.68
(3.6)
Hijiki powder
products 5 0.3 0 14 87 61 61
Note: Concentrations on a dry weight basis (weight of freeze dried sample) are in the
bracket. Hijiki powder products were not freeze dried.

67
3.4.8. Processed and cooked fish-based products
Polycyclic aromatic hydrocarbons (PAHs)
Table 65 Names and abbreviations of the target PAHs
Name Abbreviation
benz[a]anthracene BaA
benzo[c]fluorene BcFL
benzo[c]fluorene BbFA
benzo[j]fluoranthene BjFA
benzo[k]fluoranthene BkFA
benzo[ghi]perylene BghiP
benzo[a]pyrene BaP
chrysene CHR
cyclopenta[cd]pyrene CPP
dibenz[a,h]anthracene DBahA
dibenzo[a,e]pyrene DBaeP
dibenzo[a,h]pyrene DBahP
dibenzo[a,i]pyrene DBaiP
dibenzo[a,l]pyrene DBalP
indeno[1,2,3-cd]pyrene IP
5-methylchrysene MCH

68
Table 66 Analytical results of PAHs in processed fishery products25 with direct fire cooking
(2013)
Chemical name
No of samples
LOQ (μg/kg)
No of samples
below LOQ
Minimum (μg/kg)
Maximum (μg/kg)
Mean (μg/kg)
Median (μg/kg)
BaA 30 0.1 8 < 0.1 2.4 0.4 0.2
BcFL 30 1 30 - - 1 -
BbFA 30 0.1 16 < 0.1 0.8 0.2 -
BjFA 30 0.3 20 < 0.3 3.2 0.7 -
BkFA 30 0.3 28 < 0.3 0.4 0.3 -
BghiP 30 0.1 9 < 0.1 3.1 0.8 0.2
BaP 30 0.1 19 < 0.1 1.0 0.2 -
CHR 30 0.1 10 < 0.1 2.7 0.6 0.4
CPP 30 2 26 < 2 6 2 -
DBahA 30 0.1 14 < 0.1 1.0 0.2 0.1
DBaeP 30 0.1 20 < 0.1 0.8 0.2 -
DBahP 30 0.2 29 < 0.2 0.3 0.2 -
DBaiP 30 0.1 24 < 0.1 0.1 0.1 -
DBalP 30 0.1 18 < 0.1 0.5 0.1 -
IP 30 0.2 17 < 0.2 4.9 0.7 -
MCH 30 0.1 20 < 0.1 1.0 0.2 -
Table 67 Analytical results of PAHs in steamed fish (2013)
Chemical name
No of samples
LOQ (μg/kg)
No of samples
below LOQ
Minimum (μg/kg)
Maximum (μg/kg)
Mean (μg/kg)
Median (μg/kg)
BaA 3 0.1 3 - - 0.1 -
BcFL 3 1 3 - - 1 -
BbFA 3 0.1 3 - - 0.1 -
BjFA 3 0.3 3 - - 0.3 -
BkFA 3 0.3 3 - - 0.3 -
BghiP 3 0.1 1 < 0.1 0.7 0.4 0.6
BaP 3 0.1 3 - - 0.1 -
CHR 3 0.1 3 - - 0.1 -
CPP 3 2 3 - - 2 -
DBahA 3 0.1 2 < 0.1 0.2 0.1 -
DBaeP 3 0.1 3 - - 0.1 -
DBahP 3 0.2 3 - - 0.2 -
25 E.g. Sanma shioyaki ‘Salted and grilled Pacific saury’, Unagi Kabayaki ‘eel (seasoned
and grilled fillet)’, Grilled squids (whole)

69
DBaiP 3 0.1 3 - - 0.1 -
DBalP 3 0.1 1 < 0.1 0.3 0.2 0.2
IP 3 0.2 2 < 0.2 0.3 0.2 -
MCH 3 0.1 3 - - 0.1 -
Subtable 1 Analytical results of PAHs in edible charcoal used as food additives (2013)
Chemical name
No of samples
LOQ (μg/kg)
No of samples
below LOQ
Minimum (μg/kg)
Maximum (μg/kg)
Mean (μg/kg)
Median (μg/kg)
BaA 3 0.1 1 < 0.1 1.4 0.6 0.2
BcFL 3 1 3 - - 1 -
BbFA 3 0.1 2 < 0.1 0.2 0.1 -
BjFA 3 0.3 2 < 0.3 0.7 0.4 -
BkFA 3 0.3 3 - - 0.3 -
BghiP 3 0.1 2 < 0.1 0.5 0.2 -
BaP 3 0.1 2 < 0.1 0.4 0.2 -
CHR 3 0.1 2 < 0.1 0.7 0.3 -
CPP 3 2 3 - - 2 -
DBahA 3 0.1 2 < 0.1 0.2 0.1 -
DBaeP 3 0.1 3 - - 0.1 -
DBahP 3 0.2 3 - - 0.2 -
DBaiP 3 0.1 3 - - 0.1 -
DBalP 3 0.1 3 - - 0.1 -
IP 3 0.2 3 - - 0.2 -
MCH 3 0.1 2 < 0.1 1.3 0.5 -

70
3.4.9. Processed and cooked meat-based products
Polycyclic aromatic hydrocarbons (PAHs)
Table 68 Analytical results of PAHs in Yakitori ‘grilled chicken’ (2013)
Chemical name
No of samples
LOQ (μg/kg)
No of samples
below LOQ
Minimum (μg/kg)
Maximum (μg/kg)
Mean (μg/kg)
Median (μg/kg)
BaA 29 0.1 6 < 0.1 12 2.7 0.9
BcFL 29 0.1 12 < 0.1 2.1 0.4 0.2
BbFA 29 0.1 6 < 0.1 6.5 1.6 0.6
BjFA 29 0.1 9 < 0.1 6.2 1.1 0.5
BkFA 29 0.1 10 < 0.1 3.8 0.7 0.3
BghiP 29 0.1 5 < 0.1 12 1.7 0.5
BaP 29 0.1 7 < 0.1 12 2.4 1.1
CHR 29 0.1 6 < 0.1 11 2.4 0.7
CPP 29 0.1 4 < 0.1 65 8.1 2.0
DBahA 29 0.1 21 < 0.1 0.4 0.1 -
DBaeP 29 0.1 21 < 0.1 0.4 0.1 -
DBahP 29 0.1 27 < 0.1 0.2 0.1 -
DBaiP 29 0.1 24 < 0.1 0.3 0.1 -
DBalP 29 0.1 22 < 0.1 0.4 0.1 -
IP 29 0.1 8 < 0.1 9.6 1.3 0.4
MCH 29 0.1 29 - - 0.1 -
Table 69 Analytical results of PAHs in processed chicken meat products with direct fire
cooking, whose surface color is light gray (2013)
Chemical name
No of samples
LOQ (μg/kg)
No of samples
below LOQ
Minimum (μg/kg)
Maximum (μg/kg)
Mean (μg/kg)
Median (μg/kg)
BaA 30 0.1 0 1.2 400 88 62
BcFL 30 0.1 0 0.2 59 16 11
BbFA 30 0.1 0 0.9 200 49 38
BjFA 30 0.1 0 0.7 190 44 34
BkFA 30 0.1 0 0.4 120 29 22
BghiP 30 0.1 0 0.9 280 69 55
BaP 30 0.1 0 1.3 480 110 80
CHR 30 0.1 0 1.6 330 80 58
CPP 30 0.1 0 3.9 1500 400 340
DBahA 30 0.1 1 < 0.1 19 4.4 3.
0 DBaeP 30 0.1 1 < 0.1 17 4.9 3.
6 DBahP 30 0.1 2 < 0.1 2.9 1.1
0.8 DBaiP 30 0.1 2 < 0.1 6.0 1.9 1.
4

71
DBalP 30 0.1 1 < 0.1 15 3.7 2.
8 IP 30 0.1 0 0.7 310 60 40
MCH 30 0.1 12 < 0.1 1.1 0.2 0.
1
Table 70 Analytical results of PAHs in processed beef and pork products with direct fire cooking
(2013)
Chemical name
No of samples
LOQ (μg/kg)
No of samples
below LOQ
Minimum (μg/kg)
Maximum (μg/kg)
Mean (μg/kg)
Median (μg/kg)
BaA 40 0.1 15 < 0.1 14 2.2 0.3
BcFL 40 1 40 - - 1 -
BbFA 40 0.1 18 < 0.1 9.5 1.3 0.2
BjFA 40 0.3 19 < 0.3 15 1.9 0.4
BkFA 40 0.3 25 < 0.3 4.4 0.7 -
BghiP 40 0.1 15 < 0.1 18 2.3 0.2
BaP 40 0.1 18 < 0.1 18 2.2 0.1
CHR 40 0.1 15 < 0.1 10 1.7 0.4
CPP 40 2 22 < 2 67 10 -
DBahA 40 0.1 20 < 0.1 15 1.9 -
DBaeP 40 0.1 23 < 0.1 1.4 0.2 -
DBahP 40 0.2 37 < 0.2 0.9 0.2 -
DBaiP 40 0.1 32 < 0.1 0.9 0.1 -
DBalP 40 0.1 35 < 0.1 0.2 0.1 -
IP 40 0.2 20 < 0.2 21 2.6 -
MCH 40 0.1 21 < 0.1 3.2 0.3 -
Table 71 Analytical results of PAHs in steamed chicken (2013)
Chemical name
No of samples
LOQ (μg/kg)
No of samples
below LOQ
Minimum (μg/kg)
Maximum (μg/kg)
Mean (μg/kg)
Median (μg/kg)
BaA 3 0.1 3 - - 0.1 -
BcFL 3 0.1 3 - - 0.1 -
BbFA 3 0.1 3 - - 0.1 -
BjFA 3 0.1 3 - - 0.1 -
BkFA 3 0.1 3 - - 0.1 -
BghiP 3 0.1 3 - - 0.1 -
BaP 3 0.1 3 - - 0.1 -
CHR 3 0.1 3 - - 0.1 -
CPP 3 0.1 3 - - 0.1 -
DBahA 3 0.1 3 - - 0.1 -
DBaeP 3 0.1 3 - - 0.1 -

72
DBahP 3 0.1 3 - - 0.1 -
DBaiP 3 0.1 3 - - 0.1 -
DBalP 3 0.1 3 - - 0.1 -
IP 3 0.1 3 - - 0.1 -
MCH 3 0.1 3 - - 0.1 -
Table 72 Analytical results of PAHs in steamed beef and pork (2013)
Chemical name
No of samples
LOQ (μg/kg)
No of samples
below LOQ
Minimum (μg/kg)
Maximum (μg/kg)
Mean (μg/kg)
Median (μg/kg)
BaA 6 0.1 6 - - 0.1 -
BcFL 6 1 6 - - 1 -
BbFA 6 0.1 6 - - 0.1 -
BjFA 6 0.3 6 - - 0.3 -
BkFA 6 0.3 6 - - 0.3 -
BghiP 6 0.1 5 < 0.1 1.2 0.3 -
BaP 6 0.1 6 - - 0.1 -
CHR 6 0.1 6 - - 0.1 -
CPP 6 2 6 - - 2 -
DBahA 6 0.1 5 < 0.1 0.1 0.1 -
DBaeP 6 0.1 6 - - 0.1 -
DBahP 6 0.2 6 - - 0.2 -
DBaiP 6 0.1 6 - - 0.1 -
DBalP 6 0.1 5 < 0.1 0.5 0.2 -
IP 6 0.2 5 < 0.2 0.6 0.3 -
MCH 6 0.1 6 - - 0.1 -

73
3.4.10. Dairy products
Metals
Table 73 Analytical results of metals in dairy products26 (2013)
Chemical name
No of samples
LOQ (mg/kg)
No of samples
below LOQ
Minimum (mg/kg)
Maximum (mg/kg)
Mean (mg/kg)
Median (mg/kg)
Lead 40 0.01 39 < 0.01 0.01 0.01 -
Cadmium 40 0.01 40 - - 0.01 -
Total mercury 40 0.01 40 - - 0.01 -
Total arsenic 40 0.01 40 - - 0.01 -
3-MCPD fatty acid esters
Table 74 Analytical results of 3-MCPD fatty acid esters in butter (2013: per food weight)
Food No of
samples Minimum (mg/kg)
Maximum (mg/kg)
Mean (mg/kg)
Median (mg/kg)
Butter 5 - - 0.02 -
Subtable 2 Analytical results of 3-MCPD fatty acid esters in butter (2013: per fat weight)
Food No of
samples LOQ
(mg/kg)
No of samples
below LOQ
Minimum (mg/kg)
Maximum (mg/kg)
Mean (mg/kg)
Median (mg/kg)
Butter 5 0.08 5 - - 0.02 -
Note: The LOD was 0.04 mg/kg.
Table 75 Analytical results of 3-MCPD fatty acid esters in butter (2014: per food weight)
Food No of
samples Minimum (mg/kg)
Maximum (mg/kg)
Mean (mg/kg)
Median (mg/kg)
Butter 20 - - 0.02 -
26 Butter, Cheese, Cream, Other dairy products

74
Subtable 3 Analytical results of 3-MCPD fatty acid esters in butter
(2014: per fat weight)
Food No of
samples LOQ
(mg/kg)
No of samples
below LOQ
Minimum (mg/kg)
Maximum (mg/kg)
Mean (mg/kg)
Median (mg/kg)
Butter 20 0.08 20 - - 0.03 -
Note: The LOD was 0.04 mg/kg.
Glycidyl fatty acid esters
Table 76 Analytical results of glycidyl fatty acid esters in butter with the indirect method
(2013: per food weight)
Food No of
samples Minimum (mg/kg)
Maximum (mg/kg)
Mean (mg/kg)
Median (mg/kg)
Butter 5 - - 0.01 -
Subtable 4 Analytical results of glycidyl fatty acid esters in butter with the indirect method
(2013: per fat weight)
Food No of
samples LOQ
(mg/kg)
No of samples
below LOQ
Minimum (mg/kg)
Maximum (mg/kg)
Mean (mg/kg)
Median (mg/kg)
Butter 5 0.06 5 - - 0.02 -
Note: The LOD was 0.03 mg/kg.
Table 77 Analytical results of glycidyl fatty acid esters (as glycidol equivalent) in butter with
the direct method (2013: per food weight)
Food No of
samples
Minimum (mg/kg)
(UB)*
Maximum (mg/kg)
(UB)*
Mean (mg/kg)
(LB)
Mean (mg/kg)
(UB)
Butter 5 0.04 0.04 0 0.04
Subtable 5 Analytical results of five types of glycidyl fatty acid esters in butter with the direct
method (2013: per fat weight (sum of glycidol equivalent))
Food No of
samples
Minimum (mg/kg)
(UB)*
Maximum (mg/kg)
(UB)*
Mean (mg/kg)
(LB)
Mean (mg/kg)
(UB)
Butter 5 0.04 0.04 0 0.04
*Minimum (UB) and maximum (UB) were calculated by setting the concentration below
the LOD equal to the LOD and the concentration between the LOD and the LOQ equal to
the LOQ.

75
Subtable 5-1 Analytical results of five types of glycidyl fatty acid esters in butter with the
direct method (2013: per fat weight)
Chemical name No of
samples LOQ
(mg/kg)
No of samples
below LOQ
Minimum (mg/kg)
Maximum (mg/kg)
Mean (mg/kg)
(UB)
Median (mg/kg)
Glycidyl palmitate 5 0.10 5 - - 0.04 -
Glycidyl linolenate 5 0.10 5 - - 0.04 -
Glycidyl linoleate 5 0.10 5 - - 0.04 -
Glycidyl oleate 5 0.10 5 - - 0.04 -
Glycidyl stearate 5 0.10 5 - - 0.04 -
Note: The LOD was 0.04 mg/kg.
Table 78 Analytical results of glycidyl fatty acid esters in butter with the indirect method
(2014: per food weight)
Food No of
samples Minimum (mg/kg)
Maximum (mg/kg)
Mean (mg/kg)
Median (mg/kg)
Butter 20 - - 0.02 -
Subtable 6 Analytical results of glycidyl fatty acid esters in butter with the indirect method
(2014: per fat weight)
Food No of
samples LOQ
(mg/kg)
No of samples
below LOQ
Minimum (mg/kg)
Maximum (mg/kg)
Mean (mg/kg)
Median (mg/kg)
Butter 20 0.06 20 - - 0.02 -
Note: The LOD was 0.04 mg/kg.
Table 79 Analytical results of glycidyl fatty acid esters (as glycidol equivalent) in butter with
the direct method (2014: per food weight)
Food No of
samples
Minimum (mg/kg)
(UB)*
Maximum (mg/kg)
(UB)*
Mean (mg/kg)
(LB)
Mean (mg/kg)
(UB)
Butter 20 0.03 0.03 0 0.03
Subtable 7 Analytical results of five types of glycidyl fatty acid esters in butter with the
direct method (2014: per fat weight (sum of glycidol equivalent))
Food No of
samples
Minimum (mg/kg)
(UB)*
Maximum (mg/kg)
(UB)*
Mean (mg/kg)
(LB)
Mean (mg/kg)
(UB)
Butter 20 0.03 0.03 0 0.03

76
*Minimum (UB) and maximum (UB) were calculated by setting the concentration below
the LOD equal to the LOD and the concentration between the LOD and the LOQ equal to
the LOQ.
Subtable 7-1 Analytical results of five types of glycidyl fatty acid esters in butter with the direct
method (2014: per fat weight)
Chemical name No of
samples LOQ
(mg/kg)
No of samples
below LOQ
Minimum (mg/kg)
Maximum (mg/kg)
Mean (mg/kg)
(UB)
Median (mg/kg)
Glycidyl palmitate 20 0.10 20 - - 0.03 -
Glycidyl linolenate 20 0.10 20 - - 0.03 -
Glycidyl linoleate 20 0.10 20 - - 0.03 -
Glycidyl oleate 20 0.10 20 - - 0.03 -
Glycidyl stearate 20 0.10 20 - - 0.03 -
Note: The LOD was 0.03 mg/kg.

77
3.4.11. Oils and fats
3.4.11.1. Edible vegetable oils and fats
Polycyclic aromatic hydrocarbons (PAHs)
Table 80 Analytical results of PAHs in edible vegetable oils and fats (2014)
Chemical name
No of samples
LOQ (μg/kg)
No of samples
below LOQ
Minimum (μg/kg)
Maximum (μg/kg)
Mean (μg/kg)
Median (μg/kg)
BaA 112 0.3 69 < 0.3 4.5 0.5 -
BcFL 112 0.5 101 < 0.5 2.6 0.6 -
BbFA 112 0.3 73 < 0.3 5.6 0.6 -
BjFA 112 0.2 63 < 0.2 2.5 0.3 -
BkFA 112 0.3 95 < 0.3 1.9 0.4 -
BghiP 112 0.2 53 < 0.2 3.3 0.4 0.2
BaP 112 0.3 75 < 0.3 4.5 0.5 -
CHR 112 0.3 35 < 0.3 15 1.1 0.4
CPP 112 0.3 107 < 0.3 1.0 0.3 -
DBahA 112 0.3 104 < 0.3 0.7 0.3 -
DBaeP 112 0.3 109 < 0.3 0.5 0.3 -
DBahP 112 0.3 112 - - 0.3 -
DBaiP 112 0.3 105 < 0.3 0.6 0.3 -
DBalP 112 0.3 106 < 0.3 0.7 0.3 -
IP 112 0.2 74 < 0.2 2.7 0.4 -
MCH 112 0.3 112 - - 0.3 -

78
Subtable 8 Analytical results of PAHs in linseed oil (2014)
Chemical name
No of samples
LOQ (μg/kg)
No of samples
below LOQ
Minimum (μg/kg)
Maximum (μg/kg)
Mean (μg/kg)
Median (μg/kg)
BaA 7 0.3 7 - - 0.3 -
BcFL 7 0.5 7 - - 0.5 -
BbFA 7 0.3 7 - - 0.3 -
BjFA 7 0.2 6 < 0.2 0.2 0.2 -
BkFA 7 0.3 7 - - 0.3 -
BghiP 7 0.2 6 < 0.2 0.2 0.2 -
BaP 7 0.3 7 - - 0.3 -
CHR 7 0.3 5 < 0.3 0.4 0.3 -
CPP 7 0.3 7 - - 0.3 -
DBahA 7 0.3 7 - - 0.3 -
DBaeP 7 0.3 7 - - 0.3 -
DBahP 7 0.3 7 - - 0.3 -
DBaiP 7 0.3 7 - - 0.3 -
DBalP 7 0.3 7 - - 0.3 -
IP 7 0.2 7 - - 0.2 -
MCH 7 0.3 7 - - 0.3 -
Subtable 9 Analytical results of PAHs in perilla oil (2014)
Chemical name
No of samples
LOQ (μg/kg)
No of samples
below LOQ
Minimum (μg/kg)
Maximum (μg/kg)
Mean (μg/kg)
Median (μg/kg)
BaA 8 0.3 3 < 0.3 4.5 1.8 1.0
BcFL 8 0.5 3 < 0.5 2.6 1.1 1.0
BbFA 8 0.3 3 < 0.3 5.6 2.0 1.2
BjFA 8 0.2 2 < 0.2 2.5 0.9 0.6
BkFA 8 0.3 3 < 0.3 1.9 0.8 0.4
BghiP 8 0.2 1 < 0.2 3.2 1.3 0.7
BaP 8 0.3 3 < 0.3 4.5 1.6 0.6
CHR 8 0.3 0 0.4 15 6.5 5.0
CPP 8 0.3 8 - - 0.3 -
DBahA 8 0.3 5 < 0.3 0.7 0.4 -
DBaeP 8 0.3 6 < 0.3 0.5 0.3 -
DBahP 8 0.3 8 - - 0.3 -
DBaiP 8 0.3 5 < 0.3 0.6 0.4 -
DBalP 8 0.3 5 < 0.3 0.7 0.4 -
IP 8 0.2 3 < 0.2 2.7 1.1 0.6
MCH 8 0.3 8 - - 0.3 -

79
Subtable 10 Analytical results of PAHs in olive oil (2014)
Chemical name
No of samples
LOQ (μg/kg)
No of samples
below LOQ
Minimum (μg/kg)
Maximum (μg/kg)
Mean (μg/kg)
Median (μg/kg)
BaA 8 0.3 3 < 0.3 0.4 0.3 0.4
BcFL 8 0.5 7 < 0.5 0.5 0.5 -
BbFA 8 0.3 8 - - 0.3 -
BjFA 8 0.2 4 < 0.2 0.2 0.2 -
BkFA 8 0.3 8 - - 0.3 -
BghiP 8 0.2 6 < 0.2 0.3 0.2 -
BaP 8 0.3 7 < 0.3 0.3 0.3 -
CHR 8 0.3 1 < 0.3 2.7 1.1 0.8
CPP 8 0.3 8 - - 0.3 -
DBahA 8 0.3 8 - - 0.3 -
DBaeP 8 0.3 8 - - 0.3 -
DBahP 8 0.3 8 - - 0.3 -
DBaiP 8 0.3 8 - - 0.3 -
DBalP 8 0.3 8 - - 0.3 -
IP 8 0.2 8 - - 0.2 -
MCH 8 0.3 8 - - 0.3 -
Subtable 11 Analytical results of PAHs in mustard seed oil (2014)
Chemical name
No of samples
LOQ (μg/kg)
No of samples
below LOQ
Minimum (μg/kg)
Maximum (μg/kg)
Mean (μg/kg)
Median (μg/kg)
BaA 2 0.3 1 < 0.3 0.4 0.3 -
BcFL 2 0.5 1 < 0.5 1.5 0.9 -
BbFA 2 0.3 1 < 0.3 0.5 0.3 -
BjFA 2 0.2 1 < 0.2 0.2 0.2 -
BkFA 2 0.3 2 - - 0.3 -
BghiP 2 0.2 1 < 0.2 0.4 0.2 -
BaP 2 0.3 1 < 0.3 0.4 0.3 -
CHR 2 0.3 1 < 0.3 1.9 1.0 -
CPP 2 0.3 2 - - 0.3 -
DBahA 2 0.3 2 - - 0.3 -
DBaeP 2 0.3 2 - - 0.3 -
DBahP 2 0.3 2 - - 0.3 -
DBaiP 2 0.3 2 - - 0.3 -
DBalP 2 0.3 2 - - 0.3 -
IP 2 0.2 1 < 0.2 0.2 0.2 -
MCH 2 0.3 2 - - 0.3 -

80
Subtable 12 Analytical results of PAHs in sesame oil (2014)
Chemical name
No of samples
LOQ (μg/kg)
No of samples
below LOQ
Minimum (μg/kg)
Maximum (μg/kg)
Mean (μg/kg)
Median (μg/kg)
BaA 23 0.3 9 < 0.3 3.1 0.6 0.3
BcFL 23 0.5 21 < 0.5 0.7 0.5 -
BbFA 23 0.3 13 < 0.3 2.9 0.7 -
BjFA 23 0.2 10 < 0.2 2.5 0.5 0.2
BkFA 23 0.3 16 < 0.3 1.5 0.5 -
BghiP 23 0.2 9 < 0.2 2.1 0.5 0.2
BaP 23 0.3 13 < 0.3 2.7 0.6 -
CHR 23 0.3 2 < 0.3 4.1 1.1 0.5
CPP 23 0.3 23 - - 0.3 -
DBahA 23 0.3 19 < 0.3 0.4 0.3 -
DBaeP 23 0.3 22 < 0.3 0.3 0.3 -
DBahP 23 0.3 23 - - 0.3 -
DBaiP 23 0.3 20 < 0.3 0.4 0.3 -
DBalP 23 0.3 20 < 0.3 0.4 0.3 -
IP 23 0.2 13 < 0.2 2.2 0.4 -
MCH 23 0.3 23 - - 0.3 -
Subtable 13 Analytical results of PAHs in rice-bran oil (2014)
Chemical name
No of samples
LOQ (μg/kg)
No of samples
below LOQ
Minimum (μg/kg)
Maximum (μg/kg)
Mean (μg/kg)
Median (μg/kg)
BaA 8 0.3 5 < 0.3 1.1 0.4 -
BcFL 8 0.5 8 - - 0.5 -
BbFA 8 0.3 0 0.3 1.8 0.5 0.4
BjFA 8 0.2 0 0.2 1.1 0.3 0.2
BkFA 8 0.3 7 < 0.3 0.8 0.4 -
BghiP 8 0.2 0 0.5 3.3 0.9 0.6
BaP 8 0.3 3 < 0.3 1.9 0.5 0.3
CHR 8 0.3 0 0.3 1.5 0.7 0.6
CPP 8 0.3 8 - - 0.3 -
DBahA 8 0.3 7 < 0.3 0.4 0.3 -
DBaeP 8 0.3 8 - - 0.3 -
DBahP 8 0.3 8 - - 0.3 -
DBaiP 8 0.3 7 < 0.3 0.4 0.3 -
DBalP 8 0.3 8 - - 0.3 -
IP 8 0.2 0 0.2 1.5 0.4 0.3
MCH 8 0.3 8 - - 0.3 -

81
Subtable 14 Analytical results of PAHs in safflower oil (2014)
Chemical name
No of samples
LOQ (μg/kg)
No of samples
below LOQ
Minimum (μg/kg)
Maximum (μg/kg)
Mean (μg/kg)
Median (μg/kg)
BaA 6 0.3 6 - - 0.3 -
BcFL 6 0.5 6 - - 0.5 -
BbFA 6 0.3 6 - - 0.3 -
BjFA 6 0.2 6 - - 0.2 -
BkFA 6 0.3 6 - - 0.3 -
BghiP 6 0.2 4 < 0.2 0.3 0.2 -
BaP 6 0.3 6 - - 0.3 -
CHR 6 0.3 5 < 0.3 0.3 0.3 -
CPP 6 0.3 6 - - 0.3 -
DBahA 6 0.3 6 - - 0.3 -
DBaeP 6 0.3 6 - - 0.3 -
DBahP 6 0.3 6 - - 0.3 -
DBaiP 6 0.3 6 - - 0.3 -
DBalP 6 0.3 6 - - 0.3 -
IP 6 0.2 6 - - 0.2 -
MCH 6 0.3 6 - - 0.3 -
Subtable 15 Analytical results of PAHs in soybean oil (2014)
Chemical name
No of samples
LOQ (μg/kg)
No of samples
below LOQ
Minimum (μg/kg)
Maximum (μg/kg)
Mean (μg/kg)
Median (μg/kg)
BaA 8 0.3 7 < 0.3 1.1 0.4 -
BcFL 8 0.5 8 - - 0.5 -
BbFA 8 0.3 7 < 0.3 1.1 0.4 -
BjFA 8 0.2 6 < 0.2 0.5 0.3 -
BkFA 8 0.3 7 < 0.3 0.4 0.3 -
BghiP 8 0.2 4 < 0.2 0.7 0.2 -
BaP 8 0.3 6 < 0.3 0.9 0.4 -
CHR 8 0.3 4 < 0.3 1.8 0.5 -
CPP 8 0.3 8 - - 0.3 -
DBahA 8 0.3 8 - - 0.3 -
DBaeP 8 0.3 8 - - 0.3 -
DBahP 8 0.3 8 - - 0.3 -
DBaiP 8 0.3 8 - - 0.3 -
DBalP 8 0.3 8 - - 0.3 -
IP 8 0.2 6 < 0.2 0.6 0.2 -
MCH 8 0.3 8 - - 0.3 -

82
Subtable 16 Analytical results of PAHs in corn oil/maize oil (2014)
Chemical name
No of samples
LOQ (μg/kg)
No of samples
below LOQ
Minimum (μg/kg)
Maximum (μg/kg)
Mean (μg/kg)
Median (μg/kg)
BaA 8 0.3 7 < 0.3 0.3 0.3 -
BcFL 8 0.5 8 - - 0.5 -
BbFA 8 0.3 7 < 0.3 0.3 0.3 -
BjFA 8 0.2 7 < 0.2 0.2 0.2 -
BkFA 8 0.3 8 - - 0.3 -
BghiP 8 0.2 7 < 0.2 0.2 0.2 -
BaP 8 0.3 8 - - 0.3 -
CHR 8 0.3 6 < 0.3 0.4 0.3 -
CPP 8 0.3 8 - - 0.3 -
DBahA 8 0.3 8 - - 0.3 -
DBaeP 8 0.3 8 - - 0.3 -
DBahP 8 0.3 8 - - 0.3 -
DBaiP 8 0.3 8 - - 0.3 -
DBalP 8 0.3 8 - - 0.3 -
IP 8 0.2 8 - - 0.2 -
MCH 8 0.3 8 - - 0.3 -
Subtable 17 Analytical results of PAHs in rapeseed oil/colza oil (2014)
Chemical name
No of samples
LOQ (μg/kg)
No of samples
below LOQ
Minimum (μg/kg)
Maximum (μg/kg)
Mean (μg/kg)
Median (μg/kg)
BaA 8 0.3 6 < 0.3 0.8 0.4 -
BcFL 8 0.5 7 < 0.5 0.5 0.5 -
BbFA 8 0.3 6 < 0.3 0.6 0.3 -
BjFA 8 0.2 6 < 0.2 0.5 0.2 -
BkFA 8 0.3 7 < 0.3 0.3 0.3 -
BghiP 8 0.2 3 < 0.2 1.0 0.3 0.2
BaP 8 0.3 7 < 0.3 0.8 0.4 -
CHR 8 0.3 3 < 0.3 1.2 0.4 0.4
CPP 8 0.3 7 < 0.3 0.5 0.3 -
DBahA 8 0.3 8 - - 0.3 -
DBaeP 8 0.3 8 - - 0.3 -
DBahP 8 0.3 8 - - 0.3 -
DBaiP 8 0.3 8 - - 0.3 -
DBalP 8 0.3 8 - - 0.3 -
IP 8 0.2 7 < 0.2 0.6 0.2 -
MCH 8 0.3 8 - - 0.3 -

83
Subtable 18 Analytical results of PAHs in sunflower oil (2014)
Chemical name
No of samples
LOQ (μg/kg)
No of samples
below LOQ
Minimum (μg/kg)
Maximum (μg/kg)
Mean (μg/kg)
Median (μg/kg)
BaA 8 0.3 4 < 0.3 0.7 0.3 -
BcFL 8 0.5 8 - - 0.5 -
BbFA 8 0.3 4 < 0.3 0.9 0.3 -
BjFA 8 0.2 5 < 0.2 0.6 0.3 -
BkFA 8 0.3 7 < 0.3 0.3 0.3 -
BghiP 8 0.2 4 < 0.2 0.6 0.2 -
BaP 8 0.3 5 < 0.3 0.7 0.4 -
CHR 8 0.3 3 < 0.3 1.2 0.5 0.4
CPP 8 0.3 6 < 0.3 0.7 0.4 -
DBahA 8 0.3 8 - - 0.3 -
DBaeP 8 0.3 8 - - 0.3 -
DBahP 8 0.3 8 - - 0.3 -
DBaiP 8 0.3 8 - - 0.3 -
DBalP 8 0.3 8 - - 0.3 -
IP 8 0.2 5 < 0.2 0.3 0.2 -
MCH 8 0.3 8 - - 0.3 -
Subtable 19 Analytical results of PAHs in grape seed oil (2014)
Chemical name
No of samples
LOQ (μg/kg)
No of samples
below LOQ
Minimum (μg/kg)
Maximum (μg/kg)
Mean (μg/kg)
Median (μg/kg)
BaA 8 0.3 6 < 0.3 0.6 0.4 -
BcFL 8 0.5 7 < 0.5 1.4 0.6 -
BbFA 8 0.3 5 < 0.3 0.3 0.3 -
BjFA 8 0.2 5 < 0.2 0.2 0.2 -
BkFA 8 0.3 8 - - 0.3 -
BghiP 8 0.2 4 < 0.2 0.4 0.2 -
BaP 8 0.3 4 < 0.3 0.3 0.2 -
CHR 8 0.3 3 < 0.3 1.8 0.7 0.6
CPP 8 0.3 7 < 0.3 0.5 0.3 -
DBahA 8 0.3 8 - - 0.3 -
DBaeP 8 0.3 8 - - 0.3 -
DBahP 8 0.3 8 - - 0.3 -
DBaiP 8 0.3 8 - - 0.3 -
DBalP 8 0.3 8 - - 0.3 -
IP 8 0.2 4 < 0.2 0.2 0.2 -
MCH 8 0.3 8 - - 0.3 -

84
Subtable 20 Analytical results of PAHs in cotton seed oil (2014)
Chemical name
No of samples
LOQ (μg/kg)
No of samples
below LOQ
Minimum (μg/kg)
Maximum (μg/kg)
Mean (μg/kg)
Median (μg/kg)
BaA 3 0.3 3 - - 0.3 -
BcFL 3 0.5 3 - - 0.5 -
BbFA 3 0.3 2 < 0.3 0.3 0.3 -
BjFA 3 0.2 2 < 0.2 0.2 0.2 -
BkFA 3 0.3 3 - - 0.3 -
BghiP 3 0.2 2 < 0.2 0.3 0.2 -
BaP 3 0.3 2 < 0.3 0.3 0.3 -
CHR 3 0.3 2 < 0.3 0.3 0.3 -
CPP 3 0.3 3 - - 0.3 -
DBahA 3 0.3 3 - - 0.3 -
DBaeP 3 0.3 3 - - 0.3 -
DBahP 3 0.3 3 - - 0.3 -
DBaiP 3 0.3 3 - - 0.3 -
DBalP 3 0.3 3 - - 0.3 -
IP 3 0.2 2 < 0.2 0.3 0.2 -
MCH 3 0.3 3 - - 0.3 -
Subtable 21 Analytical results of PAHs in peanut oil (2014)
Chemical name
No of samples
LOQ (μg/kg)
No of samples
below LOQ
Minimum (μg/kg)
Maximum (μg/kg)
Mean (μg/kg)
Median (μg/kg)
BaA 7 0.3 2 < 0.3 0.8 0.4 0.3
BcFL 7 0.5 7 - - 0.5 -
BbFA 7 0.3 4 < 0.3 0.9 0.4 -
BjFA 7 0.2 3 < 0.2 0.8 0.3 0.2
BkFA 7 0.3 6 < 0.3 0.3 0.3 -
BghiP 7 0.2 2 < 0.2 1.5 0.5 0.3
BaP 7 0.3 3 < 0.3 1.1 0.4 0.3
CHR 7 0.3 0 < 0.3 1.4 0.7 0.6
CPP 7 0.3 6 < 0.3 1.0 0.4 -
DBahA 7 0.3 7 - - 0.3 -
DBaeP 7 0.3 7 - - 0.3 -
DBahP 7 0.3 7 - - 0.3 -
DBaiP 7 0.3 7 - - 0.3 -
DBalP 7 0.3 7 - - 0.3 -
IP 7 0.2 4 < 0.2 0.5 0.2 -
MCH 7 0.3 7 - - 0.3 -

85
3-MCPD fatty acid esters
Table 81 Analytical results of 3-MCPD fatty acid esters in edible vegetable oils and fats
(2012, 2013)
Food No of
samples LOQ
(mg/kg)
No of samples below LOQ
Minimum (mg/kg)
Maximum (mg/kg)
Mean (mg/kg)
Median (mg/kg)
Edible vegetable oils and fats 119 0.3 73 < 0.3 5.3 0.5 -
Palm oil 5 0.3 0 2.8 3.8 3.3 3.3
Linseed oil 1 0.3 1 - - 0.1 -
Olive oil 10 0.3 7 < 0.3 0.4 0.2 -
Extra virgin olive oil27 5 0.3 5 - - 0.1 -
Pure olive oil 5 0.3 2 < 0.3 0.4 0.3 0.3
Coconut oil 3 0.3 3 - - 0.1 -
Sesame oil 30 0.3 29 < 0.3 0.3 0.1 -
Sesame oil (crude)28 20 0.3 20 - - 0.1 -
Sesame oil (refined) 10 0.3 9 < 0.3 0.3 0.1 -
Rice-bran oil 24 0.3 0 0.3 1.0 0.5 0.5
Safflower oil 4 0.3 3 < 0.3 0.3 0.2 -
Soybean oil 3 0.3 3 - - 0.1 -
Corn oil/maize oil 12 0.3 8 < 0.3 0.9 0.2 -
Rapeseed oil/colza oil 8 0.3 8 - - 0.1 -
Rapeseed oil/colza
oil (crude) 4 0.3 4 - - 0.1 -
Rapeseed oil/colza
oil (refined) 4 0.3 4 - - 0.1 -
Sunflower oil 7 0.3 7 - - 0.1 -
Sunflower oil (crude) 4 0.3 4 - - 0.1 -
Sunflower oil
(refined) 3 0.3 3 - - 0.1 -
Grape seed oil 4 0.3 0 0.8 5.3 2.6 2.3
Others 8 0.3 4 < 0.3 1.5 0.4 -
Note: The LOD was 0.2 mg/kg.
27 All products except those products which claimed extra virgin olive oil in the labelling
were classified into pure olive oil. 28 Those products which claimed that they were unrefined such as ‘non heat application’
and ‘fresh pressed’ and their acid values were above 0.2, were taken as crude oils.

86
Glycidyl fatty acid esters
Table 82 Analytical results of glycidyl fatty acid esters (as free glycidol) in edible
vegetable oils and fats with the indirect method (2012, 2013)
Food No of
samples LOQ
(mg/kg)
No of samples below LOQ
Minimum (mg/kg)
Maximum (mg/kg)
Mean (mg/kg)
Median (mg/kg)
Edible vegetable oils and fats 119 0.3 57 < 0.3 6.8 0.9 0.3
Palm oil 5 0.3 0 0.8 2.0 1.2 1.2
Linseed oil 1 0.3 1 - - 0 -
Olive oil 10 0.3 8 < 0.3 1.6 0.2 -
Extra virgin olive oil 5 0.3 5 - - 0 -
Pure olive oil 5 0.3 3 < 0.3 1.6 0.4 -
Coconut oil 3 0.3 3 - - 0.1 -
Sesame oil 30 0.3 28 < 0.3 1.1 0.2 -
Sesame oil (crude) 20 0.3 19 < 0.3 0.9 0.2 -
Sesame oil (refined) 10 0.3 9 < 0.3 1.1 0.2 -
Rice-bran oil 24 0.3 0 1.0 6.8 2.9 2.3
Safflower oil 4 0.3 3 < 0.3 0.3 0.2 -
Soybean oil 3 0.3 3 - - 0.1 -
Corn oil/maize oil 12 0.3 1 < 0.3 1.6 1.0 1.1
Rapeseed oil/colza oil 8 0.3 6 < 0.3 0.6 0.2 -
Rapeseed oil/colza
oil (crude) 4 0.3 4 - - 0 -
Rapeseed oil/colza
oil (refined) 4 0.3 2 < 0.3 0.6 0.3 -
Sunflower oil 7 0.3 4 < 0.3 0.3 0.2 -
Sunflower oil (crude) 4 0.3 4 - - 0.1 -
Sunflower oil
(refined) 3 0.3 0 < 0.3 0.3 0.3 0.3
Grape seed oil 4 0.3 0 0.5 2.1 1.2 1.2
Others 8 0.3 0 0.3 3.9 1.1 0.7
Note: The LOD was 0.08 mg/kg.

87
Table 83 Analytical results of glycidyl fatty acid esters (as glycidol equivalent) in edible
vegetable oils and fats with the direct method (2012, 2013)
Food No of
samples
Minimum (mg/kg)
(UB)*
Maximum (mg/kg)
(UB)*
Mean (mg/kg)
(LB)
Mean (mg/kg)
(UB)
Edible vegetable oils and fats 119 0.04 6.6 0.83 0.87
Palm oil 5 0.53 1.9 0.93 0.94
Linseed oil 1 0.04 0.04 0 0.04
Olive oil 10 0.04 1.4 0.18 0.22
Extra virgin olive oil 5 0.04 0.06 0 0.05
Pure olive oil 5 0.06 1.4 0.36 0.40
Coconut oil 3 0.06 0.18 0.06 0.11
Sesame oil 30 0.04 0.96 0.09 0.14
Sesame oil (crude) 20 0.04 0.79 0.06 0.11
Sesame oil (refined) 10 0.07 0.96 0.16 0.20
Rice-bran oil 24 0.86 6.6 2.8 2.9
Safflower oil 4 0.11 0.23 0.13 0.16
Soybean oil 3 0.13 0.18 0.08 0.14
Corn oil/maize oil 12 0.07 1.5 0.73 0.77
Rapeseed oil/colza oil 8 0.04 0.45 0.10 0.14
Rapeseed oil/colza
oil (crude) 4 0.04 0.06 0 0.05
Rapeseed oil/colza
oil (refined) 4 0.12 0.45 0.19 0.23
Sunflower oil 7 0.04 0.27 0.11 0.15
Sunflower oil (crude) 4 0.04 0.23 0.04 0.09
Sunflower oil
(refined) 3 0.20 0.27 0.20 0.24
Grape seed oil 4 0.29 2.0 1.1 1.1
Others 8 0.19 2.2 0.76 0.78
*Minimum (UB) and maximum (UB) were calculated by setting the concentration below
the LOD equal to the LOD and the concentration between the LOD and the LOQ equal to
the LOQ.
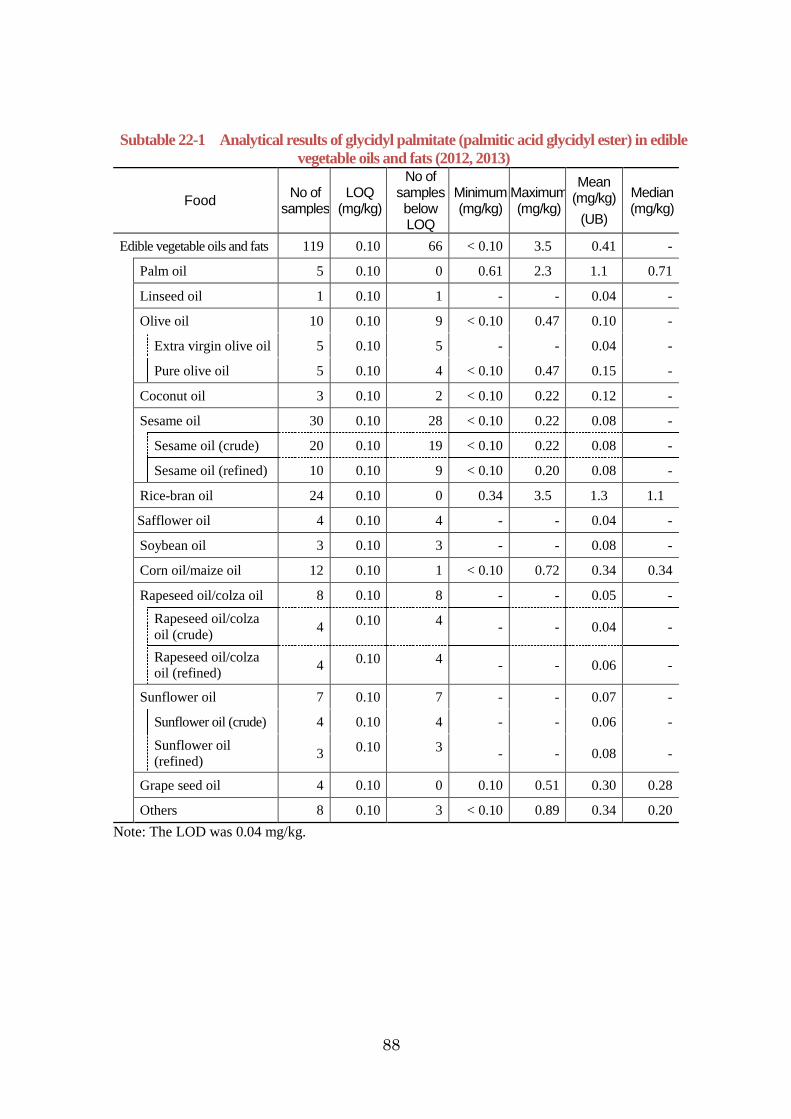
88
Subtable 22-1 Analytical results of glycidyl palmitate (palmitic acid glycidyl ester) in edible
vegetable oils and fats (2012, 2013)
Food No of
samples LOQ
(mg/kg)
No of samples below LOQ
Minimum (mg/kg)
Maximum (mg/kg)
Mean (mg/kg)
(UB)
Median (mg/kg)
Edible vegetable oils and fats 119 0.10 66 < 0.10 3.5 0.41 -
Palm oil 5 0.10 0 0.61 2.3 1.1 0.71
Linseed oil 1 0.10 1 - - 0.04 -
Olive oil 10 0.10 9 < 0.10 0.47 0.10 -
Extra virgin olive oil 5 0.10 5 - - 0.04 -
Pure olive oil 5 0.10 4 < 0.10 0.47 0.15 -
Coconut oil 3 0.10 2 < 0.10 0.22 0.12 -
Sesame oil 30 0.10 28 < 0.10 0.22 0.08 -
Sesame oil (crude) 20 0.10 19 < 0.10 0.22 0.08 -
Sesame oil (refined) 10 0.10 9 < 0.10 0.20 0.08 -
Rice-bran oil 24 0.10 0 0.34 3.5 1.3 1.1
Safflower oil 4 0.10 4 - - 0.04 -
Soybean oil 3 0.10 3 - - 0.08 -
Corn oil/maize oil 12 0.10 1 < 0.10 0.72 0.34 0.34
Rapeseed oil/colza oil 8 0.10 8 - - 0.05 -
Rapeseed oil/colza
oil (crude) 4
0.10 4 - - 0.04 -
Rapeseed oil/colza
oil (refined) 4
0.10 4 - - 0.06 -
Sunflower oil 7 0.10 7 - - 0.07 -
Sunflower oil (crude) 4 0.10 4 - - 0.06 -
Sunflower oil
(refined) 3
0.10 3 - - 0.08 -
Grape seed oil 4 0.10 0 0.10 0.51 0.30 0.28
Others 8 0.10 3 < 0.10 0.89 0.34 0.20
Note: The LOD was 0.04 mg/kg.

89
Subtable 22-2 Analytical results of glycidyl linolenate (linolenic acid glycidyl ester) in edible
vegetable oils and fats (2012, 2013)
Food No of
samples LOQ
(mg/kg)
No of samples below LOQ
Minimum (mg/kg)
Maximum (mg/kg)
Mean (mg/kg)
(UB)
Median (mg/kg)
Edible vegetable oils and fats 119 0.10 100 < 0.10 0.67 0.09 -
Palm oil 5 0.10 5 - - 0.04 -
Linseed oil 1 0.10 1 - - 0.04 -
Olive oil 10 0.10 10 - - 0.05 -
Extra virgin olive oil 5 0.10 5 - - 0.04 -
Pure olive oil 5 0.10 5 - - 0.05 -
Coconut oil 3 0.10 3 - - 0.04 -
Sesame oil 30 0.10 30 - - 0.04 -
Sesame oil (crude) 20 0.10 20 - - 0.04 -
Sesame oil (refined) 10 0.10 10 - - 0.04 -
Rice-bran oil 24 0.10 7 < 0.10 0.35 0.18 0.14
Safflower oil 4 0.10 4 - - 0.04 -
Soybean oil 3 0.10 3 - - 0.10 -
Corn oil/maize oil 12 0.10 12 - - 0.08 -
Rapeseed oil/colza oil 8 0.10 8 - - 0.06 -
Rapeseed oil/colza
oil (crude) 4
0.10 4 - - 0.04 -
Rapeseed oil/colza
oil (refined) 4
0.10 4 - - 0.07 -
Sunflower oil 7 0.10 7 - - 0.05 -
Sunflower oil (crude) 4 0.10 4 - - 0.06 -
Sunflower oil
(refined) 3
0.10 3 - - 0.04 -
Grape seed oil 4 0.10 4 - - 0.04 -
Others 8 0.10 6 < 0.10 0.67 0.20 -
Note: The LOD was 0.04 mg/kg.

90
Subtable 22-3 Analytical results of glycidyl linoleate (linoleic acid glycidyl ester) in edible
vegetable oils and fats (2012, 2013)
Food No of
samples LOQ
(mg/kg)
No of samples below LOQ
Minimum (mg/kg)
Maximum (mg/kg)
Mean (mg/kg)
(UB)
Median (mg/kg)
Edible vegetable oils and fats 119 0.10 36 < 0.10 11 1.5 0.31
Palm oil 5 0.10 0 0.34 1.2 0.67 0.65
Linseed oil 1 0.10 1 - - 0.04 -
Olive oil 10 0.10 8 < 0.10 0.77 0.13 -
Extra virgin olive oil 5 0.10 5 - - 0.04 -
Pure olive oil 5 0.10 3 < 0.10 0.77 0.22 -
Coconut oil 3 0.10 3 - - 0.06 -
Sesame oil 30 0.10 14 < 0.10 1.9 0.24 0.10
Sesame oil (crude) 20 0.10 11 < 0.10 1.8 0.19 -
Sesame oil (refined) 10 0.10 3 < 0.10 1.9 0.36 0.21
Rice-bran oil 24 0.10 0 1.5 11 5.1 4.1
Safflower oil 4 0.10 2 < 0.10 0.17 0.13 -
Soybean oil 3 0.10 0 0.23 0.45 0.33 0.31
Corn oil/maize oil 12 0.10 1 < 0.10 3.7 1.9 1.9
Rapeseed oil/colza oil 8 0.10 4 < 0.10 0.36 0.13 -
Rapeseed oil/colza
oil (crude) 4
0.10 4 - - 0.04 -
Rapeseed oil/colza
oil (refined) 4
0.10 0 0.13 0.36 0.22 0.19
Sunflower oil 7 0.10 3 < 0.10 0.66 0.24 0.12
Sunflower oil (crude) 4 0.10 3 < 0.10 0.24 0.09 -
Sunflower oil
(refined) 3
0.10 0 0.12 0.66 0.44 0.54
Grape seed oil 4 0.10 0 0.67 6.5 3.4 3.3
Others 8 0.10 0 0.35 3.1 1.0 0.75
Note: The LOD was 0.04 mg/kg.

91
Subtable 22-4 Analytical results of glycidyl oleate (oleic acid glycidyl ester) in edible
vegetable oils and fats (2012, 2013)
Food No of
samples LOQ
(mg/kg)
No of samples below LOQ
Minimum (mg/kg)
Maximum (mg/kg)
Mean (mg/kg)
(UB)
Median (mg/kg)
Edible vegetable oils and fats 119 0.10 33 < 0.10 14 1.8 0.39
Palm oil 5 0.10 0 1.2 4.4 2.3 2.3
Linseed oil 1 0.10 1 - - 0.04 -
Olive oil 10 0.10 5 < 0.10 4.9 0.69 -
Extra virgin olive oil 5 0.10 5 - - 0.05 -
Pure olive oil 5 0.10 0 0.12 4.9 1.3 0.52
Coconut oil 3 0.10 1 < 0.10 0.36 0.19 0.12
Sesame oil 30 0.10 16 < 0.10 1.9 0.22 -
Sesame oil (crude) 20 0.10 13 < 0.10 1.4 0.16 -
Sesame oil (refined) 10 0.10 3 < 0.10 1.9 0.35 0.19
Rice-bran oil 24 0.10 0 1.8 14 6.1 4.7
Safflower oil 4 0.10 0 0.28 0.76 0.50 0.47
Soybean oil 3 0.10 2 < 0.10 0.10 0.10 -
Corn oil/maize oil 12 0.10 1 < 0.10 2.0 1.1 1.1
Rapeseed oil/colza oil 8 0.10 4 < 0.10 1.4 0.36 -
Rapeseed oil/colza
oil (crude) 4 0.10 4 - - 0.06 -
Rapeseed oil/colza
oil (refined) 4 0.10 0 0.31 1.4 0.67 0.47
Sunflower oil 7 0.10 3 < 0.10 0.99 0.30 0.19
Sunflower oil (crude) 4 0.10 3 < 0.10 0.58 0.17 -
Sunflower oil
(refined) 3 0.10 0 0.19 0.99 0.46 0.21
Grape seed oil 4 0.10 0 0.39 1.7 0.99 0.93
Others 8 0.10 0 0.27 5.5 1.9 1.1
Note: The LOD was 0.04 mg/kg.

92
Subtable 22-5 Analytical results of glycidyl stearate (stearic acid glycidyl ester) in edible
vegetable oils and fats (2012, 2013)
Food No of
samples LOQ
(mg/kg)
No of samples below LOQ
Minimum (mg/kg)
Maximum (mg/kg)
Mean (mg/kg)
(UB)
Median (mg/kg)
Edible vegetable oils and fats 119 0.10 84 < 0.10 0.52 0.11 -
Palm oil 5 0.10 2 < 0.10 0.33 0.16 0.10
Linseed oil 1 0.10 1 - - 0.04 -
Olive oil 10 0.10 9 < 0.10 0.20 0.06 -
Extra virgin olive oil 5 0.10 5 - - 0.04 -
Pure olive oil 5 0.10 4 < 0.10 0.20 0.08 -
Coconut oil 3 0.10 2 < 0.10 0.10 0.06 -
Sesame oil 30 0.10 28 < 0.10 0.35 0.06 -
Sesame oil (crude) 20 0.10 19 < 0.10 0.19 0.05 -
Sesame oil (refined) 10 0.10 9 < 0.10 0.35 0.09 -
Rice-bran oil 24 0.10 4 < 0.10 0.52 0.23 0.18
Safflower oil 4 0.10 4 - - 0.04 -
Soybean oil 3 0.10 3 - - 0.04 -
Corn oil/maize oil 12 0.10 10 < 0.10 0.12 0.09 -
Rapeseed oil/colza oil 8 0.10 8 - - 0.04 -
Rapeseed oil/colza
oil (crude) 4 0.10 4 - - 0.04 -
Rapeseed oil/colza
oil (refined) 4 0.10 4 - - 0.04 -
Sunflower oil 7 0.10 7 - - 0.04 -
Sunflower oil (crude) 4 0.10 4 - - 0.04 -
Sunflower oil
(refined) 3 0.10 3 - - 0.04 -
Grape seed oil 4 0.10 1 < 0.10 0.37 0.22 0.20
Others 8 0.10 5 < 0.10 0.18 0.10 -
Note: The LOD was 0.04 mg/kg.

93
3.4.11.2. Other foods with a high fat content
3-MCPD fatty acid esters
Table 84 Analytical results of 3-MCPD fatty acid esters in other foods with a high fat content
(2013: per food weight)
Food No of
samples Minimum (mg/kg)
Maximum (mg/kg)
Mean (mg/kg)
Median (mg/kg)
Margarine 15 0.27 1.0 0.59 0.61
Shortening 3 1.0 5.0 2.7 2.0
Lard 3 0.38 0.44 0.41 0.40
Fish oil supplement 4 1.9 2.4 2.2 2.2
Subtable 23 Analytical results of 3-MCPD fatty acid esters in other foods with a high fat
content (2013: per fat weight)
Food No of
samples LOQ
(mg/kg)
No of samples below LOQ
Minimum (mg/kg)
Maximum (mg/kg)
Mean (mg/kg)
Median (mg/kg)
Margarine 15 0.08 0 0.32 1.2 0.71 0.74
Shortening 3 0.08 0 1.0 5.0 2.7 2.0
Lard 3 0.08 0 0.38 0.44 0.41 0.40
Fish oil supplement 4 0.08 0 1.9 2.4 2.2 2.2
Note: The LOD was 0.04 mg/kg.
Table 85 Analytical results of 3-MCPD fatty acid esters in other foods with a high fat content
(2014: per food weight)
Food No of
samples Minimum (mg/kg)
Maximum (mg/kg)
Mean (mg/kg)
Median (mg/kg)
Margarine 50 < 0.2 2.9 0.7 0.6
Shortening 30 < 0.2 3.9 1.1 0.9
Lard 20 0.16 0.51 0.24 0.21
Fish oil supplement 30 < 0.08 4.0 1.3 1.0

94
Subtable 24 Analytical results of 3-MCPD fatty acid esters in other foods with a high fat
content (2014: per fat weight)
Food No of
samples LOQ
(mg/kg)
No of samples
below LOQ
Minimum (mg/kg)
Maximum (mg/kg)
Mean (mg/kg)
Median (mg/kg)
Margarine 50 0.2 1 < 0.2 3.6 0.8 0.8
Shortening 30 0.2 8 < 0.2 3.9 1.1 0.9
Lard 20 0.08 0 0.16 0.51 0.24 0.21
Fish oil supplement 30 0.08 1 < 0.08 4.0 1.3 1.0
Note: The LOD for margarine and shortening was 0.05 mg/kg. The LOD for lards and fish
oil sapplements were 0.04 mg/kg.
Glycidyl fatty acid esters
Table 86 Analytical results of glycidyl fatty acid esters in other foods with a high fat content
with the indirect method (2013: per food weight)
Food No of
samples Minimum (mg/kg)
Maximum (mg/kg)
Mean (mg/kg)
Median (mg/kg)
Margarine 15 0.12 0.91 0.50 0.44
Shortening 3 0.7 1.3 1.0 1.0
Lard 3 < 0.06 0.07 0.05 0.06
Fish oil supplement 4 0.12 0.34 0.23 0.22
Subtable 25 Analytical results of glycidyl fatty acid esters in other foods with a high fat
content with the indirect method (2013: per fat weight)
Food No of
samples LOQ
(mg/kg)
No of samples
below LOQ
Minimum (mg/kg)
Maximum (mg/kg)
Mean (mg/kg)
Median (mg/kg)
Margarine 15 0.06 0 0.14 1.1 0.60 0.52
Shortening 3 0.06 0 0.7 1.3 1.0 1.0
Lard 3 0.06 1 < 0.06 0.07 0.05 0.06
Fish oil supplement 4 0.06 0 0.12 0.34 0.23 0.22
Note: The LOD was 0.03 mg/kg.

95
Table 87 Analytical results of glycidyl fatty acid esters (as glycidol equivalent) in other
foods with a high fat content with the direct method (2013: per food weight)
Food No of
samples
Minimum (mg/kg)
(UB)*
Maximum (mg/kg)
(UB)*
Mean (mg/kg)
(LB)
Mean (mg/kg)
(UB)
Margarine 15 0.12 0.91 0.41 0.42
Shortening 3 0.52 1.1 0.71 0.73
Lard 3 0.07 0.09 0.01 0.08
Fish oil supplement 4 0.04 0.12 0.02 0.07
Subtable 26 Analytical results of five types of glycidyl fatty acid esters in other foods with a
high fat content with the direct method (2013: per fat weight (sum of glycidol equivalent))
Food No of
samples
Minimum (mg/kg)
(UB)*
Maximum (mg/kg)
(UB)*
Mean (mg/kg)
(LB)
Mean (mg/kg)
(UB)
Margarine 15 0.15 1.1 0.49 0.51
Shortening 3 0.52 1.1 0.71 0.73
Lard 3 0.07 0.09 0.01 0.08
Fish oil supplement 4 0.04 0.12 0.02 0.07
*Minimum (UB) and maximum (UB) were calculated by setting the concentration below
the LOD equal to the LOD and the concentration between the LOD and the LOQ equal to
the LOQ.
Subtable 26-1 Analytical results of glycidyl palmitate (palmitic acid glycidyl ester) in other
foods with a high fat content (2013: per fat weight)
Food No of
samples LOQ
(mg/kg)
No of samples
below LOQ
Minimum (mg/kg)
Maximum (mg/kg)
Mean (mg/kg)
Median (mg/kg)
Margarine 15 0.10 1 < 0.10 1.3 0.55 0.45
Shortening 3 0.10 0 0.59 1.0 0.79 0.76
Lard 3 0.10 3 - - 0.06 -
Fish oil supplement 4 0.10 4 - - 0.04 -
Note: The LOD was 0.04 mg/kg.

96
Subtable 26-2 Analytical results of glycidyl linolenate (linolenic acid glycidyl ester) in other
foods with a high fat content (2013: per fat weight)
Food No of
samples LOQ
(mg/kg)
No of samples below LOQ
Minimum (mg/kg)
Maximum (mg/kg)
Mean (mg/kg)
Median (mg/kg)
Margarine 15 0.10 15 - - 0.04 -
Shortening 3 0.10 3 - - 0.06 -
Lard 3 0.10 3 - - 0.04 -
Fish oil supplement 4 0.10 4 - - 0.04 -
Note: The LOD was 0.04 mg/kg.
Subtable 26-3 Analytical results of glycidyl linoleate (linoleic acid glycidyl ester) in other
foods with a high fat content (2013: per fat weight)
Food No of
samples LOQ
(mg/kg)
No of samples below LOQ
Minimum (mg/kg)
Maximum (mg/kg)
Mean (mg/kg)
Median (mg/kg)
Margarine 15 0.10 2 < 0.10 0.79 0.39 0.33
Shortening 3 0.10 0 0.35 0.78 0.51 0.39
Lard 3 0.10 3 - - 0.04 -
Fish oil supplement 4 0.10 4 - - 0.07 -
Note: The LOD was 0.04 mg/kg.
Subtable 26-4 Analytical results of glycidyl oleate (oleic acid glycidyl ester) in other foods
with a high fat content (2013: per fat weight)
Food No of
samples LOQ
(mg/kg)
No of samples
below LOQ
Minimum (mg/kg)
Maximum (mg/kg)
Mean (mg/kg)
Median (mg/kg)
Margarine 15 0.10 0 0.29 2.7 1.1 0.88
Shortening 3 0.10 0 1.2 2.6 1.7 1.2
Lard 3 0.10 1 < 0.10 0.11 0.10 0.10
Fish oil supplement 4 0.10 3 < 0.10 0.34 0.11 -
Note: The LOD was 0.04 mg/kg.
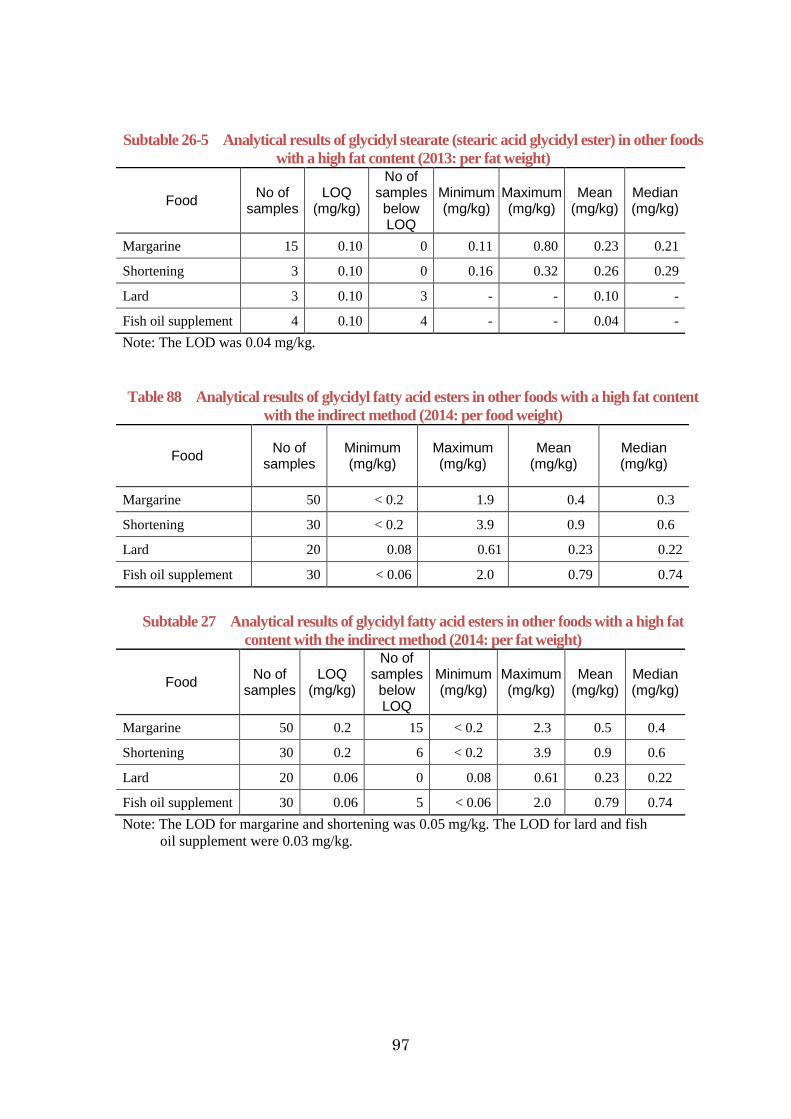
97
Subtable 26-5 Analytical results of glycidyl stearate (stearic acid glycidyl ester) in other foods
with a high fat content (2013: per fat weight)
Food No of
samples LOQ
(mg/kg)
No of samples below LOQ
Minimum (mg/kg)
Maximum (mg/kg)
Mean (mg/kg)
Median (mg/kg)
Margarine 15 0.10 0 0.11 0.80 0.23 0.21
Shortening 3 0.10 0 0.16 0.32 0.26 0.29
Lard 3 0.10 3 - - 0.10 -
Fish oil supplement 4 0.10 4 - - 0.04 -
Note: The LOD was 0.04 mg/kg.
Table 88 Analytical results of glycidyl fatty acid esters in other foods with a high fat content
with the indirect method (2014: per food weight)
Food No of
samples Minimum (mg/kg)
Maximum (mg/kg)
Mean (mg/kg)
Median (mg/kg)
Margarine 50 < 0.2 1.9 0.4 0.3
Shortening 30 < 0.2 3.9 0.9 0.6
Lard 20 0.08 0.61 0.23 0.22
Fish oil supplement 30 < 0.06 2.0 0.79 0.74
Subtable 27 Analytical results of glycidyl fatty acid esters in other foods with a high fat
content with the indirect method (2014: per fat weight)
Food No of
samples LOQ
(mg/kg)
No of samples
below LOQ
Minimum (mg/kg)
Maximum (mg/kg)
Mean (mg/kg)
Median (mg/kg)
Margarine 50 0.2 15 < 0.2 2.3 0.5 0.4
Shortening 30 0.2 6 < 0.2 3.9 0.9 0.6
Lard 20 0.06 0 0.08 0.61 0.23 0.22
Fish oil supplement 30 0.06 5 < 0.06 2.0 0.79 0.74
Note: The LOD for margarine and shortening was 0.05 mg/kg. The LOD for lard and fish
oil supplement were 0.03 mg/kg.

98
Table 89 Analytical results of glycidyl fatty acid esters (as glycidol equivalent) in other foods
with a high fat content with the direct method (2014: per food weight)
Food No of
samples
Minimum (mg/kg)
(UB)*
Maximum (mg/kg)
(UB)*
Mean (mg/kg)
(LB)
Mean (mg/kg)
(UB)
Margarine 50 0.1 1.5 0.4 0.4
Shortening 30 0.1 3.6 0.8 0.8
Lard 20 0.05 0.19 0.03 0.08
Subtable 28 Analytical results of five types of glycidyl fatty acid esters in other foods with a
high fat content with the direct method (2014: per fat weight (sum of glycidol equivalent))
Food No of
samples
Minimum (mg/kg)
(UB)*
Maximum (mg/kg)
(UB)*
Mean (mg/kg)
(LB)
Mean (mg/kg)
(UB)
Margarine 50 0.1 1.8 0.5 0.5
Shortening 30 0.1 3.6 0.8 0.8
Lard 20 0.05 0.19 0.03 0.08
*Minimum (UB) and maximum (UB) were calculated by setting the concentration below
the LOD equal to the LOD and the concentration between the LOD and the LOQ equal to
the LOQ.
Subtable 28-1 Analytical results of glycidyl palmitate (palmitic acid glycidyl ester) in other
foods with a high fat content (2014: per fat weight)
Food No of
samples LOQ
(mg/kg)
No of samples
below LOQ
Minimum (mg/kg)
Maximum (mg/kg)
Mean (mg/kg)
(UB)
Median (mg/kg)
Margarine 50 0.2 6 < 0.2 2.3 0.6 0.5
Shortening 30 0.2 10 < 0.2 4.9 0.9 0.6
Lard 20 0.10 18 < 0.10 0.20 0.06 -
Note: The LOD for margarine and shortening was 0.05 mg/kg. The LOD for lard was 0.03
mg/kg.
Subtable 28-2 Analytical results of glycidyl linolenate (linolenic acid glycidyl ester) in other
foods with a high fat content (2014: per fat weight)
Food No of
samples LOQ
(mg/kg)
No of samples
below LOQ
Minimum (mg/kg)
Maximum (mg/kg)
Mean (mg/kg)
(UB)
Median (mg/kg)
Margarine 50 0.1 50 - - 0.04 -
Shortening 30 0.1 29 < 0.1 0.1 0.04 -
Lard 20 0.10 20 - - 0.03 -

99
Note: The LOD was 0.03 mg/kg.
Subtable 28-3 Analytical results of glycidyl linoleate (linoleic acid glycidyl ester) in other
foods with a high fat content (2014: per fat weight)
Food No of
samples LOQ
(mg/kg)
No of samples
below LOQ
Minimum (mg/kg)
Maximum (mg/kg)
Mean (mg/kg)
(UB)
Median (mg/kg)
Margarine 50 0.2 10 < 0.2 1.4 0.4 0.3
Shortening 30 0.2 11 < 0.2 2.1 0.5 0.6
Lard 20 0.10 19 < 0.10 0.11 0.07 -
Note: The LOD for margarine and shortening was 0.07 mg/kg. The LOD for lard was 0.03
mg/kg.
Subtable 28-4 Analytical results of glycidyl oleate (oleic acid glycidyl ester) in other foods
with a high fat content (2014: per fat weight)
Food No of
samples LOQ
(mg/kg)
No of samples
below LOQ
Minimum (mg/kg)
Maximum (mg/kg)
Mean (mg/kg)
(UB)
Median (mg/kg)
Margarine 50 0.1 1 < 0.1 4.2 1.1 1.0
Shortening 30 0.1 0 0.1 8.4 1.8 1.0
Lard 20 0.10 10 < 0.10 0.40 0.17 -
Note: The LOD for margarine and shortening was 0.02 mg/kg. The LOD for lard was 0.03
mg/kg.
Subtable 28-5 Analytical results of glycidyl stearate (stearic acid glycidyl ester) in other foods
with a high fat content (2014: per fat weight)
Food No of
samples LOQ
(mg/kg)
No of samples
below LOQ
Minimum (mg/kg)
Maximum (mg/kg)
Mean (mg/kg)
(UB)
Median (mg/kg)
Margarine 50 0.2 21 < 0.2 1.2 0.3 0.4
Shortening 30 0.2 14 < 0.2 2.0 0.5 0.5
Lard 20 0.10 19 < 0.10 0.11 0.05 -
Note: The LOD for margarine and shortening was 0.05 mg/kg. The LOD for lard was 0.03
mg/kg.

100
Trans fatty acids
Table 90 Analytical results of trans fatty acids in other foods with a high fat content (2014)
Food No of
samples Minimum (g/100 g)
Maximum (g/100 g)
Mean (g/100 g)
Median (g/100 g)
Margarine 46 0.22 16 3.2 0.93
Shortening 24 0.22 24 4.5 0.92
Fat spread 33 0.20 4.4 1.2 0.60
Compound margarine 12 0.56 5.8 2.4 1.7
Table 91 Analytical results of saturated fatty acids in other foods with a high fat content
(2014)
Food No of
samples Minimum (g/100 g)
Maximum (g/100 g)
Mean (g/100 g)
Median (g/100 g)
Margarine 46 11 47 32 33
Shortening 24 14 55 39 42
Fat spread 33 4.4 49 23 20
Compound margarine 12 19 47 34 34
Subtable 29 Analytical results of conjugated linoleic acid (CLA) in other foods with a high
fat content (2014)
Food No of
samples Minimum (g/100 g)
Maximum (g/100 g)
Mean (g/100 g)
Median (g/100 g)
Fat spread 33 0.00 0.13 0.03 -
Compound margarine 12 0.08 0.52 0.29 0.30

101
3.4.12. Foods for infants
3.4.12.1. Infant formula (powder) and similar products
Metals
Table 92 Analytical results of metals in infant formula (powder) and similar products (2013)
Chemical name
No of samples
LOQ (mg/kg)
No of samples
below LOQ
Minimum (mg/kg)
Maximum (mg/kg)
Mean (mg/kg)
Median (mg/kg)
Lead 20 0.01 19 < 0.01 0.01
(0.0014)
0.01
(0.0013) -
Cadmium 20 0.01 20 - - 0.01
(0.0013) -
Total mercury 20 0.01 20 - - 0.01
(0.0013) -
Total arsenic 20 0.01 9 < 0.01 0.03
(0.0042)
0.01
(0.0017)
0.01
(0.0014)
Note: Estimated values for prepared milk (ready to use) are indicated in the brackets. They
were calculated by dividing the concentration in powder form by the dilution ratio of
each product. The units of minimum, maximum, mean, median are mg/L.
Table 92-1 Analytical results of metals in infant formula (powder) (2013)
Chemical name
No of samples
LOQ (mg/kg)
No of samples
below LOQ
Minimum (mg/kg)
Maximum (mg/kg)
Mean (mg/kg)
Median (mg/kg)
Lead 10 0.01 10 - - 0.01
(0.0013) -
Cadmium 10 0.01 10 - - 0.01
(0.0013) -
Total mercury 10 0.01 10 - - 0.01
(0.0013) -
Total arsenic 10 0.01 5 < 0.01 0.03
(0.0036)
0.01
(0.0016) -
Note: Estimated values for prepared milk (ready to use) are indicated in the brackets. They
were calculated by dividing the concentration in powder form by the dilution ratio of
each product. The units of minimum, maximum, mean, median are mg/L.

102
Table 92-2 Analytical results of metals in follow-up formula (powder) (2013)
Chemical name
No of samples
LOQ (mg/kg)
No of samples
below LOQ
Minimum (mg/kg)
Maximum (mg/kg)
Mean (mg/kg)
Median (mg/kg)
Lead 10 0.01 9 < 0.01 0.01
(0.0014)
0.01
(0.0014) -
Cadmium 10 0.01 10 - - 0.01
(0.0014) -
Total mercury 10 0.01 10 - - 0.01
(0.0014) -
Total arsenic 10 0.01 4 < 0.01 0.03
(0.0042)
0.01
(0.0018)
0.01
(0.0014)
Note: Estimated values for prepared milk (ready to use) are indicated in the brackets. They
were calculated by dividing the concentration in powder form by the dilution ratio of
each product. The units of minimum, maximum, mean, median are mg/L.
3-MCPD fatty acid esters
Table 93 Analytical results of 3-MCPD fatty acid esters in infant formula (powder) and
similar products (2013: per food weight)
Food No of
samples Minimum (mg/kg)
Maximum (mg/kg)
Mean (mg/kg)
Median (mg/kg)
Infant formula (powder)
and similar product 21 0.06 0.59 0.24 0.22
Infant formula (powder) 8 0.10 0.59 0.29 0.29
Follow-up formula
(powder) 6 0.12 0.27 0.19 0.19
Formulas for special
medical purposes
intended for infants
(powder)
7 0.06 0.36 0.24 0.23

103
Subtable 30 Analytical results of 3-MCPD fatty acid esters in infant formula
(powder) and similar products (2013: per fat weight)
Food No of
samples LOQ
(mg/kg)
No of samples below LOQ
Minimum (mg/kg)
Maximum (mg/kg)
Mean (mg/kg)
Median (mg/kg)
Infant formula (powder)
and similar product 21 0.08 0 0.28 2.2 1.1 1.1
Infant formula (powder) 8 0.08 0 0.39 2.2 1.0 1.0
Follow-up formula
(powder) 6 0.08 0 0.53 1.4 0.98 0.98
Formulas for special
medical purposes
intended for infants
(powder)
7 0.08 0 0.28 1.8 1.2 1.3
Note: The LOD was 0.04 mg/kg.
Table 94 Analytical results of 3-MCPD fatty acid esters in infant formula (powder) and
similar products (2014: per food weight)
Food No of
samples Minimum (mg/kg)
Maximum (mg/kg)
Mean (mg/kg)
Median (mg/kg)
Infant formula (powder)
and similar product 40 < 0.04 0.6 0.2 0.2
Infant formula (powder) 15 < 0.06 0.6 0.2 0.2
Follow-up formula
(powder) 12 < 0.04 0.2 0.2 0.2
Formulas for special
medical purposes
intended for infants
(powder)
13 < 0.04 0.3 0.2 0.2
Subtable 31 Analytical results of 3-MCPD fatty acid esters in infant formula (powder) and
similar products (2014: per fat weight)
Food No of
samples LOQ
(mg/kg)
No of samples below LOQ
Minimum (mg/kg)
Maximum (mg/kg)
Mean (mg/kg)
Median (mg/kg)
Infant formula (powder)
and similar product 40 0.2 3 < 0.2 2.1 0.9 0.8
Infant formula (powder) 15 0.2 1 < 0.2 2.1 0.8 0.8
Follow-up formula
(powder) 12 0.2 1 < 0.2 1.2 0.8 0.8

104
Food No of
samples LOQ
(mg/kg)
No of samples below LOQ
Minimum (mg/kg)
Maximum (mg/kg)
Mean (mg/kg)
Median (mg/kg)
Formulas for special
medical purposes
intended for infants
(powder)
13 0.2 1 < 0.2 1.7 1.0 1.0
Note: The LOD was 0.05 mg/kg.
Glycidyl fatty acid esters
Table 95 Analytical results of glycidyl fatty acid esters in infant formula (powder) and
similar products with the indirect method (2013: per food weight)
Food No of
samples Minimum (mg/kg)
Maximum (mg/kg)
Mean (mg/kg)
Median (mg/kg)
Infant formula (powder)
and similar product 21 < 0.02 0.11 0.04 0.04
Infant formula (powder) 8 < 0.02 0.07 0.04 0.05
Follow-up formula
(powder) 6 0.02 0.07 0.04 0.03
Formulas for special
medical purposes
intended for infants
(powder)
7 0.02 0.11 0.04 0.03
Subtable 32 Analytical results of glycidyl fatty acid esters in infant formula (powder) and
similar products with the indirect method (2013: per fat weight)
Food No of
samples LOQ
(mg/kg)
No of samples below LOQ
Minimum (mg/kg)
Maximum (mg/kg)
Mean (mg/kg)
Median (mg/kg)
Infant formula (powder)
and similar product 21 0.06 1 < 0.06 0.53 0.19 0.18
Infant formula (powder) 8 0.06 1 < 0.06 0.27 0.16 0.18
Follow-up formula
(powder) 6 0.06 0 0.08 0.40 0.20 0.18
Formulas for special
medical purposes
intended for infants
(powder)
7 0.06 0 0.11 0.53 0.21 0.18
Note: The LOD was 0.03 mg/kg.
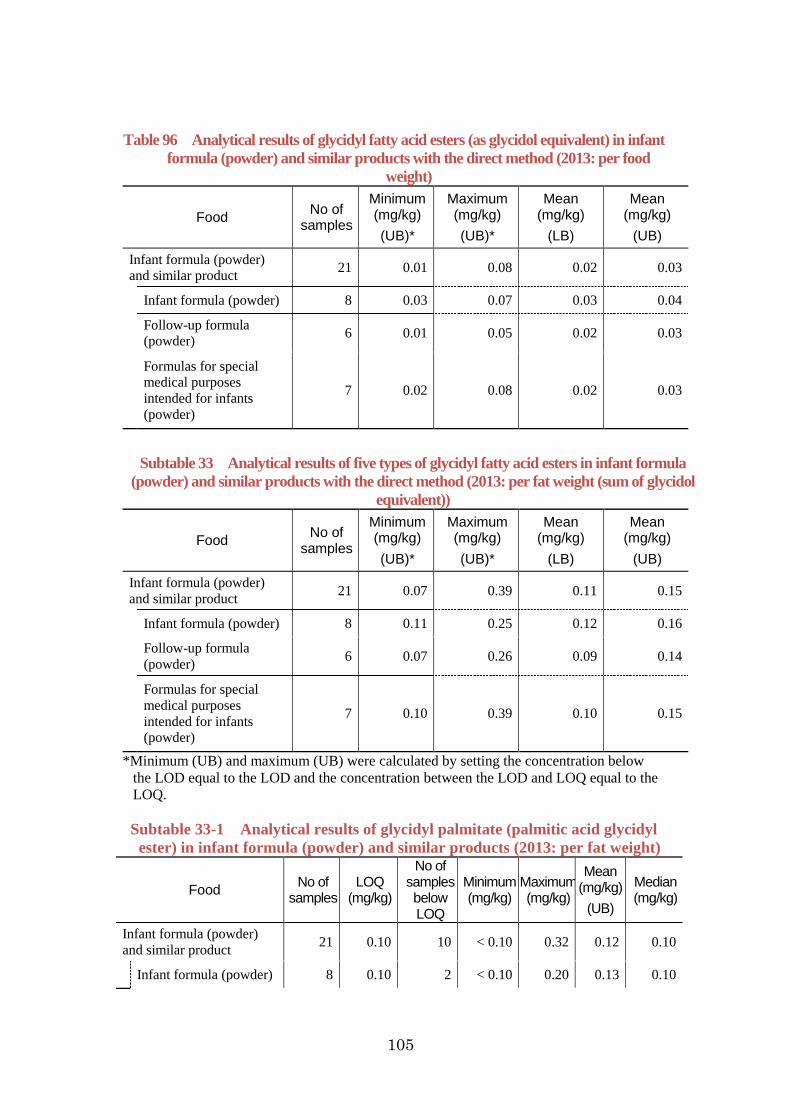
105
Table 96 Analytical results of glycidyl fatty acid esters (as glycidol equivalent) in infant
formula (powder) and similar products with the direct method (2013: per food
weight)
Food No of
samples
Minimum (mg/kg)
(UB)*
Maximum (mg/kg)
(UB)*
Mean (mg/kg)
(LB)
Mean (mg/kg)
(UB)
Infant formula (powder)
and similar product 21 0.01 0.08 0.02 0.03
Infant formula (powder) 8 0.03 0.07 0.03 0.04
Follow-up formula
(powder) 6 0.01 0.05 0.02 0.03
Formulas for special
medical purposes
intended for infants
(powder)
7 0.02 0.08 0.02 0.03
Subtable 33 Analytical results of five types of glycidyl fatty acid esters in infant formula
(powder) and similar products with the direct method (2013: per fat weight (sum of glycidol
equivalent))
Food No of
samples
Minimum (mg/kg)
(UB)*
Maximum (mg/kg)
(UB)*
Mean (mg/kg)
(LB)
Mean (mg/kg)
(UB)
Infant formula (powder)
and similar product 21 0.07 0.39 0.11 0.15
Infant formula (powder) 8 0.11 0.25 0.12 0.16
Follow-up formula
(powder) 6 0.07 0.26 0.09 0.14
Formulas for special
medical purposes
intended for infants
(powder)
7 0.10 0.39 0.10 0.15
*Minimum (UB) and maximum (UB) were calculated by setting the concentration below
the LOD equal to the LOD and the concentration between the LOD and LOQ equal to the
LOQ.
Subtable 33-1 Analytical results of glycidyl palmitate (palmitic acid glycidyl
ester) in infant formula (powder) and similar products (2013: per fat weight)
Food No of
samples LOQ
(mg/kg)
No of samples below LOQ
Minimum (mg/kg)
Maximum (mg/kg)
Mean (mg/kg)
(UB)
Median (mg/kg)
Infant formula (powder)
and similar product 21 0.10 10 < 0.10 0.32 0.12 0.10
Infant formula (powder) 8 0.10 2 < 0.10 0.20 0.13 0.10

106
Food No of
samples LOQ
(mg/kg)
No of samples below LOQ
Minimum (mg/kg)
Maximum (mg/kg)
Mean (mg/kg)
(UB)
Median (mg/kg)
Follow-up formula
(powder) 6 0.10 3 < 0.10 0.21 0.12 -
Formulas for special
medical purposes
intended for infants
(powder)
7 0.10 5 < 0.10 0.32 0.12 -
Note: The LOD was 0.04 mg/kg.
Subtable 33-2 Analytical results of glycidyl linolenate (linolenic acid glycidyl ester) in infant
formula (powder) and similar products (2013: per fat weight)
Food No of
samples LOQ
(mg/kg)
No of samples below LOQ
Minimum (mg/kg)
Maximum (mg/kg)
Mean (mg/kg)
(UB)
Median (mg/kg)
Infant formula (powder)
and similar product 21 0.10 21 - - 0.04 -
Infant formula (powder) 8 0.10 8 - - 0.04 -
Follow-up formula
(powder) 6 0.10 6 - - 0.04 -
Formulas for special
medical purposes
intended for infants
(powder)
7 0.10 7 - - 0.04 -
Note: The LOD was 0.04 mg/kg.
Subtable 33-3 Analytical results of glycidyl linoleate (linoleic acid glycidyl ester) in infant
formula (powder) and similar products (2013: per fat weight)
Food No of
samples LOQ
(mg/kg)
No of samples below LOQ
Minimum (mg/kg)
Maximum (mg/kg)
Mean (mg/kg)
(UB)
Median (mg/kg)
Infant formula (powder)
and similar product 21 0.10 11 < 0.10 0.27 0.12 -
Infant formula (powder) 8 0.10 3 < 0.10 0.18 0.13 0.11
Follow-up formula
(powder) 6 0.10 4 < 0.10 0.16 0.11 -
Formulas for special
medical purposes
intended for infants
(powder)
7 0.10 4 < 0.10 0.27 0.13 -
Note: The LOD was 0.04 mg/kg.

107
Subtable 33-4 Analytical results of glycidyl oleate (oleic acid glycidyl ester) in
infant formula (powder) and similar products (2013: per fat weight)
Food No of
samples LOQ
(mg/kg)
No of samples below LOQ
Minimum (mg/kg)
Maximum (mg/kg)
Mean (mg/kg)
(UB)
Median (mg/kg)
Infant formula (powder)
and similar product 21 0.10 1 < 0.10 1.0 0.32 0.26
Infant formula (powder) 8 0.10 0 0.14 0.62 0.33 0.26
Follow-up formula
(powder) 6 0.10 1 < 0.10 0.68 0.30 0.26
Formulas for special
medical purposes
intended for infants
(powder)
7 0.10 0 0.15 1.0 0.32 0.22
Note: The LOD was 0.04 mg/kg.
Subtable 33-5 Analytical results of glycidyl stearate (stearic acid glycidyl ester) in infant
formula (powder) and similar products (2013: per fat weight)
Food No of
samples LOQ
(mg/kg)
No of samples below LOQ
Minimum (mg/kg)
Maximum (mg/kg)
Mean (mg/kg)
(UB)
Median (mg/kg)
Infant formula (powder)
and similar product 21 0.10 21 - - 0.07 -
Infant formula (powder) 8 0.10 8 - - 0.09 -
Follow-up formula
(powder) 6 0.10 6 - - 0.06 -
Formulas for special
medical purposes
intended for infants
(powder)
7 0.10 7 - - 0.07 -
Note: The LOD was 0.04 mg/kg.
Table 97 Analytical results of glycidyl fatty acid esters in infant formula (powder) and
similar products with the indirect method (2014: per food weight)
Food No of
samples Minimum (mg/kg)
Maximum (mg/kg)
Mean (mg/kg)
Median (mg/kg)
Infant formula (powder)
and similar product 40 < 0.04 0.1 0.02 -
Infant formula (powder) 15 < 0.06 0.1 0.03 -
Follow-up formula
(powder) 12 < 0.04 0.1 0.01 -

108
Food No of
samples Minimum (mg/kg)
Maximum (mg/kg)
Mean (mg/kg)
Median (mg/kg)
Formulas for special
medical purposes
intended for infants
(powder)
13 < 0.04 0.1 0.02 -
Subtable 34 Analytical results of glycidyl fatty acid esters in infant formula (powder) and
similar products with the indirect method (2014: per fat weight)
Food No of
samples LOQ
(mg/kg)
No of samples below LOQ
Minimum (mg/kg)
Maximum (mg/kg)
Mean (mg/kg)
Median (mg/kg)
Infant formula (powder)
and similar product 40 0.2 34 < 0.2 0.7 0.1 -
Infant formula (powder) 15 0.2 13 < 0.2 0.4 0.1 -
Follow-up formula
(powder) 12 0.2 11 < 0.2 0.3 0.1 -
Formulas for special
medical purposes
intended for infants
(powder)
13 0.2 10 < 0.2 0.7 0.1 -
Note: The LOD was 0.05 mg/kg.
Table 98 Analytical results of glycidyl fatty acid esters (as glycidol equivalent) in infant
formula (powder) and similar products with the direct method (2014: per food weight)
Food No of
samples
Minimum (mg/kg)
(UB)*
Maximum (mg/kg)
(UB)*
Mean (mg/kg)
(LB)
Mean (mg/kg)
(UB)
Infant formula (powder)
and similar product 40 0.01 0.07 0.01 0.03
Infant formula (powder) 15 0.02 0.07 0.01 0.04
Follow-up formula
(powder) 12 0.01 0.04 0.01 0.02
Formulas for special
medical purposes
intended for infants
(powder)
13 0.01 0.04 0.01 0.03

109
Subtable 35 Analytical results of five types of glycidyl fatty acid esters in infant formula
(powder) and similar products with the direct method (2014: per fat weight (sum of glycidol
equivalent))
Food No of
samples
Minimum (mg/kg)
(UB)*
Maximum (mg/kg)
(UB)*
Mean (mg/kg)
(LB)
Mean (mg/kg)
(UB)
Infant formula (powder)
and similar product 40 0.1 0.2 0.04 0.1
Infant formula (powder) 15 0.1 0.2 0.05 0.1
Follow-up formula
(powder) 12 0.1 0.2 0.04 0.1
Formulas for special
medical purposes
intended for infants
(powder)
13 0.1 0.2 0.05 0.1
*Minimum (UB) and maximum (UB) were calculated by seting the concentration below the
LOD equal to the LOD and the concentration between the LOD and the LOQ equal to the
LOQ.
Subtable 35-1 Analytical results of glycidyl palmitate (palmitic acid glycidyl ester) in infant
formula (powder) and similar products (2014: per fat weight)
Food No of
samples LOQ
(mg/kg)
No of samples below LOQ
Minimum (mg/kg)
Maximum (mg/kg)
Mean (mg/kg)
(UB)
Median (mg/kg)
Infant formula (powder)
and similar product 40 0.2 40 - - 0.16 -
Infant formula (powder) 15 0.2 15 - - 0.16 -
Follow-up formula
(powder) 12 0.2 12 - - 0.15 -
Formulas for special
medical purposes
intended for infants
(powder)
13 0.2 13 - - 0.17 -
Note: The LOD was 0.05 mg/kg.
Subtable 35-2 Analytical results of glycidyl linolenate (linolenic acid glycidyl ester) in infant
formula (powder) and similar products (2014: per fat weight)
Food No of
samples LOQ
(mg/kg)
No of samples below LOQ
Minimum (mg/kg)
Maximum (mg/kg)
Mean (mg/kg)
(UB)
Median (mg/kg)
Infant formula (powder)
and similar product 40 0.1 40 - - 0.03 -
Infant formula (powder) 15 0.1 15 - - 0.03 -

110
Food No of
samples LOQ
(mg/kg)
No of samples below LOQ
Minimum (mg/kg)
Maximum (mg/kg)
Mean (mg/kg)
(UB)
Median (mg/kg)
Follow-up formula
(powder) 12 0.1 12 - - 0.03 -
Formulas for special
medical purposes
intended for infants
(powder)
13 0.1 13 - - 0.03 -
Note: The LOD was 0.03 mg/kg.
Subtable 35-3 Analytical results of glycidyl linoleate (linoleic acid glycidyl ester) in
infant formula (powder) and similar products (2014: per fat weight)
Food No of
samples LOQ
(mg/kg)
No of samples below LOQ
Minimum (mg/kg)
Maximum (mg/kg)
Mean (mg/kg)
(UB)
Median (mg/kg)
Infant formula (powder)
and similar product 40 0.2 40 - - 0.1 -
Infant formula (powder) 15 0.2 15 - - 0.1 -
Follow-up formula
(powder) 12 0.2 12 - - 0.1 -
Formulas for special
medical purposes
intended for infants
(powder)
13 0.2 13 - - 0.1 -
Note: The LOD was 0.07 mg/kg.
Subtable 35-4 Analytical results of glycidyl oleate (oleic acid glycidyl ester) in infant formula
(powder) and similar products (2014: per fat weight)
Food No of
samples LOQ
(mg/kg)
No of samples below LOQ
Minimum (mg/kg)
Maximum (mg/kg)
Mean (mg/kg)
(UB)
Median (mg/kg)
Infant formula (powder)
and similar product 40 0.1 8 < 0.1 0.5 0.2 0.2
Infant formula (powder) 15 0.1 3 < 0.1 0.5 0.2 0.2
Follow-up formula
(powder) 12 0.1 3 < 0.1 0.4 0.2 0.1
Formulas for special
medical purposes
intended for infants
(powder)
13 0.1 2 < 0.1 0.5 0.2 0.2
Note: The LOD was 0.02 mg/kg.

111
Subtable 35-5 Analytical results of glycidyl stearate (stearic acid glycidyl ester) in infant
formula (powder) and similar products (2014: per fat weight)
Food No of
samples LOQ
(mg/kg)
No of samples below LOQ
Minimum (mg/kg)
Maximum (mg/kg)
Mean (mg/kg)
(UB)
Median (mg/kg)
Infant formula (powder)
and similar product 40 0.2 40 - - 0.1 -
Infant formula (powder) 15 0.2 15 - - 0.1 -
Follow-up formula
(powder) 12 0.2 12 - - 0.1 -
Formulas for special
medical purposes
intended for infants
(powder)
13 0.2 13 - - 0.1 -
Note: The LOD was 0.05 mg/kg.

112
3.4.12.2. Ready-to-eat hijiki-based products for infants
Arsenic
Table 99 Analytical results of total arsenic and inorganic arsenic in ready-to-eat hijiki-based
products for infants (2014)
Chemical name No of
samples LOQ
(mg/kg)
No of samples
below LOQ
Minimum (mg/kg)
Maximum (mg/kg)
Mean (mg/kg)
Median (mg/kg)
Total arsenic 10
(16)
(10) - -
2.1
(16) -
Inorganic arsenic 10
(0.3)
(2)
(< 0.3)
0.4
(3.2)
0.09
(0.73)
0.06
(0.45)
Note: Concentrations on a dry weight basis (weight of freeze dried sample) are in the
brackets.

113
3.4.12.3. Infant confectionaries
Acrylamide
Table 100 Analytical results of acrylamide in infant confectionaries (2014)
Chemical name
No of samples
LOQ (mg/kg)
No of samples
below LOQ
Minimum (mg/kg)
Maximum (mg/kg)
Mean (mg/kg)
Median (mg/kg)
Acrylamide 60 0.0091 13 < 0.0091 0.59 0.11 0.066

114
3.4.13. Confectionaries
3.4.13.1. Biscuits
Acrylamide
Table 101 Analytical results of acrylamide in biscuits (2014)
Chemical name
No of samples
LOQ (mg/kg)
No of samples
below LOQ
Minimum (mg/kg)
Maximum (mg/kg)
Mean (mg/kg)
Median (mg/kg)
Acrylamide 60 0.0091 0 0.010 0.92 0.24 0.17
3.4.13.2. Snacks
Acrylamide
Table 102 Analytical results of acrylamide in potato snacks (2013)
Food No of
samples LOQ
(mg/kg)
No of samples
below LOQ
Minimum (mg/kg)
Maximum (mg/kg)
Mean (mg/kg)
Median (mg/kg)
Potato snacks 120 0.03 13 < 0.03 2.1 0.57 0.55
Purchased in
July 60 0.03 3 < 0.03 1.8 0.56 0.59
Purchased in
October 60 0.03 10 < 0.03 2.1 0.57 0.52
3.4.13.3. Rice crackers
Acrylamide
Table 103 Analytical results of acrylamide in rice crackers (2014)
Chemical name
No of samples
LOQ (mg/kg)
No of samples
below LOQ
Minimum (mg/kg)
Maximum (mg/kg)
Mean (mg/kg)
Median (mg/kg)
Acrylamide 60 0.0091 0 0.010 0.54 0.079 0.046

115
3.4.13.4. Wa-nama/hannama-gashi ‘Japanese cakes’
Acrylamide
Table 104 Analytical results of acrylamide in Wa-nama/hannama-gashi ‘Japanese
cakes’ (2014)
Chemical name
No of samples
LOQ (mg/kg
)
No of samples
below LOQ
Minimum (mg/kg)
Maximum (mg/kg)
Mean (mg/kg)
Median (mg/kg)
Acrylamide 120 0.030 103 < 0.030 0.39 0.040 -
3.4.13.5. You-nama/hannama-gashi ‘Western style cakes’
Acrylamide
Table 105 Analytical results of acrylamide in You-nama/hannama-gashi ‘Western style
cakes’ (2014)
Chemical name
No of samples
LOQ (mg/kg)
No of samples
below LOQ
Minimum (mg/kg)
Maximum (mg/kg)
Mean (mg/kg)
Median (mg/kg)
Acrylamide 120 0.030 108 < 0.030 0.44 0.035 -

116
3.4.14. Beverages and ingredients of beverages
3.4.14.1. Mugicha ‘barley tea’ (roasted barley)
Acrylamide
Table 106 Analytical results of acrylamide in Mugicha ‘barley tea’ (roasted barley) (2014)
Chemical name
No of samples
LOQ (mg/kg)
No of samples
below LOQ
Minimum (mg/kg)
Maximum (mg/kg)
Mean (mg/kg)
Median (mg/kg)
Acrylamide 59 0.021 0 0.034 0.59 0.25 0.23
3.4.14.2. Hojicha ‘roasted green tea’ (tea leaves)
Acrylamide
Table 107 Analytical results of acrylamide in Hojicha ‘roasted green tea’ (tea leaves) (2014)
Chemical name
No of samples
LOQ (mg/kg)
No of samples
below LOQ
Minimum (mg/kg)
Maximum (mg/kg)
Mean (mg/kg)
Median (mg/kg)
Acrylamide 60 0.021 0 0.12 0.98 0.41 0.33
3.4.14.3. Coffee (beans and soluble/instant)
Acrylamide
Table 108 Analytical results of acrylamide in coffee (beans and soluble/instant) (2014)
Food No of
samples LOQ
(mg/kg)
No of samples
below LOQ
Minimum (mg/kg)
Maximum (mg/kg)
Mean (mg/kg)
Median (mg/kg)
Roasted
coffee beans 60 0.021 0 0.059 0.34 0.22 0.24
Soluble
coffee/Instant
coffee
60 0.021 0 0.31 1.1 0.59 0.58

117
3.4.14.4. Fruits drinks29
Metals
Table 109 Analytical results of metals in fruits drinks (2013)
Chemical name
No of samples
LOQ (mg/kg)
No of samples
below LOQ
Minimum (mg/kg)
Maximum (mg/kg)
Mean (mg/kg)
Median (mg/kg)
Lead 30 0.01 29 < 0.01 0.01 0.01 -
Cadmium 30 0.01 29 < 0.01 0.03 0.01 -
Total mercury 30 0.01 30 - - 0.01 -
Total arsenic 30 0.01 25 < 0.01 0.03 0.01 -
29 fruit juices without added sugars (including mixed juices)

118
3.4.15. Seasonings
3.4.15.1. Vinegar
|Mycotoxins
Table 110 Analytical results of mycotoxins in sugarcane vinegar (2014)
Chemical name
No of samples
LOQ (µg/kg)
No of samples
below LOQ
Minimum (µg/kg)
Maximum (µg/kg)
Mean (µg/kg)
Median (µg/kg)
Total aflatoxins* 4 - 4 - - 0 -
Aflatoxin B1 4 0.03 4 - - 0.03 -
Aflatoxin B2 4 0.03 4 - - 0.03 -
Aflatoxin G1 4 0.04 4 - - 0.04 -
Aflatoxin G2 4 0.03 4 - - 0.03 -
*An aflatoxin concentration below the LOQ was set equal to zero.
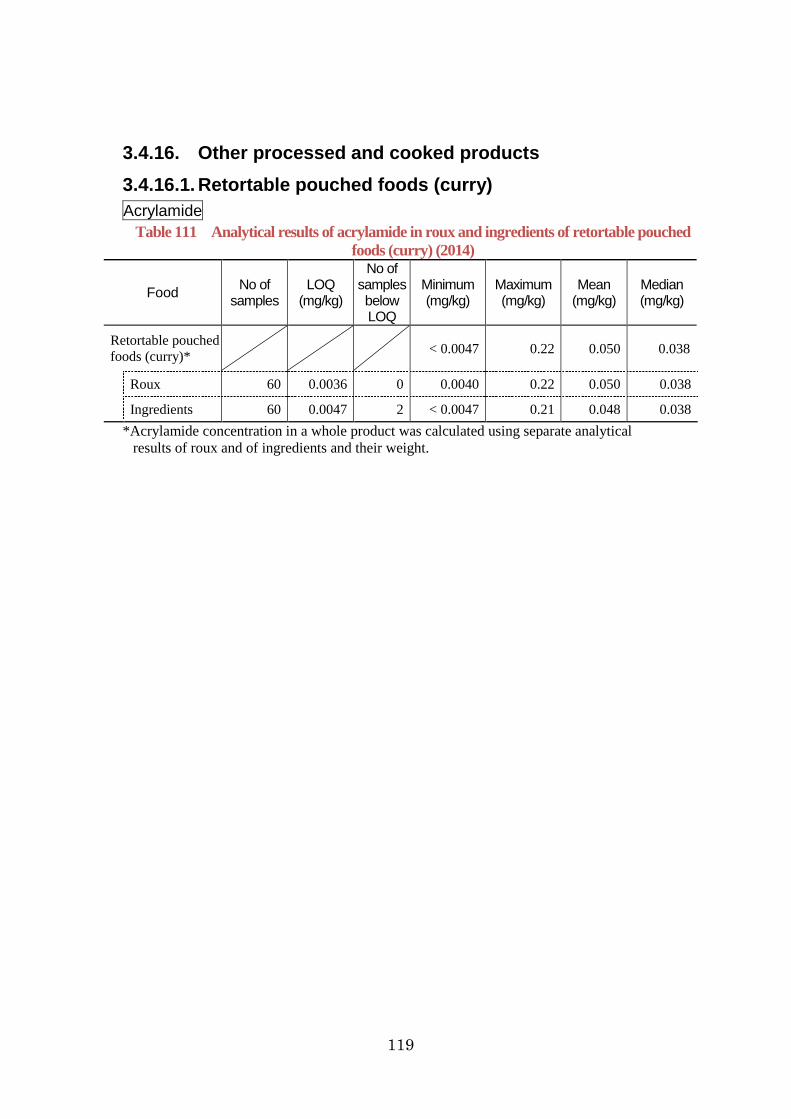
119
3.4.16. Other processed and cooked products
3.4.16.1. Retortable pouched foods (curry)
Acrylamide
Table 111 Analytical results of acrylamide in roux and ingredients of retortable pouched
foods (curry) (2014)
Food No of
samples LOQ
(mg/kg)
No of samples below LOQ
Minimum (mg/kg)
Maximum (mg/kg)
Mean (mg/kg)
Median (mg/kg)
Retortable pouched
foods (curry)* < 0.0047 0.22 0.050 0.038
Roux 60 0.0036 0 0.0040 0.22 0.050 0.038
Ingredients 60 0.0047 2 < 0.0047 0.21 0.048 0.038
*Acrylamide concentration in a whole product was calculated using separate analytical
results of roux and of ingredients and their weight.
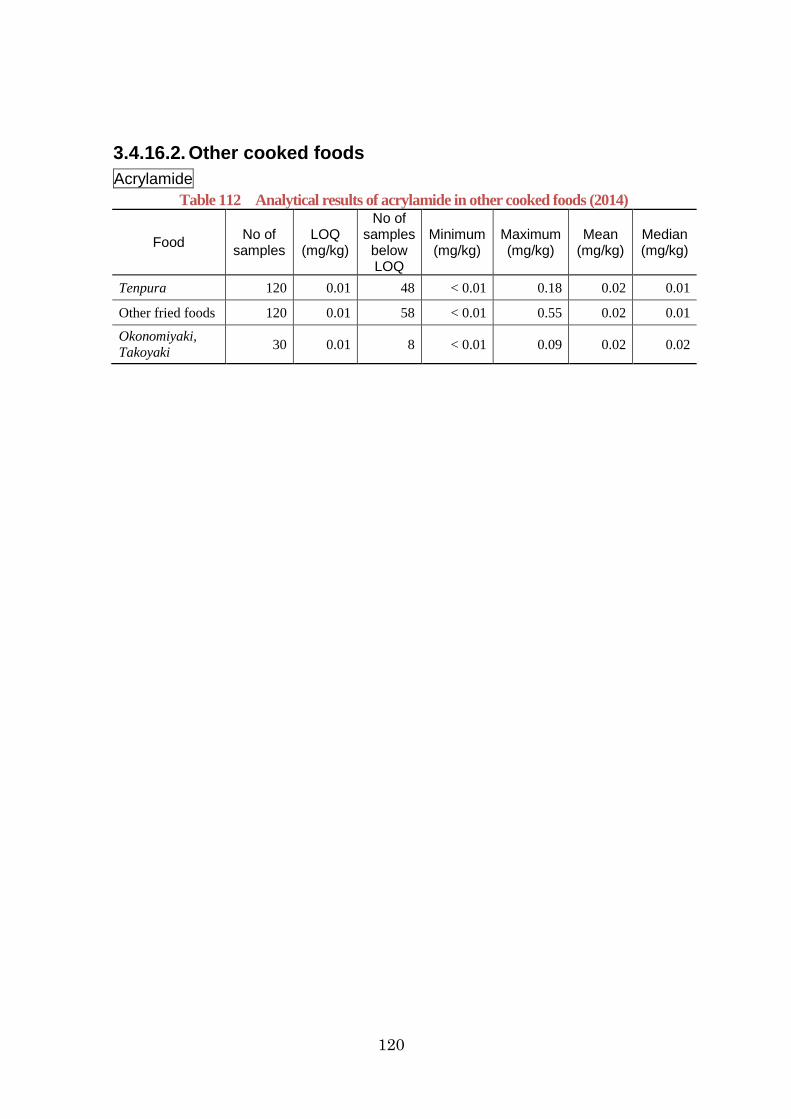
120
3.4.16.2. Other cooked foods
Acrylamide
Table 112 Analytical results of acrylamide in other cooked foods (2014)
Food No of
samples LOQ
(mg/kg)
No of samples
below LOQ
Minimum (mg/kg)
Maximum (mg/kg)
Mean (mg/kg)
Median (mg/kg)
Tenpura 120 0.01 48 < 0.01 0.18 0.02 0.01
Other fried foods 120 0.01 58 < 0.01 0.55 0.02 0.01
Okonomiyaki,
Takoyaki 30 0.01 8 < 0.01 0.09 0.02 0.02

121
3.5. Others
Polybrominated diphenyl ethers (PBDEs)
Table 113 Names and abbreviations of the target PBDEs
Name Abbreviation
Tribromide
(3 types) 2,2',4-tribromodiphenyl ether BDE17
2,4,4'-tribromodiphenyl ether BDE28
2',3,4-tribromodiphenyl ether BDE33
Tetrabromide
(5 types) 2,2',4,4'-tetrabromodiphenyl ether BDE47
2,2',4,5'-tetrabromodiphenyl ether BDE49
2,3',4,4'-tetrabromodiphenyl ether BDE66
2,3',4',6-tetrabromodiphenyl ether BDE71
3,3',4,4'-tetrabromodiphenyl ether BDE77
Pentabromide
(9 types) 2,2',3,4,4'-pentabromodiphenyl ether BDE85
2,2',4,4',5-pentabromodiphenyl ether BDE99
2,2',4,4',6-pentabromodiphenyl ether BDE100
2,3,3',4,4'-pentabromodiphenyl ether BDE105
2,3,4,5,6-pentabromodiphenyl ether BDE116
2,3',4,4',5-pentabromodiphenyl ether BDE118
2,3',4,4',6-pentabromodiphenyl ether BDE119
2,3',4,5,5'-pentabromodiphenyl ether BDE120
3,3',4,4'5-pentabromodiphenyl ether BDE126
Hexabromide
(5 types) 2,2',3,4,4',5'-hexabromodiphenyl ether BDE138
2,2',4,4',5,5'-hexabromodiphenyl ether BDE153
2,2',4,4',5,6'-hexabromodiphenyl ether BDE154
2,2',4,4',6,6'-hexabromodiphenyl ether BDE155
2,3,3',4,4',5-hexabromodiphenyl ether BDE156
Heptabromide
(3 types) 2,2',3,4,4',5',6-heptabromodiphenyl ether BDE183
2,2',3,4,4',6,6'-heptabromodiphenyl ether BDE184
2,3,3',4,4',5'6-heptabromodiphenyl ether BDE191
Octabromide
(3 types) 2,2',3,3',4,4',5,6-octabromodiphenyl ether BDE196
2,2',3,3',4,4',6,6'-octabromodiphenyl ether BDE197
2,2',3,4,4',5,5',6-octabromodiphenyl ether BDE203
Nonabromide
(2 types) 2,2',3,3',4,4',5,5',6-nonabromodiphenyl ether BDE206
2,2',3,3',4,4',5,6,6'-nonabromodiphenyl ether BDE207
Decabromide
(1 type) 2,2',3,3',4,4',5,5',6,6'-decabromodiphenyl ether BDE209

122
Table 114 Analytical results of PBDEs in each food group
(average concentration (LB) – average concentration (UB) : ng/kg) (2012-2014)
Chemical name
Ce
rea
ls
Po
tato
es
an
d
sta
rch
es
Sugars a
nd
sweete
ners
Pulse
s
Nu
ts a
nd
se
ed
s
Ve
ge
table
s
Fru
its
Mu
sh
roo
ms
Alg
ae
BDE17 0-0.8 0-1 0-1 0-0.8 0-0.8 0-0.8 0-0.8 0-1 0-0.8
BDE28 0-0.8 0-1 0-1 0-0.8 0-0.9 0-0.8 0-0.8 0-1 0.2-1.7
BDE33 0-0.8 0-1 0-1 0-0.8 0-0.9 0-0.8 0-0.8 0-1 0.2-1.7
BDE47 0-1.2 0-1 0-1 0-1.1 0-1.6 0-1.1 0-1.0 0-1 2.2-2.5
BDE49 0-0.8 0-1 0-1 0-0.8 0-0.8 0-0.8 0-0.8 0-1 0-1.6
BDE66 0-0.8 0-1 0-1 0-0.8 0-0.8 0-0.8 0-0.8 0-1 0-0.8
BDE71 0-0.8 0-1 0-1 0-0.8 0-0.8 0-0.8 0-0.8 0-1 0-0.8
BDE77 0-0.8 0-1 0-1 0-0.8 0-0.8 0-0.8 0-0.8 0-1 0-0.8
BDE85 0-0.8 0-1 0-1 0-0.8 0-0.8 0-0.8 0-0.8 0-1 0-0.8
BDE99 0-1.2 0-1 0-1 0-1.0 0-1.1 0-0.8 0-0.8 0-1 0-1.4
BDE100 0-0.8 0-1 0-1 0-0.8 0-0.8 0-0.8 0-0.8 0-1 0-0.8
BDE105 0-0.8 0-1 0-1 0-0.8 0-0.8 0-0.8 0-0.8 0-1 0-0.8
BDE116 0-0.8 0-1 0-1 0-0.8 0-0.8 0-0.8 0-0.8 0-1 0-0.8
BDE118 0-0.8 0-1 0-1 0-0.8 0-0.8 0-0.8 0-0.8 0-1 0-0.8
BDE119 0-1.4 0-1 0-1 0-1.4 0-1.4 0-1.4 0-1.4 0-1 0-1.4
BDE120 0-1.4 0-1 0-1 0-1.4 0-1.4 0-1.4 0-1.4 0-1 0-1.4
BDE126 0-0.8 0-1 0-1 0-0.8 0-0.8 0-0.8 0-0.8 0-1 0-0.8
BDE138 0-0.8 0-1 0-1 0-0.8 0-0.8 0-0.8 0-0.8 0-1 0-0.8
BDE153 0-0.8 0-1 0-1 0-0.8 0-0.8 0-0.8 0-0.8 0-1 0-0.8
BDE154 0-0.8 0-1 0-1 0-0.8 0-0.8 0-0.8 0-0.8 0-1 0-0.8
BDE155 0-0.8 0-1 0-1 0-0.8 0-0.8 0-0.8 0-0.8 0-1 0-0.8
BDE156 0-0.8 0-1 0-1 0-0.8 0-0.8 0-0.8 0-0.8 0-1 0-0.8
BDE183 0-0.8 0-1 0-1 0-0.8 0-1.1 0-1.2 0-1.0 0-1 0-0.8
BDE184 0-0.8 0-1 0-1 0-0.8 0-0.8 0-0.8 0-0.8 0-1 0-0.8
BDE191 0-0.8 0-1 0-1 0-0.8 0-0.8 0-0.8 0-0.8 0-1 0-0.8
BDE196 0-1.0 0-1 0-1 0-0.8 1.2-1.9 0-0.8 0-0.8 0-1 0-0.8
BDE197 0-0.8 0-1 0-1 0-0.8 0.6-1.2 0-1.0 0-0.8 0-1 0-0.8
BDE203 0-0.8 0-1 0-1 0-0.8 1.6-2.2 0-0.8 0-0.8 0-1 0-0.8
BDE206 0.5-1.6 0-1 0-1 1.3-1.8 9.8-10 1.0-1.6 0-0.9 0-1 1.7-2.0
BDE207 0.8-1.4 0-1 0-1 0.2-1.8 10-11 0.6-1.3 0-0.7 0-1 1.4-2.0
BDE209 19-25 0-2 0-2 28 79 17 3.6-4.4 0-1 27
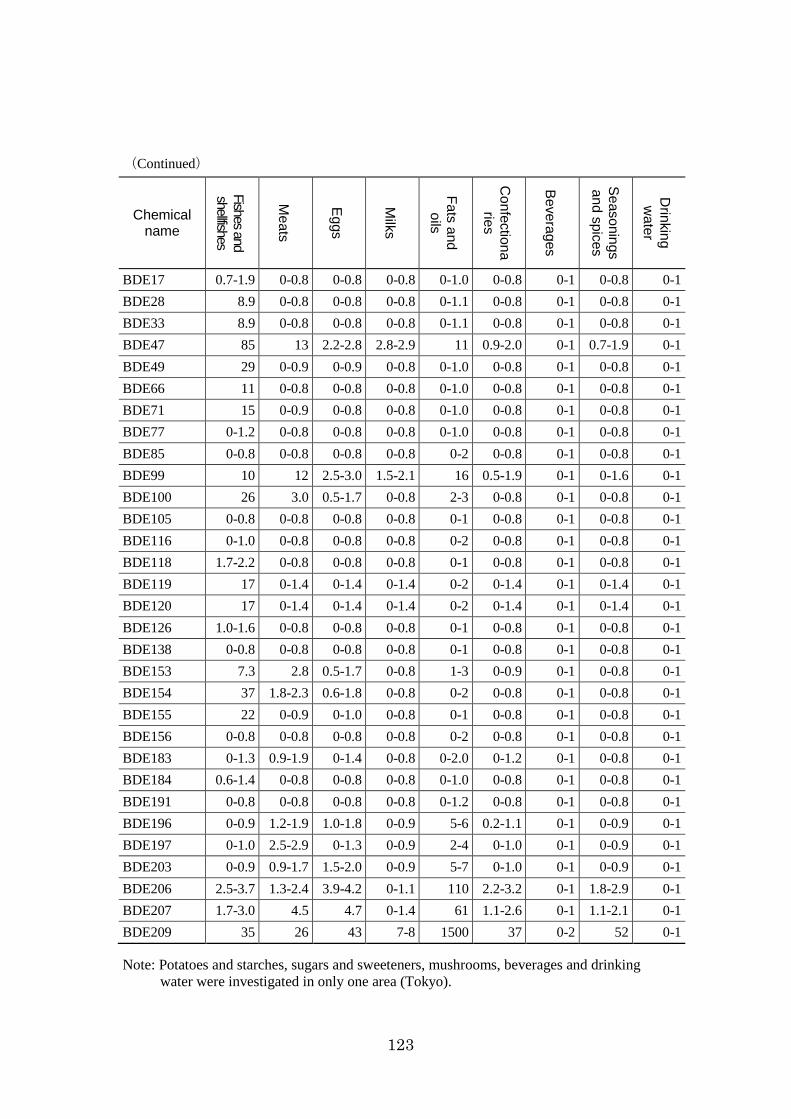
123
(Continued)
Chemical name
Fish
es a
nd
shellfish
es
Me
ats
Eg
gs
Milk
s
Fa
ts a
nd
o
ils
Co
nfe
ctio
na
ries
Be
ve
rag
es
Se
aso
nin
gs
an
d s
pic
es
Drin
kin
g
wa
ter
BDE17 0.7-1.9 0-0.8 0-0.8 0-0.8 0-1.0 0-0.8 0-1 0-0.8 0-1
BDE28 8.9 0-0.8 0-0.8 0-0.8 0-1.1 0-0.8 0-1 0-0.8 0-1
BDE33 8.9 0-0.8 0-0.8 0-0.8 0-1.1 0-0.8 0-1 0-0.8 0-1
BDE47 85 13 2.2-2.8 2.8-2.9 11 0.9-2.0 0-1 0.7-1.9 0-1
BDE49 29 0-0.9 0-0.9 0-0.8 0-1.0 0-0.8 0-1 0-0.8 0-1
BDE66 11 0-0.8 0-0.8 0-0.8 0-1.0 0-0.8 0-1 0-0.8 0-1
BDE71 15 0-0.9 0-0.8 0-0.8 0-1.0 0-0.8 0-1 0-0.8 0-1
BDE77 0-1.2 0-0.8 0-0.8 0-0.8 0-1.0 0-0.8 0-1 0-0.8 0-1
BDE85 0-0.8 0-0.8 0-0.8 0-0.8 0-2 0-0.8 0-1 0-0.8 0-1
BDE99 10 12 2.5-3.0 1.5-2.1 16 0.5-1.9 0-1 0-1.6 0-1
BDE100 26 3.0 0.5-1.7 0-0.8 2-3 0-0.8 0-1 0-0.8 0-1
BDE105 0-0.8 0-0.8 0-0.8 0-0.8 0-1 0-0.8 0-1 0-0.8 0-1
BDE116 0-1.0 0-0.8 0-0.8 0-0.8 0-2 0-0.8 0-1 0-0.8 0-1
BDE118 1.7-2.2 0-0.8 0-0.8 0-0.8 0-1 0-0.8 0-1 0-0.8 0-1
BDE119 17 0-1.4 0-1.4 0-1.4 0-2 0-1.4 0-1 0-1.4 0-1
BDE120 17 0-1.4 0-1.4 0-1.4 0-2 0-1.4 0-1 0-1.4 0-1
BDE126 1.0-1.6 0-0.8 0-0.8 0-0.8 0-1 0-0.8 0-1 0-0.8 0-1
BDE138 0-0.8 0-0.8 0-0.8 0-0.8 0-1 0-0.8 0-1 0-0.8 0-1
BDE153 7.3 2.8 0.5-1.7 0-0.8 1-3 0-0.9 0-1 0-0.8 0-1
BDE154 37 1.8-2.3 0.6-1.8 0-0.8 0-2 0-0.8 0-1 0-0.8 0-1
BDE155 22 0-0.9 0-1.0 0-0.8 0-1 0-0.8 0-1 0-0.8 0-1
BDE156 0-0.8 0-0.8 0-0.8 0-0.8 0-2 0-0.8 0-1 0-0.8 0-1
BDE183 0-1.3 0.9-1.9 0-1.4 0-0.8 0-2.0 0-1.2 0-1 0-0.8 0-1
BDE184 0.6-1.4 0-0.8 0-0.8 0-0.8 0-1.0 0-0.8 0-1 0-0.8 0-1
BDE191 0-0.8 0-0.8 0-0.8 0-0.8 0-1.2 0-0.8 0-1 0-0.8 0-1
BDE196 0-0.9 1.2-1.9 1.0-1.8 0-0.9 5-6 0.2-1.1 0-1 0-0.9 0-1
BDE197 0-1.0 2.5-2.9 0-1.3 0-0.9 2-4 0-1.0 0-1 0-0.9 0-1
BDE203 0-0.9 0.9-1.7 1.5-2.0 0-0.9 5-7 0-1.0 0-1 0-0.9 0-1
BDE206 2.5-3.7 1.3-2.4 3.9-4.2 0-1.1 110 2.2-3.2 0-1 1.8-2.9 0-1
BDE207 1.7-3.0 4.5 4.7 0-1.4 61 1.1-2.6 0-1 1.1-2.1 0-1
BDE209 35 26 43 7-8 1500 37 0-2 52 0-1
Note: Potatoes and starches, sugars and sweeteners, mushrooms, beverages and drinking
water were investigated in only one area (Tokyo).

124
Table 115 Analytical results of PBDEs in husked rice (2014)
Chemical name
No of samples
LOQ (ng/kg)
No of samples
below LOQ
Minimum (ng/kg)
Maximum (ng/kg)
Mean (ng/kg)
Median (ng/kg)
BDE47 10 1 10 - - 1 -
BDE85 10 1 10 - - 1 -
BDE99 10 1 10 - - 1 -
BDE100 10 1 10 - - 1 -
BDE153 10 1 10 - - 1 -
BDE154 10 1 10 - - 1 -
BDE183 10 1 10 - - 1 -
BDE196 10 2 10 - - 2 -
BDE197 10 2 10 - - 2 -
BDE203 10 2 10 - - 2 -
BDE206 10 2 10 - - 2 -
BDE207 10 2 10 - - 2 -
BDE209 10 3 10 - - 3 -
Table 116 Analytical results of PBDEs in polished rice (2014)
Chemical name
No of samples
LOQ (ng/kg)
No of samples
below LOQ
Minimum (ng/kg)
Maximum (ng/kg)
Mean (ng/kg)
Median (ng/kg)
BDE47 30 1 29 < 1 1 1 -
BDE85 30 1 30 - - 1 -
BDE99 30 1 30 - - 1 -
BDE100 30 1 30 - - 1 -
BDE153 30 1 30 - - 1 -
BDE154 30 1 30 - - 1 -
BDE183 30 1 30 - - 1 -
BDE196 30 2 30 - - 2 -
BDE197 30 2 30 - - 2 -
BDE203 30 2 30 - - 2 -
BDE206 30 2 30 - - 2 -
BDE207 30 2 30 - - 2 -
BDE209 30 3 30 - - 3 -
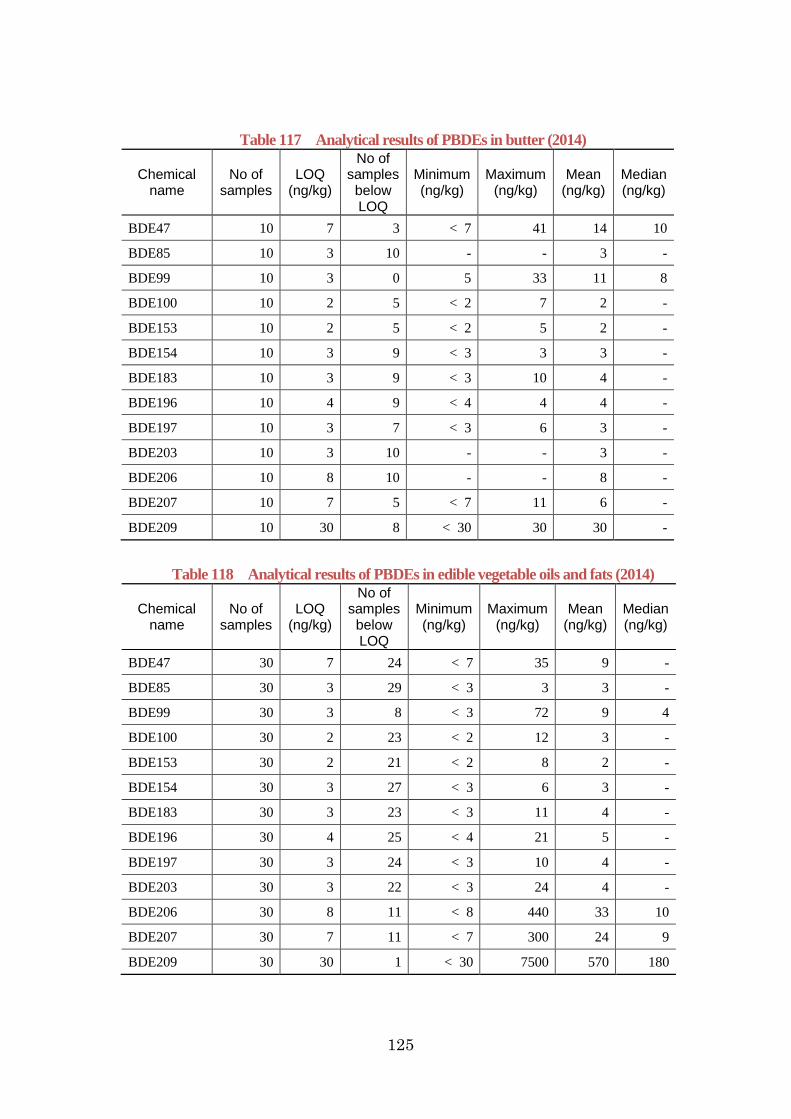
125
Table 117 Analytical results of PBDEs in butter (2014)
Chemical name
No of samples
LOQ (ng/kg)
No of samples
below LOQ
Minimum (ng/kg)
Maximum (ng/kg)
Mean (ng/kg)
Median (ng/kg)
BDE47 10 7 3 < 7 41 14 10
BDE85 10 3 10 - - 3 -
BDE99 10 3 0 5 33 11 8
BDE100 10 2 5 < 2 7 2 -
BDE153 10 2 5 < 2 5 2 -
BDE154 10 3 9 < 3 3 3 -
BDE183 10 3 9 < 3 10 4 -
BDE196 10 4 9 < 4 4 4 -
BDE197 10 3 7 < 3 6 3 -
BDE203 10 3 10 - - 3 -
BDE206 10 8 10 - - 8 -
BDE207 10 7 5 < 7 11 6 -
BDE209 10 30 8 < 30 30 30 -
Table 118 Analytical results of PBDEs in edible vegetable oils and fats (2014)
Chemical name
No of samples
LOQ (ng/kg)
No of samples
below LOQ
Minimum (ng/kg)
Maximum (ng/kg)
Mean (ng/kg)
Median (ng/kg)
BDE47 30 7 24 < 7 35 9 -
BDE85 30 3 29 < 3 3 3 -
BDE99 30 3 8 < 3 72 9 4
BDE100 30 2 23 < 2 12 3 -
BDE153 30 2 21 < 2 8 2 -
BDE154 30 3 27 < 3 6 3 -
BDE183 30 3 23 < 3 11 4 -
BDE196 30 4 25 < 4 21 5 -
BDE197 30 3 24 < 3 10 4 -
BDE203 30 3 22 < 3 24 4 -
BDE206 30 8 11 < 8 440 33 10
BDE207 30 7 11 < 7 300 24 9
BDE209 30 30 1 < 30 7500 570 180

126
Table 119 Analytical results of PBDEs in margarine and shortening (2014)
Chemical name
No of samples
LOQ (ng/kg)
No of samples
below LOQ
Minimum (ng/kg)
Maximum (ng/kg)
Mean (ng/kg)
Median (ng/kg)
BDE47 10 7 8 < 7 25 9 -
BDE85 10 3 10 - - 3 -
BDE99 10 3 5 < 3 19 5 -
BDE100 10 2 8 < 2 3 2 -
BDE153 10 2 8 < 2 2 2 -
BDE154 10 3 10 - - 3 -
BDE183 10 3 9 < 3 3 3 -
BDE196 10 4 9 < 4 4 4 -
BDE197 10 3 10 - - 3 -
BDE203 10 3 5 < 3 4 3 -
BDE206 10 8 5 < 8 30 10 -
BDE207 10 7 4 < 7 33 11 8
BDE209 10 30 0 40 490 140 70

127
Perfluorooctanoic acid (PFOA) and perfluorooctane sulfonic acid (PFOS)
Table 120 Analytical results of perfluorooctanoic acid (PFOA) in each food
group (2012-2014)
Food group name No of
surveyed areas
LOD (ng/kg)
LOQ (ng/kg)
Mean (ng/kg)
(LB)
Mean (ng/kg)
(UB)
Cereals 4 6-30 15-70 0 14
Potatoes and starches 1 30 70 0* 30*
Sugars and sweeteners 1 20 50 0* 20*
Pulses 4 6-30 15-70 0 14
Nuts and seeds 4 6-30 15-70 0 14
Vegetables 4 6-30 15-70 0 14
Fruits 4 6-30 15-70 0 19
Mushrooms 1 30 70 0* 30*
Algae 4 6-30 15-70 36 44
Fishes and shellfishes 4 6-40 15-90 45 69
Meats 4 6-40 15-90 4 18
Eggs 4 6-40 15-90 0 16
Milks 4 8-40 15-90 0 16
Fats and oils 4 6-40 15-110 0 16
Confectionaries 4 9-40 16-90 0 17
Beverages 1 20 50 0* 20*
Seasonings and spices 4 6-40 15-90 0 16
Drinking water 1 2 5 0* 2*
*Results of one surveyed area.

128
Table 121 Analytical results of perfluorooctane sulfonic acid (PFOS) in each food group
(2012-2014)
Food group name No of
surveyed areas
LOD (ng/kg)
LOQ (ng/kg)
Mean (ng/kg)
(LB)
Mean (ng/kg)
(UB)
Cereals 4 3-20 9-40 0 8
Potatoes and starches 1 20 40 0* 20*
Sugars and sweeteners 1 20 30 0* 20*
Pulses 4 4-20 9-40 0 8
Nuts and seeds 4 5-20 9-40 0 9
Vegetables 4 4-20 9-40 0 8
Fruits 4 4-20 9-40 0 10
Mushrooms 1 20 40 0* 20*
Algae 4 3-20 9-40 5 15
Fishes and shellfishes 4 3-20 9-40 440 440
Meats 4 4-20 9-40 10 17
Eggs 4 5-20 9-40 0 14
Milks 4 3-20 9-40 0 8
Fats and oils 4 3-10 9-30 0 6
Confectionaries 4 4-20 9-40 0 9
Beverages 1 20 30 0* 20*
Seasonings and spices 4 4-20 9-40 0 10
Drinking water 1 3 8 0* 3*
*Results of one surveyed area.

129
4. Sampling and methods of analysis
Sampling and principles of methods of analysis used to obtain the analytical results
are as follows.
4.1. Metals
4.1.1. Cadmium
Wheat, Soybeans (dry)
Sampling
National surveillance (collected from warehouses (e.g. country elevators))
Principle of method of analysis
Atomic Absorption Spectrometry (Reference: AOAC Official Method 999.11)
4.1.2. Cadmium, Lead, Mercury, Arsenic
Sampling
Citrus fruits, European pear, Biwa ‘loquats’, Stone fruits, Berries and other small
fruits, Tropical and subtropical fruits, Cattle milk, Dairy products, Infant formula
(powder) and similar products, Fruits drinks
National surveillance (purchased from retailers)
Canned fruits
National surveillance (purchased from retailers and food producers)
Ready-to-eat hijiki-based products, Ready-to-eat hijiki-based products for infants
National surveillance (purchased from retailers)
Principle of method of analysis
Citrus fruits, European pear, Biwa ‘loquats’, Stone fruits, Berries and other small
fruits, Tropical and subtropical fruits, Cattle milk, Dairy products, Infant formula
(powder) and similar products, Fruits drinks,
ICP-MS
Ready-to-eat hijiki-based products, Ready-to-eat hijiki-based products for infants
Total arsenic

130
ICP-MS
Inorganic arsenic
HPLC-ICP-MS
131
4.2. Mycotoxins
Sampling
Wheat, Barley
National surveillance (collected from warehouses (e.g. country elevators))
Azuki bean, Kidney bean
National surveillance (purchased from retailers)
Peanuts, Roasted peanuts with shell, Roasted peanuts without shell, Peanut butter
National surveillance (purchased from retailers)
Brown sugar, Wasanbonto (traditional non-centrifugal soft white cane sugar),
Tomitsu ‘sugar syrup including molasses’, Sugarcane vinegar
National surveillance (purchased from retailers)
4.2.1. DON, NIV, their acetylated derivatives
Principle of method of analysis
GC-MS
4.2.2. T-2 toxin, HT-2 Toxin, Zearalenone
Principle of method of analysis
LC-MS/MS (Reference: Nakagawa et al., 201430)
4.2.3. Aflatoxins
Principle of method of analysis
Barley, Peanut, Roasted peanuts with shell, Roasted peanuts without shell, Peanut
butter
HPLC-FL
(Reference: “Test Methods Related to Total Aflatoxin”, Director Notice
Syoku-An No. 0816-2, dated August 16, 2011, Ministry of Health, Labour and
Welfare)
30 Nakagawa, et al. 2014. Harmonized collaborative validation of a simultaneous and
multiple determination method for nivalenol, deoxynivalenol, T-2 toxin, HT-2 toxin, and
zearalenone in wheat and barley by liquid chromatography coupled to tandem mass
spectrometry(LC-MS/MS).

132
Brown sugar, Wasanbonto (traditional non-centrifugal soft white cane sugar),
Tomitsu ‘sugar syrup including molasses’, Sugarcane vinegar
HPLC-FL
(Reference: “Test Methods Related to Total Aflatoxin”, Director Notice
Syoku-An No. 0816-2, dated August 16, 2011, Minitsry of Health, Labour and
Welfare)
4.2.4. Ochratoxin A
Principle of method of analysis
HPLC-FL
(Reference: AOAC Official Method 2000.03)

133
4.3. Dioxins
Sampling
Agricultural products
National surveillance (collected from the fields of prefectural agricultural
experiment stations)
Livestock products
National surveillance (purchased from retailers)
Fishery products
National surveillance (collected from fishery cooperatives)
Muscle part analyzed (head, viscera, bones and skin were removed)
Principle of method of analysis
GC-MS
(Reference: The interim guidelines of method of analysis for dioxins in foods”
in February 2008 by the Ministry of Health, Labour and Welfare.)
134
4.4. PBDEs
Sampling
Market basket study
Purchased from retailers in each city (Tokyo, Nagoya, Osaka, Fukuoka)
Preparation
Cooked and/or prepared if necessary.
Mixed/homogenized in proportion to consumption amount for each food group.

135
Table 122 The content and sample amount of total diet study
Large Classification
No.
Large Classification
Total sample
amount (g)
Medium Classification
Sample amount of medium
classification (g)
Small Classification
Sample amount of
small classification
(g)
Foods Sample
amount of food (g)
1 Cereals 500
Rice and Rice
products 572
Rice 750 Well-milled rice 750
Rice products 12 Rice cake 12
Wheat flour
and Wheat
products
162
Wheat flour 8 Soft flour 8
Breads (except Japanese
buns) 68 White table bread 68
Japanese buns 13 Custard cream bun 13
Japanese noodles and
Chinese noodles 86 Udon (boiled) 86
Precooked noodles 10 Chinese style instant cup
noodles (dried by frying) 10
Macaroni and Spaghetti 20 Spaghetti (dry) 20
Other wheat products 11 Bread crumbs 11
Other cereals
and Other
cereal products
17
Buckwheat and
Buckwheat products 15
Buckwheat noodles
(boiled) 15
Corn and Corn products 1 Sweet corn (raw, canned
or frozen) 1
Other cereals 6 Job’s tears 6
2 Potatoes and
Starches 500
Potatoes and
Potato products 725
Sweet potatoes and Sweet
potato products 131 Sweet potatoes 131
Potatoes and Potato
products 464 Potatoes 464
Other potatoes and Potato
products 372 Satoimo 372

136
Large Classification
No.
Large Classification
Total sample
amount (g)
Medium Classification
Sample amount of medium
classification (g)
Small Classification
Sample amount of
small classification
(g)
Foods Sample
amount of food (g)
2 Potatoes and
Starches 500
Starches and
Starch
products
25 33 Corn starch 33
3 Sugars and
Sweeteners 100
Sugars and
Sweeteners 200 Sugars and Sweeteners 200 Soft sugar (white) 200
4 Pulses 500
Soybeans and
Soybean
products
731
Soybeans (whole beans)
and its products 27 Soybeans (dry) 27
“Tofu” (Bean curd) 626 Kinugoshi-tofu (tofu with
whey) 626
“Abura-age” 137 Abura-age (fried thin
slices of pressed tofu) 137
“Natto” (Fermented
soybeans) 110
Itohiki-natto (fermented
whole soybean) 110
Other soybean products 75 Soy milk 75
Other pulses
and Pulse
products
19 25 Azuki beans (boiled) 25
5 Nuts and Seeds 200 Nuts and Seeds 400 Nuts and Seeds 400 Peanuts, Almonds,
Sesame seeds 400
6 Vegetables 500
Green and
yellow
vegetables
248
Tomatoes 56 Tomatoes 56
Carrots 69 Carrot 69
Spinach 64 Spinach (boiled) 64
Sweet peppers 14 Green sweet pepper 14
Other green and yellow
vegetables 128
Pumpkin (cucurbita maxima)
128

137
Large Classification
No.
Large Classification
Total sample
amount (g)
Medium Classification
Sample amount of medium
classification (g)
Small Classification
Sample amount of
small classification
(g)
Foods Sample
amount of food (g)
6 Vegetables 500
Other
vegetables 441
Cabbages 85 Cabbage 85
Cucumber 31 Cucumber 31
Daikon (Japanese
radishes) 133
Daikon (Japanese
radishes) 133
Onions 104 Onions 104
Chinese cabbage 73 Chinese cabbage 73
Other vegetables 162 Lettuce 162
Vegetable
juices 23 30
Tomato juice (canned
product) 30
Pickles 39
Leaf pickles 18 Chinese cabbage (salted
pickles) 18
Other pickles 34
Shiooshidaikon-zuke
(produced by new
processing)
34
7 Fruits 500
Fruits 678
Strawberries 1 Strawberries 1
Citrus fruits 216 Satsuma mandarin 216
Bananas 146 Bananas 146
Apples 200 Apples 200
Other fruits 341 Watermelon, Melon,
Peaches, others 341
Jams 8 Jams 10 Blueberry jam 10
Fruit juices and
Fruit juice beverages
65 Fruit juices and Fruit juice
beverages 86
Valencia (reconstituted
fruit juice) 86

138
Large Classification
No.
Large Classification
Total sample
amount (g)
Medium Classification
Sample amount of medium
classification (g)
Small Classification
Sample amount of
small classification
(g)
Foods Sample
amount of food (g)
8 Mushrooms 200 Mushrooms 400 Mushrooms 400 Winter mushroom 400
9 Algae 200 Algae 400 Algae 400
Purple laver (dry), Kombu
(dry), Wakame (raw, or
dried and soaked in water)
400
10 Fishes and
Shellfishes 500
Raw fishes and
Shellfishes 463
Horse mackerels and
Sardines
46 Horse mackerel (Japanese
horse mackerel, others) 46
46 Sardine (Japanese
anchovy, others) 46
46 Mackerel (Chub
mackerel, others) 46
Salmons and Trouts
28 Salmon (Chum salmon,
others) 28
28 Trout (Pink salmon,
others) 28
Sea breams and Righteye
flounders
34
Sea bream (Red sea
breams, Star snapper,
others)
34
34
Righteye flounder (Brown
sole, Righteye flounder
(with ovary))
34
Tunas, Marlins and
Swordfishes
31
Tuna (Albacore tuna,
Big-eye tuna, Yellowfin
tuna, others)
31
31 Skipjack 31

139
Large Classification
No.
Large Classification
Total sample
amount (g)
Medium Classification
Sample amount of medium
classification (g)
Small Classification
Sample amount of
small classification
(g)
Foods Sample
amount of food (g)
10 Fishes and
Shellfishes 500
Raw fishes and
Shellfishes 463
Other fishes
37 Yellowtail 37
37 Eel 37
37 Spanish mackerel 37
Shellfishes
15 Short-necked clams 15
15 Scallops 15
15 Oyster (Iwagaki oyster,
others) 15
Cephalopods
35 Squid (Japanese common
squid, others) 35
35 Octopus (Common
octopus, others) 35
Prawns, Shrimps and
Crabs
34 Japanese spiny lobster
(raw) 34
34 Horsehair crab (raw) 34
Seafood, and
Processed
products
287
Seafood (salted,
semi-dried and dried)
74 Horse mackerel (salted
and semi-dried split) 74
74 Shirasuboshi (boiled and
dried whitebait) 74
74
Kezuri-bushi (shaved
Katsuo-bushi (boiled,
smoke-dried and molded
skipjack fillet))
74
Seafood (canned) 12 Tuna (canned in oil) 12

140
Large Classification
No.
Large Classification
Total sample
amount (g)
Medium Classification
Sample amount of medium
classification (g)
Small Classification
Sample amount of
small classification
(g)
Foods Sample
amount of food (g)
10 Fishes and
Shellfishes 500
Seafood, and
Processed
products
287
Seafood (canned) 12 Skipjack (canned with
seasoning) 12
Seafood (Tsukudani) 4
Tsukudani (fish or
shellfish simmered whole
in soy sauce and sugar)
4
Seafood (Fish paste
products) 62
Age-kamaboko (fried
kamaboko) 62
Seafood (Fish paste
products) 62
Chikuwa (tubular
kamaboko) 62
Fish hams and Sausages 4 Fish sausage 4
4 Fish ham 4
11 Meats 500
Animal meats 539
Beefs 87
Flank or short plate
(domestic) 87
87 Inside round (domesic) 87
Porks 200 Loin 200
200 Belly 200
Hams and Sausages 71 Vienna sausage 71
71 Loin ham 71
Other animal meats 3 Mutton 3
Poultries 188 Chickens 125 Thigh 125
125 Wing 125

141
Large Classification
No.
Large Classification
Total sample
amount (g)
Medium Classification
Sample amount of medium
classification (g)
Small Classification
Sample amount of
small classification
(g)
Foods Sample
amount of food (g)
11 Meats 500
Poultries 188 Others 1 Aigamo (crossbred duck
(domesticated × wild)) 1
Offals 22 Offals
10 Pork liver 10
10 Chicken liver 10
10 Beef liver 10
Others -
Whale meat 0 - 0
Other meats and
Processed products 0 - 0
12 Eggs 300 Eggs 600 Eggs 600 Chicken eggs (raw) 600
13 Milks 500
Milk and Dairy
products 750
Milk 744 Ordinary liquid milk 744
Cheeses 18 Processed cheese 18
Fermented milk and
Lactic acid bacteria
beverages
179 Yogurt (whole
milk,unsweetened) 179
Other dairy products 59 Ice cream 59
Others 0 0 - 0
14 Fats and Oils 500 750
Butters 95 Salted butter 95
Margarines 105 Fat spread, Margarine 105
Vegetable fats and oils 789 Salad oil 789
Animal fats 11 Beef tallow 11

142
Large Classification
No.
Large Classification
Total sample
amount (g)
Medium Classification
Sample amount of medium
classification (g)
Small Classification
Sample amount of
small classification
(g)
Foods Sample
amount of food (g)
15 Confectioneries 500 Confectioneries 750
Traditional
confectioneries 463
Manju (sweet dough
stuffed with An (Azuki
bean paste))
463
Cakes, Buns and Pastries 244 Short cake 244
15 Confectioneries 500 Confectioneries 750
Biscuits 64 Biscuit (soft) 64
Candies 12 Candies 12
Others 217 Milk chocolate 217
16 Beverages 500
Alcoholic
beverages -
Sake -
Beer -
Wines, Spirits and Others -
Other
beverages 750
Teas 599 Green tea (infusion) 599
Coffees and Cocoas 238 Soluble coffee/instant
coffee (powder) 238
Others 163 Cola drink 163
17 Seasonings and
Spices 500 Seasonings 747
Sauces 20 Worcester sauce (thick
type) 20
Shoyu: soy sauces 168 Koikuchi-syoyu (common
type) 168
Edible salts 14 Common salt 14
Mayonnaise 29 Mayonnaise 29
Miso 123 Rice-koji miso 123

143
Large Classification
No.
Large Classification
Total sample
amount (g)
Medium Classification
Sample amount of medium
classification (g)
Small Classification
Sample amount of
small classification
(g)
Foods Sample
amount of food (g)
17 Seasonings and
Spices 500
Seasonings 747 Other seasonings 643
Ketchup, Katsuo-bushi
extract, Kombu extract,
Mentsuyu (seasoned soy
sauce for Japanese
noodles), others
643
Spices and
Others 2 Spices and Others 3 Curry powder 3
18 Drinking water 2L
500mL
pet bottle×4
and tap water
2L
500mL
pet bottle ×4
and tap water
2L
Mineral water
500mL pet
bottle×4 and
tap water 2L

144
Principle of method of analysis
GC-MS
(Tokyo
Reference: “Method 1614 Brominated diphenyl ethers in water soil, sediment and
tissue by HRGC/HRMS” (EPA-821-R-07-005)
Osaka, Fukuoka, Nagoya
Reference: “The interim guidelines of method of analysis for dioxins in foods” in
February 2008 by the Ministry of Health, Labour and Welfare.)

145
4.5. PFOA and PFOS
Sampling
Preparation Same as PBDEs
Principle of method of analysis LC-MS/MS

146
4.6. Acrylamide
Sampling
Bread and bun (French bread, Soft roll)
National surveillance (purchased from retailers including both whole bakery
products and retail bakery products)
Yaki-fu and Age-fu ‘wheat gluten bread (baked, fried)’, Japanese cakes, Western
style cakes
National surveillance (purchased from retailers)
French fry
National surveillance (purchased from retailers and restaurants)
Uncentrifugal sugar
National surveillance (purchased from retailers including confectionery
ingredients shops)
Processed nut-based products
National surveillance (purchased from retailers)
Biscuits, Snacks, Rice crackers, Infant confectionary, Mugicha ‘barley tea’ (roasted
barley), Hojicha ‘roasted green tea’ (tea leaves), Coffee, Retortable pouched food
National surveillance (purchased from retailers)
Tenpura, Other fried foods, Okonomiyaki, Takoyaki
National surveillance (purchased from retialers and restaurants)
Preparation
Bread and bun, Yaki-fu and Age-fu ‘wheat gluten bread’ (baked, fried), French fries,
Uncentrifugal sugar, Biscuits, Snacks, Rice crackers, Infant confectionary, Mugicha
‘barley tea’ (roasted barley), Hojicha ‘roasted green tea’ (tea leaves), Coffee
Crushed/mixed/homogenized with appropriate tools.
Processed nut-based products
For nuts processed products, outer shells were removed before preparation.
Astringent skin was not removed.
Japanese cakes, Western style cakes
For frozen products, thawing and/or cooking was done following the instruction
on the package before preparation.

147
Retortable pouched food
Warmed with hot water following the instruction on the package. Sauce and
solids were separated with a sieve.
Tenpura, Other fried foods, Okonomiyaki, Takoyaki
For frozen products and chilled products, thawing and/or cooking was done
following the instruction on the package before preparation.
Principle of method of analysis
LC-MS/MS

148
4.7. Polycyclic Aromatic hydrocarbons (PAHs)
Sampling
Processed and cooked meat -based products, Processed and cooked fish -based
products
National surveillance (purchased from retailers and producers.)
Edible vegetable oils
National surveillance (purchased from retailers and online shopping sites.)
Preparation
Processed and cooked meat-based products, Processed and cooked fish -based
products
Non-edible parts such as bones were removed. Scorched parts were included into
edible parts. Cooking was conducted as instruction on the package indicated.
Edible vegetable oils
No preparation
Principle of method of analysis
Processed animal meat products, processed fishery products, Edible charcoal used
as food additives (except for benzo[c]fluorene)
HPLC-UV for cyclopenta [cd] pyrene
HPLC-FL for other PAHs
Processed poultry product
GC-MS
Edible vegetable oils
GC-MS

149
4.8. 3-MCPD fatty acid esters
Sampling
Edible vegetable oils
National surveillance (purchased from retailers and online shopping sites. Palm
oils and coconut oils were obtained through the Japan Oilseed Processors
Association.)
Other foods with a high fat content
National surveillance (purchased from retailers and online shopping sites.)
Preparation
Edible vegetable oils
No preparation
Fish oil supplements
The contents in a capsule were analyzed.
Butter, margarine, shortening, lard, infant formula (powder) and similar products
Extracted fat was served as an analytical sample.
Principle of method of analysis
GC-MS
(Reference: DGF Standard Methods Section C-Fats C-VI 18 (10))

150
4.9. Glycidyl fatty acid esters
Sampling
Edible vegetable oils
National surveillance (purchased from retailers and online shopping sites. Palm
oils and coconut oils were obtained through Japan Oilseed Processors
Association.)
Other foods with a high fat content
National surveillance (purchased from retailers and online shopping sites.)
Preparation
Edible vegetable oils
No preparation
Fish oil supplements
The contents in a capsule were analyzed.
Butter, margarine, shortening, lard, infant formula and similar products
Extracted fat was served as an analytical sample.
Principle of method of analysis
(1) Indirect method
GC-MS
(Reference: Deutsche Gesellschaft für Fettwissenschaft e.V., DGF Standard
Methods Section C-Fats C-VI 18 (10), 2011.)
(2) Direct method
LC-MS
(Reference: AOCS, Joint AOCS/JOCS Official Method Cd28-10 Glycidyl fatty
acid esters in edible oils, 2012.)

151
4.10. Trans fatty acids, Saturated fatty acids, Conjugated
Linoleic Acids (CLA)
Sampling
National surveillance (purchased from retailers and online shopping sites)
Principle of method of analysis
Margarine, Shortening
GC-FID
(Reference: AOCS Official Method Ce 1h-05)
Fat spread, Compound margarine
GC-FID
(Reference: AOCS Official Method Ce 1j-07)

152
4.11. Pesticide residues
Sampling
Collected from farmers
Principle of method of analysis
Methods indicated in Annex of the Director Notice52 (Syoku-An No 0124001, dated January 24, 2005) were used with some modifications. The limits of quantification were at or below one-tenth of the MRLs for each pesticide analyzed in the survey except when the MRLs was established at or below 0.01 mg/kg.
52 http://www.mhlw.go.jp/topics/bukyoku/iyaku/syoku-anzen/zanryu3/siken.html

153
Abbreviations
3-Ac-DON 3-acetyl-deoxynivalenol
15-Ac-DON 15-acetyl-deoxynivalenol
4-Ac-NIV 4-acetyl-nivalenol
Co-PCB coplanar-PCB; dioxin-like PCBs
1,3-DCP 1,3-dichloro-2-propanol
DON deoxynivalenol
ESI electrospray ionization
FID flame ionization detector
GC gas chromatograph
GC-MS gas chromatograph mass spectrometer
GEMS/Food Global Environmental Monitoring System/ Food
Contamination Monitoring and Assessment Programme
HPLC high performance liquid chromatograph
ICP inductively coupled plasma
ICP-MS inductively coupled plasma mass spectrometry
LC liquid chromatograph
LC-MS liquid chromatograph mass spectrometer
LC-MS/MS liquid chromatograph tandem mass spectrometer
3-MCPD 3-chloropropane-1,2-diol
MS mass spectrometer
NIV nivalenol
PAH polycyclic aromatic hydrocarbon
PBDE polybrominated diphenyl ether
PCB polychlorinated biphenyl
PCDD polychlorinated dibenzo-p-dioxin
PCDF polychlorinated dibenzofuran
PFOA perfluorooctanoic acid
PFOS perfluorooctane sulfonic acid
ppm parts per million
TEQ toxic equivalency
UV ultraviolet
WHO World Health Organization