The curve - UBS · 2 To better understand the impact of changing curve shapes on commodity index...
12
a b The curve Commodity Indices and the curve Not for further distribution For Professional Clients and Eligible Counterparties only
Transcript of The curve - UBS · 2 To better understand the impact of changing curve shapes on commodity index...

ab
The curveCommodity Indices and the curve
Not for further distribution For Professional Clients and Eligible Counterparties only
2
To better understand the impact of changing curve shapes on commodity index investments, we have closely examined the performance of commodity indices under different curve conditions.
This report was produced by UBS Investment Bank and UBS Asset Management
Authors: Adam Glen-Bott Portfolio Manager, UBS Asset Management
Ray Fuller, CFA Senior Portfolio Manager, UBS Asset Management
Bahaa Mounzer Quantitative Trading Strategist, UBS Investment Bank
Virat AgarwalHead of Commodities Structuring, UBS Investment Bank
1
1 Source: UBS, Morningstar, as of 31 May 2018
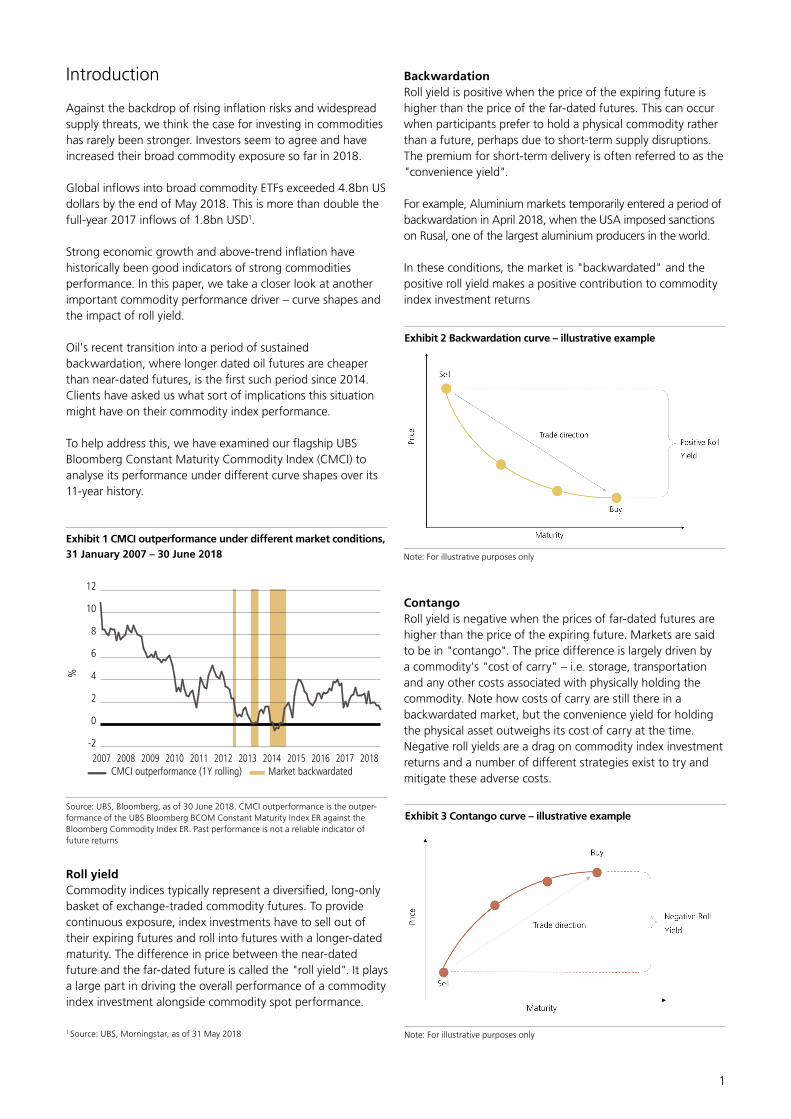
Introduction
Against the backdrop of rising inflation risks and widespread supply threats, we think the case for investing in commodities has rarely been stronger. Investors seem to agree and have increased their broad commodity exposure so far in 2018.
Global inflows into broad commodity ETFs exceeded 4.8bn US dollars by the end of May 2018. This is more than double the full-year 2017 inflows of 1.8bn USD1.
Strong economic growth and above-trend inflation have historically been good indicators of strong commodities performance. In this paper, we take a closer look at another important commodity performance driver – curve shapes and the impact of roll yield.
Oil's recent transition into a period of sustained backwardation, where longer dated oil futures are cheaper than near-dated futures, is the first such period since 2014. Clients have asked us what sort of implications this situation might have on their commodity index performance.
To help address this, we have examined our flagship UBS Bloomberg Constant Maturity Commodity Index (CMCI) to analyse its performance under different curve shapes over its 11-year history.
Roll yieldCommodity indices typically represent a diversified, long-only basket of exchange-traded commodity futures. To provide continuous exposure, index investments have to sell out of their expiring futures and roll into futures with a longer-dated maturity. The difference in price between the near-dated future and the far-dated future is called the "roll yield". It plays a large part in driving the overall performance of a commodity index investment alongside commodity spot performance.
BackwardationRoll yield is positive when the price of the expiring future is higher than the price of the far-dated futures. This can occur when participants prefer to hold a physical commodity rather than a future, perhaps due to short-term supply disruptions. The premium for short-term delivery is often referred to as the "convenience yield".
For example, Aluminium markets temporarily entered a period of backwardation in April 2018, when the USA imposed sanctions on Rusal, one of the largest aluminium producers in the world.
In these conditions, the market is "backwardated" and the positive roll yield makes a positive contribution to commodity index investment returns
ContangoRoll yield is negative when the prices of far-dated futures are higher than the price of the expiring future. Markets are said to be in "contango". The price difference is largely driven by a commodity's "cost of carry" – i.e. storage, transportation and any other costs associated with physically holding the commodity. Note how costs of carry are still there in a backwardated market, but the convenience yield for holding the physical asset outweighs its cost of carry at the time. Negative roll yields are a drag on commodity index investment returns and a number of different strategies exist to try and mitigate these adverse costs.
Exhibit 1 CMCI outperformance under different market conditions, 31 January 2007 – 30 June 2018
-2
0
2
4
6
8
10
12
CMCI outperformance (1Y rolling) Market backwardated201820172016201520142013201220112010200920082007
%
Source: UBS, Bloomberg, as of 30 June 2018. CMCI outperformance is the outper-formance of the UBS Bloomberg BCOM Constant Maturity Index ER against the Bloomberg Commodity Index ER. Past performance is not a reliable indicator of future returns
Exhibit 2 Backwardation curve – illustrative example
Note: For illustrative purposes only
Exhibit 3 Contango curve – illustrative example
Note: For illustrative purposes only

2
Rolling methodologiesFirst generation indices, such as the Bloomberg Commodity Index (BCOM), are a common investment choice. They typically implement a simple "front-month" rolling methodology – this means they hold a single future until it approaches expiry, then roll into a new future slightly further along the curve, and repeat. By contrast, the UBS Bloomberg Constant Maturity Commodity Index (CMCI) aims to mitigate the cost of carry by simultaneously investing at multiple points along the curve and rolling a small portion of its investment every day, thus maintaining a constant maturity. This is an example of a second generation commodity index.
We are going to see whether the CMCI rolling methodology historically outperforms a first generation rolling methodology under different market conditions.For more information on the CMCI rolling methodology, please click here.
Curve shape analysisTo begin our comparison, we construct a curve shape time series for each commodity in our reference index by measuring the slope of the curve around the expiring futures. An upward slope implies negative roll yield, while a downward slope implies positive roll yield. The curve shape time series is presented as a commodity's roll yield on a given day and provides an indication of whether a commodity is in "backwardation" or "contango".
Curve shapes are not consistent across all commodities or through time. Indeed, commodity returns are known to exhibit low intra-asset-class correlations and we see a similar picture for intra-asset-class curve shapes. To combine individual commodity curve shapes, we use the prevailing target weights for the Bloomberg Commodity Index (BCOM) to construct a composite curve shape based on the weighted average of each commodity.
Exhibit 4 shows our BCOM curve shape time series: this is what we use to indicate whether markets are generally in backwardation or contango.
It is immediately apparent that the natural state of broad commodity markets is in contango. In fact, since 2001, markets have been in contango 85% of the time and the average length of a period of contango is 132 days. This compares to states of backwardation which are far less persistent at an average of 23 days.
To see whether curve shape can affect the rolling performance of our broad commodity indices, we measure the relative performance of the CMCI rolling methodology versus the BCOM rolling methodology in each period of contango and backwardation. In sustained contango markets the average annualised outperformance of CMCI is 3.0%, and the average annualised outperformance in sustained backwardation is 0.2%. It is important to note that the backwardation data set is much smaller than the contango data set, so the average outperformance is calculated based on a smaller number of observations.
Our curve shape analysis shows markets have generally exhibited long periods of contango punctuated by short periods of backwardation. Further, our performance analysis supports the merits of the second-generation CMCI rolling methodology in all market curve shapes and especially when markets are in contango.
As contango is the long-term natural state of commodity markets, we can speculate that any outperformance foregone during short periods of backwardation are recovered during the subsequent periods of contango. To investigate this further, we extend our analysis to look at each day in our time series and calculate the relative performance of the CMCI rolling methodology over the subsequent twelve months (imagine looking at the curve shape today, and asking whether the rolling methodology should outperform over the next twelve months, or not).
Exhibit 4 BCOM curve shape, monthly average per calendar month (January 2001 – June 2018)
-0.05
-0.04
-0.03
-0.02
-0.01
0.00
0.01
0.02
BackwardationContango201720152013201120092007200520032001
Source: UBS, Bloomberg, as of 30 June 2018
Backwardation Contango
Number of observations 957 5,423
% of observations 15% 85%
Average curve shape (implied 1-month roll yield) +0.4% -0.8%
Average period length (days) 23 132
Maximal period length (days) 137 1,372
Exhibit 5 Curve shape summary statistics (January 2001 – June 2018)
Source: UBS, Bloomberg, as of 30 June 2018
Markets in sustained backwardation
Markets in sustained contango
Annualised outperformance of CMCI rolling methodology
0.2% 3.0%
Number of days 452 (11%) 3706 (89%)
Exhibit 6 CMCI outperformance in sustained backwardation or sustained contango (January 2001 – June 2018)
Source: UBS, Bloomberg, as of 30 June 2018. CMCI outperformance is the outperformance of the UBS Bloomberg BCOM Constant Maturity Index ER against the Bloomberg Commodity Index ER. Past performance is not a reliable indicator of future returns

3
The results reveal the CMCI rolling methodology consistently outperforms the BCOM rolling methodology (in over 89% of our observations), regardless of curve shape. This seems to support our claim.
Exhibit 7 plots CMCI returns against BCOM returns – points above the straight line indicate CMCI outperformance and the intensity of the colour indicates the strength of backwardation / contango at the start of the twelve month period.
Exhibit 7 Relative performance in backwardation / contango
Periods starting in backwardation Periods starting in contango
Source: UBS, Bloomberg, as of 30 June 2018. CMCI returns are the returns of the UBS Bloomberg BCOM Constant Maturity Index ER. BCOM returns are the returns of the Bloomberg Commodity Index ER. Past performance is not a reliable indicator of future returns
Exhibit 8 12-month relative performance for periods starting in backwardation or contango (January 2007 – June 2018)
Starting point in backwardation Starting point in contango
Number of observations 422 (11%) 3,641 (89%)
Average CMCI roll performance (12 months) +0.1% -5.0%
Average BCOM roll performance (12 months) -1.8% -8.3%
Average outperformance of CMCI rolling methodology (12 months) 1.9% 3.3%
Number of observations where CMCI roll performance is higher than BCOM roll performance 375 (89%) 3,266 (97%)
Source: UBS, Bloomberg, as of 30 June 2018. CMCI roll performance is the relative performance of the UBS Bloomberg BCOM Constant Maturity Index ER and the Bloomberg Commodity Spot Return Index. BCOM roll performance is the relative performance of the Bloomberg Commodity Index ER and the Bloomberg Commodity Spot Return Index. CMCI outperformance is the outperformance of the UBS Bloomberg BCOM Constant Maturity Index ER against the Bloomberg Commodity Index ER. Past performance is not a reliable indicator of future returns

4
The final part of our analysis looks at the historic persistency of outperformance and underperformance of the CMCI rolling methodology.
Exhibit 9 plots the eventual twelve month CMCI outperformance against the CMCI outperformance observed mid-way through the twelve month period (imagine looking at the six-month performance of the CMCI and asking whether it should outperform over a full twelve-month period, or not). In backwardation and contango, there are very few points in the lower left quadrant. This indicates that twelve month performance is usually strong even if the index has underperformed in the first six months of the year.
Source: UBS, Bloomberg, as of 30 June 2018. CMCI outperformance is the outperformance of the UBS Bloomberg BCOM Constant Maturity Index ER against the Bloomberg Commodity Index ER. Past performance is not a reliable indicator of future returns
Exhibit 9 12-month / 6-month CMCI outperformance

5
Click here to read more about the UBS Bloomberg CMCI Index.
For more information, please do not hesitate to contact:
UBS Investment BankUBS Commodities offers market access products and structured solutions, using futures & indices to enhance returns and reduce risk. With dedicated teams worldwide, UBS Commodities works with clients to deliver innovative solutions to our clients' commodities requirements.
[email protected]+44-(0)20-7567 7983
UBS Asset ManagementUBS Asset Management is a leading manager of commodity investments. We have been managing commodity index products since 2004 and can provide clients with commodity investments in both segregated accounts and across a range of fund wrappers.
[email protected]+44-(0)20-7901 5054
ConclusionAs we have seen, commodity markets are most-often in a state of contango, causing a drag on commodity index returns due to negative roll yields. We have shown that adopting our CMCI rolling methodology has mitigated these effects in periods of contango, thereby improving returns. Furthermore, the CMCI rolling methodology also outperformed during periods that start in backwardation. Periods of overall backwardation at the index level have not lasted more than 23 days on average, as backwardation in some commodities tends to be balanced by contango in others.
The analysis indicates that for twelve-month periods that start in contango (89% of observations since 31 January 2007), the CMCI rolling methodology outperforms the BCOM rolling methodology by an average of 3.3% and in 97% of cases. In periods that begin in backwardation, where positive roll yields have no such drag on commodity index returns, the CMCI roll performance is superior to the BCOM roll performance. This is by an average of 1.9% over twelve-month observation periods, and in 89% of observations.
6
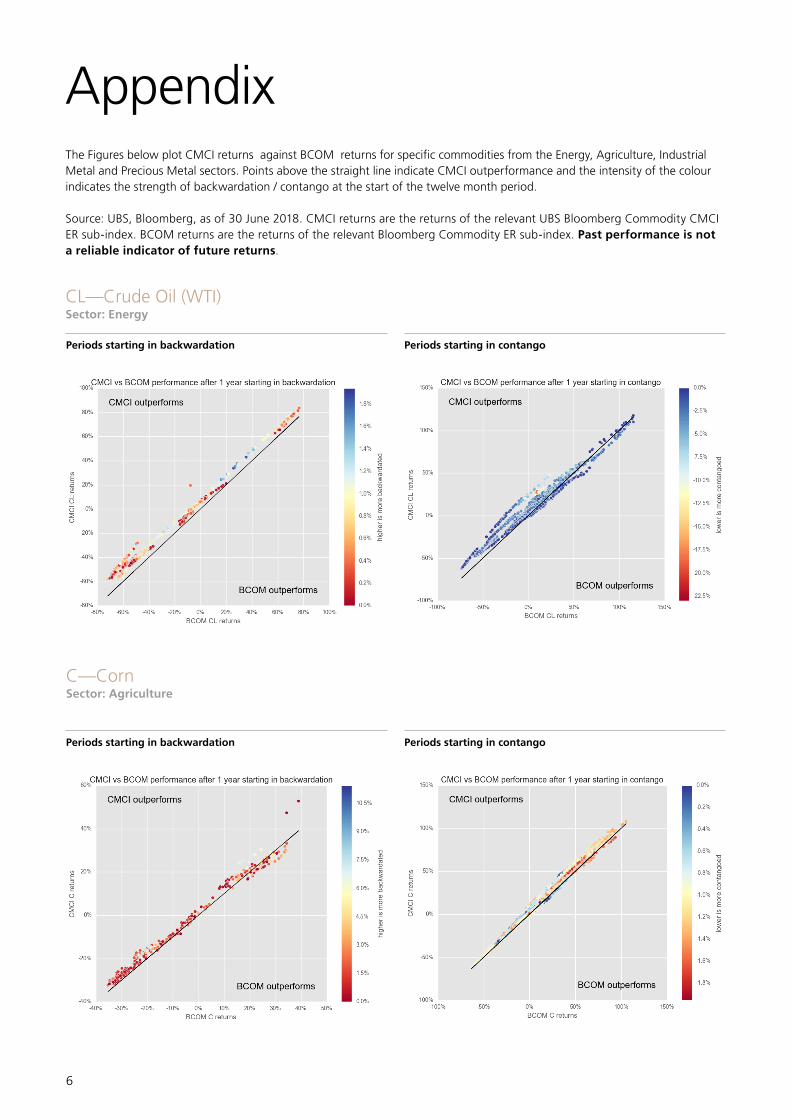
AppendixThe Figures below plot CMCI returns against BCOM returns for specific commodities from the Energy, Agriculture, Industrial Metal and Precious Metal sectors. Points above the straight line indicate CMCI outperformance and the intensity of the colour indicates the strength of backwardation / contango at the start of the twelve month period.
Source: UBS, Bloomberg, as of 30 June 2018. CMCI returns are the returns of the relevant UBS Bloomberg Commodity CMCI ER sub-index. BCOM returns are the returns of the relevant Bloomberg Commodity ER sub-index. Past performance is not a reliable indicator of future returns.
CL—Crude Oil (WTI)Sector: Energy
C—CornSector: Agriculture
Periods starting in backwardation
Periods starting in backwardation
Periods starting in contango
Periods starting in contango
7
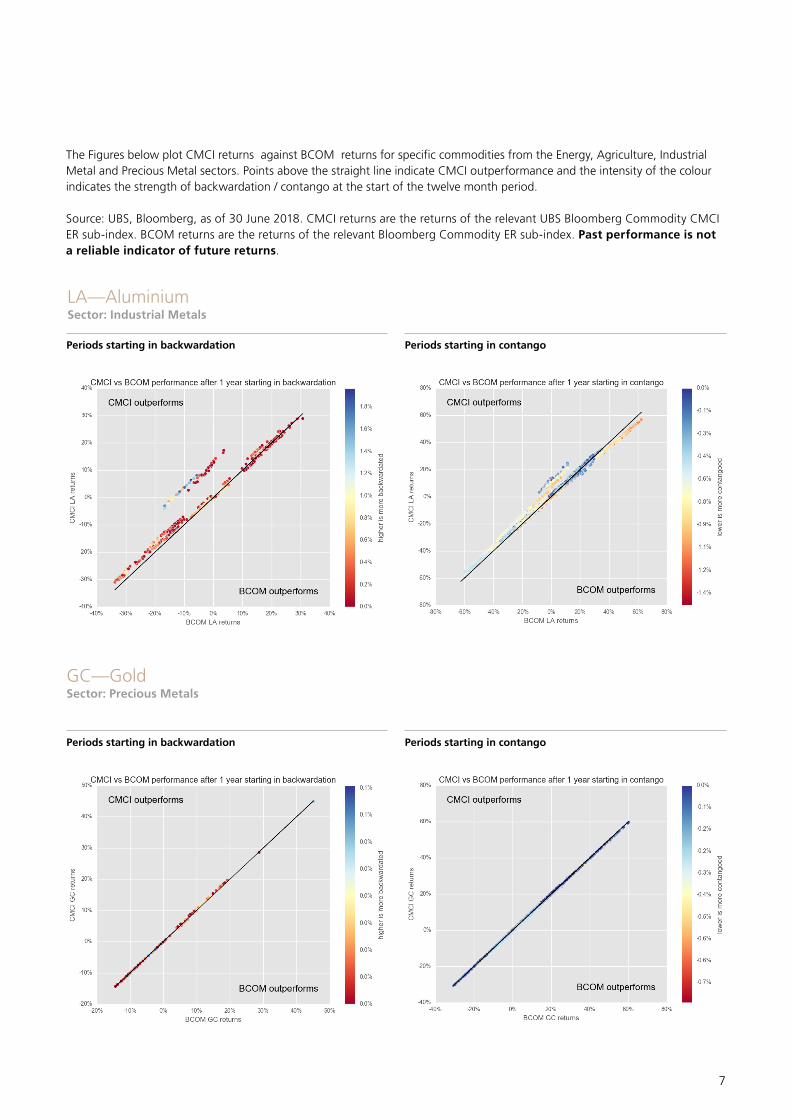
The Figures below plot CMCI returns against BCOM returns for specific commodities from the Energy, Agriculture, Industrial Metal and Precious Metal sectors. Points above the straight line indicate CMCI outperformance and the intensity of the colour indicates the strength of backwardation / contango at the start of the twelve month period.
Source: UBS, Bloomberg, as of 30 June 2018. CMCI returns are the returns of the relevant UBS Bloomberg Commodity CMCI ER sub-index. BCOM returns are the returns of the relevant Bloomberg Commodity ER sub-index. Past performance is not a reliable indicator of future returns.
LA—AluminiumSector: Industrial Metals
Periods starting in backwardation
Periods starting in backwardation
Periods starting in contango
Periods starting in contango
GC—GoldSector: Precious Metals

8
Global Sales and Trading Disclaimer (FRC and Equities)This material has been issued by UBS AG and/or any of its affiliates ("UBS" and "we", "us"). The securities, derivatives or other financial instruments described herein ("Instruments") may not be eligible for sale in all jurisdictions or to certain categories of investors. This material is for distribution only under such circumstances as may be permitted by applicable law, rules and/or regulations. All communications between you and us may be monitored. Please see further details as set out under "Country-specific information" below.
Provenance and purposeThis material has been prepared by sales or trading personnel and it is not a product of our Research Department and is not intended to recommend, suggest or inform an investment strategy. Opinions expressed may differ from the opinions expressed by our other divisions, including those of the Research Department.
Recipient to exercise own judgmentThe information contained herein should not be regarded by recipients as a substitute for the exercise of their own judgment. It has no regard to the specific investment objectives, financial situation or particular needs of any specific recipient and does not constitute the provision of investment advice. Prior to entering into a transaction you should consult with your own legal, regulatory, tax, financial and accounting advisers to the extent you deem necessary to make your own investment, hedging and trading decisions.
Not an offer to transactThis material has been prepared for informational purposes only and is not an offer to buy or sell or a solicitation of an offer to buy or sell any Instrument or to participate in any particular trading strategy. This material is not an official confirmation of terms.
Conflicts of InterestThis material may contain proprietary commentary produced in conjunction with our trading desks that trade as principal in the Instruments. This commentary may therefore not be independent from our proprietary interests or those of connected parties which may conflict with your interests. We may have accumulated or may acquire a long or short position in the subject Instrument, or derivative thereof, on the basis of this material prior to its dissemination.We may trade as principal or otherwise act or have acted as market-maker and/or as an execution venue in the Instruments. Instruments may be highly illiquid which may adversely impact the price, spread and speed of execution of orders in those Instruments. Furthermore, we may have or have had a relationship with or may provide or have provided investment banking, capital markets and/or other financial services to the companies associated with the Instruments.We have policies and procedures designed to manage conflicts of interest. In order to control the flow of information contained in one or more areas within UBS, into other areas, units, groups or affiliates of UBS, we may rely on information barriers. Additional information can be found at "https://www.ubs.com/global/en/investment-bank/regulatory.html" and may be made available upon request.
Contents of MaterialThis material is prepared from information believed to be reliable, but we make no representations or warranties, express or implied, and owe no duties (including in negligence) as to the accuracy, completeness or reliability of the information contained herein, nor is it intended to be a complete statement or summary of the Instruments, markets or developments referred to in the materials. The information contained in this material is as of the date hereof only and is subject to change without notice. We do not undertake any obligation to update this material. Any prices or quotations contained herein are indicative only and are not for valuation purposes. Past performance is not necessarily indicative of future results.
Statement of RiskThe Instruments are not suitable for all investors, and trading in these Instruments is considered risky and is appropriate only for sophisticated investors and in particular any target market identified herein. These
Instruments may involve a high degree of risk and may be highly volatile in response to fluctuations in interest rates, foreign exchange rates and other market conditions. Some Instruments may be physically settled or cash settled.
No LiabilityTo the fullest extent permitted by law, neither we nor any of our directors, employees or agents is liable for any loss (including indirect, special or consequential losses or damages, and even if we have been advised of the possibility of loss) arising out of any person’s use of, or reliance upon, the information contained herein.
Securities ActAny Instruments that have not been registered under the United States Securities Act of 1933 may not be offered or sold in the United States except pursuant to an exception from the registration requirements of the Securities Act and applicable state securities laws and in such circumstances as may be permitted by applicable law.
No redistribution or reproductionWe specifically prohibit the redistribution or reproduction of this material in whole or in part without our prior written permission and we accept no liability whatsoever for the actions of third parties in this respect. © UBS 2018. All rights reserved.
Country-specific informationExcept as otherwise specified herein, these materials are distributed to professional clients only, and are not suitable for retail clients.For further important country-specific information, please see the following link: https://www.ubs.com/global/en/investment-bank/us-sales-trading-country-specific.html.
Bloomberg DisclaimerBLOOMBERG and BLOOMBERG INDICES are trademarks or service marks of Bloomberg Finance L.P. Bloomberg Finance L.P. and its affiliates ("collectively, "Bloomberg") or Bloomberg's licensors own all proprietary right in the BLOOMBERG INDICES. Bloomberg does not guarantee the timeliness, accuracy or completeness of any data or information relating to BLOOMBERG INDICES. Bloomberg makes no warranty, express or implied, as to the BLOOMBERG INDICES or any data or values relating thereto or results to be obtained therefrom, and expressly disclaims all warranties of merchantability and fitness for a particular purpose with respect thereto. It is not possible to invest directly in an index. Back-tested performance is not actual performance. Past performance is not an indication of future results. To the maximum extent allowed by law, Bloomberg, its licensors, and its and their respective employees, contractors, agents, suppliers and vendors shall have no liability or responsibility whatsoever for any injury or damages - whether direct, indirect, consequential, incidental, punitive or otherwise - arising in connection with BLOOMBERG INDICES or any data or values relating thereto - whether arising from their negligence or otherwise. This document constitutes the provision of factual information, rather than financial product advice. Nothing in the BLOOMBERG INDICES shall constitute or be construed as an offering of financial instruments or as investment advice or investment recommendations (i.e., recommendations as to whether or not to “buy”, “sell”, “hold”, or to enter or not to enter into any other transaction involving any specific interest or interests) by Bloomberg or its affiliates or a recommendation as to an investment or other strategy by Bloomberg or its affiliates. Data and other information available via the BLOOMBERG INDICES should not be considered as information sufficient upon which to base an investment decision. All information provided by the BLOOMBERG INDICES is impersonal and not tailored to the needs of any person, entity or group of persons. Bloomberg and its affiliates do not express an opinion on the future or expected value of any security or other interest and do not explicitly or implicitly recommend or suggest an investment strategy of any kind. Customers should consider obtaining independent advice before making any financial decisions. © 2016 Bloomberg Finance L.P. All rights reserved. This document and its contents may
not be forwarded or redistributed without the prior consent of Bloomberg.
UBS Index DisclaimerNo legal relationship (whether in contract, tort, or otherwise) exists between any investor buying, selling, entering into or holding products linked to the Index (such products, the “Index Products” and such investors, the “Index Product Investors”) and UBS AG, London Branch (in its capacity as owner of the Index the "Index Owner") and the Index Owner owes no duty (whether in contract, tort, or otherwise) to any Index Product Investor. No claims, actions or legal proceedings may therefore be brought against the Index Owner in any manner whatsoever by an Index Product Investor or any other person.The Index Owner makes no representation, warranty or guarantee whatsoever, express or implied, either as to the results to be obtained as to the use of the Index or the figures or levels at which the Index stands at any particular day or otherwise. In addition, the Index Owner gives no assurance regarding any modification or change in any methodology used in calculating the Index and is under no obligation to continue the calculation, publication and dissemination of the Index.The Index Owner does not warrant or represent or guarantee to any person the accuracy or completeness of the Index and its computation or any information related thereto and makes no warranty or representation or guarantee of any kind whatsoever relating to the Index. The process and basis of computation and compilation of the Index and the related formulae, constituent benchmarks and factors may at any time be changed or altered by the Index Administrator. The Index is subject to the terms set out in the Index Manual, as such Index Manual may be amended from time to time.No responsibility or liability is accepted by the Index Owner (whether for negligence or otherwise) in respect of the use of and/or reference to the Index by us or any other person in connection with securities, or for any inaccuracies, omissions, mistakes or errors in the computation of the Index (and the Index Owner shall not be obliged to advise any person or any Index Product Investor of any error therein) or for any economic or other loss which may be directly or indirectly sustained by any Index Product Investor or any other persons dealing with securities as a result. Any Index Product Investor or other person dealing with securities does so, therefore, in full knowledge of this disclaimer and can place no reliance whatsoever on the Index Owner.The Index Owner makes no representation, warranty or guarantee as to the accuracy, completeness or appropriateness of the methodology, nor does it accept any liability for the use of such information. Nothing in this disclaimer shall exclude or limit liability to the extent such exclusion or limitation is not permitted by law or regulations to which the Index Owner is subject.The mark and name of the Index is proprietary to UBS.CMCI is a trademark of UBS AG.
© UBS 2018. The key symbol and UBS are among the registered and unregistered trademarks of UBS. All rights reserved. July 2018. 26780A


ab
www.ubs.com