The Current Economic Crisis: visible and invisible gender dimensions ( a developing country...
32
The Current Economic Crisis: visible and invisible gender dimensions (a developing country perspective) Rania Antonopoulos July 13, 2009
-
Upload
ezra-whitehead -
Category
Documents
-
view
217 -
download
2
Transcript of The Current Economic Crisis: visible and invisible gender dimensions ( a developing country...

The Current Economic Crisis: visible and invisible gender dimensions
(a developing country perspective)
Rania AntonopoulosJuly 13, 2009

Gender paths of transmission of the crisis
• Paid work in export sectors: textiles, consignment, agriculture and tourism
• Informal work and vulnerable workers • Micro credit and Micro-finance institutions • Unpaid work and invisible vulnerabilities • Food security and women in agriculture• Remittances and migration

For many people, in many countries this crisis comes to sit
on top of another crises
• poverty: multi-dimensional and use of TIME
• work: quantity-quality of employment and
unpaid work
• income inequality: between and within countries
• diminishing space for livelihoods: climate change, environmental impact & land
use

Gender dimension of the crisisCAUSES & IMPACTS, OUTCOMES
(1) MACROECONOMIC concerns(2) INSTITUTIONAL arrangements (3) MICRO-LEVEL location of men and women and
• Fiscal space in times of crises counter-cyclical policies?
• Policy space: fiscal,monetary,exchange rate• SOCIAL POLICY SPACE???• Unpaid work and Government retrenchment • Food sovereignty and Agricultural policy• Employment and work opportunities

The role of Markets revisited
• Challenge: International market dynamics lead to the crisis of rising food prices….
• Challenge: Sub-prime mortgage crisis leads to turmoil in financial markets…
• Challenge: demand is insufficient to provide jobs and hire those who need and wish to work;

The role of Government revisited
Economic and Social outcomes of Laissez faire, and small government prove uneven and often times disappointing
• In production markets it can increase food security price subsidies of staple foods, stockpiling, subsidies of fertilizers, South Africa rethinking land policy
• In financial markets it can ameliorate instability and fragility bailout? Not stronger, different rules and regulations are needed
• To address unemployment it can introduce an active labor market policy: ELR

Jomo showed two slides on growth and employment recovery that point out the same issue highlighted by Lee and Rhee (1999):
“cross-country analysis for all countries under IMF financial assistance plans over the period of 1973 to 1994, found that employment recovery followed a much slower path than other macroeconomic indicators.”

What do we know from past experiences?
•The Asian financial crisis shows that the massive unemployment impacts (doubled rates within a year of the crisis) persisted even after recovery (LABORSTA, ILO ) ILO
•Indonesia has never recovered to the pre-crisis level, while Thailand
and the Philippines have taken nearly a decade to decrease unemployment rates to the pre-crisis levels (Buvinic 2009).

Changes in employment to output growth ratio
0.0
0.2
0.4
0.6
0.8
1.0
1.2
Central andEastern Europe
(non-EU) & CIS
DevelopedCountries and EU
South Asia Latin America andthe Caribbean
Sub-SaharanAfrica
Middle East andNorth Africa
1995-1999
2000-2005
0
10
20
30
40
50
60
70
80
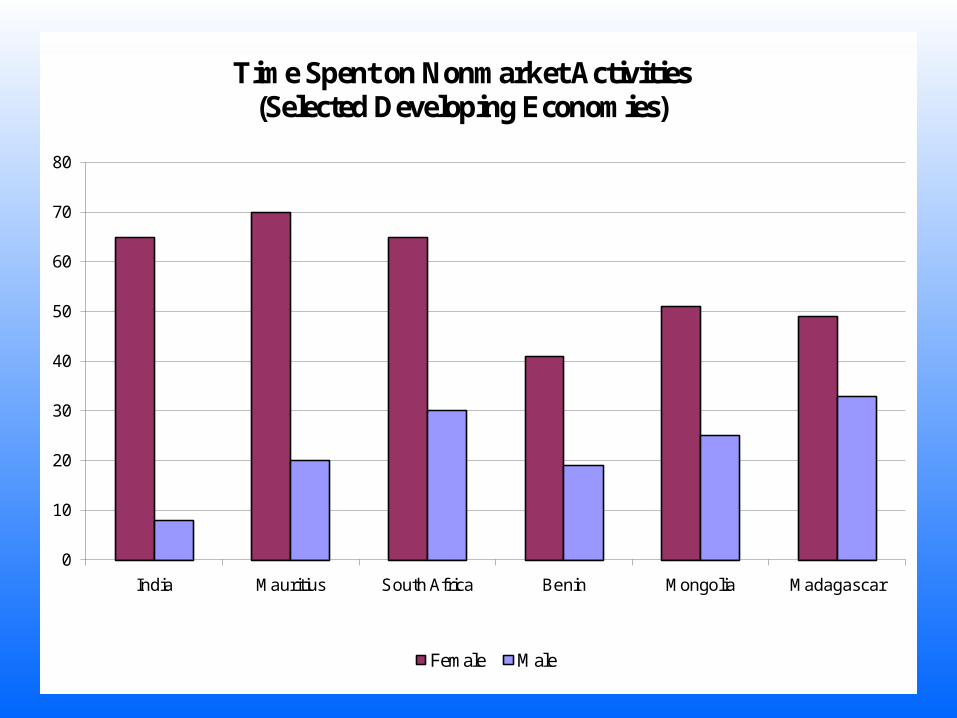
India Mauritius South Africa Benin Mongolia Madagascar
Time Spent on Nonmarket Activities (Selected Developing Economies)
Female Male

Total Workload – Earnings Gap: Selected Developing Countries

Time Spent on Unpaid Work -SA


Total Hours Spent on Unpaid Work per Year by Household Type and Gender
0
1,00
0,00
0,00
0
2,00
0,00
0,00
0
3,00
0,00
0,00
0
4,00
0,00
0,00
0
5,00
0,00
0,00
0
6,00
0,00
0,00
0
7,00
0,00
0,00
0
8,00
0,00
0,00
0
Urban Formal African
Urban Formal Coloured/Asian
Urban Formal White
Urban Informal African
Rural Commercial African
Rural Commercial Coloured/Asian
Rural Commercial White
Ex-homeland African
Hou
seh
old
Gro
up
Total Hours Per Year
Female
Male

Why an EGS,ELR,PWP?The right to work promotes • Dignity, inclusion and expanded democracy• Direct and indirect income creation• Direct and indirect job creation • Public and Private Asset creation • Pro-poor growth• Change our mentality about growth as the single
developmental objective and replace it with pro-poor growth, employment creation, inclusion and improvement in standard of living of people

Typology of Direct Job Creation Government Programs
• Emergency Programmes:Indonesia, Korea, Argentina post 2001 financial crisis, USA (New Deal)
• Social Funds:Bolivia (1986), Chile (1975-1987), Peru (1991)
• ILO Employment Intensive Infrastructure(since 70’s in many African countries)
• The Right to Food,the Right to Work:NREGA since 2006
• Recognition of Unemployment during prosperity: South Africa since 2005, Sweden and Australia (1940’s-70’s)

Employment Guarantee Programs
• What kinds of jobs? What types of “projects”? Who is eligible? For how long?
• What is the “cost” of such projects and what are the “benefits”? Financing? Are they inflationary?
• Institutional arrangements? Technical expertise?Fiscal and monetary policy consistency?

Employment Guarantee Programs
• Expanded Public Works Programmes [infrastructure, social sector, environment, economic]
SOUTH AFRICA

Types of Community ProjectsRural roads and access roads
Rural land development
Flood control works
Water conservation and water harvesting
Irrigation facilities to land owned by poor people and to beneficiaries of land reforms
Reactivation of traditional water harvesting and distribution systems

Background on the Study
• Research project on micro-macro impact of scaling up public job creation
• South Africa Study: Kijong Kim (Levy Institute), EPWP interviews , Irwin Friedman (Health Trust Fund) and PROVIDE team (Dept. of Agriculture),
• Type of Intervention : scaling up Early Childhood Development and Home/Community Based Care
• The right to work , the right types of projects?
unpaid work and gender issues

EPWPTypes of Community Projects
Road construction and maintenance
Water delivery
Ecological latrines
Early childhood development (unpaid work)
Home and community based care (unpaid work)
Environmental water conservation
Prevention of fires

Policy Simulations• All Existing Types of Projects have the potential to reduce unpaid
work and facilitate creation and access to basic services
EPWP Working for Water; environment sector (Tsitsikamma 2004/05)
EPWP Social Sector (Health Trust Fund)
EPWP Infrastructure;Access roads and Water Reticulation (SCIP Engineering Group)
• Options for Job allocation scheme Jefes variation by population weights (part time year around)NREGA scheme (100 days)Poverty weights-normalized by populationUnemployment weights normalized by poverty incidence
• Target population Poor and ultra poor households comprising (50% of the
unemployed); “unskilled” wages according to programme stipulations and skilled according to SAM

Impact of EPWP Injection
ex-ante evaluation of policy scenariosex-ante evaluation of policy scenarios• Direct and indirect job creation (skill level/gender/sector)
• Direct and indirect income received by type of hh• Depth of poverty reduction • GDP growth? Pro-poor growth?Sectoral growth?• Fiscal space expansion?• Impact of new assets and service delivery for participants
and community

EPWP: Social Sector
• Social Sector consists of ECD/Education and HCBC/Health
• High female intensity (60 and 69% respectively) addresses female unemployment in the short run and builds skills in the long-term
• Data source: Friedman, Irwin, Bhengu, L., Mothibe, N., Reynolds, N., and Mafuleka, A., (2007) Scaling up the EPWP,Health Systems Trust, November, Volume 1-4. Study commissioned by Development Bank of South Africa and EPWP.

Simulation Results
9 billion Rand, full time-year around jobs
• Direct job creation (1,2million)
• Indirect job creation: for every 3 EPWP, another one in the economy is created
• GDP (+1.7%), tax expansion (1/3 recovered)
• Poverty reduction: pro-poor growth!

Costs and Benefits
• Social inclusion • Income-Poverty reduction? This depends on the length
and duration of jobs, wages and targeting method• Asset poverty reduction!!! • Service delivery!!!• Gender equality in unpaid and paid work• Pro-poor development• Monetary cost: 1% of GDP ….?3% of GDP?• Opportunity cost of not mobilizing domestic resources?

Thank you

member institutions...
member institutions...we are...a group of economists working towards building a global informal network of academics, policy advisors, institutions, advocates and members of government, committed to the realization of the right to work…
www.economistsforfullemployment.org
we are committed to...joining forces with all who foster public dialogue and seek to promote employment guarantee around the world. Together, we can provide coherent, viable policy alternatives that lead to inclusive and just outcomes for all…

COUNTRIES REPRESENTED
Morocco South AfricaIndia
Costa Rica
ArgentinaColumbia
Bulgaria
United StatesTunisia
Ghana
MexicoAustralia
Canada
Djibouti
Belgium
Turkey
Georgia
Luxembourg
Switzerland
Iran
Brazil


External Indicators of Developing and Transition Economies with Population Over 5 Million
Number of
Countries
Current Account Balance External Debt Foreign Exchange Reserves,
excl. gold
% of GDP 2003
% of GDP 2007
% with deficit, 2007
% with improvement
% of GDP 2003
% of GDP 2006
% with improvement
% of GDP 2003
% of GDP 2007
% with improvement
Africa 31 -5.6 -4.2 87% 45% 89.7 43.0 97% 12.8 18.1 78%
Central and Eastern Europe
8 -5.4 -9.1 100% 38% 55.4 57.3 57% 21.0 23.2 63%
CIS 8 -1.0 3.1 63% 25% 56.1 44.5 88% 12.9 21.3 100%
Latin America and the Caribbean
16 -0.7 -0.9 50% 38% 63.7 37.6 100% 11.7 14.8 69%
Middle East, incl. Egypt
7 7.2 6.5 43% 43% 54.0 28.6 100% 41.1 50.1 40%
Asia, incl. NICs
20 2.2 3.0 30% 45% 52.5 36.9 100% 27.2 32.7 69%
Total 90 63% 41% 94% 72%

Total Workload – Earnings Gap: Selected OECD Countries