The Curious Life of Local Reading Items Annual Spring WERA Conference March 30, 2007 JoAnne...
36
The Curious Life of Local Reading Items Annual Spring WERA Conference March 30, 2007 JoAnne Buiteweg, Peter Hendrickson and Debra Ritchhart Everett Public Schools
-
Upload
gavin-little -
Category
Documents
-
view
214 -
download
1
Transcript of The Curious Life of Local Reading Items Annual Spring WERA Conference March 30, 2007 JoAnne...

The Curious Life of
Local Reading ItemsAnnual Spring WERA Conference
March 30, 2007
JoAnne Buiteweg, Peter Hendrickson and Debra Ritchhart
Everett Public Schools

Once Upon
a Time…

In a place not so far, far away…

There was a department
organized under the Executive Director for Curriculum
Alignment and Implementation…

Opportunity to Learn (Requirements)
• Align curriculum & instruction to the assessed standards
• Align assessments to the assessed standards
• Monitor student progress on the assessed standards
• Communicate progress on the assessed standards to students and parents
• Do something additional for students not at standard
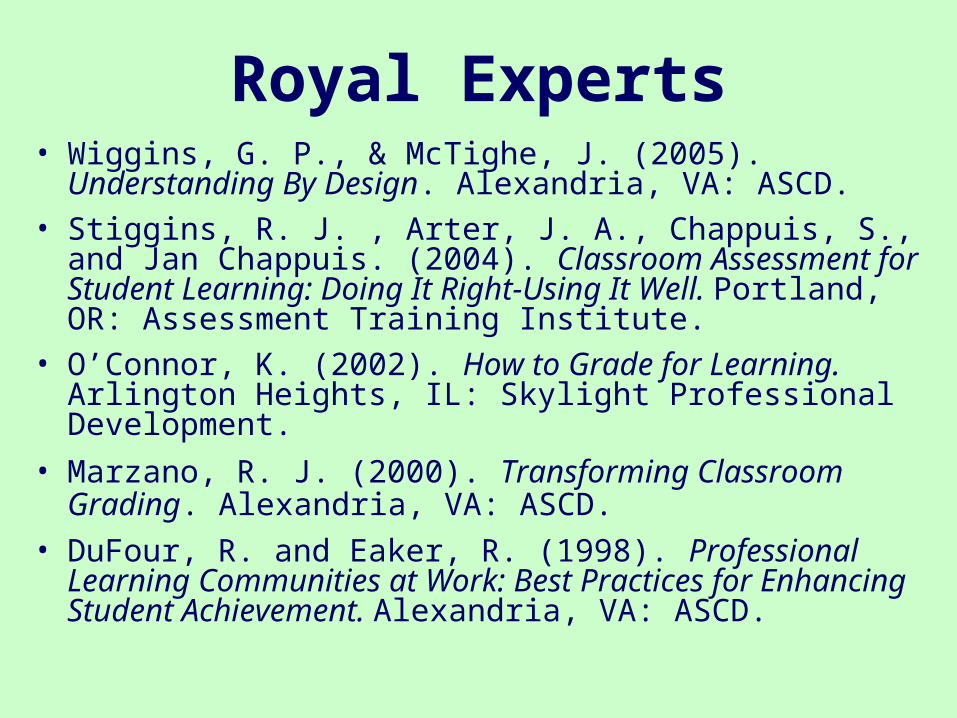
Royal Experts• Wiggins, G. P., & McTighe, J. (2005). Understanding By
Design. Alexandria, VA: ASCD.• Stiggins, R. J. , Arter, J. A., Chappuis, S., and Jan
Chappuis. (2004). Classroom Assessment for Student Learning: Doing It Right-Using It Well. Portland, OR: Assessment Training Institute.
• O’Connor, K. (2002). How to Grade for Learning. Arlington Heights, IL: Skylight Professional Development.
• Marzano, R. J. (2000). Transforming Classroom Grading. Alexandria, VA: ASCD.
• DuFour, R. and Eaker, R. (1998). Professional Learning Communities at Work: Best Practices for Enhancing Student Achievement. Alexandria, VA: ASCD.
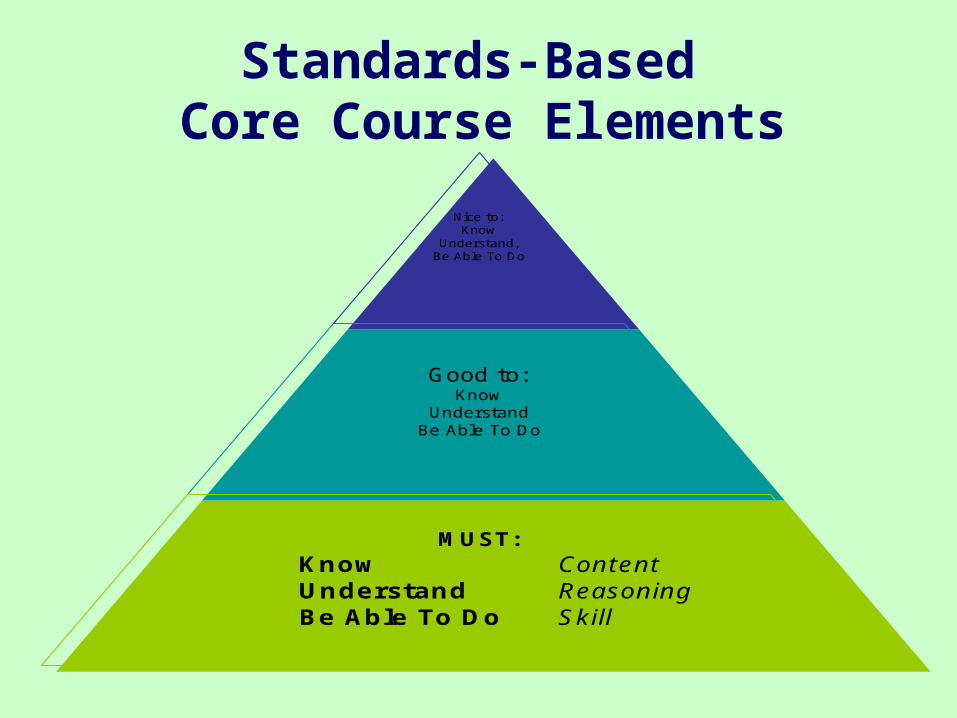
Nice to: Know
Understand, Be Able To Do
Good to: Know
Understand Be Able To Do
MUST: Know Content Understand Reasoning Be Able To Do Skill
Course Planning Pyramid
Standards-Based Core Course Elements
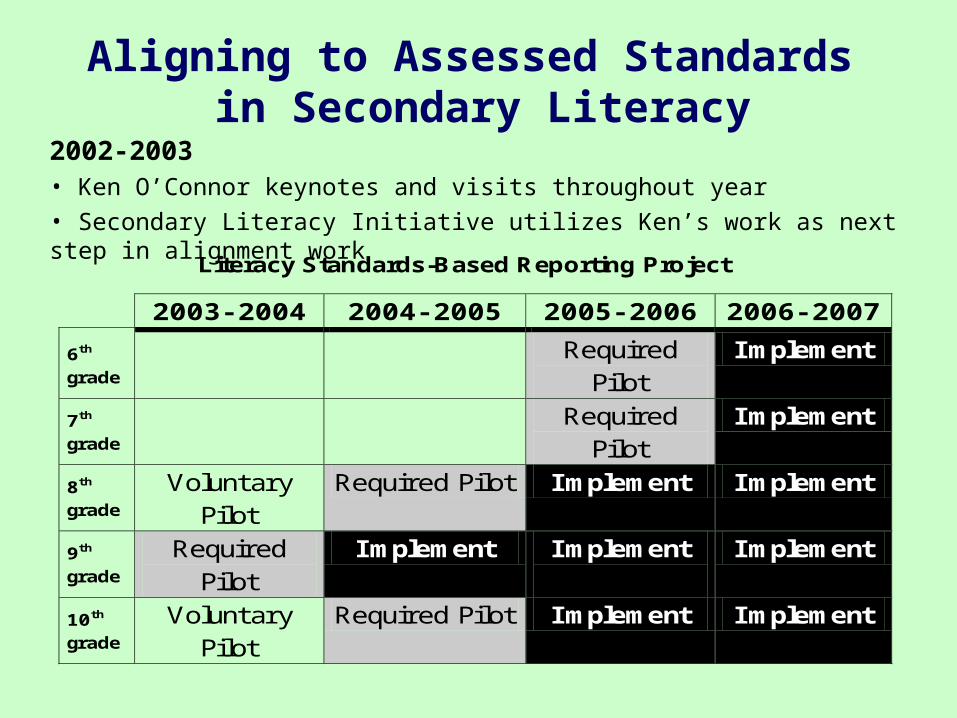
Literacy Standards-Based Reporting Project
2003- 2004 2004- 2005 2005- 2006 2006- 2007
6th grade
Required Pilot
Implement
7th grade
Required Pilot
Implement
8th grade
Voluntary Pilot
Required Pilot Implement Implement
9th grade
Required Pilot
Implement Implement
Implement
10th grade
Voluntary Pilot
Required Pilot Implement Implement
Aligning to Assessed Standards in Secondary Literacy
2002-2003• Ken O’Connor keynotes and visits throughout year
• Secondary Literacy Initiative utilizes Ken’s work as next step in alignment work

Instructional Facilitator in Literacy
2004-05
Working with teachers to answer:
1. Does the evidence you are collecting truly reflect what you have taught?
2. Have you gathered and provided feedback on enough formative evidence throughout a unit for students to learn?
3. Do you have enough summative evidence to accurately assess a student?
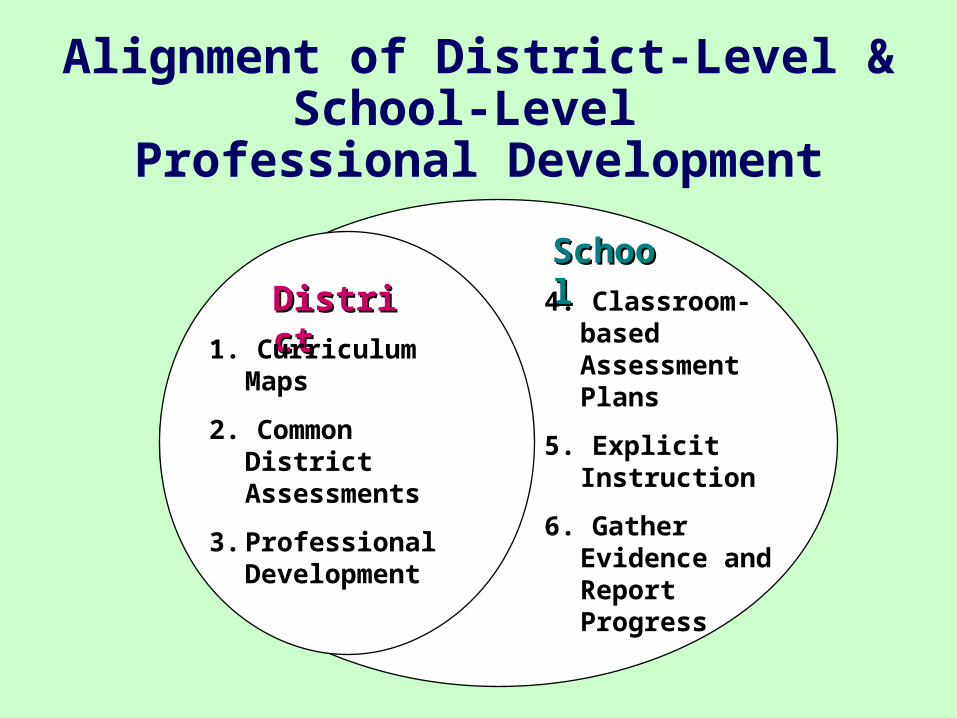
Alignment of District-Level & School-Level
Professional Development
SchoSchoolol4. Classroom-
based Assessment Plans
5. Explicit Instruction
6. Gather Evidence and Report Progress
DistricDistrictt1. Curriculum
Maps
2. Common District Assessments
3. Professional Development
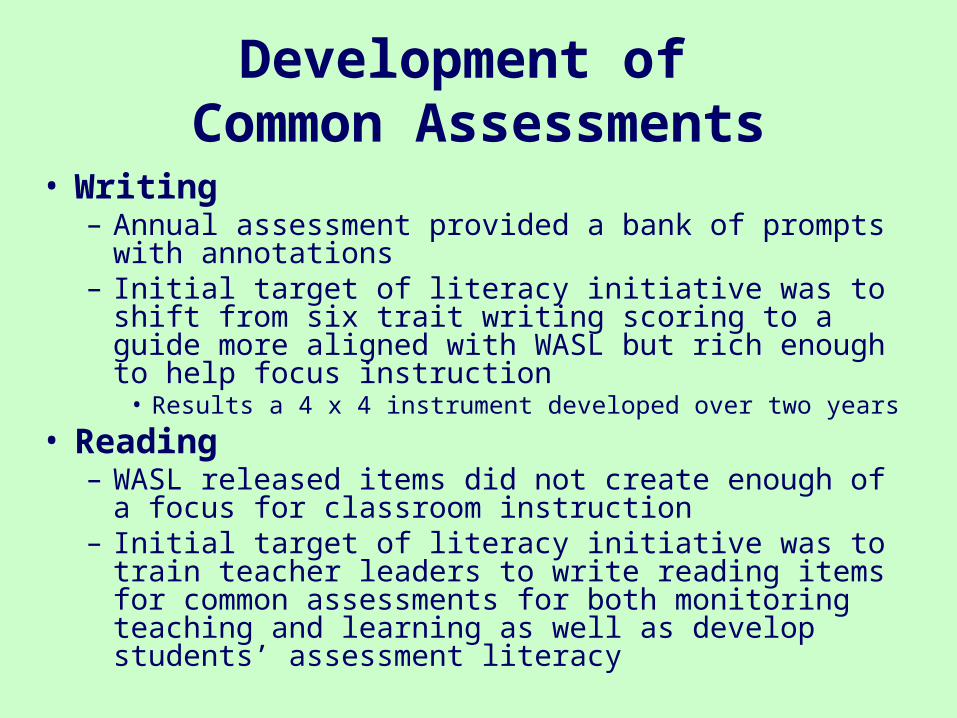
Development of Common Assessments
• Writing – Annual assessment provided a bank of prompts with
annotations– Initial target of literacy initiative was to shift from six trait
writing scoring to a guide more aligned with WASL but rich enough to help focus instruction
• Results a 4 x 4 instrument developed over two years
• Reading– WASL released items did not create enough of a focus
for classroom instruction– Initial target of literacy initiative was to train teacher
leaders to write reading items for common assessments for both monitoring teaching and learning as well as develop students’ assessment literacy
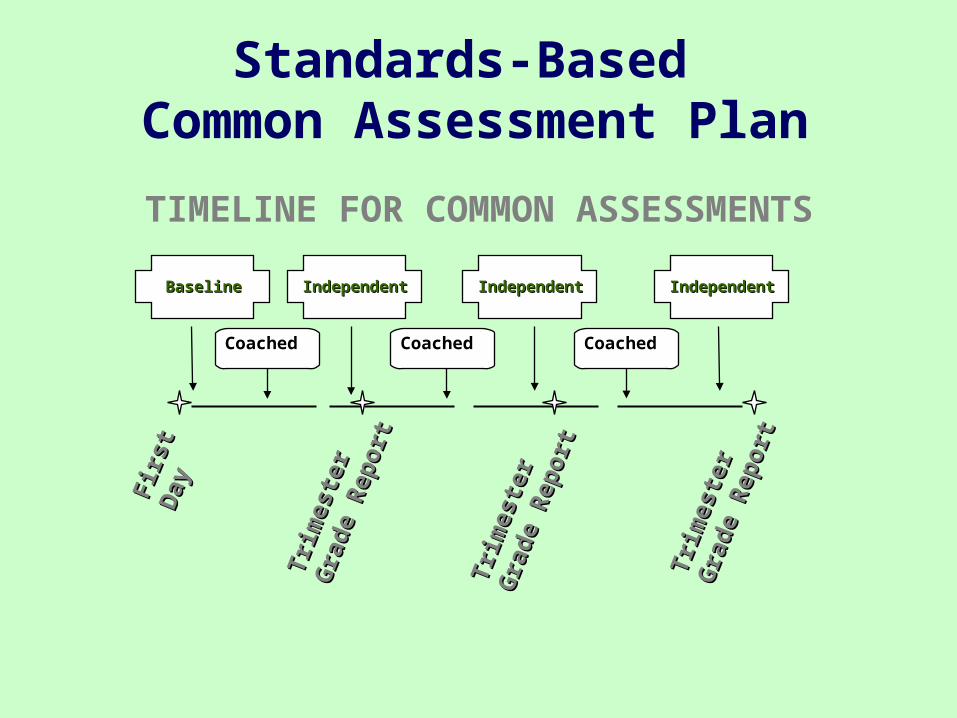
TIMELINE FOR COMMON ASSESSMENTS
Fir
st
Fir
st
Day
Day
Tri
mest
er
Tri
mest
er
Gra
de R
eport
Gra
de R
eport
IndependentIndependent
Coached Coached Coached
Standards-Based Common Assessment Plan
IndependentIndependent IndependentIndependentBaselineBaseline
Tri
mest
er
Tri
mest
er
Gra
de R
eport
Gra
de R
eport
Tri
mest
er
Tri
mest
er
Gra
de R
eport
Gra
de R
eport

Middle School Reading Common Assessments
Reading• WASL: sets conditions• Practice WASL: to simulate rigor (from OSPI)• Coached: focus on assessment literacy and current trimester targets• Independent: to mirror WASL conditions (simulations)
Baseline: Beginning-of-the-Year (Pre-Test) – on all 10 targets– all multiple-choice questions (opt. short answer & extended response items)1st Trimester: Focus on targets 1-5– 1 of 2 Short Answer should be summarizing– 1 Extended Response should be literary elements or text features stem2nd Trimester: Focus on targets 6-10– 2 Short Answer questions– Extended Response should be compare and contrast3rd Trimester: End-of-the-Year (Post-Test)– on all 10 targets– all multiple-choice questions (opt. short answer & extended response items)

Role of Item Writers
• Strong relationship to classrooms, teachers
• Deep understanding of GLEs, test specifications, item specifications
• Broad knowledge of accessible text, web sources
• Literacy specialists, coach/leaders
• Develop, administer, analyze, translate to instruction
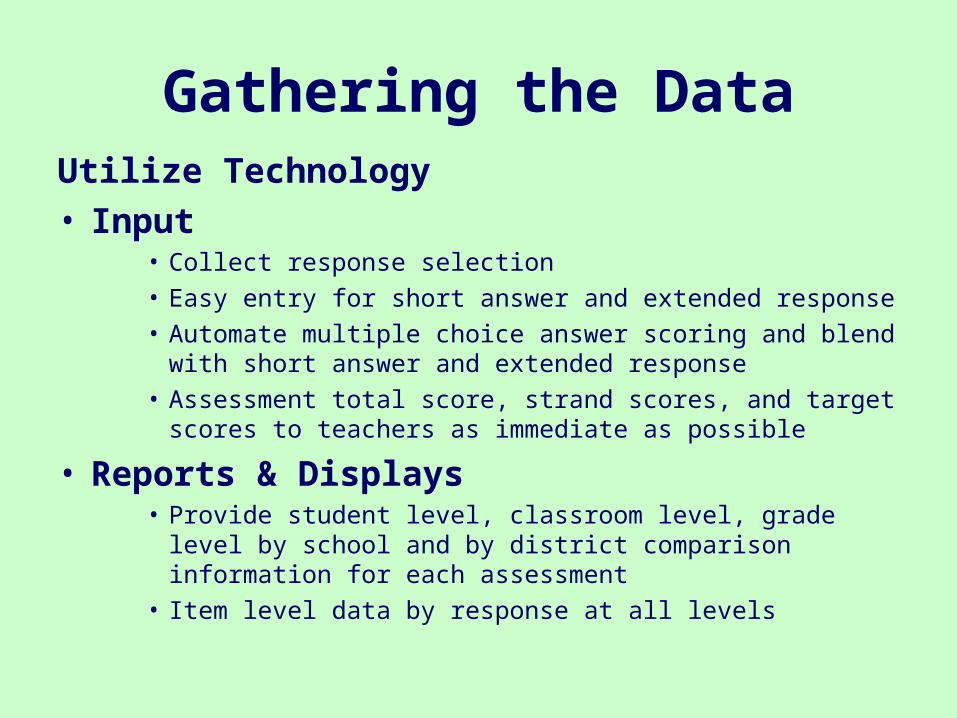
Gathering the DataUtilize Technology• Input
• Collect response selection• Easy entry for short answer and extended response• Automate multiple choice answer scoring and blend with
short answer and extended response• Assessment total score, strand scores, and target scores to
teachers as immediate as possible
• Reports & Displays• Provide student level, classroom level, grade level by school
and by district comparison information for each assessment• Item level data by response at all levels

What we can learn from items…

Classical Test TheoryP-values
• Difficulty of a test item
• Percentage selecting correct response
• Example 100 students respond Correct answer is “C” 65 students answer “C” P-value = 65/100=0.65

P-values…• Lower…harder
< .20 too close to guessing if five choices Hard .20 to .40 Confusing language?
Teach again?
• Sweet P-values Around 0.60
Range .40 to .60
• Higher…easier = or > 0.90 too easy Easy .61 to 89 Very little information
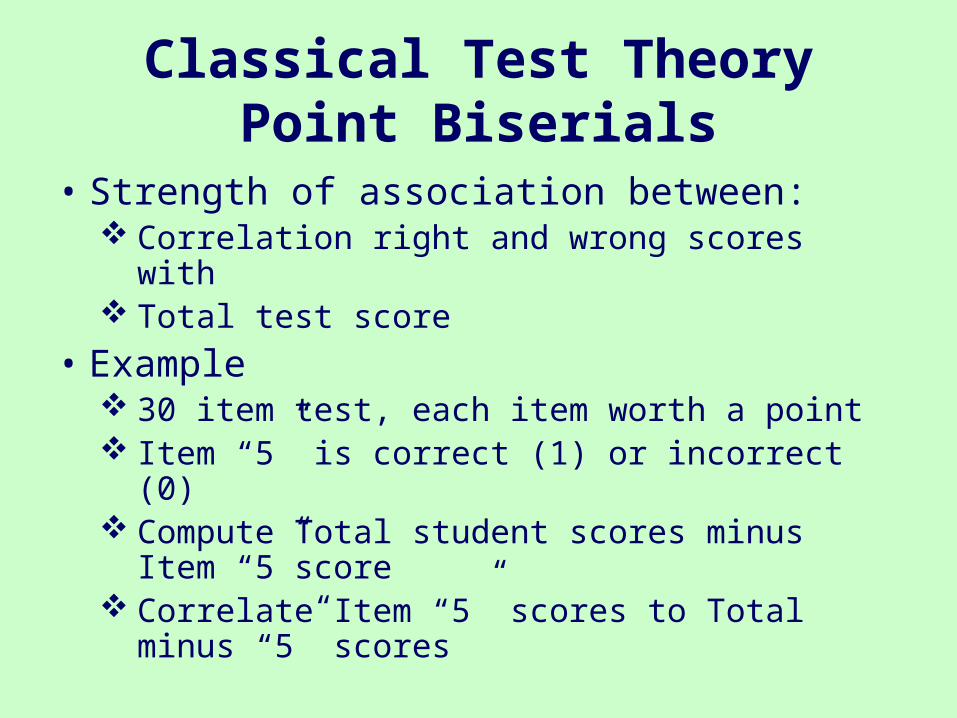
Classical Test TheoryPoint Biserials
• Strength of association between: Correlation right and wrong scores with Total test score
• Example 30 item test, each item worth a point Item “5” is correct (1) or incorrect (0) Compute Total student scores minus Item
“5”score Correlate Item “5” scores to Total minus “5”
scores

Point -Biserials…
• Low Point-Biserials <0.15 reject, =>0.15 minimal, =>0.25 good
Capable students missing easy items
• Sweet spot 0.3 or higher
• High Point-Biserials…more discriminating 1.0 is max Higher scorers got correct Lower scorers missed it
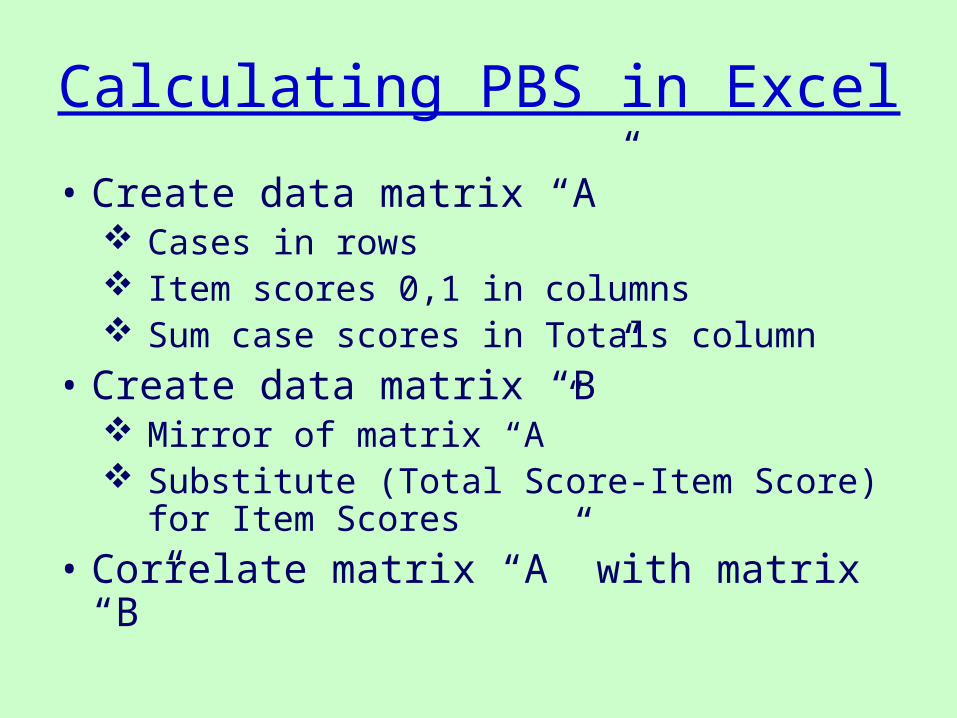
Calculating PBS in Excel
• Create data matrix “A” Cases in rows Item scores 0,1 in columns Sum case scores in Totals column
• Create data matrix “B” Mirror of matrix “A” Substitute (Total Score-Item Score) for Item
Scores
• Correlate matrix “A” with matrix “B”
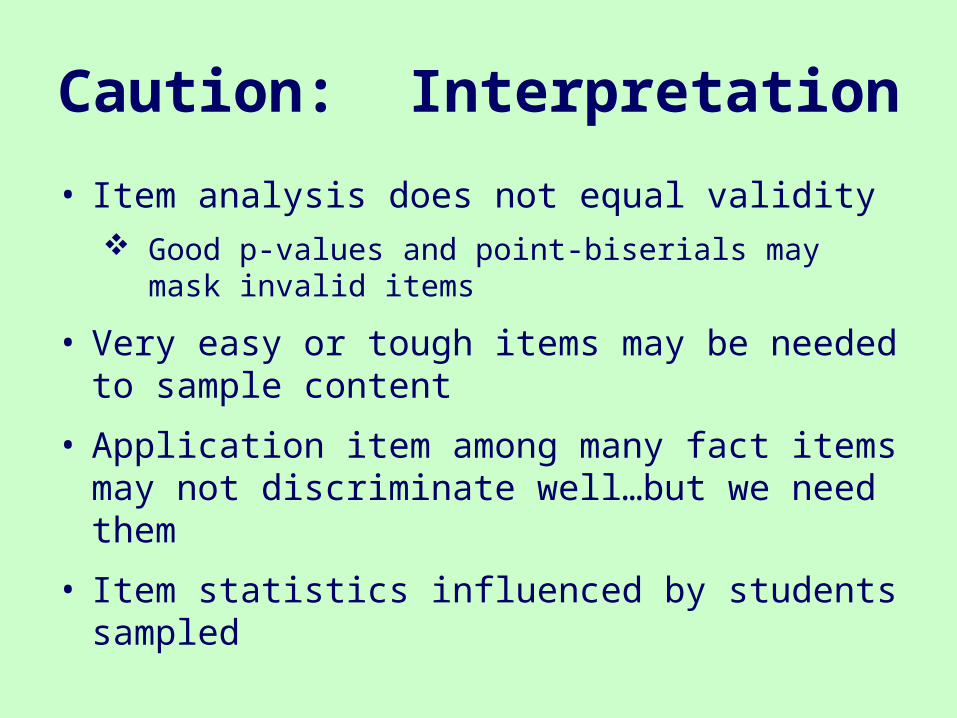
Caution: Interpretation
• Item analysis does not equal validity Good p-values and point-biserials may mask invalid
items
• Very easy or tough items may be needed to sample content
• Application item among many fact items may not discriminate well…but we need them
• Item statistics influenced by students sampled

Why Bad or Misfitting Items?
• Poorly written, confusing
• Unclear, misleading graphics
• No clear, correct response
• Obviously wrong distractor
• Item reflects different content than rest
• Bias against some gender, ethnic, other subgroup (Differential Item Functioning)
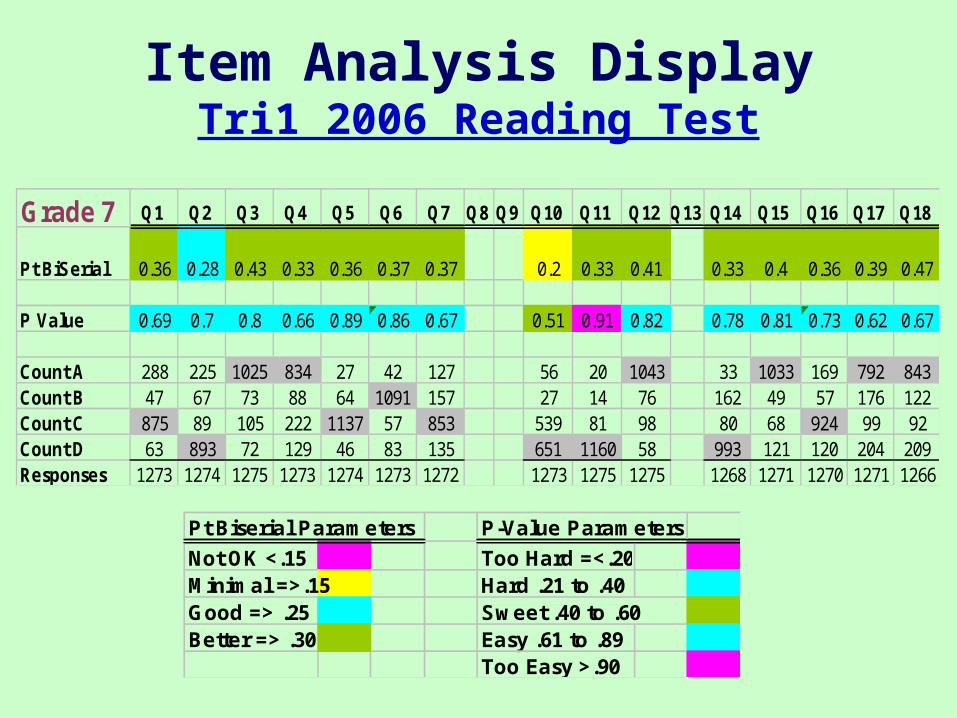
Item Analysis DisplayTri1 2006 Reading Test
Pt Biserial Parameters P-Value Parameters
Not OK <.15 Too Hard =<.20Minimal =>.15 Hard .21 to .40Good => .25 Sweet .40 to .60Better => .30 Easy .61 to .89
Too Easy >.90
Grade 7 Q1 Q2 Q3 Q4 Q5 Q6 Q7 Q8 Q9 Q10 Q11 Q12 Q13 Q14 Q15 Q16 Q17 Q18
Pt BiSerial 0.36 0.28 0.43 0.33 0.36 0.37 0.37 0.2 0.33 0.41 0.33 0.4 0.36 0.39 0.47
P Value 0.69 0.7 0.8 0.66 0.89 0.86 0.67 0.51 0.91 0.82 0.78 0.81 0.73 0.62 0.67
Count A 288 225 1025 834 27 42 127 56 20 1043 33 1033 169 792 843Count B 47 67 73 88 64 1091 157 27 14 76 162 49 57 176 122Count C 875 89 105 222 1137 57 853 539 81 98 80 68 924 99 92Count D 63 893 72 129 46 83 135 651 1160 58 993 121 120 204 209Responses 1273 1274 1275 1273 1274 1273 1272 1273 1275 1275 1268 1271 1270 1271 1266
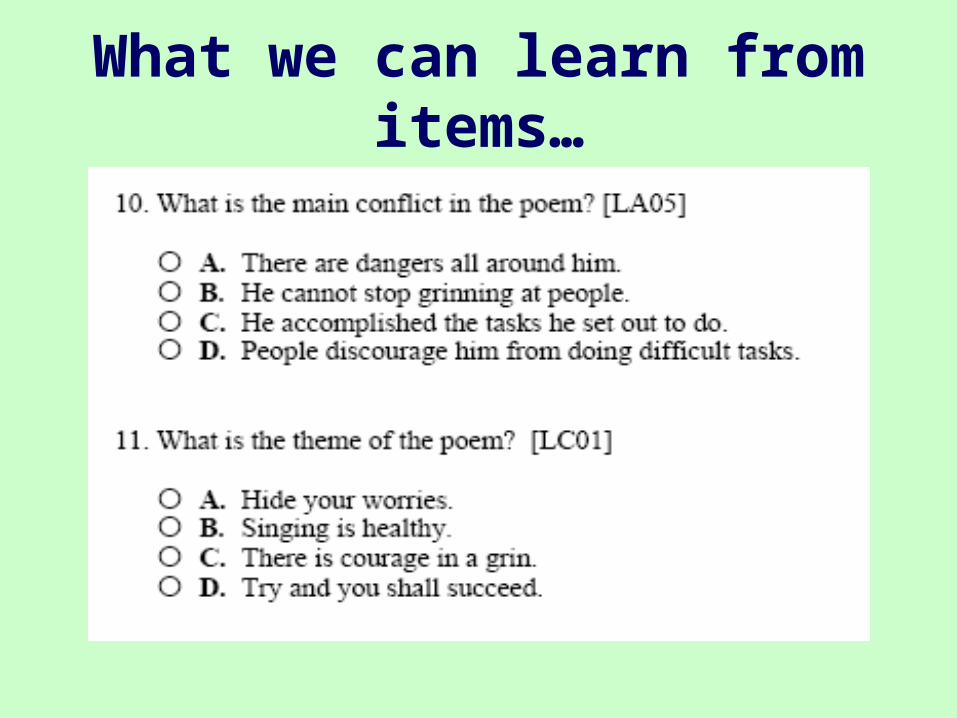
What we can learn from items…
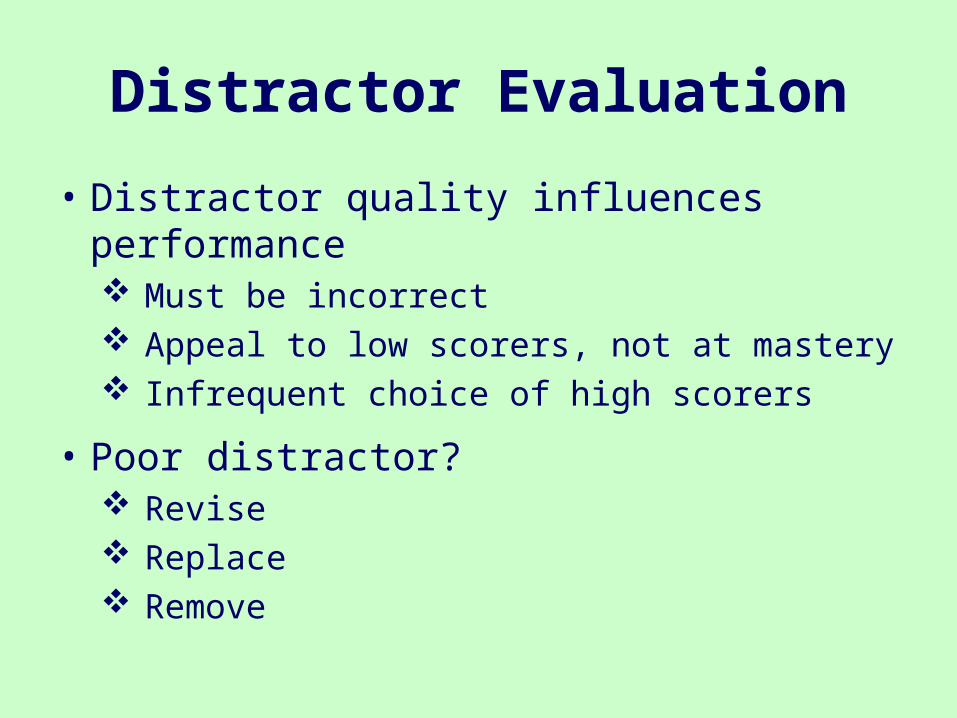
Distractor Evaluation
• Distractor quality influences performance Must be incorrect Appeal to low scorers, not at mastery Infrequent choice of high scorers
• Poor distractor? Revise Replace Remove


Item Analysis References
• “Test item analysis and decision making”. DIIA, University of Texas at Austin. Accessed 14 February 2007 http://www.utexas.edu/academic/mec/scan/index.html– The Measurement and Evaluation Center (MEC) offers tutorials for
faculty writing and interpreting tests.
• Halydna, T.M. (1999). Developing and validating multiple-choice test items (2nd ed.). Mahway, NJ: Lawrence Erlbaum Associates.– This has become the standard text for item development, oft cited in
measurement articles.
Item Analysis References
• Netsky, Bev. (2001). “Ask Dr. Psi: P-values and Point Biserials”. Bloomington, MN: Pearson VUE Accessed 14 June 2006 http://www.promissor.com/knowledge/askdrPsi/drcat20010223.asp.
– Pearson VUE’s Promissor is the online test division of Pearson/NCS where Dr. Psi (testing) and Dr. Phi (mathematics) reside.
• Varma, Seema. (--). Preliminary item statistics using point-biserial correlation and p-values. Morgan Hill, CA: Educational Data Systems.– This slim tutorial for educators from a Rasch shop demonstrates
the use of Excel to compute simple test statistics. SPSS syntax is also provided. Find them at http://www.eddata.com.

Alignment of District-Level & School-Level
Professional Development
SchoSchoolol4. Classroom-
based Assessment Plans
5. Explicit Instruction
6. Gather Evidence and Report Progress
DistricDistrictt1. Curriculum
Maps
2. Common District Assessments
3. Professional Development


Guiding Questions
1. What do we want each student to learn?
2. How will we know if they have learned?
3. How do we respond when students don't learn?
4. How do we respond if students already know the content?

The moral of the story?
One little item can be the seed for changing the
landscape for our students!

Narrators’ Contact Information
• JoAnne Buiteweg, Curriculum & Assessment Specialist
[email protected], Educational Service Center
• Peter Hendrickson, Ph.D., Assessment Specialist
[email protected], Educational Service Center
• Debra Ritchhart, Instructional Facilitator for Literacy
[email protected], Heatherwood Middle School