The Crude Oil Tanker Market - FONASBA · Over the next few slides we will illustrate the current...
48
banchero costa Fonasba Annual Meeting 2013 The Crude Oil Tanker Market (an analysis of the VLCC, Suezmax and Aframax tanker sectors) September 2013 Chartering & Documentary Committee Plenary Meeting Lima , Wednesday 23rd October 2013
Transcript of The Crude Oil Tanker Market - FONASBA · Over the next few slides we will illustrate the current...
banchero costa
Fonasba Annual Meeting 2013
The Crude Oil Tanker Market(an analysis of the VLCC, Suezmax and Aframax tanker sectors)
September 2013
Chartering & Documentary Committee Plenary Meeting
Lima , Wednesday 23rd October 2013

Index
1. Fleet Development page 3
2. Shipbuilding Trends page 17
3. Detailed Age Profiles page 26
4. The Demand Side page 33
5. The Charter and S&P Markets page 39
6. Final Words page 47
2

Fleet Development(Deliveries, Demolition, and Fleet Growth)
3
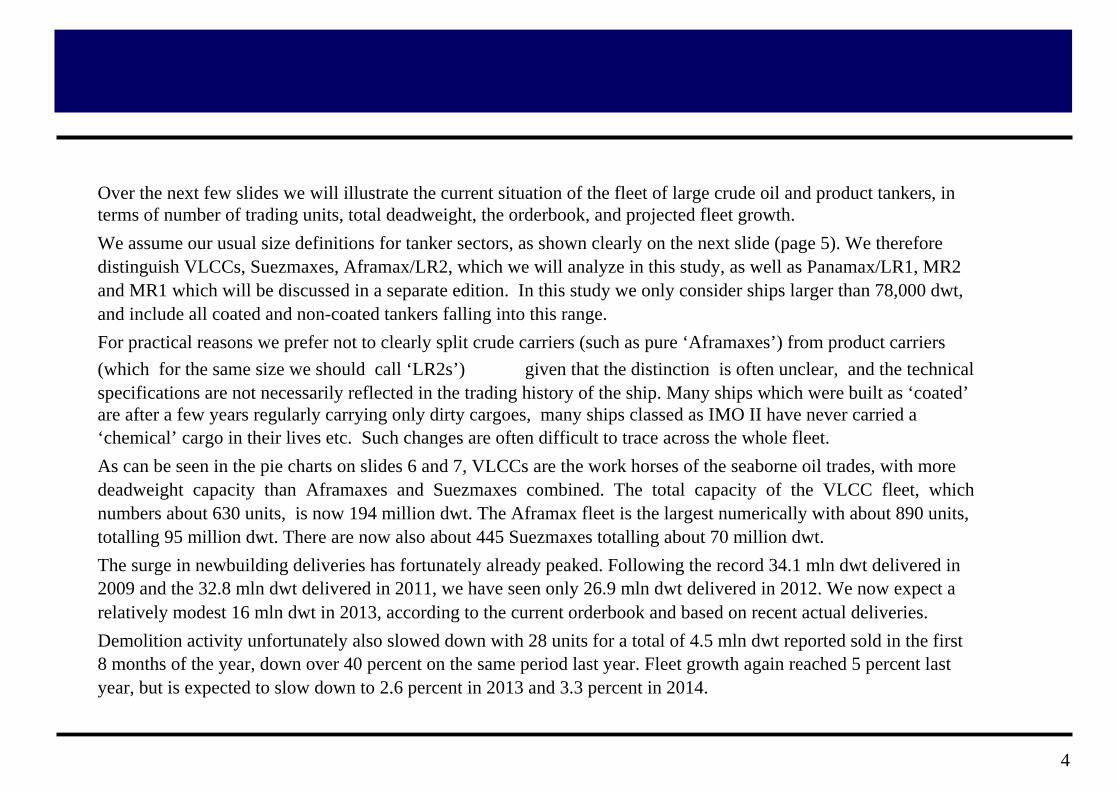
Over the next few slides we will illustrate the current situation of the fleet of large crude oil and product tankers, interms of number of trading units, total deadweight, the orderbook, and projected fleet growth.We assume our usual size definitions for tanker sectors, as shown clearly on the next slide (page 5). We therefore distinguish VLCCs, Suezmaxes, Aframax/LR2, which we will analyze in this study, as well as Panamax/LR1, MR2 and MR1 which will be discussed in a separate edition. In this study we only consider ships larger than 78,000 dwt, and include all coated and non-coated tankers falling into this range.For practical reasons we prefer not to clearly split crude carriers (such as pure ‘Aframaxes’) from product carriers(which for the same size we should call ‘LR2s’) given that the distinction is often unclear, and the technicalspecifications are not necessarily reflected in the trading history of the ship. Many ships which were built as ‘coated’are after a few years regularly carrying only dirty cargoes, many ships classed as IMO II have never carried a‘chemical’ cargo in their lives etc. Such changes are often difficult to trace across the whole fleet.As can be seen in the pie charts on slides 6 and 7, VLCCs are the work horses of the seaborne oil trades, with more deadweight capacity than Aframaxes and Suezmaxes combined. The total capacity of the VLCC fleet, which numbers about 630 units, is now 194 million dwt. The Aframax fleet is the largest numerically with about 890 units, totalling 95 million dwt. There are now also about 445 Suezmaxes totalling about 70 million dwt.The surge in newbuilding deliveries has fortunately already peaked. Following the record 34.1 mln dwt delivered in2009 and the 32.8 mln dwt delivered in 2011, we have seen only 26.9 mln dwt delivered in 2012. We now expect a relatively modest 16 mln dwt in 2013, according to the current orderbook and based on recent actual deliveries.Demolition activity unfortunately also slowed down with 28 units for a total of 4.5 mln dwt reported sold in the first8 months of the year, down over 40 percent on the same period last year. Fleet growth again reached 5 percent last year, but is expected to slow down to 2.6 percent in 2013 and 3.3 percent in 2014.
4

Our size definitions for tankers:
• VLCC (Very Large Crude Carriers) 200,000+ dwt
• Suezmax 120,000-199,999 dwt
• Aframax / LR2 (Long Range 2) 78,000-119,999 dwt
• Panamax / LR1 (Long Range 1) 60,000-77,999 dwt
• MR2 (Medium Range 2) 42,000-59,999 dwt
• MR1 (Medium Range 1) 32,000-41,999 dwt
(note1: in this study we will focus on VLCC, Suezmax and Aframax units only)
(note2: for all sizes, includes both coated and un-coated units, excluding
pure chemical, shuttle and specialist vessels)
5

Crude Tanker Fleet By Size Sector - by No. of Units(september 2013, coated and un-coated units over 78,000 dwt, number of units)
Aframax (coated)36719%
VLCC633
32%
Aframax (not-coated)52026%
Suezmax44523%
There are now over 630 trading VLCCs and about 445 Suezmaxes. The Aframax fleet is the largest numerically withabout 890 units of which about 367, or about 40 percent, are coated although not all are trading as such.
6

Crude Tanker Fleet By Size Sector - by DWT(september 2013, coated and un-coated units over 78,000 dwt, in mln dwt)
Aframax (coated)39
11%VLCC
19454%
Aframax (not-coated)56
16%
Suezmax70
19%
The total capacity of the VLCC fleet is now 194 million dwt. Suezmaxes total about 70 million dwt. The Aframax fleet,which is the largest numerically with about 890 units, totals 95 million dwt, of which 39 mln dwt is coated.
7

Crude Tanker Deliveries + Orderbook by(only units over 78,000 dwt)
Size - in DWT
40.0
35.0
30.0
25.0
20.0
15.0
10.0
5.0
0.02004 2005 2006 2007 2008 2009 2010 2011 2012 2013 2014 2015
Aframax/LR2 Suezmax VLCC
A glut of newbuildings has been delivered over the last five years. The peak, however, seems to be behind us, withactual deliveries in 2013 expected to be no more than 16 mln dwt. For 2014-15, the graph above depicts the total orders placed in the past, but due to slippage actual delays could be slightly lower than this.
8
mln
DW
T

Crude Tanker Newbuilding Deliveries in DWT - Monthly(only units over 78,000 dwt)
5.0
4.0
3.0
2.0
1.0
0.008/2011 11/2011 02/2012 05/2012 08/2012 11/2012 02/2013 05/2013 08/2013
Aframax/LR2 Suezmax VLCC
In the first 8 months of 2013 a reported 26 VLCCs have been delivered (for a total of 8.3 mln dwt), together with 17Suezmaxes (2.6 mln dwt) and 14 Aframaxes (1.5 mln dwt). Overall this is 44 percent less than in the same period of last year in terms of number of vessels, and 37 percent less in terms of total deadweight.
9
mln
DW
T

Crude Tanker Demolition Activity in DWT - Annual(only units over 78,000 dwt)
12
10
8
6
4
2
02004 2005 2006 2007 2008 2009 2010 2011 2012 2013(1-8)
Aframax/LR2 Suezmax VLCC
In 2012 as many as 67 tankers of over 78,000 dwt (for a total of 10.3 mln dwt) have been sold for scrap, compared to41 (for 5.2 mln dwt) in 2011. This year the figure will likely be lower, as the first eight months of 2013 saw only 28units reported for scrap, for a total of 4.5 million dwt.
10
mln
DW
T

Crude Tanker Demolition Activity in DWT - Monthly(only units over 78,000 dwt)
1.8
1.6
1.4
1.2
1.0
0.8
0.6
0.4
0.2
0.008/2011 11/2011 02/2012 05/2012 08/2012 11/2012 02/2013 05/2013 08/2013
Aframax/LR2 Suezmax VLCC
In the first 8 months of 2013 a reported 9 VLCCs have been reported as scrapped (for a total of 2.7 mln dwt), togetherwith 1 Suezmax (0.14 mln dwt) and 18 Aframaxes (1.8 mln dwt). Overall this is 47 percent less than in the same period of last year in terms of number of vessels, and 44 percent less in terms of total deadweight.
11
mln
DW
T

Crude Tanker Deliveries and Demolition in Jan-Aug 2013(only units over 78,000 dwt, in mln DWT)
10
9
8
7
6
5
4
3
2
1
0Aframax/LR2 Suezmax VLCC
Demolition Deliveries
In the first eight months of 2013 the number of Aframaxes sold for scrap (18) exceeded to the number of newbuildingdeliveries (14). However the VLCC fleet expanded significantly, with 26 newbuildings delivered and only 9 units sold for demolition. The total fleet expanded by 29 units, or 7.9 million dwt.
12
mln
DW
T
8.3
2.6 2.7
1.8 1.5
0.1

Projected VLCC+Suezmax+Aframax Fleet Growth(crude and product tankers of 78,000+ dwt, in mln dwt)
450
400
350
300
250
200
150
100
50
02006 2007 2008 2009 2010 2011 2012 2013(f) 2014(f) 2015(f)
VLCC+Suezmax+Aframax Fleet Size (in mln DWT) Y-o-Y Growth
Our growth forecast for 2013-2015 is based on the current orderbook delivered in full, and assuming demolition activityin line with what seen so far in the first eight months of the year. Therefore, actual deliveries could be lower due to slippage. However, slippage levels are not expected to be high as most ships are due from established Korean yards.
13
mln
DW
T
+7%+4%+8%
+3%+4%+4% +5% +3% +3% +1%

Projected VLCC Tanker Fleet Growth(crude and product tankers of 200,000+ dwt, in mln dwt)
250
200
150
100
50
02006 2007 2008 2009 2010 2011 2012 2013(f) 2014(f) 2015(f)
VLCC Fleet Size (in mln DWT) Y-o-Y Growth
Our growth forecast for 2013-2015 is based on the current orderbook delivered in full, and assuming demolition activityin line with what seen so far in the first eight months of the year. Therefore, actual deliveries could be lower due to slippage. However, slippage levels are not expected to be high as most ships are due from established Korean yards.
14
mln
DW
T
+4% +1%+3%+6%+8%+2%+6%+3%+3%+3%

Projected Suezmax Tanker Fleet Growth(crude and product tankers of 120-199,999 dwt, in mln dwt)
100
80
60
40
20
02006 2007 2008 2009 2010 2011 2012 2013(f) 2014(f) 2015(f)
Suezmax Fleet Size (in mln DWT) Y-o-Y Growth
Our growth forecast for 2013-2015 is based on the current orderbook delivered in full, and assuming demolition activityin line with what seen so far in the first eight months of the year. Therefore, actual deliveries could be lower due to slippage. However, slippage levels are not expected to be high as most ships are due from established Korean yards.
15
mln
DW
T
+4%+4%+5%+6%+9%+7%+8%+3% +1%+7%

Projected Aframax/LR2 Tanker Fleet Growth(crude and product tankers of 78-119,999 dwt, in mln dwt)
120
90
60
30
02006 2007 2008 2009 2010 2011 2012 2013(f) 2014(f) 2015(f)
Aframax/LR2 Fleet Size (in mln DWT) Y-o-Y Growth
Our growth forecast for 2013-2015 is based on the current orderbook delivered in full, and assuming demolition activityin line with what seen so far in the first eight months of the year. Therefore, actual deliveries could be lower due to slippage. However, slippage levels are not expected to be high as most ships are due from established Korean yards.
16
mln
DW
T
+11%
+6% +7% +5% +6% +4% +1% +2% +1%
-1%

Shipbuilding TrendsBuilders)(Size Evolution, Major
17

Crude Tanker Ordering Activity in DWT -(coated and un-coated units over 78,000 dwt)
Monthly
4.0
3.5
3.0
2.5
2.0
1.5
1.0
0.5
0.008/2010 02/2011 08/2011 02/2012 08/2012 02/2013 08/2013
VLCC Suezmax Aframax (non-coated) Aframax (coated)
Newbuilding orders were thankfully very sporadic throughout 2011 and 2012, as a result of the depressing marketconditions. However, more activity has been seen this year. Total new orders over the first 8 months of 2013 amounted to 68 units for 12.5 mln dwt. This is more than twice the 32 units ordered in the same period last year.
18
mln
DW
T

Crude Tanker Ordering in Jan-Aug 2013(only units over 78,000 dwt, in no. of units)
by Ship Size
Suezmax4% VLCC
34%Aframax (non-coated)3%
Aframax (coated)59%
This year newbuilding interest has clearly polarized towards two ship types: VLCCs and coated Aframaxes (i.e. LR2s).It is worth noting that only 2 of the 42 Aframaxes reported ordered this year are supposed to be non-coated.
19

VLCC (200,000+ dwt) Vessel Size Distribution(all vessels delivered in each year ; includes both coated and uncoated)
340,000
330,000
320,000
310,000
300,000
290,000
280,0001970 1975 1980 1985 1990 1995 2000 2005 2010 2015
Year of delivery
The ‘standard’ size of VLCCs built in recent years is now consolidating around 320,000 dwt, with almost all unitscurrently on order in the range between 317,000 and 322,000 dwt.
20
dead
wei
ght

Suezmax (120-200,000 dwt) Vessel Size Distribution(all vessels delivered in each year ; includes both coated and uncoated)
190,000
180,000
170,000
160,000
150,000
140,000
130,000
120,0001970 1975 1980 1985 1990 1995 2000 2005 2010 2015
Year of delivery
The most common size of Suezmax currently on order is 157,000 dwt, most of which are now being built by JiangsuRongsheng Shipbuilding.
21
dead
wei
ght
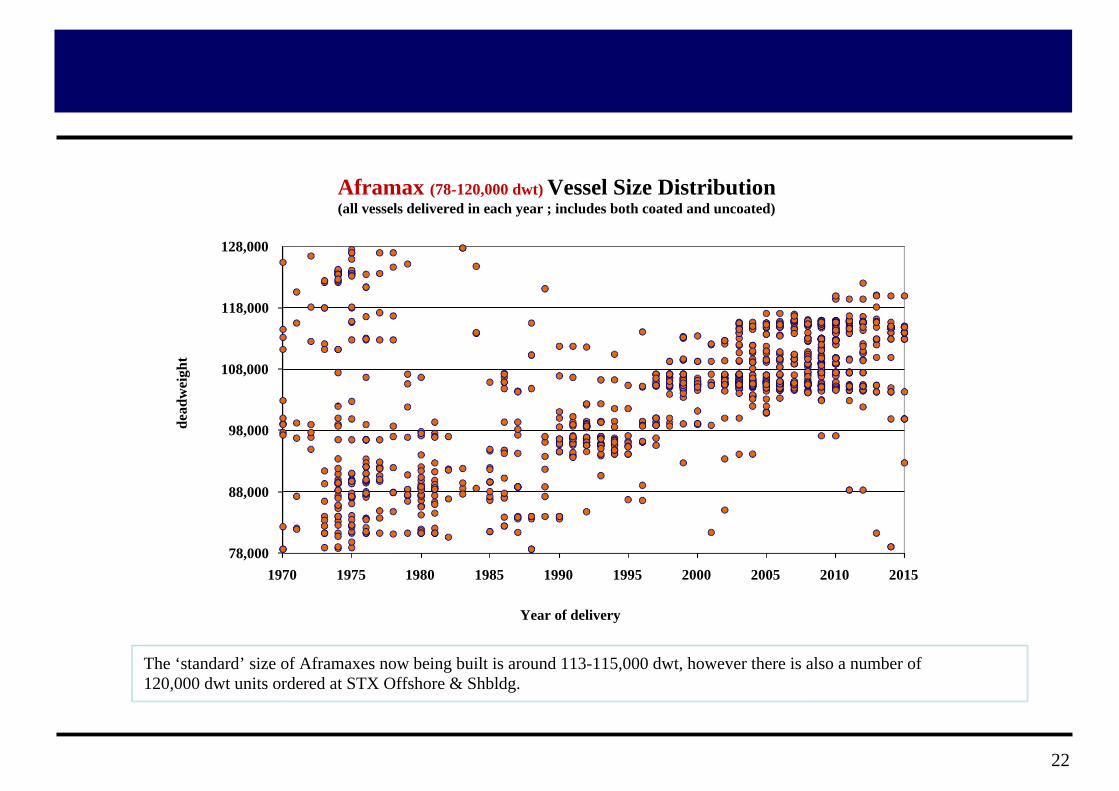
Aframax (78-120,000 dwt) Vessel Size Distribution(all vessels delivered in each year ; includes both coated and uncoated)
128,000
118,000
108,000
98,000
88,000
78,0001970 1975 1980 1985 1990 1995 2000 2005 2010 2015
Year of delivery
The ‘standard’ size of Aframaxes now being built is around 113-115,000 dwt, however there is also a number of120,000 dwt units ordered at STX Offshore & Shbldg.
22
dead
wei
ght

Tanker (78,000+ dwt) Orderbook Size Distribution(all deliveries due in each month ; includes both coated and uncoated)
360,000340,000320,000300,000280,000260,000240,000220,000200,000180,000160,000140,000120,000100,00080,000
08-2013 08-2014 08-2015 08-2016
Year of delivery
The orderbook for crude oil tankers is clearly focused on the standard sizes, with few niche or speculative designsunlike what we can see to some extent with dry cargo ships.
23
dead
wei
ght

Crude Tanker Ordering Activity by Country of Built(coated and un-coated units over 78,000 dwt, in number of units)
100
80
60
40
20
02010 2011 2012 2013 (1-8)
China Japan Korea Other
Of all tankers reported ordered so far this year, 42 out of 68 have been ordered at South Korean shipyards, which is a farhigher share than was seen last year. Chinese yards secured most of the rest.
24
num
ber
of u
nits
5
90
4244
21 21 20
2 4 4 4 2 6
204
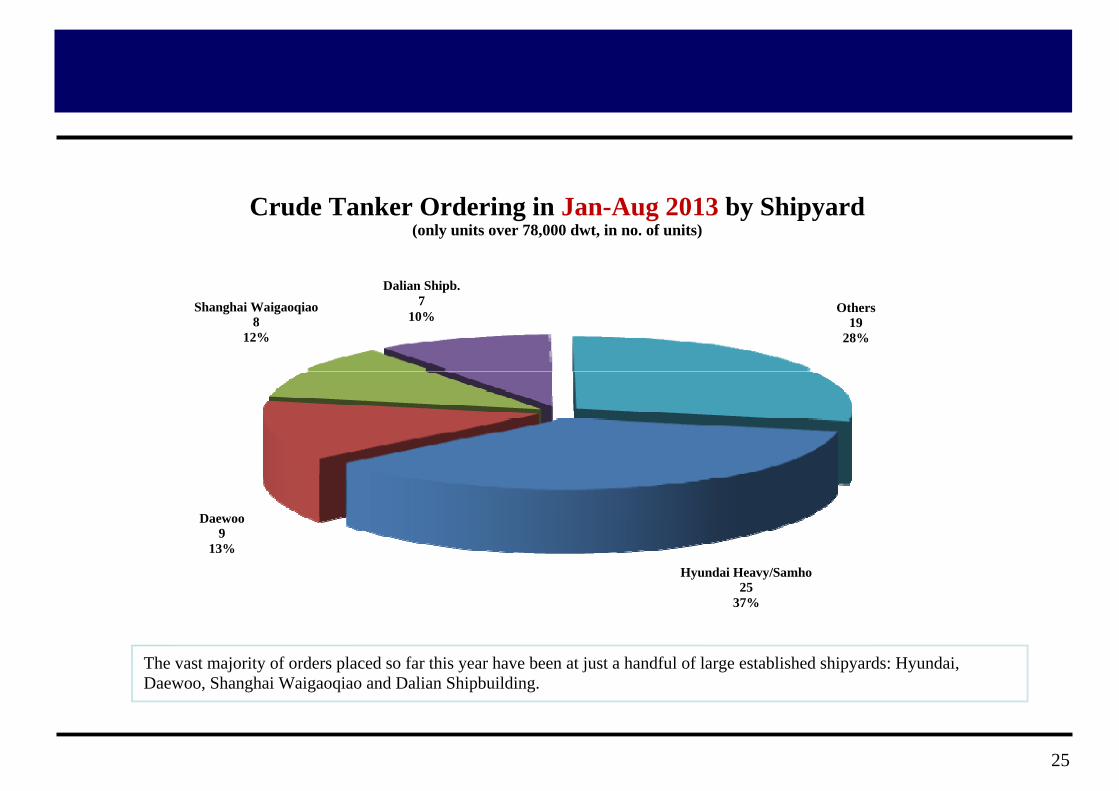
Crude Tanker Ordering in Jan-Aug 2013 by Shipyard(only units over 78,000 dwt, in no. of units)
Dalian Shipb.7
10%Shanghai Waigaoqiao
812%
Others19
28%
Daewoo9
13%
Hyundai Heavy/Samho25
37%
The vast majority of orders placed so far this year have been at just a handful of large established shipyards: Hyundai,Daewoo, Shanghai Waigaoqiao and Dalian Shipbuilding.
25
Detailed Age Profiles(For Individual Sectors)
26

VLCC/ULCC Tanker (200,000+ dwt) Age Profile (in units)
70
60
50
40
30
20
10
0
Scrapped or Total Loss Trading Orderbook(updated May 2013)
27
num
ber o
f ves
sels

VLCC/ULCC Tanker (200,000+ dwt) Orderbook/Trading9.5%Age Profile Pie (in units)
21-25 yrs (89-93)2%
26-30 yrs (84-88)0%16-20 yrs (94-98)
8% up to 5 yrs (blt 09-13)40%
11-15 yrs (99-03)27%
6-10 yrs (04-08)23%(updated Sep 2013)
28

Suezmax Tanker (120,000-199,999 dwt) Age Profile (in units)
50
40
30
20
10
0
Scrapped or Total Loss Trading Orderbook(updated Sep 2013)
29
num
ber o
f ves
sels

Suezmax Tanker (120,000-199,999 dwt)Age Profile Pie (in units)
Orderbook/Trading13.0%
21-25 yrs (89-93)3%
26-30 yrs (84-88)0%16-20 yrs (94-98)
10% up to 5 yrs (blt 09-13)42%
11-15 yrs (99-03)20%
6-10 yrs (04-08)25%(updated Sep 2013)
30

Aframax/LR2 Tanker(78,000-119,999 dwt) Age Profile (in units)
100
80
60
40
20
0
Scrapped or Total Loss Trading Newbuildings(updated Sep 2013)
31
num
ber o
f ves
sels
2012
2014
2016

Aframax/LR2 Tanker (78,000-119,999 dwt)Age Profile Pie (in units)
Orderbook/Trading7.4%
26-30 yrs (84-88)1%
21-25 yrs (89-93)4%16-20 yrs (94-98)
10% up to 5 yrs (blt 09-13)31%
11-15 yrs (99-03)21%
6-10 yrs (04-08)33%(updated Sep 2013)
32

The Demand Side(Oil Production, Demand, and Trade)
33
The EIA projects global crude oil and liquid fuels consumption to grow by 1.1 million barrels per day in 2013 andby another 1.2 million bbl/day in 2014. China, India, the Middle East, South America and other non-OECD countries will account for essentially all consumption growth. OECD liquid fuels consumption is expected to decline by 0.2 million bbl/s in both 2013 and 2014, driven by lower consumption in Europe and Japan.
The EIA projects total OPEC liquid fuels production to decline by 0.8 million bbl/d in 2013 and 0.2 million bbl/d in2014. This reflects unplanned outages of crude oil production among some OPEC members as well as strategic decreases in Saudi Arabia’s production in response to the increase in non-OPEC supply. On the other hand, non-OPEC liquid fuels production is expected to increase by 1.6 million bbl/d in 2013 and by 1.4 million bbl/d in 2014 according to the EIA. The majority of this growth will be from North America, amounting to 1.4 mln bbl/d in 2013 and 1.1 mln bbl/d in 2014, largely from US onshore tight oil and Canadian oil sands.
This last is a real game changer, as it leads to a repositioning of global oil trade. The immediate impact of this is negative – lower demand for shipments to the world's largest oil importer. Oil imports to the US have fallen to their lowest level since 1997. Indirectly, however, the result could even be positive. On a global basis there is now more supply than would otherwise be the case, and the increase in oil prices has been capped, both factors which stimulate more imports to emerging markets in Asia.
Both China and India are keen to diversify their oil supply sources so to avoid being excessively dependent on the volatile Middle East and therefore being too involved in the political and security problems of that region. The answer is to try to increase supplies from countries such as Angola, Nigeria and Venezuela. Angola is already the second largest supplier of oil to China after Saudi Arabia. Indian imports from Venezuela have increased threefold since 2011, according to Energy Aspects, and India is expected to displace the US as the primary destination for Nigerian oil already this year. Such developments lead to an actual increase in tonne-miles traded.
34

Crude Oil Trade
RussiaCanadaW. Europe
JapanUSAChina
Middle EastNorthAfrica
West Africa
India
Central/SouthAmericas
Major Oil Exporters in 2012: Major Oil Importers in 2012:Middle EastFSUWest Af rica S. America Canada North Af rica
881 mln tons (+0.2% y-o-y)302 mln tons (-5.4% y-o-y)216 mln tons (-3.6% y-o-y)157 mln tons (+12.9% y-o-y)122 mln tons (+9.0% y-o-y)107 mln tons (+47.8% y-o-y)
Europe USA China Japan IndiaSingapore
475 mln tons (+2.3% y-o-y)424 mln tons (-4.7% y-o-y)271 mln tons (+7.3% y-o-y)187 mln tons (+5.3% y-o-y)177 mln tons (+4.4% y-o-y)47 mln tons (-14.2% y-o-y)
35

World Crude Oil Trade in Volume Terms(source: BP, bancosta ; in million tonnes)
2200
2000
1800
1600
1400
1200
1000
800
600
400
200
0
2003 2004 2005 2006 2007 2008 2009 2010 2011 2012 2013(f)
Crude Oil Trade Y-o-Y Growth
Growth in global oil consumption has been hovering around 1.5-2 percent since the 1980s. However, growth in Asiahas been running at over 4 percent, and with the basis now higher countries like China and India will have an increasingly important role in global oil trade. Imports to the USA are now steadily declining.
36
mill
ion
tonn
es
-1%
+2% +2%
-4%-1%
+5% +6% +2% +3% +3% +1%

Non-OPEC Crude Oil and Liquid Fuels Production Growth(source: EIA Short Term Energy Outlook September 2013 , in mbpd)
3.2
2.8
2.4
2
1.6
1.2
0.8
0.4
0
-0.4
2012 2013 2014
Non-OPEC liquid fuels production is expected to increase by 1.6 mlnbbl/d in 2013 and by 1.4 mln bbl/d in 2014. Themajority of this growth will be from North America, 1.4 mln bbl/d in 2013 and 1.1 mln bbl/d in 2014.
37
mill
ion
barr
els p
er d
ay
USA
Can
ada
Chi
na
Bra
zil
Col
ombi
a
Rus
sia
Mal
aysi
a
Vie
tnam
Kaz
akhs
tan
Om
an
Oth
er N
.Sea
Gab
on
Aus
tral
ia
Indi
a
Egy
pt
Mex
ico
Suda
n
Aze
rbai
jan
Nor
way
Syri
a
UK

Crude Oil Imports by Region(source: BP energy review , in million tonnes)
2200
2000
1800
1600
1400
1200
1000
800
600
400
200
0
2003 2004 2005 2006 2007 2008 2009 2010 2011 2012
USA Europe Japan China Other Asia Other
Crude oil imports to the USA have been steadily declining over the last decade, as a result of increasing domestic outputand sluggish demand. Demand from China, India and South-East Asia has been increasing but for now not sufficiently to fully compensate for the decline in the OECD countries.
38
mill
ion
tonn
es
409 413 462395 449421 427370360343
146 163 179123 127
271203 235 25391209
210 207 205 203213 177 185 177 187
508 525 534 542 542489 513 465 464 475
480 501 501 503 502 487 443 456 445 424

Charter and S&P Markets(TC Rates, Prices, Sales)
39

Baltic Exchange Tanker TD3 TCE - Seasonality(source: the baltic exchange , daily data, usd/day)
90000
80000
70000
60000
50000
40000
30000
20000
10000
0
-10000Jan Feb Mar Apr May Jun Jul Aug Sep Oct Nov Dec
2010 2011 2012 2013
The freight market remains at historically low levels, with 2013 an even worse year than the last two. The third quarternow appears to be cyclically weak, and not that much improvement can be expected before next year.
40
usd/
day
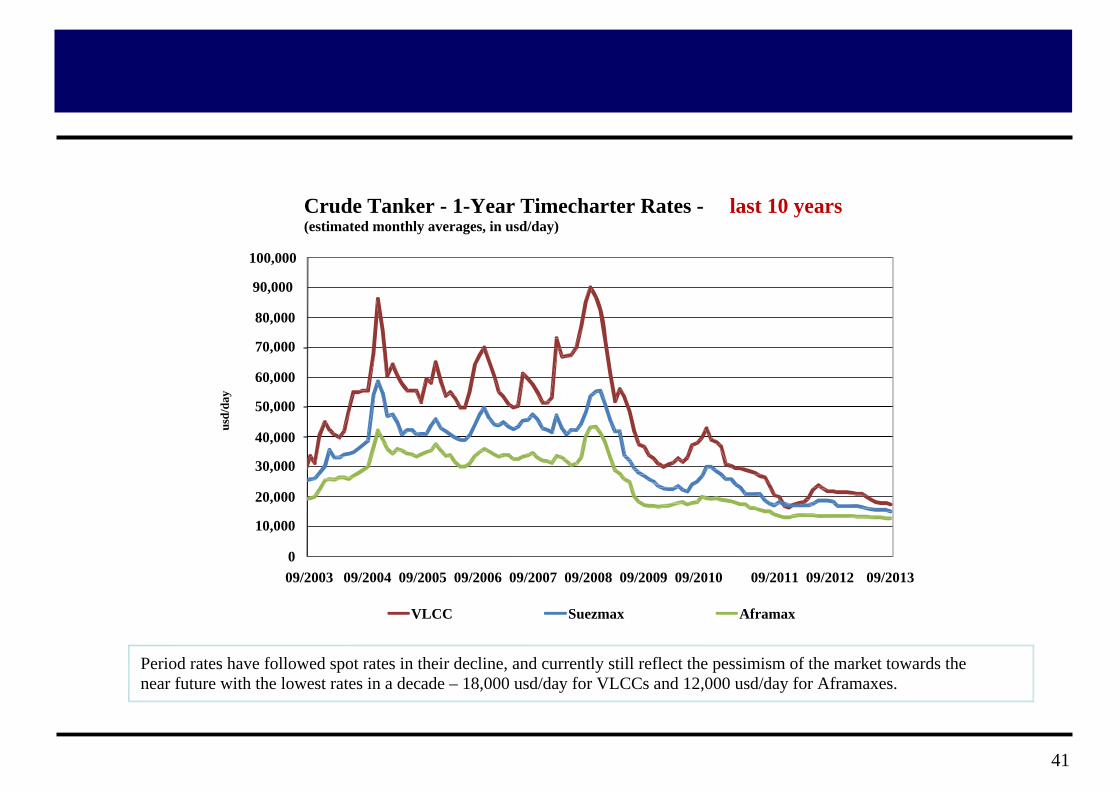
Crude Tanker - 1-Year Timecharter Rates -(estimated monthly averages, in usd/day)
last 10 years
100,000
90,000
80,000
70,000
60,000
50,000
40,000
30,000
20,000
10,000
009/2003 09/2004 09/2005 09/2006 09/2007 09/2008 09/2009 09/2010 09/2011 09/2012 09/2013
VLCC Suezmax Aframax
Period rates have followed spot rates in their decline, and currently still reflect the pessimism of the market towards thenear future with the lowest rates in a decade – 18,000 usd/day for VLCCs and 12,000 usd/day for Aframaxes.
41
usd/
day
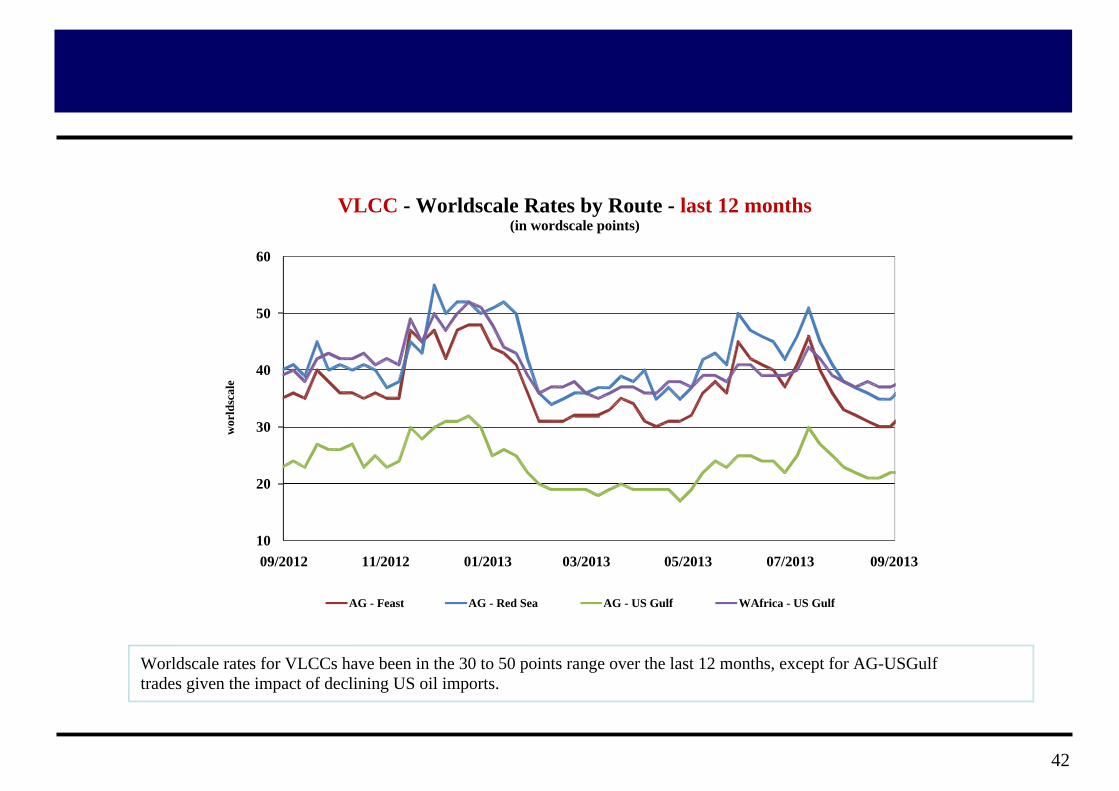
VLCC - Worldscale Rates by Route - last 12 months(in wordscale points)
60
50
40
30
20
1009/2012 11/2012 01/2013 03/2013 05/2013 07/2013 09/2013
AG - Feast AG - Red Sea AG - US Gulf WAfrica - US Gulf
Worldscale rates for VLCCs have been in the 30 to 50 points range over the last 12 months, except for AG-USGulftrades given the impact of declining US oil imports.
42
wor
ldsc
ale

Suezmax - Worldscale Rates by Route - last 12 months(in wordscale points)
100
90
80
70
60
50
40
30
2009/2012 11/2012 01/2013 03/2013 05/2013 07/2013 09/2013
Med - Med
Black Sea - Med
N.Sea - US Gulf
N.Sea - N. Sea
W. Africa - US Gulf
W. Africa - Med
AG - East
AG - West
Worldscale rates for Suezmaxes have been in the 50 to 70 points range over the last 12 months, except again for AG-West trades given the impact of declining US oil imports, whilst cross-North Sea has performed better.
43
wor
ldsc
ale

Aframax - Worldscale Rates by Route - last 12 months(in wordscale points)
130
120
110
100
90
80
70
60
50
4009/2012 11/2012 01/2013 03/2013 05/2013 07/2013 09/2013
Med - Med
Black Sea - Med
UKC - UKC
UKC - USAC
Baltic-UKC Ice Cl.
Baltic-UKC no Ice Cl.
AG - Feast
Indo/Sk-Jpn (80k)
Worldscale rates for Aframaxes have been more volatile in the 60 to 100 points range over the last 12 months, again withcross-North Sea performing somewhat better, and ex-Baltic trades being particularly seasonal.
44
wor
ldsc
ale

Crude Tanker - 5 Year Old Secondhand Prices - last 10 years(basis Korean built , indicative average , in USD mln)
180
160
140
120
100
80
60
40
20
009/2003 09/2004 09/2005 09/2006 09/2007 09/2008 09/2009 09/2010 09/2011 09/2012 09/2013
VLCC Suezmax Aframax
Second hand values have largely followed the fortunes of the charter market, recovering slightly in 2010 and thencontinuing their decline in the last two years. They are now at the lowest nominal level in a decade.
45
usd
mln

Tanker Reported Secondhand Sales - in No. of Units(all units over 78,000 dwt)
2624222018161412108642008/2008 02/2009 08/2009 02/2010 08/2010 02/2011 08/2011 02/2012 08/2012 02/2013 08/2013
Aframax/LR2 Suezmax VLCC
With second hand prices now at record low levels, they are becoming attractive to investors with spare liquidity or stillable to secure finance. Hence, sale and purchase activity seems to be picking up speed in recent months.
46
num
ber
of u
nits

Final Words(Summary and Conclusions)
47

The last few years have been some of the toughest in living memory for tanker shipowners, and prospects havehardly improved in recent months, given weak oil trade growth and persisting tonnage oversupply.
World oil consumption has grown at an average of only about 2 percent y-o-y since the 1960s. The EIA projects global liquid fuels consumption to increase by 1.1 million barrels per day in 2013 and by another 1.2 million bbl/day in 2014. Whilst OPEC production is expected to keep declining over the next few years, by 0.8 million bbl/d in 2013 and 0.2 million bbl/d in 2014, the vast majority of output expansion will be from North America, amounting to 1.4 mln bbl/d in 2013 and 1.1 mln bbl/d in 2014, largely from US onshore tight oil formations and Canadian oil sands.
One ray of light could appear in the form of increasing tonne-miles demand, as surging production in the US is changing global trade patterns. More oil from West Africa and South America is now heading to China and India, as they try to diversify away from their dependence on the volatile Middle East, whist the US, awash with light and sweet domestic oil is importing a larger percentage of heavy crude from the Middle East.
In an environment of chronically limited demand growth it would be logical to see modest investment in new capacity. Instead, the last decade saw record investments in new tankers. We saw the crude tanker fleet (over 78,000 dwt) expand by 7 percent in 2011 and by 5 percent in 2012, in terms of total deadweight.
Fortunately, ordering activity had virtually stopped over the previous two years and newbuilding deliveries are now clearly slowing down. The fleet is expected to expand by only 2.6% in 2013 and 3.3% in 2014. Deliveries this year will be the fewest since 2006, down 44 percent on last year. We are now seeing more orders though, as low prices and eco designs are enticing owners - 23 VLCCs and 42 Aframaxes have been ordered in the first 8 months.
The recovery will come, with the demand-supply balance now finally beginning to correct, but it could still take some time for the effects of fewer deliveries to be felt in the market. The short-term outlook remains negative.
48