The crisis and ArcelorMittal post crisiscorporate.arcelormittal.com/~/media/Files/A/... · ·...
22
The crisis and ArcelorMittal post crisis 16 September 2009 – Investor day – London & New York Lakshmi Mittal – Chairman and Chief Executive Officer
Transcript of The crisis and ArcelorMittal post crisiscorporate.arcelormittal.com/~/media/Files/A/... · ·...

The crisis and ArcelorMittal post crisis
16 September 2009 – Investor day – London & New York
Lakshmi Mittal – Chairman and Chief Executive Officer

1
Disclaimer
Forward-Looking Statements This document may contain forward-looking information and statements about
ArcelorMittal and its subsidiaries. These statements include financial projections and estimates and their underlying assumptions, statements regarding plans, objectives and expectations with respect to future operations, products and services, and statements regarding future performance. Forward-looking statements may be identified by the words “believe,” “expect,” “anticipate,”“target” or similar expressions. Although ArcelorMittal’s management believes that the expectations reflected in such forward-looking statements are reasonable, investors and holders of ArcelorMittal’s securities are cautioned that forward-looking information and statements are subject to numerous risks and uncertainties, many of which are difficult to predict and generally beyond the control of ArcelorMittal, that could cause actual results and developments to differ materially and adversely from those expressed in, or implied or projected by, the forward-looking information and statements. These risks and uncertainties include those discussed or identified in the filings with the Luxembourg Stock Market Authority for the Financial Markets (Commission de Surveillance du Secteur Financier) and the United States Securities and Exchange Commission (the “SEC”) made or to be made by ArcelorMittal, including ArcelorMittal’s Annual Report on Form 20-F for the year ended December 31, 2008 filed with the SEC. ArcelorMittal undertakes no obligation to publicly update its forward-looking statements, whether as a result of new information, future events, or otherwise.

2
Agenda
• The crisis and ArcelorMittal• The steel market post crisis• ArcelorMittal post crisis

3
The crisis and ArcelorMittal

4
Since September 2008, steel demand has fallen by mo re than 50% in Europe and the US*estimates at crisis trough**West EuropeSources: World Steel Association (WSA) and ArcelorMittal
US crude steel production and capacity utilization during crisis
The worst crisis in the developed world since the 30’s
-80%
-60%
-40%
-20%
0%
1932vs
1929
1945vs
1939
1975vs
1974
1983vs
1979
1993vs
1989
2009Evs
2007
20%
40%
60%
80%
100%
Steel production decline (LH)
Annual capacity utilisation* (RH)
Europe** crude steel production and capacity utilization during crisis
-80%
-60%
-40%
-20%
0%
1932vs
1929
1946vs
1944
1958vs
1955
1975vs
1973
1982vs
1978
1991vs
1988
2009Evs
2007
20%
40%
60%
80%
100%
Steel production decline (LH)
Annual capacity utilisation* (RH)

5
ArcelorMittal 3 dimensional strategy based on its h igh level of geographic diversification, value added products and integration mitigates cris is but had to be reinforced
* South America, Africa and CIS** China, Asia, Europe and US average (source SBB)*** Downstream integration is calculated as shipments distributed through AM3S divided by total shipments to steel service centers
ArcelorMittal shipments by region (base 100 in Q2 08)
ArcelorMittal upstream and downstream integration (%)
ArcelorMittal steel price and spot global HRC price (USD/t)
ArcelorMittal pre-existing strategy was not sufficient to face such a crisis
ProductGeography Value Chain
40
50
60
70
80
90
100
110
2Q08 3Q08 4Q08 1Q09 2Q09
North America Europe Emerging*
400
500
600
700
800
900
1,000
1,100
1,200
1,300
2Q08 3Q08 4Q08 1Q09 2Q09
ArcelorMittal price Spot global HRC price**
30%
35%
40%
45%
50%
55%
60%
65%
70%
75%
2Q08 3Q08 4Q08 1Q09 2Q09
Iron ore integration Distribution integration***

6
ArcelorMittal reaction to crisis
ArcelorMittal quarterly crude steel production (million tonnes)
Production cut announced in September 2008 and new industrial and financial plan initiated in October 2008
0
5
10
15
20
25
30
35
Q1 20
06Q2
2006
Q3 20
06Q4
2006
Q1 20
07Q2
2007
Q3 20
07Q4
2007
Q1 20
08Q2
2008
Q3 20
08Q4
2008
Q1 20
09Q2
2009
Production reduced by 50% since Q4 2008
Main industrial and financial initiatives:
• September 2008: Production cut announced
• October 2008: CAPEX plan cut, debt reduction target set, SG&A cost reduction plan initiated
• Q4 2008: Net debt reduced by USD 6bn
• February 2009: Cost cutting accelerated, working capital target announced, dividend cut, refinancing initiated (forward start facilities)
• April 2009: Issuance of convertible bonds• May 2009: Capital increase• May & June 2009: Issuance of bonds resulting in
total of USD 11.4bn of financing in Q2• End June 2009: Year-end debt reduction target
of USD 10bn nearly achieved

7* Assuming 5% cost reduction** Assuming plants hot-iddle cost is 25% of full costSources: World Steel Dynamics, CRU monitor, Annual reports, Bloomberg and ArcelorMittal estimates
Annual average HRC production cost with overhead
Cumulative capacity, m tonnes
Cash cost USD/tonne
0
200
400
600
800
1000
1200
0 50 100 150 200 250 300 350 400 450
Cost leadership has been maintained due in particul ar to active industrial optimisation, allowing positive operating cash-flow throughout the crisis
2008
2009e
ArcelorMittal weighted average target
ArcelorMittal cost leadership
100% output
60% output
Fixed cost per tonne base 100
Fixed cost base 100 *
Increase in fixed cost per tonne
Concept of optimisation
Full
Single unit steelmaker Multi-unit steelmaker
100 100
95 100 100 100 25** 25**
100 100
Average 70
+58% +17%
Hot-Idle
Full Full Full Full Full
Full Full Full
100 100
60%

8
Despite running at less than 50% of capacity utilis ation and facing a decline of more than 60% in steel spot price*, cash-flow from opera tion has remained positive
ArcelorMittal financial flexibility and strength
ArcelorMittal fixed costs annualised (in billion USD)
15
20
25
30
2008 Q4 2008 Q1 2009 Q2 2009
Sustainable SG&A and fixed cost reduction
Temporary fixed cost reduction
Actual Fixed cost
ArcelorMittal cash-flow from operation (in billion USD)
More than USD 10 billion of fixed cost
reduction
0
1
2
3
4
5
6
7
1Q 2
006
2Q 2
006
3Q 2
006
4Q 2
006
1Q 2
007
2Q 2
007
3Q 2
007
4Q 2
007
1Q 2
008
2Q 2
008
3Q 2
008
4Q 2
008
1Q 2
009
2Q 2
009
* From peak to trough

9
The steel market post crisis

10
Markets are not expected to normalise in Europe and the US in 2010*US and EU-15Sources: WSA and ArcelorMittal estimates
A slow and uncertain recovery in developed world…
Annual apparent steel demand in western world* (in Mt)
Monthly apparent steel demand in western world* (in Mt)
10
15
20
25
30
Jan-03 Jan-04 Jan-05 Jan-06 Jan-07 Jan-08 Jan-09
150
170
190
210
230
250
270
290
1984
1986
1988
1990
1992
1994
1996
1998
2000
2002
2004
2006
2008
2010
e20
12e
11*US, Canada, EU-15 and JapanSources: WSA and ArcelorMittal estimates
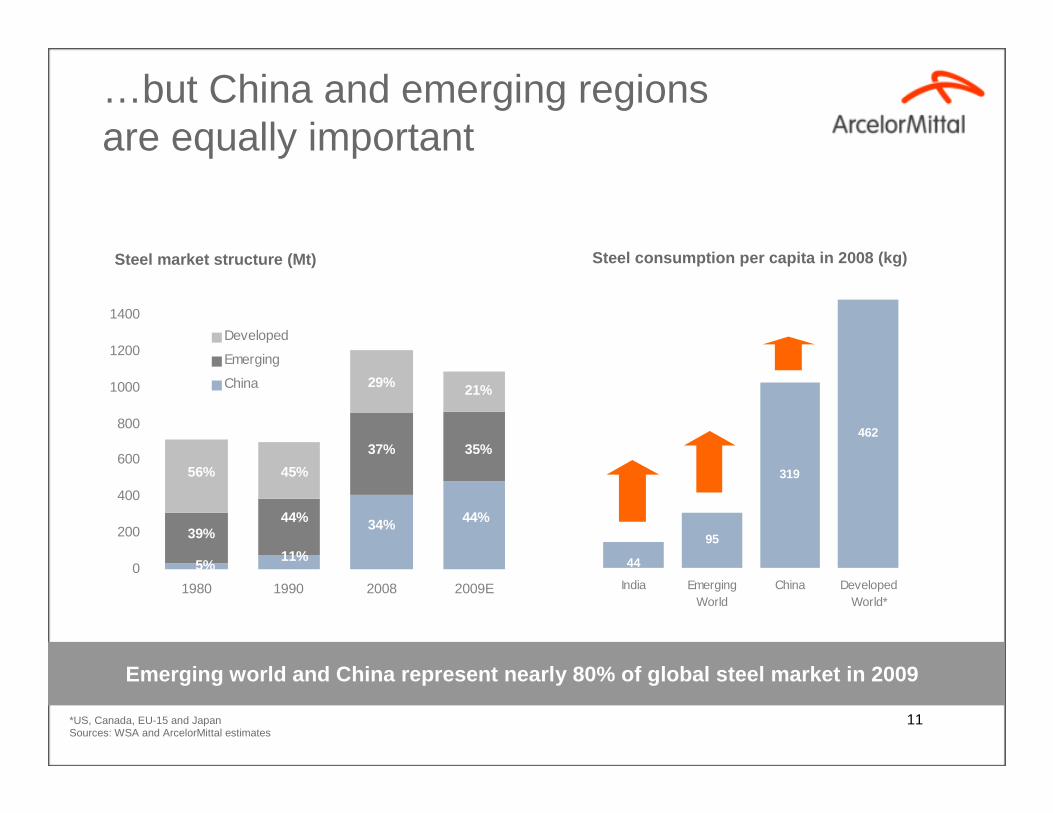
…but China and emerging regions are equally important
Steel market structure (Mt) Steel consumption per capita in 2008 (kg)
0
200
400
600
800
1000
1200
1400
1980 1990 2008 2009E
Developed
Emerging
China
56% 45%
29%
39%44%
37%
5%11%
34%
21%
35%
44%
95
319
462
44
India EmergingWorld
China DevelopedWorld*
Emerging world and China represent nearly 80% of gl obal steel market in 2009

12
Chinese domestic demand expected to increase by mor e than 15% in 2009
*Since crisis troughSources: WSA and ArcelorMittal
China is booming again and emerging markets are recovering rapidly
Chinese steel apparent demand (y-o-y) Crude steel production in South America (000’t)
Crude steel production in CIS (000’t)
5,000
7,000
9,000
11,000
13,000
Jan 05 Jan 06 Jan 07 Jan 08 Jan 09
2,000
3,000
4,000
5,000
Jan 05 Jan 06 Jan 07 Jan 08 Jan 09
+45%*
+43%*
-30%
-20%
-10%
0%
10%
20%
30%
40%
Jan-0
2Ja
n-03
Jan-0
4Ja
n-05
Jan-0
6Ja
n-07
Jan-0
8Ja
n-09
+31% in July

13
Chinese steel demand expected to slowdown in 2010 b ut to continue to growSources: WSA, SBB and ArcelorMittal estimates
Steel consumption per capita in 2008e (kg)
Western China
(160 kg)Coastal
China
(525kg)
Central China
(215 kg)
Development and growth potential
Population migration
Steel consumption per capita in 2008 (kg)
Chinese steel apparent demand (mt)
319597 717
1210
0
200
400
600800
10001200
1400
China Japan Taiw an Korea
Chinese growth is driven by stimulus plan and solid fundamentals
0
100
200
300
400
500
600
1984
1986
1988
1990
1992
1994
1996
1998
2000
2002
2004
2006
2008
2010
P20
12P
14
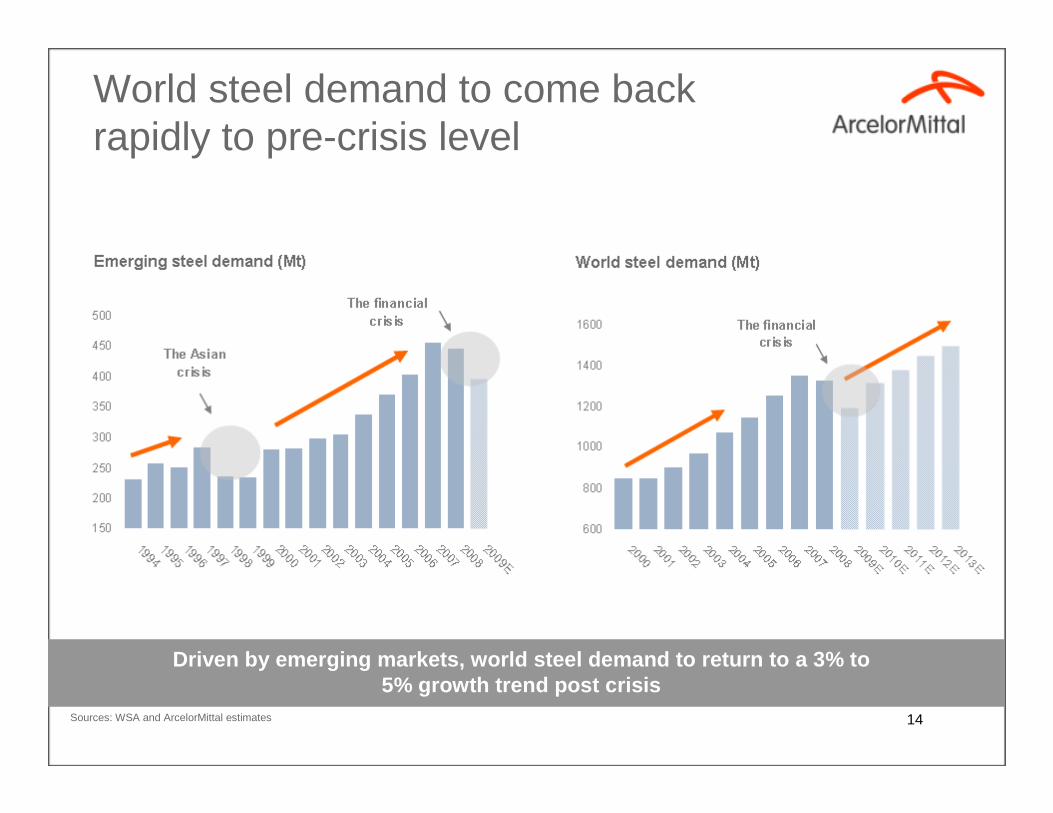
Driven by emerging markets, world steel demand to r eturn to a 3% to 5% growth trend post crisis
Sources: WSA and ArcelorMittal estimates
World steel demand to come back rapidly to pre-crisis level
Emerging steel demand (Mt) World steel demand (Mt)

15
ArcelorMittal post crisis

16* Finished steel
Capturing market recovery while controlling invento ry and cost
A more flexible industrial network and cautious production restarts
ArcelorMittal HRC cost curve average 2006-2008 (USD /t)ArcelorMittal steel production and shipments (Mt)
0
5
10
15
20
25
30
35
Q3 20
07Q4
2007
Q1 20
08Q2
2008
Q3 20
08Q4
2008
Q1 20
09Q2
2009
Q3 20
09E
Steel production* Steel shipments
200
300
400
500
600
700
0% 10% 20% 30% 40% 50% 60% 70% 80% 90% 100%
ArcelorMittal capacity
Plants and units to be progressively restarted according to cost and market position
Production in line with demand

17
Maintaining focus on sustainable management gains
0.41.2
1.72.0
3.0
0
1
2
3
4
Q2 2008 Q1 2009 Q2 2009 Q4 2009 Q4 2010
Captured Target
Management gains 2010
20%
Management gains plan
beyond 201040%
Fixed cost and SG&A cost
reduction 200940%
USD 5 billion of sustainable management gains target by 2012, of which USD 3 billion by 2010
5 years management gains plan breakdownManagement gains progress (USD billion annualised)

18
Optimizing supply chain and working capital
Significant improvement in working capital and supp ly chain is possible
ArcelorMittal steel shipments and inventory Working capital (rotation days)
50
100
150
Q12007
Q22007
Q32007
Q42007
Q12008
Q22008
Q32008
Q42008
Q12009
Q22009
Q32009E
Steel shipments (base 100) Steel inventory (base 100)
Under inventory
ArcelorMittal iron ore consumption and inventory
0
20
40
60
80
100
120
140
2Q2006
3Q2006
4Q2006
1Q2007
2Q2007
3Q2007
4Q2007
1Q2008
2Q2008
3Q2008
4Q2008
1Q2009
2Q2009
Target
50
100
150
Q12007
Q22007
Q32007
Q42007
Q12008
Q22008
Q32008
Q42008
Q12009
Q22009
Q32009E
Iron ore consumption* (base 100) Iron ore inventory (base 100)
Over inventory
* Total group consumption based on crude steel production

19
ArcelorMittal sales breakdown in Q2 2009
ArcelorMittal key emerging markets currently target ed for growth
ArcelorMittal’s leading position in emerging market s offers high growth potential
Reinitiating some projects to capture growth in key emerging markets
US & Canada
14%
EU-1538%
Emerging48%

20
Managing mining assets for an optimum level of self-sufficiency
Iron ore
Key mining assets and projectsArcelorMittal steel and iron ore production
Mining expansion to continue and internal raw materi al flow to be adjusted to new flexible industrial model
50
60
70
80
90
100
110
120
130
Q12007
Q22007
Q32007
Q42007
Q12008
Q22008
Q32008
Q42008
Q12009
Q22009
Crude steel production (base 100) Iron ore production (base 100)
Self-sufficiency increased
Coal

21