The Cost of Not Knowing: Observing How Financial Literacy ...
34
Pace University DigitalCommons@Pace Honors College eses Pforzheimer Honors College 2019 e Cost of Not Knowing: Observing How Financial Literacy Affects Amount of Retirement Saving Josina Genei Follow this and additional works at: hps://digitalcommons.pace.edu/honorscollege_theses Part of the Economics Commons
Transcript of The Cost of Not Knowing: Observing How Financial Literacy ...
Pace UniversityDigitalCommons@Pace
Honors College Theses Pforzheimer Honors College
2019
The Cost of Not Knowing: Observing HowFinancial Literacy Affects Amount of RetirementSavingJosina Genetti
Follow this and additional works at: https://digitalcommons.pace.edu/honorscollege_thesesPart of the Economics Commons
The Cost of Not Knowing: Observing How Financial Literacy Affects Amount of
Retirement Saving
Josina Genetti
Major: Economics
Faculty Advisor: Todd Yarbrough
Dyson College of Arts and Sciences: Economics Department
Phorzheimer Honors College Senior Thesis, May 2019
Graduation: May 2019
Running Head: THE COST OF NOT KNOWING 2
Abstract
The area of retirement research is focused on answering the question, “Are individuals saving
enough, and if not, how do we encourage higher saving?”. Previous research within this field
often uses a lifecycle model to project individuals saving habits. This paper explores the direct
effect of financial literacy on retirement savings within America using an ordinary least squared
regression model and cross sectional data from the Survey of Consumer Finances. The study is
carried out in two (2) parts. First, a regression is completed using the full sample of participants
in the 2016 year survey. Following this, four (4) separate regressions are carried out using the
same dependent and independent variables but only using participants based on their age
groups. The age groups used are 35–44, 45–54, 55–64. The model controls for common
influences on retirement savings including income, education, marital status, and gender.
Results showed that increased financial literacy has upward pressure on retirement savings at
the 99th confidence interval in the full model and across all age groups.
Running Head: THE COST OF NOT KNOWING 3
Table of Contents
1. Introduction------------------------------------------------------------------------- -4-7
2. Review of Literature---------------------------------------------------------------7-11
3. Methodology----------------------------------------------------------------------11-26
a. The Data------------------------------------------------------------------11-13
b. The Variables------------------------------------------------------------13-18
c. The Model----------------------------------------------------------------18-29
4. Discussion and Results----------------------------------------------------------19-26
5. Conclusion and Policy Recommendation-----------------------------------26-28
6. References-------------------------------------------------------------------------29-30
7. Appendix---------------------------------------------------------------------------31-33
Running Head: THE COST OF NOT KNOWING 4
The Cost of Not Knowing: Observing How Financial Literacy Affects Amount of Saving
Retirement is a concern that almost all Americans face at one time or another.
While this issue is of individual concern, it also has wide-reaching effects on the domestic
economy because it affects the amount of spending the government is liable to spend on
programs such as Medicare and Medicaid. According to the Government Accountability Office,
in 2015 only 29% of individuals 55 years or above had retirement savings or a defined benefit
plan. Of these 29%, the average savings of an individual between 55-64 years old was $104,000,
not including defined benefit plans (GOA, 2015). While recommended saving amounts at any
given age are dependent on many factors such as housing equity, even under the most positive
projections, individuals should have at least $221,000 at retirement.
Because of its integration into many critical parts of the economy, large amounts of
research has already been conducted on this topic, with varying conclusions being reached.
Some researchers have concluded that, because of reduced expenses in retirement years
through the lack of things such as child expenses (Scholz and Seshadri, 2006), individuals can
project lower income during their retirement years. Other arguments for this point of view
include the idea that retirees have more time for cost-cutting activities such as couponing or
discount shopping (Aguiar and Hurst 2005) and are more open/able to downsize in regards to
living accommodations.
While these facts may be true, counter research has shown that American retirees face
increasingly high costs for medical accommodations such as surgeries, prescription drugs, and
eventually, nursing homes (Skinner 2007). Additionally, programs such as social security are in
Running Head: THE COST OF NOT KNOWING 5
danger of being cut, and with the rise of popularity in Defined Contribution (DC) retirement
plans (Byrne et. al. 2006), individuals have a larger responsibility to make smart and forward
thinking decisions regarding their retirement. This problem has come amid a rising national
debt, currently at over $21 Trillion according to the National Debt Clock, and a government
looking for areas to shave off the budget. Many politicians including the current Vice President
Mike Pence (2017) have identified health care entitlements as the best option for this saying ". .
. I[i]t's the health care entitlements that are the big drivers of our debt, so we spend more time
on the health care entitlements - because that's really where the problem lies, fiscally
speaking."
The rising responsibility on the individual has been acknowledged by an increase in
investment vehicles such as Target Date Funds (TDF’s) which are a type of actively managed
fund that re-balances to become less risky the closer to the target (retirement) date (Chang et.
al 2014). This does provide a more simplified way for individuals to handle retirement but are
not widely offered for the younger age groups, a common trend for many retirement resources.
It is these generations who are facing additional difficulties in the face of growing student debt
levels, stagnant wages, and housing prices rising back to pre-2008 recession levels. They also
face the reality of being apart of the “sandwich generation”, or the generation who is expected
to take care of both their children and parents financially.
Research has shown that two of the most efficient ways to maximize retirement
savings are to start saving early or retire later (Munnell, Orlova, and Webb 2013). However, it is
becoming increasingly difficult to begin saving for retirement early due to the lack of options in
retirement vehicles. Over the past several decades, companies have steadily been switching
Running Head: THE COST OF NOT KNOWING 6
from defined benefit retirement plans to defined contribution plans (Saad-Lessler, 2015). This is
because defined contribution plans expose companies to less liability in regards to their
employees' retirement as well as the growing trend of job hopping throughout one’s career.
This consequently places the responsibility of managing one’s own retirement into the hands of
the employees across all industries, a problematic situation considering only 12% of surveyed
workers felt “very confident” that they were able to make the correct decisions when it came
to investing and managing their retirement account (Larrimore et al. 2014).
In addition, this increased responsibility on the individual introduces behavioral
economic factors to retirement savings choices such as present bias. Present bias refers to an
individuals to give stronger weights to outcomes that are closer to the present time versus
those further in the future. In the framework of retirement savings, this converts to individuals
potentially choosing present consumption over future consumption. Related to this is the
economic term intertemporal choice. This defines the concept of individual’s current decisions
affecting what options are available to them in the future. Again, when thinking about it in
regards to retirement, by saving or investing money for retirement in the present, it reduces
current consumption causing their utility to potentially decrease. However, this restraint leads
to the growth of the lump sum of money available for retirement, therefore increasing the
amount of consumption, and potential utility, in the future.
A study done by Saad-Lessler (2015) evaluated U.S citizens’ preparedness for retirement
and found that 55% of Americans nearing the age of retirement (defined as between 55 and 64
years old) would be almost totally reliant on social security or would have to source their
retirement in other means. This includes alternatives such as working full or part-time late into
Running Head: THE COST OF NOT KNOWING 7
their life, taking on a large of credit card debt, economizing on housing options, or relying on
children or family.
This paper will evaluate the factors which affect non-employee managed retirement
investments, defined as “totalsave” in two parts: first using the total participants in the 2016
survey and then separating based on age brackets to determine changes in explanatory values
across brackets. The variable of interest “finlit”, is a categorical variable which evaluates an
individual’s financial understanding of topics such as time value of money, inflation, and
diversification. This study finds that respondents who answered more financial literacy
questions correctly saved more for retirement in the full model and across all age-groups.
1. Review of Literature
The main ideas throughout the retirement research community revolve around
two linked topics: are individuals saving enough for retirement, and if not, what are the logical
steps that can be taken to resolve the problem.
One area of concern which supports that individuals are not saving enough for
retirement is the reality of diminishing social security. As one of the three legs of the retirement
stool (Social Security, Personal Savings, Pension), it has been recognized as a concerning and
rising problem for future retirees if not remedied. Saad-Lessler, Ghilarducci, and Bahn (2015)
observe the decreasing amount of employer-sponsored retirement plans available to
employees. The paper states that “Between 1999 and 2011, the availability of employer-
sponsored retirement plans in the United States declined by eight percentage points, from 61
percent to 53 percent.” This amount is recognized to vary based on company size, industry,
Running Head: THE COST OF NOT KNOWING 8
and whether or not it is unionized. The latter especially is seen to minimize the decrease in
employer-sponsored retirement plans. It is also noted that even individuals who receive
employer-sponsored plans could be disadvantaged depending on whether it is a defined
contribution (DC) or defined benefit (DB) plan.
While a DB plan is managed by the employer, a DC plan is managed by the employee
and therefore more dependent on the financial literacy of the individual. Saad-Lessler,
Ghilarducci, and Bahn (2015) argue that those with DC plans are only minutely better off than
those with no retirement plan at all due to the potential lack of knowledge or initiative to invest
their own money.
Despite there not being a complete consensus on the future of retirees, it seems
probable that many will be retiring later or not at all. Given this, the second major question in
retirement savings must be addressed: what are the logical steps that can taken to minimize
this problem. One area of discussion which has been championed as a preventative solution is
increasing the populations’ financial knowledge, or literacy. Financial Literacy contributes to
making sound financial decisions because it depicts one’s understanding and ability to apply
financial knowledge. Therefore, lack of financial literacy can lead to decisions related to over-
borrowing, taking on high-interest rate mortgages, and not saving or investing money
throughout a working career for retirement.
Henager (2016) identifies the rising awareness of financial literacy, or lack thereof, since
The Great Recession. Unlike previous research, Henager examines the impact of better financial
literacy across numbered age groups rather than generational age groups in both short and
long term financial behavior. The results show support that, in the general public as well as

Running Head: THE COST OF NOT KNOWING 9
across ages from 18 to over 65, increased financial literacy have positive effects in short and
long term behavior. In addition, this research notes that “crystallized intelligence”, or
information gathered from experience, increases with age while “fluid intelligence”, or the
ability to manipulate and draw relationships between old and new information, decreases with
time. Since financial literacy as one’s ability to understand and apply personal finance
knowledge, it stands that middle aged individuals, who are using a mixture of crystallized and
fluid intelligence, make the most productive financial decisions.
One barrier to utilizing financial education to positively encourage individuals to behave
responsibly when making financial decisions is our understanding of how these behaviors are
influenced and formed. In other words, what is the most effective way to teach financial
literacy, and what we consider a financially literate person. A study by the Federal Reserve
(Hilgert, 2003), found that those who acquired their financial knowledge from personal sources
such as friends, family, or individual experiences were 63% more likely to score highly on a
financial literacy index. This is likely because the proximity to the results of said financial
decisions is taken as more “real”, which falls in line with financial theories such as mental
accounting in which people will be less free with their spending using cash than credit due to
the proximity and immediate loss of the cash.
Other solutions to the retirement crisis have been examined as summed up in Munnell,
Orlova, and Webb (2012) who created a model which sought to identify the levers which held
the most power over retirement income. Among these levers were asset allocation, age of
retirement, age at which one begins saving, and housing equity. The article argued that asset
allocation was among the least influential of the levers despite the heavy emphasis that
Running Head: THE COST OF NOT KNOWING 10
financial advisors and media place on it. Instead, it showed that the age in which you retire is
the most important factor as well as the age in which you begin saving. This is because of two
main reasons: larger time frames allow more compounding and there is more recovery time for
any potential financial setbacks. Additionally, the paper notes that a large factor which impedes
on retirement savings are penalties for pulling money out early. An example of this exists in
social security which takes 5/9 of one percent for every month before the normal retirement
age of 66. Taking benefits early is most likely a sign of an individuals inability to properly
smooth their consumption over the span of their lives. This takes forethought and must be
looked at from a preventative lens, such as increasing financial literacy or starting to save early.
Another major factor in the discussion of retirement saving is the differential between
low versus high earning individuals. Dynan (2004) confirms the idea of the permanent income
hypothesis first proposed by Friedman in 1957. This dictates that one’s consumption patterns
are determined by one’s permanent income (expected long term income) instead of their
current or temporary income. It also explains why people save, as they expect their labor
income to decrease at some point in time. Dynan’s study came to support this theory through
the use of three separate data sources: The Consumer Expenditure Survey, the Survey of
Consumer Finances, and the Panel Study of Income Dynamics. In addition it came to two other
important conclusions: those with higher incomes had a larger marginal propensity to save and
those who had higher saving rates when young did not also have higher dissaving rates when
older which has been suggested in the past. Instead, the study points to higher levels of
“bequeathing” instead.
Running Head: THE COST OF NOT KNOWING 11
In conclusion, previous research in this field has shown that there exists a lack of
support for individuals in their retirement savings path. With the decrease in offered defined
benefit plans and the uncertainty of social security, the responsibility for managing one’s
retirement is now more upon the individuals shoulders than before. As such, supplemental
information should be provided to assist in properly understanding this new responsibility. If
financial literacy shows a positive relationship with being active in investing for retirement,
than financial education should be supported by governments and private institutions.
2. Methodology
The Survey of Consumer Finances
This paper uses the Survey of Consumer Finances which is a cross-sectional
survey distributed by the Federal Reserve in cooperation with the Department of Treasury and
University of Chicago. The original survey, given in 1983, was created to measure financial
wealth as well as financial decisions within households. Since this period, it has been conducted
every 3 years with panel data taken for the 1983 (re-surveyed in 1986 and 1989) and 2007 (re-
surveyed in 2009) surveys.
The survey has been adapted since its inception in 1983; further information on specific
questions that were added or removed are available on the Federal Reserve’s website. In
addition to the standard survey, a Survey of Pension Providers (SPP) was distributed in 1983
and 1989. The 2016 data set was used as it reflects the most recent information available. The
2016 survey contains 6,500 household interviewed with a total of 31,240 observations.
Running Head: THE COST OF NOT KNOWING 12
This survey was chosen based on its use within other economic literature as well as the
size of the survey pool and the number of questions. The SCF covers a wide range of topics
including those relating to demographics, assets, debts, income, spending habits, and financial
behavior. It should be noted that this survey is voluntary, so if there is a trend in demographics
who did not respond to the survey, they would likely not be reflected in this data set.
One major benefit of the Survey of Consumer Finances is the comprehensive list of
questions geared towards understanding the reasoning behind the respondent's decisions to
hold assets or accrue debt, commonly termed as “attitudinal” questions. They include questions
that evaluate risk aversion, saving habits, income expectations, and financial literacy. The latter
is based on a set of three (3) questions:
1. “Do you think that the following statement is true or false: Buying a single company’s
stock usually provides a safer return than a stock mutual fund?”
a. True
b. False
2. “Suppose you had $100 in a savings account and the interest rate was 2 percent per
year. After five years, how much do you think you would have in the account if you left the
money to grow?”
a. More than $102
b. Exactly $102
c. Less than $102
3. Imagine that the interest rate on your savings account was 1 percent per year and
inflation was 2 percent per year. After one year, would you be able to buy:
a. More than today
b. Exactly the same as today
c. Less than today
Running Head: THE COST OF NOT KNOWING 13
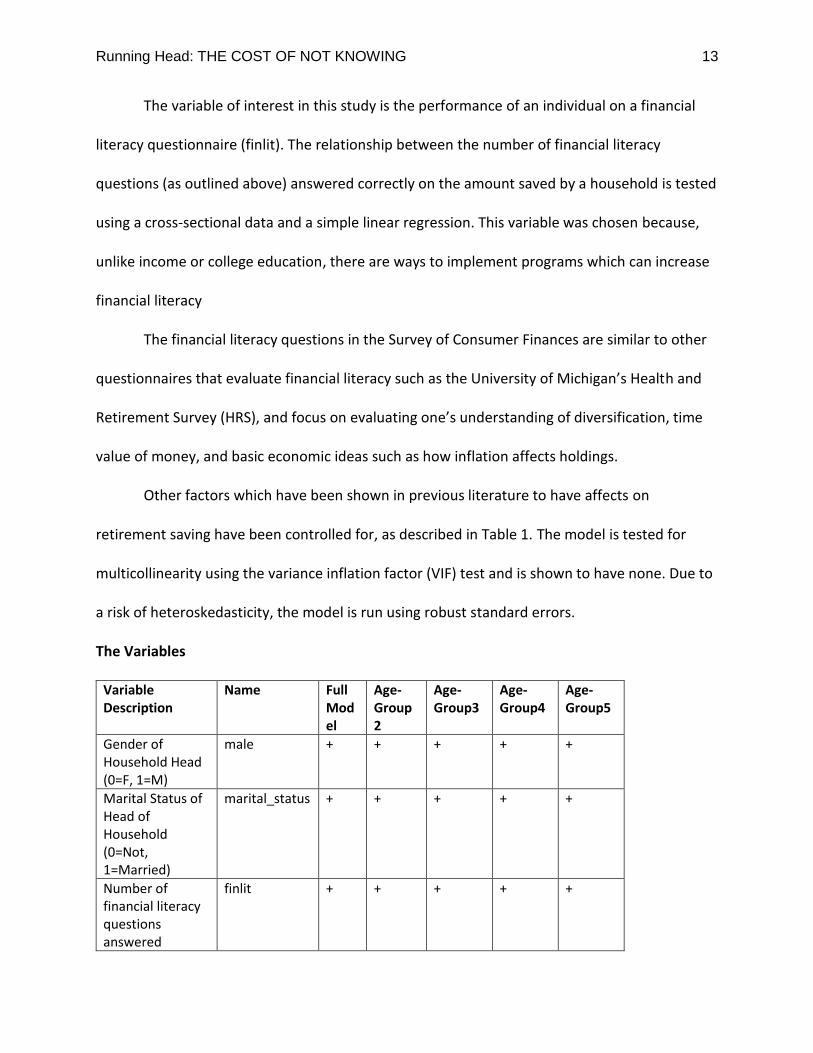
The variable of interest in this study is the performance of an individual on a financial
literacy questionnaire (finlit). The relationship between the number of financial literacy
questions (as outlined above) answered correctly on the amount saved by a household is tested
using a cross-sectional data and a simple linear regression. This variable was chosen because,
unlike income or college education, there are ways to implement programs which can increase
financial literacy
The financial literacy questions in the Survey of Consumer Finances are similar to other
questionnaires that evaluate financial literacy such as the University of Michigan’s Health and
Retirement Survey (HRS), and focus on evaluating one’s understanding of diversification, time
value of money, and basic economic ideas such as how inflation affects holdings.
Other factors which have been shown in previous literature to have affects on
retirement saving have been controlled for, as described in Table 1. The model is tested for
multicollinearity using the variance inflation factor (VIF) test and is shown to have none. Due to
a risk of heteroskedasticity, the model is run using robust standard errors.
The Variables
Variable Description
Name Full Model
Age-Group2
Age-Group3
Age-Group4
Age-Group5
Gender of Household Head (0=F, 1=M)
male + + + + +
Marital Status of Head of Household (0=Not, 1=Married)
marital_status + + + + +
Number of financial literacy questions answered
finlit + + + + +
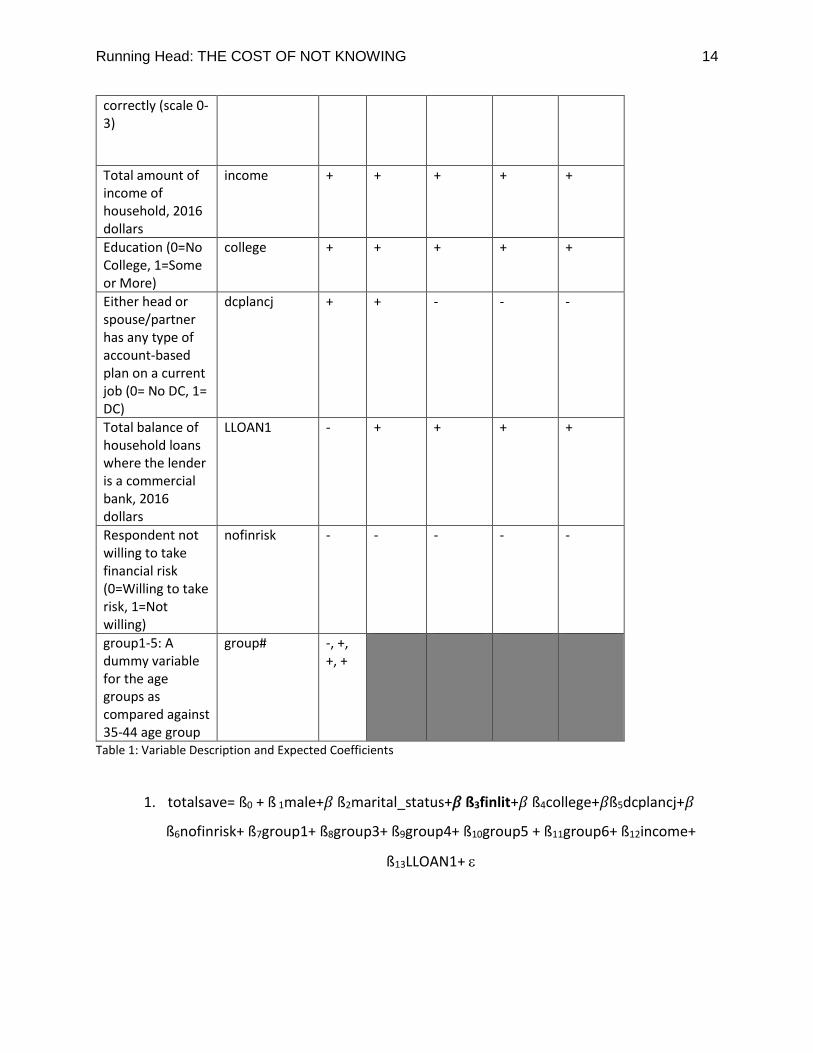
Running Head: THE COST OF NOT KNOWING 14
correctly (scale 0-3)
Total amount of income of household, 2016 dollars
income + + + + +
Education (0=No College, 1=Some or More)
college + + + + +
Either head or spouse/partner has any type of account-based plan on a current job (0= No DC, 1= DC)
dcplancj + + - - -
Total balance of household loans where the lender is a commercial bank, 2016 dollars
LLOAN1 - + + + +
Respondent not willing to take financial risk (0=Willing to take risk, 1=Not willing)
nofinrisk - - - - -
group1-5: A dummy variable for the age groups as compared against 35-44 age group
group# -, +, +, +
Table 1: Variable Description and Expected Coefficients
1. totalsave= ß0 + ß 1male+𝛽 ß2marital_status+𝛽 ß3finlit+𝛽 ß4college+𝛽ß5dcplancj+𝛽
ß6nofinrisk+ ß7group1+ ß8group3+ ß9group4+ ß10group5 + ß11group6+ ß12income+
ß13LLOAN1+
Running Head: THE COST OF NOT KNOWING 15
When choosing from the available surveyed parameters, previous literature was highly
consulted. The Y variable, total save, is estimated as the “total value of equity in directly-held
stocks, stock mutual funds, and combination mutual funds held by household” plus the
“amount in other bond mutual funds” and the “amount in government bond mutual funds” all
of which are being measured in 2016 dollars. It is recognized that this is a loose interpretation
of saving and that some of these assets could not be included in a formal retirement vehicle.
These include savings for college or homes which could be pulled out earlier in one’s life than
retirement savings. This can result in a decrease of savings that is counterintuitive from what
would be expected of accrued retirement savings based on age.
As this study was done in two parts: first regressing all participants of the study and
then regressing amongst different age groups, the expectations of coefficients shown in Table1
were done consecutively. Therefore, the flipped expected sign in LLOAN1 and the defined
contribution indicator variable are in response to observations found in the original model
regression.
Income was chosen due to its relation with the ability to save. Logic would dictate that
those who earn more are less concerned with obtaining the basic necessities such as food,
water, and shelter, and are therefore actually able to set aside funds for retirement. Dynan,
Skinner, and Zeldes (2004), support the positive relationship between household income and
the percentage of income saved; as such, we would also expect our coefficient within this study
to be positive in both the full model as well as all four age groups. This variable is measured in
the dollar denomination of the year the survey is taken, in this case, 2016.
Running Head: THE COST OF NOT KNOWING 16
The gender variable is based on the payment structure currently found which suggests
men have higher lifetime earning potential than females, as supported by Ruel (2013) using the
Survey of Consumer Finances. It is also pointed out within Ruel’s paper that the gender of the
best financial reporter (BFR) is more likely to be a male. This is reflected in the 2016 data which
showed men responding as the head of household 76.7% of the time. This heavy response rate
should be noted when running the regression and could inflate the expected positive
magnitude of the variable slightly. While it is expected that this coefficient will be positive in all
5 regressions, we would also expect gender to have a stronger magnitude in later age groups,
as gender stratification is seen more in upper management than entry positions.
Whether an individual is married was also chosen to control for based on previous
literature, specifically the University of Wisconsin-Madison study in 2006 which suggests that
marital status has a significant effect on one’s ability to meet retirement goals and therefore a
positive coefficient within this study. This could have an effect in the future as marriage rates
are shown to be trending downward in the United States according to the Center for Disease
Control and Prevention.
Education is controlled for as a variable that is shown to be positively correlated with
earning potential and therefore is expected to have upward pressure on retirement savings as
well. Connected to this, studies such as Tamborini (2017), show that the availability of defined
contribution plans to enroll in is less in those who are less educated. To further magnify this,
the study shows that of those offered a plan, less-educated individuals are less likely to enroll
and, if they do, contribute at significantly lower amounts. This inequality in income earning
years is shown even more sharply during the actual retirement years.
Running Head: THE COST OF NOT KNOWING 17
The next variable chosen for this paper was whether an individual had a defined
contribution plan. In the SCF, this variable is an indicator variable and therefore does not
provide a dollar amount in which it can be measured, however, given the rise of defined
contribution plans in recent decades, it seemed prudent to include. Additionally, defined
contribution plans would likely be more sensitive to financial literacy levels than defined benefit
plans given the nature of self-investment that comes along with them, giving them an expected
positive coefficients. After the original regression, it was found that the coefficient for defined
contribution was negative. This led to the expectation of age-groups 3,4, and 5 to be negative
as well. Age-group2’s expectation remained positive as summary statistics of the data showed a
higher rate of DC plan usage within this generation.
The amount of loans held by a commercial bank was included as a seemingly
competitive variable to the Y. Every dollar that is put towards loan repayments would be money
that is not going towards retirement savings. Additionally, with the continuously rising cost of
college, people within all age ranges have been forced to begin making decisions between
paying off student loans or saving for college versus building a nest egg. As there exists a
potential opportunity cost between this and the Y variable, the coefficient would be expected
as negative. After running the full model, this expectation was not observed, and so future
expectations for the age-group regression were modified to be positive.
An individual’s risk aversion also has significance in how much one saves for retirement.
A large defining factor in investment choice is the investor’s appetite for risk. It would be
expected that those who are more risk averse would choose a safer investment option such as
Running Head: THE COST OF NOT KNOWING 18
a savings account which is not included in the Y variable. Therefore, we would expect that this
variable will have a negative relationship with totalsave.
As age is also evaluated in retirement research as an incredibly important factor, it is
also included as an independent variable. Munnell (2013) suggests that the age of retirement
and the age in which one starts saving are the two most significant factors which affect the
amount of funds available for retirement. This is partially due to an increased time period
allowing for greater compounding of assets, but also has a behavioral aspect that suggests
better planning and/or financial constraint. In addition, as mentioned in Henager, different age
groups make decisions using different forms of intelligence and reasoning with middle aged
individuals making the “smartest” choices. As age is being categorized within this study, we
would expect a natural accumulation of retirement savings as one got older meaning that
agegroup1, as the only group younger than the comparison group of 35-44, would have a
negative coefficient while agegroups 3, 4, 5, and 6, would all have positive coefficients.
The Model
The full data-set contained 31,240 observations. The age-group regressions, when
dropping group1 and group6, account for 23,250 participants, or 74% of the full data. The
variables chosen are a combination of continuous, indicator, and categorical. The continuous
financial variables include the Y variable (totalsave), income, and LLOAN1.
The indicator variables are the five age groups, male, marital status, college, dcplancj
and nofinrisk. These variables’ responses are interpreted as either one or zero responses. The
dummy variables coded responses are laid out in Table 1, with each variable being compared to
Running Head: THE COST OF NOT KNOWING 19
the negative version of the question (for example being male is coded as 1, and not male coded
as 0) except for the age groups. These are coded as “1” for being in the age group and “0” for
not being in the age group. The age group of 35-44 is not included as an indicator variable
agegroup as it is left as the comparison group. This means that any coefficient of the age groups
is interpreted as “individuals in agegroupX will have Y more/less savings on average than
individuals between 35-44 years old”. This age range was chosen as the best approximation of
the peak earning, and therefore savings time.
Financial Literacy is the only categorical variable and is measured on a range from 0-3, 0
being no financial literacy questions answered correctly and 3 being all of the financial literacy
questions were answered correctly.
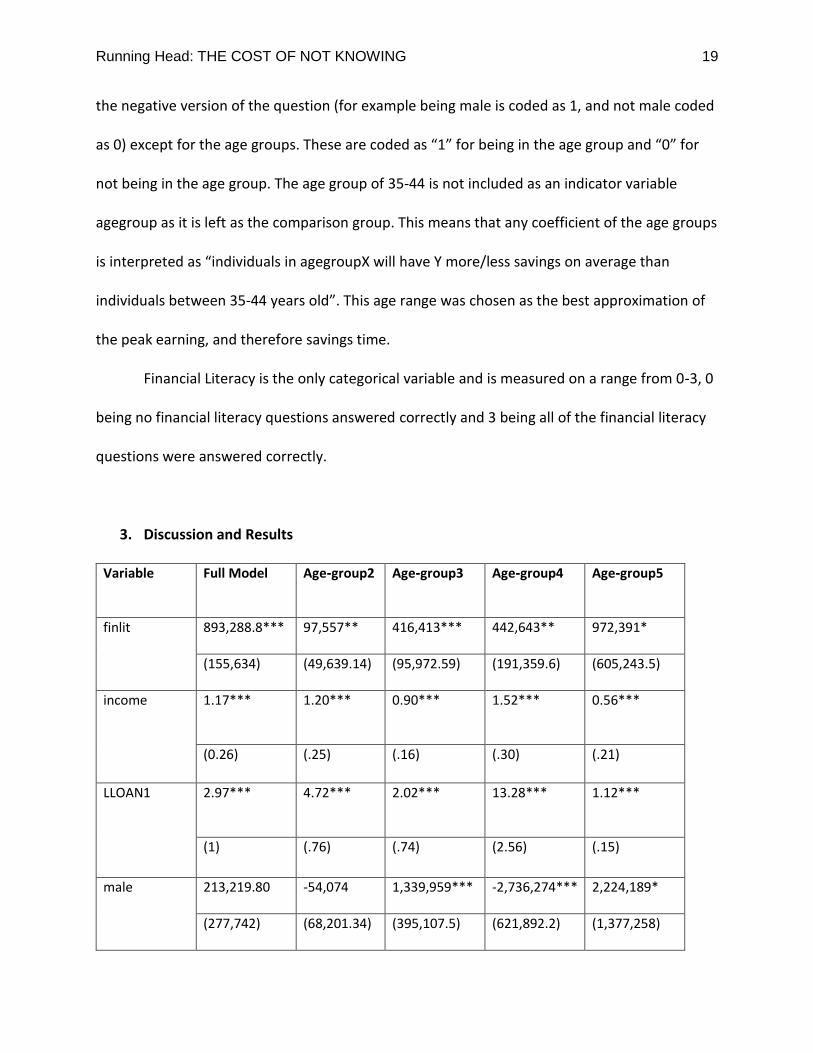
3. Discussion and Results
Variable Full Model Age-group2 Age-group3 Age-group4 Age-group5
finlit 893,288.8*** 97,557** 416,413*** 442,643** 972,391*
(155,634) (49,639.14) (95,972.59) (191,359.6) (605,243.5)
income 1.17*** 1.20*** 0.90*** 1.52*** 0.56***
(0.26) (.25) (.16) (.30) (.21)
LLOAN1 2.97*** 4.72***
2.02***
13.28***
1.12***
(1) (.76) (.74) (2.56) (.15)
male 213,219.80 -54,074 1,339,959*** -2,736,274*** 2,224,189*
(277,742) (68,201.34) (395,107.5) (621,892.2) (1,377,258)
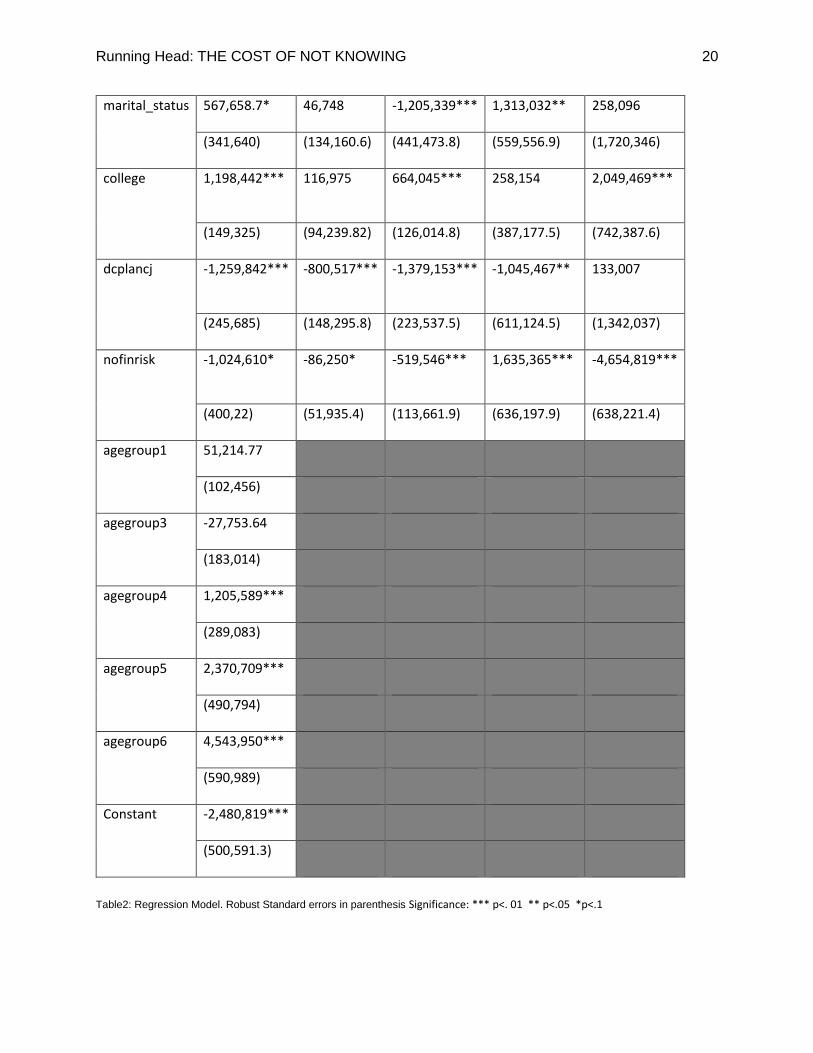
Running Head: THE COST OF NOT KNOWING 20
marital_status 567,658.7* 46,748 -1,205,339*** 1,313,032** 258,096
(341,640) (134,160.6) (441,473.8) (559,556.9) (1,720,346)
college 1,198,442*** 116,975
664,045***
258,154
2,049,469***
(149,325) (94,239.82) (126,014.8) (387,177.5) (742,387.6)
dcplancj -1,259,842*** -800,517***
-1,379,153***
-1,045,467**
133,007
(245,685) (148,295.8) (223,537.5) (611,124.5) (1,342,037)
nofinrisk -1,024,610* -86,250*
-519,546***
1,635,365***
-4,654,819***
(400,22) (51,935.4) (113,661.9) (636,197.9) (638,221.4)
agegroup1 51,214.77
(102,456)
agegroup3 -27,753.64
(183,014)
agegroup4 1,205,589***
(289,083)
agegroup5 2,370,709***
(490,794)
agegroup6 4,543,950***
(590,989)
Constant -2,480,819***
(500,591.3)
Table2: Regression Model. Robust Standard errors in parenthesis Significance: *** p<. 01 ** p<.05 *p<.1
Running Head: THE COST OF NOT KNOWING 21
Model Full Model Age-group2 Age-group3 Age-group4 Age-group5
Sample Size 31,240 5,135 6,170 7,230 4,715
Adjusted R^2 16.2% 33.8% 31.9% 55.6% 7.0%
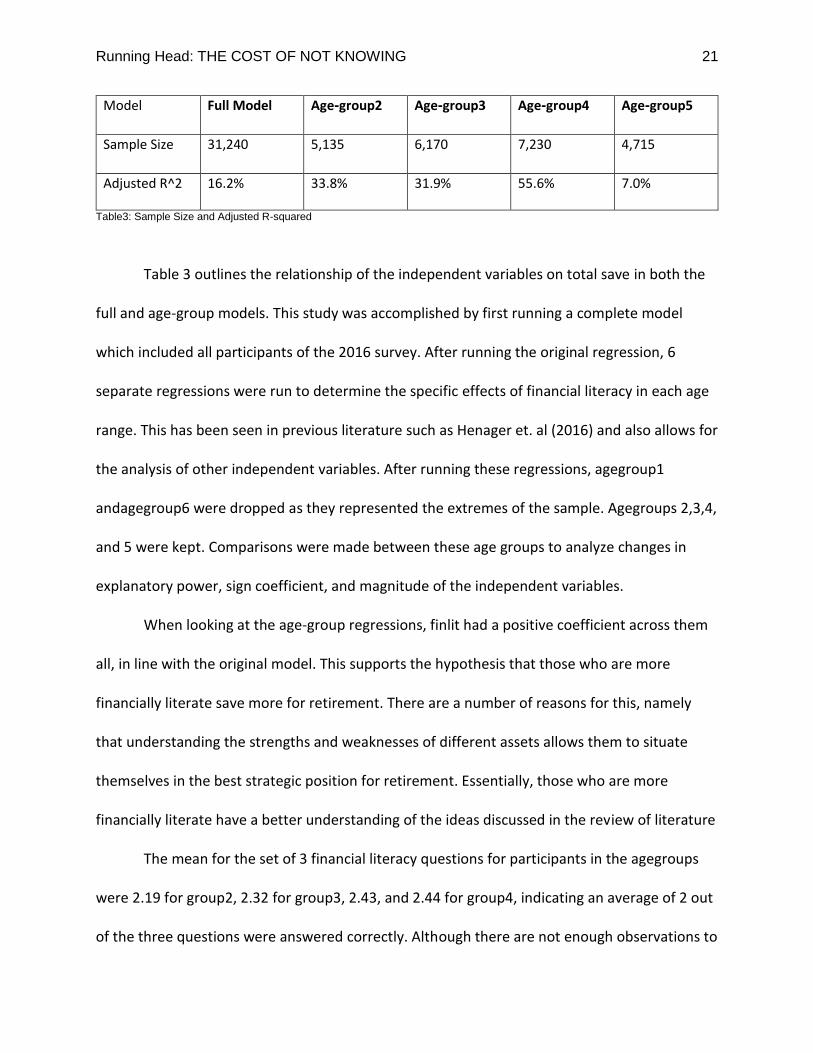
Table3: Sample Size and Adjusted R-squared
Table 3 outlines the relationship of the independent variables on total save in both the
full and age-group models. This study was accomplished by first running a complete model
which included all participants of the 2016 survey. After running the original regression, 6
separate regressions were run to determine the specific effects of financial literacy in each age
range. This has been seen in previous literature such as Henager et. al (2016) and also allows for
the analysis of other independent variables. After running these regressions, agegroup1
andagegroup6 were dropped as they represented the extremes of the sample. Agegroups 2,3,4,
and 5 were kept. Comparisons were made between these age groups to analyze changes in
explanatory power, sign coefficient, and magnitude of the independent variables.
When looking at the age-group regressions, finlit had a positive coefficient across them
all, in line with the original model. This supports the hypothesis that those who are more
financially literate save more for retirement. There are a number of reasons for this, namely
that understanding the strengths and weaknesses of different assets allows them to situate
themselves in the best strategic position for retirement. Essentially, those who are more
financially literate have a better understanding of the ideas discussed in the review of literature
The mean for the set of 3 financial literacy questions for participants in the agegroups
were 2.19 for group2, 2.32 for group3, 2.43, and 2.44 for group4, indicating an average of 2 out
of the three questions were answered correctly. Although there are not enough observations to
Running Head: THE COST OF NOT KNOWING 22
make a conclusive observation, there does seem to be signs of “diminishing returns” between
financial literacy and agegroup.
In agegroup2, 44.5%, or a little under half of the participants, answered all three of the
financial literacy questions correctly, a unexpectedly large percentage. This is compared with
only 4.5% answering none correctly and the remaining 51% answering either one or two
correctly. Although these results are higher than expected, Agegroup1 still has the highest
percentage of individuals answering all three wrong and the lowest percentage of individuals
answering all three right. The natural progression of percent of population getting all three
questions rights suggests that part of financial literacy is a natural development with age, but
also pinpoints younger agegroups as the periods in which benefit the from financial courses
would be greatest. Another observations is that, although financial literacy does increase
through age, the coefficients increase of the variable increase at much faster rates over the
same agegroups. This suggests the marginal value of financial literacy is also increasing as one
ages.
In the full model, Income and LLOAN1, the two continuous variables, both showed
multiplying effects to totalsave in that a one-dollar increase in either led to a $1.17 and $2.97
dollar increase in the Y variable. This means that each additional dollar earned, leads to more
than one additional dollar saved. While this was expected for the income variable, it was not for
the LLOAN1 variable. The explanation behind this positive and high (in comparison to the
income variable) magnitude of coefficient can be attributed to two different factors: firstly, as
this variable is a measure of all loans held by commercial banks specifically, it is mainly loans
taken out for homes or college, both of which indicate a high income and some existing level of
Running Head: THE COST OF NOT KNOWING 23
financial stability. Secondly, given the assumption that many of these loans are for homes, the
time of the survey (2016) would suggest a stringency from commercial banks on who they
would lend money to. After the financial crisis of 2008 that was largely caused by a faulty
mortgage epidemic, commercial banks increased the credit standards for those looking to take
out mortgages. This means that individuals who are accepted to take out loans would be those
who have shown financial responsibility in the past.
Breaking the sample down further into age-group regressions shows some interesting
results for both the income and LLOAN1 variable. For income, Agegroup 4 (55-64) has the
largest magnitude of coefficient at 1.52 with agegroup2 (35-44) having the second largest at
1.20. This suggests that, while income is a large influence on retirement savings across ages, it is
especially important when you start out. In addition, those who have more income during their
later working years, also have more accumulated savings than those who have less. This
relationship between retirement savings and income is weaker during agegroup5 likely because
there exists many more opportunity costs to retirement savings than in youth or older years. It
is the weakest in agegroup5, at which point individuals are pulling funds out of retirement
savings to act as income, and therefore there is not a 1 to 1 replacement rate.
In regards to LLOAN1, it remains positive across all four age groups, reaching its highest
magnitude in agegroup4 at 13.28. This indicates that for every dollar in commercial bank loans,
the individual has $13.28 in retirement savings, a full $10.32 above the original regression.
Given that the coefficient of this variable is a ratio of sorts, the large difference can be
explained by external life events not being accounted for in this model. Namely, the age range
of 55-64 not only represents the range just on the brink of retirement and therefore at the apex
Running Head: THE COST OF NOT KNOWING 24
in amount of savings, but also a range in which loans are beginning to taper off. At this time,
many individuals have choose to either downsize or are at the end of paying off a mortgage
which decreases the loans held with commercial banks. This naturally means that with a drop
off in amount of loans but the same amount of previous savings as well as final additions to the
pool, the ratio between the two would increase dramatically.
In the full model, Marital Status and nofinrisk showed significance at the 90th percentile
with marital status having an expected positive and moderately heavy coefficient. Nofinrisk
within this model put upward pressure on the totalsave variable contrary to expectations. A
reason behind this could be the omission of traditional savings, money market, and certificate
of deposit accounts, all of which offer a safer and less risky options than the ones presented in
this model.
Another factor to consider is the interpretation of financial literacy by individuals. As
there was no set definition provided, people may be judging their risk levels at different
baselines. Due to heterogeneity in individual risk assessments, interpreting coefficients
associated with self-reported risk measures should done with skepticism.
In the age regressions, marital status’s statistical significance oscillates between age
groups and concludes that, in this study, marriage is not a signifier for whether one will save
more or less for retirement in the youngest or oldest analyzed agegroups. In agegroup 3 and 4,
it has high significance with downward pressure on totalsave in group3 and upward pressure in
4. In regards to nofinrisk, the full model’s negative coefficient holds true for all age-groups
except for age-group 4. Here, it is not only positive, but with a large magnitude. From a financial
Running Head: THE COST OF NOT KNOWING 25
advisors standpoint, this makes sense because as you approach retirement age, your balanced
portfolio should become less risky due to the shortened time-frame.
The only variables which do not hold statistical significance within the full model are the
male, agegroup1, and agegroup3 indicator variables. The male variable, does gain significance
in agegroups 3,4, and 5. It is highly statistically significant in these age group regressions, but
the coefficient switches from positive in agegroup3, to negative in agegroups 4 and back to
positive in 5. This variation in coefficient explains the insignificance of the variable in the
original model and it can be inferred that the statistical insignificance of regression agegroup1,
is also due to a large volatility in totalsave within male identifying survey participants.
Regarding the Defined Contribution indicator variable, it carries a negative coefficient in
both the full and three out of four age-group models, contrary to expectations. The defined
contribution indicator variable remains negative in all age groups it holds significance, contrary
to both original and revised expectations. After running the original model, this coefficient was
assumed to be from lack of availability of DC plans in older age-groups, and the negative would
become positive in younger age-groups. After breaking the sample down, this was not proven
true.
This suggests that having a retirement savings plan does not necessarily dictate better
savings habit, either due to lack of information on how to invest or lack of discretionary funds
to contribute. It should be noted that, although it remains negative, the magnitude is much less
in the youngest agegroup, suggesting credibility to the idea that it is the recentness of usage in
these plans that contributes to the negative sign. The indicator variable for willingness to taking
financial risk remains negative in all but agegroup4. Here, it is not only positive, but with a large
Running Head: THE COST OF NOT KNOWING 26
magnitude. From a financial advisors standpoint, this makes sense because as you approach
retirement age, your balanced portfolio should become less risky due to the shortened time-
frame.
In the full model, the age group variables 4, 5, and 6 all had coefficients in the expected
direction and were with chronologically increasing magnitudes. This is supported through the
individual age-group model’s summary statistics as well.
4. Conclusion and Policy Recommendations
The model supports previous literature that an increase in financial literacy will increase
the amount of retirement savings, therefore supporting the hypothesis. This study used a
statistically significant multiple linear regression model using robust standard errors to obtain
unbiased coefficients given the likelihood of heteroskedasticity. A VIF test was used to test for
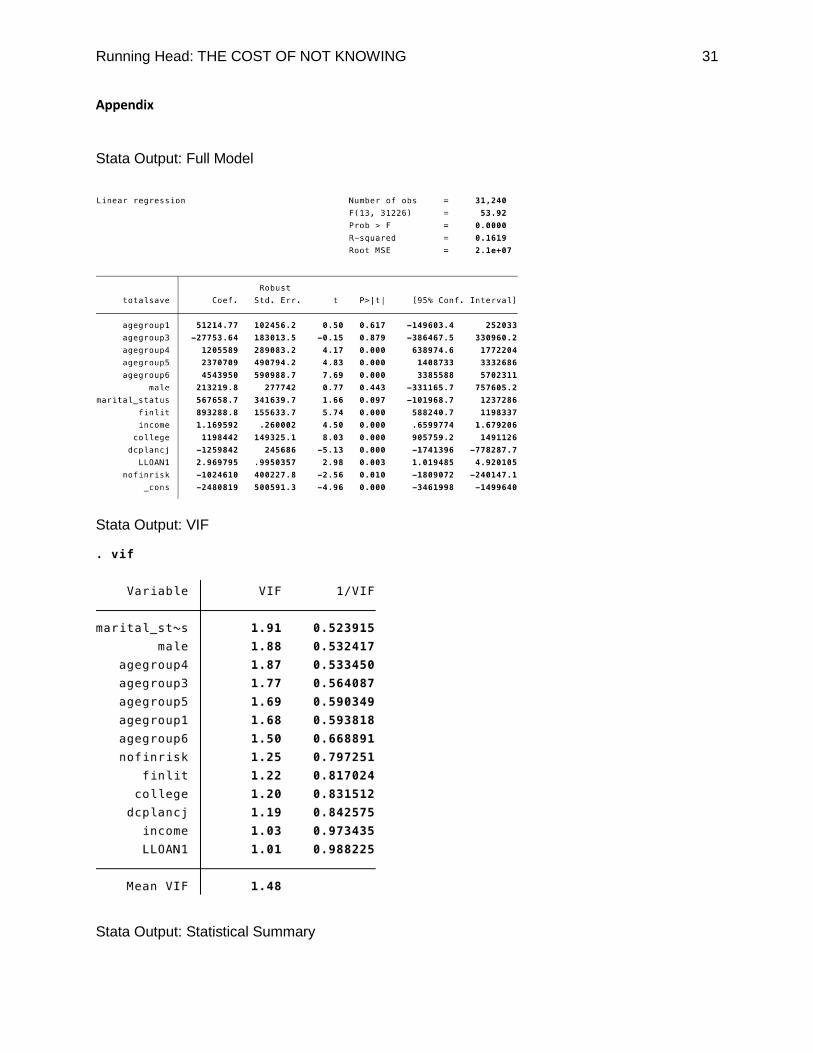
multicollinearity which was non-existent. Results from this test can be found in the Appendix.
This study lays the groundwork for further research. Specifically, utilizing a dependent
variable which specifically represents retirement savings in a defined contribution plan would
allow more accuracy in the coefficients of the independent variables. As the model stands, it is
possibly picking up savings for things such as mortgages or college savings. Interactions
between financial literacy and education, financial literacy and risk, as well as racial
demographics would assist in controlling the model further. In addition, dummy variables
regarding which financial literacy questions were answered correctly to identify if knowledge
regarding a certain type of economics or finance has a greater effect on retirement savings,
however this information was not available within the scope of this research.
Running Head: THE COST OF NOT KNOWING 27
Another factor that should be taken into account is student loans. While some were
incorporated within the loans from commercial bank variable, it would be beneficial to have a
variable specifically showing how many student loans an individual has. This would be a more
accurate representation as it would include loans from the government and the educational
institutions, which are often given more heavily to low income students. This would be
especially useful in a time series or panel model which could then view how and if increases in
student loans affect the amount of retirement savings.
This study ultimately observes that, while financial literacy is a factor of higher amounts
of retirement savings across all age groups, it is with the stipulation that the individual has the
means to save in the first place. Given this, it would be assumed that, therefore, financial
literacy should be aimed at those in higher income brackets. However, the data also suggests
that, between age groups, there exists diminishing returns to the affect financial literacy has on
individuals, i.e., the younger financial literacy is introduced, the more marginal benefit.
Ultimately, using conclusions between this and other research, it would be
recommended that governments support financial literacy programs specifically within public
education programs as this is their domain of influence. Furthermore, it would be suggested
that these courses focus on modules regarding financial concepts which educate on how money
can compound or depreciate in value, as well as the avenues one can pursue to open
retirement savings accounts. These courses are recommended to students in high school where
the imminence of workforce participation is more relevant.
In addition, similar modules could be introduced in workplaces, ideally with an incentive
for participating. This kind of system exists in some large companies for things such as health
Running Head: THE COST OF NOT KNOWING 28
education which shows precedence for its introduction. Additionally, one thing noted in
previous literature was how economic environments such as post Great-Depression (Lewis
2009) affected the proliferation of personal finance courses in high school. The rise of the
current wave of financial literacy research was sparked by The Great Recession. Therefore, it is
important to note that one concern surrounding financial literacy is the consistency of it’s
importance in society.
Ultimately, in America, a retirement crisis is a crisis for the government who is partially
responsible for providing support to older Americans through social security and Medicaid.
Individuals who have less savings are more likely to request these services which could lead to
increased strain on the government. Therefore, being more financially literate would lead to a
more individually sufficient population during retirement years.
Running Head: THE COST OF NOT KNOWING 29
References
Alexander Abramov, Alexander Radygin, & Maria Chernova. (2015). Long-term portfolio
investments: New insight into return and risk. Russian Journal of Economics, Vol 1, Iss
3, Pp 273-293 (2015), (3), 273. https://doi-org.rlib.pace.edu/10.1016/j.ruje.2015.12.001
Belke, A. H., Dreger, C., & Ochmann, R. R. (2012). Do Wealthier Households Save More? The
Impact of the Demographic Factor. SSRN Electronic Journal. doi:10.2139/ssrn.2078924
Chang, R. P., Hunter, D., Qianqiu Liu, & Saar, H. (2014). Saving for retirement while having
more nights with peaceful sleep: Comparison of lifecycle and lifestyle strategies from
expected utility perspective. Financial Services Review, 23(2), 169–188. Retrieved from
http://rlib.pace.edu/login?url=http://search.ebscohost.com/login.aspx?direct=true&db
=bu
h&AN=97329885&site=eds-live&scope=site
Gale, W. G., Harris, B. H., & Levine, R. (2012). Raising Household Saving: Does Financial
Education Work? Social Security Bulletin, 72(2), 39–48. Retrieved from
http://rlib.pace.edu/login?url=http://search.ebscohost.com/login.aspx?direct=true&db
=buh&AN=89253243&site=eds-live&scope=site
Henager, R., & Cude, B. J. (2016). Financial Literacy and Long- and Short-Term Financial
Behavior in
Different Age Groups. Journal of Financial Counseling and Planning, 27(1), 3–19.
Retrieved from
http://rlib.pace.edu/login?url=http://search.ebscohost.com/login.aspx?direct=true&db
=eric&AN=EJ1161904&site=eds-live&scope=site
John Karl Scholz, Ananth Seshadri, & Surachai Khitatrakun. (2006). Are Americans Saving
“Optimally” for Retirement? Journal of Political Economy, (4), 607. https://doi-
org.rlib.pace.edu/10.1086/506335
Karen E. Dynan, Jonathan Skinner, & Stephen P. Zeldes. (2004). Do the Rich Save More?
Journal of Political Economy, (2), 397. https://doi-org.rlib.pace.edu/10.1086/381475
Running Head: THE COST OF NOT KNOWING 30
Larrimore, Jeff, Mario Arthur-Bentil, Sam Dodini, and Logan Thomas. Report on the Economic
Well-Being of U.S. Households in 2014. Board of Governors of the Federal Reserve System
(2015).
Saad-Lessler, J., Ghilarducci, T., & Bahn, K. (2015). Are U.S. Workers Ready for Retirement?
Trends in Plan Sponsorship, Participation, and Preparedness. Retrieved October 4,
2018, from
http://www.economicpolicyresearch.org/images/docs/research/retirement_security/Ar
e_US_Workers_Read
y_for_Retirement.pdf
Skinner, J. (2007). Are You Sure You're Saving Enough for Retirement? The Journal of
Economic Perspectives, 21(3), 59-80. Retrieved from
http://www.jstor.org.rlib.pace.edu/stable/30033735
Tamborini, C. R., & Chang Hwan Kim. (2017). Education and Contributory Pensions at Work:
Disadvantages of the Less Educated. Social Forces, 95(4), 1577–1605. https://doi-
org.rlib.pace.edu/10.1093/sf/sox024
Mark Aguiar, & Erik Hurst. (2005). Consumption versus Expenditure. Journal of Political
Economy, (5), 919. https://doi-org.rlib.pace.edu/10.1086/491590
Munnell, A. H., Orlova, N., & Webb, A. (2013). How Important is Asset Allocation to
Americans’ Financial Retirement Security? The Market for Retirement Financial Advice,
89-106. doi:10.1093/acprof:oso/9780199683772.003.0005
Office, U.S. Government Accountability. “Retirement Security: Most Households Approaching
Retirement Have Low Savings.” U.S. Government Accountability Office (U.S. GAO), 2
June 2015, www.gao.gov/products/GAO-15-419.
Running Head: THE COST OF NOT KNOWING 31
Appendix
Stata Output: Full Model
Stata Output: VIF
Stata Output: Statistical Summary
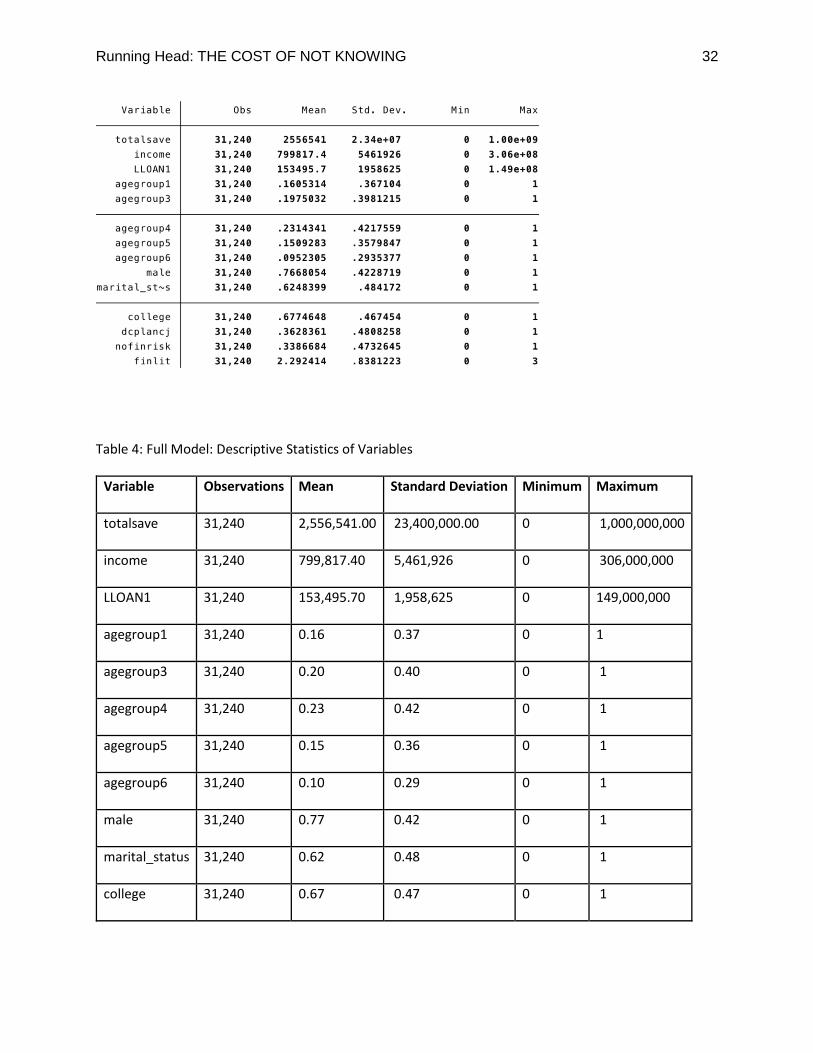
Running Head: THE COST OF NOT KNOWING 32
Table 4: Full Model: Descriptive Statistics of Variables
Variable Observations Mean Standard Deviation Minimum Maximum
totalsave 31,240 2,556,541.00 23,400,000.00 0 1,000,000,000
income 31,240 799,817.40 5,461,926 0 306,000,000
LLOAN1 31,240 153,495.70 1,958,625 0 149,000,000
agegroup1 31,240 0.16 0.37 0 1
agegroup3 31,240 0.20 0.40 0 1
agegroup4 31,240 0.23 0.42 0 1
agegroup5 31,240 0.15 0.36 0 1
agegroup6 31,240 0.10 0.29 0 1
male 31,240 0.77 0.42 0 1
marital_status 31,240 0.62 0.48 0 1
college 31,240 0.67 0.47 0 1

Running Head: THE COST OF NOT KNOWING 33
dcplancj 31,240 0.36 0.48 0 1
nofinrisk 31,240 0.34 0.47 0 1
finlit 31,240 2.29 0.84 0 3


![Knowing their Place: Improving the Spatial Literacy of Tomorrow’s Workforce [Digimap for Schools]](https://static.fdocuments.us/doc/165x107/54c34c724a795960188b45e9/knowing-their-place-improving-the-spatial-literacy-of-tomorrows-workforce-digimap-for-schools.jpg)