
The cost of listing and raising capital: An international...
22
The cost of raising capital: an international comparison Report prepared for the City of London and the London Stock Exchange Dr Luis Correia da Silva Dr Leonie Bell Dr Agris Preimanis November 27th 2006
Transcript of The cost of listing and raising capital: An international...
The cost of raising capital: an international comparison
Report prepared for the City of London and the London Stock Exchange
Dr Luis Correia da SilvaDr Leonie Bell
Dr Agris Preimanis
November 27th 2006
kaidiha
Stamp

2 November 27th 2006
Globalisation of capital markets
Domestic and foreign listed firms, end 2005
Source: World Federation of Exchanges.
0
500
1,000
1,500
2,000
2,500
3,000
3,500
London StockExchange
Deutsche Börse Euronext Nasdaq NYSE
Foreign companiesDomestic companies
- traditionally, companies have raised capital in their ‘home market’- but increasingly they are choosing foreign markets

3 November 27th 2006
Overview
- why location of raising capital matters?
- how to compare attractiveness of financial centres?
- how attractive are different markets for raising equity capital?

4 November 27th 2006
Financial centres are increasingly competing
- competitiveness of the exchange matters, but- the costs of financial intermediation and wider regulatory
environment are also important
Government
Financial regulator
Exchange
Intermediaries
Exchange factors- size of market- liquidity- analyst coverage- ‘be-with-your-peers’- etc
Country factors- accounting standards- legal variables- cultural similarities- etc
.

5 November 27th 2006
Why is this important?
- access to capital, lower cost of equity, better investor recognition and publicity
- significant benefits to firms- improved competitiveness
- higher fixed investment and R&D spend
- increased competitiveness of countries internationally, and higher GDP growth
6 November 27th 2006
Overview
- why location of raising capital matters?
- how to compare attractiveness of financial centres?
- how attractive are different markets for raising equity capital?

7 November 27th 2006
What costs are incurred by firms?
Direct costs- underwriting fees
- professional fees
- initial listing fees
- other direct IPO costs
Indirect costs- IPO price discounts
Costs at IPO stage
Cost of equity capital
Ongoing costs
Direct costs
- regulation, corporate governance, professional fees
- annual listing fees
Indirect costs
- trading costs

8 November 27th 2006
Main costs incurred at the time of IPO
Underwriting fees
Professional fees
Initial listing fees
IPO discounts
investment banks
legal advisers, auditors and reporting accountants
exchanges, regulatory bodies
‘money left on the table’, or good publicity?
Dire
ctIn
dire
ct

9 November 27th 2006
Main costs incurred following the IPO
Ongoing costs affect initial valuations
- net present value discounted into IPO prices
price for better quality?
exchanges, regulatory bodies
intermediaries, exchanges
Regulatory and corporate governance standards
Annual listing fees
Trading costs (brokerage fees, bid–ask spreads, etc)
Indi
rect
Dire
ct

10 November 27th 2006
Overview
- why location of raising capital matters?
- how to compare attractiveness of financial centres?
- how attractive are different markets for raising equity capital?

11 November 27th 2006
Summary of main findings
UK generally ranked as leading country. Sarbanes-Oxley.
Corporate governance and regulation
Significant costs, but no consistent cross-country differences across time
Initial discounting
Significant costs, but international data not available
Professional fees and other direct costs
Some indication of cross-country differences, but comprehensive data not available
Trading costs and liquidity
Negligible costs
UK, France and Germany similar, and lower fees than on NYSE and Nasdaq
How do markets compare?
Listing fees
Underwriting fees

12 November 27th 2006
Initial costsUnderwriting fees and IPO discounting
Underwriting fees are considerably lower in Europe
Significant initial discounting
- academic studies show discounting of 10–20%
- no systematic differences across countries over time
3–4Europe6.5–7USA
(%)
Source: Bloomberg and Oxera calculations.

13 November 27th 2006
How can differences in underwriting fees persist?- significant clustering in the US markets
- 265 issues from total of 318 fall into 6–7% band
- no evidence that higher fees improve quality- no systematic relationship between underwriting fee and IPO discounts
1.9167.9124–5%
–0.22––7–8%
NYSE and NasdaqLSE, Euronext, Deutsche Börse
2.1274.145–6%6.926510.926–7%
0.037.1433–4%9.023.12232–3%
–12.01––>8%
4.621.9111–2%––11.12<1%
First–day returns (%)Sample sizeFirst-day returns (%)Sample sizeUnderwriting fees
Source: Bloomberg and Oxera calculations.

14 November 27th 2006
Other initial costs
- legal, accounting and advisory fees- Oxera survey suggests fees of around 3–6% for issuers in
the UK
- internationally?
- initial listing fees negligible for most firms- admission fees of less than 0.05% of value
- firms pay significant attention- high visibility, and easy to assess?

15 November 27th 2006
Ongoing costsTrading costs in secondary markets (I)
- can have significant impact on firms’ share prices- Oxera (2001) estimates that 0.5% stamp duty abolition in the
UK could result in an increase in share prices of around 10%
- both implicit and explicit costs matter- Domowitz and Steil (2001) estimate that a 10% increase in
total trading costs would raise the cost of equity by 1.4–1.7%
- cross-country evidence, however, is not conclusive…
Increase in trading costs from 20bp to 24bp
Increase in cost of equity: from 10% to 10.34%
16 November 27th 2006
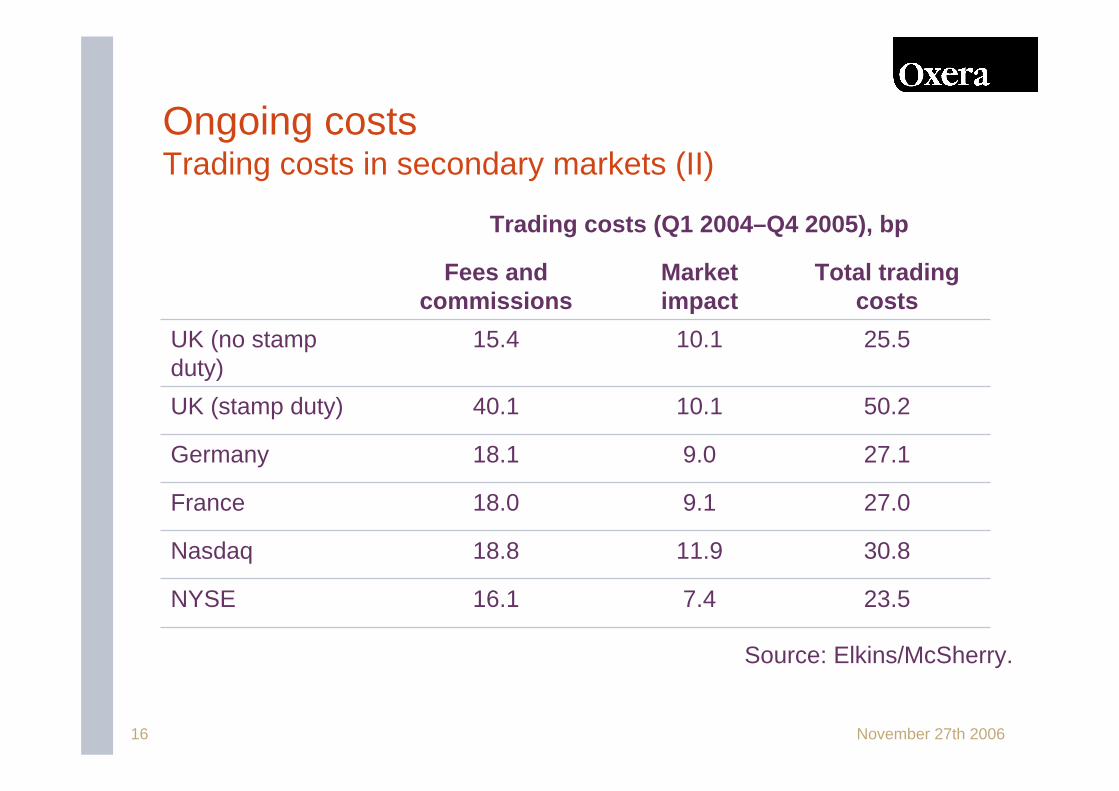
Ongoing costsTrading costs in secondary markets (II)
27.19.018.1Germany
27.09.118.0France
50.210.140.1UK (stamp duty)
25.510.115.4UK (no stamp duty)
16.1
18.8
Fees and commissions
7.4
11.9
Market impact
23.5NYSE
30.8Nasdaq
Total trading costs
Source: Elkins/McSherry.
Trading costs (Q1 2004–Q4 2005), bp

17 November 27th 2006
Ongoing costsCorporate governance and regulatory frameworks (I)
- impact on the cost of raising equity capital can be positive andnegative- compliance with better frameworks signals quality and is valued by
investors
- stricter standards impose greater compliance costs
- UK is ranked as leading country in terms of corporate governance
4.05France
7.04USA
5.23Germany
7.39
Overall country rating UK
Notes: Global governance ratings from Governance Metrics International (2005), using scale from 1 (lowest) to 8 (highest).

18 November 27th 2006
Ongoing costsCorporate governance and regulatory frameworks (II)
Sarbanes–Oxley has increased cost of US listing
- may have improved governance standards in USA
- but no evidence that Sarbanes–Oxley delivers benefits beyond those that apply under the UK regime
⇒ Relative decline in competitive position of US markets

19 November 27th 2006
What else is driving location choices?
Scope for further research- is clustering of companies from the same country important?
- how does type of firm matter?
Industry affiliation
Country of domicile
Required returns at IPO
?

20 November 27th 2006
What can we conclude?
- capital-raising decisions play a pivotal role in firms’ strategies- lowering financing costs can provide firms with a competitive
edge
- on the evidence of this report, firms are actively choosing between markets…
- …and there are differences in the cost of capital that can be achieved in different markets
- but capital markets are changing- FSAP and further integration of European markets
- capital markets initiatives in the USA

21 November 27th 2006
Summary of empirical evidence
Significant, but what monetary value?
UK generally ranked as leading country. Sarbanes–Oxley in the USA
Corporate governance and regulation
Constitutes as much as 10–20% of receipts
Levels differ across countries and over time, but no consistent picture
Initial discounting
Constitute around 3–6% of total receipts for a ‘typical’ UK IPO
Potentially significant, but no international evidence is available
Professional fees and other direct costs
Significant, but depend on firm’s characteristics
Potentially significant, but cross-country comparisons not conclusive
Trading costs and liquidity
Depends on company size, but negligible relative to value of companies
Consistently higher in the USA than in Europe
Overall evidence
Negligible—in general less than 0.1% of receipts
Listing fees
Around 3–4% (Europe) or 6.5–7% (USA) of receipts
Underwriting fees
Impact on total receipts