The cost of financial intermediation in Brazil: An ...
24
The cost of financial intermediation in Brazil: An analysis of Bank Spread Rodrigo Mendes Leal – BNDES. Henrique O. M. Reis Junior – Eletrobrás, IE/UFRJ. jan-2016
Transcript of The cost of financial intermediation in Brazil: An ...

The cost of financial intermediation in Brazil: An analysis of Bank Spread
Rodrigo Mendes Leal – BNDES. Henrique O. M. Reis Junior – Eletrobrás, IE/UFRJ.
jan-2016

2
Introduction – Bank Spread (S) matters
S is a measure of the cost of financial intermediation,
q which is important to development, affecting economic growth (Levine, 1997)
S is used internationally as an indicator of efficiency (WB and IMF, 2005)
q High BS means (WB, 2006) q high lending rates, often with a volatile trajectory, leading to a higher
cost of capital, q “reduced investment, a bias towards short-term high-risk
investments, staying away from long-maturing investments with higher social returns.”
q “Moreover, high S can disproportionately hurt small and medium enterprises and encourage informality.”
3
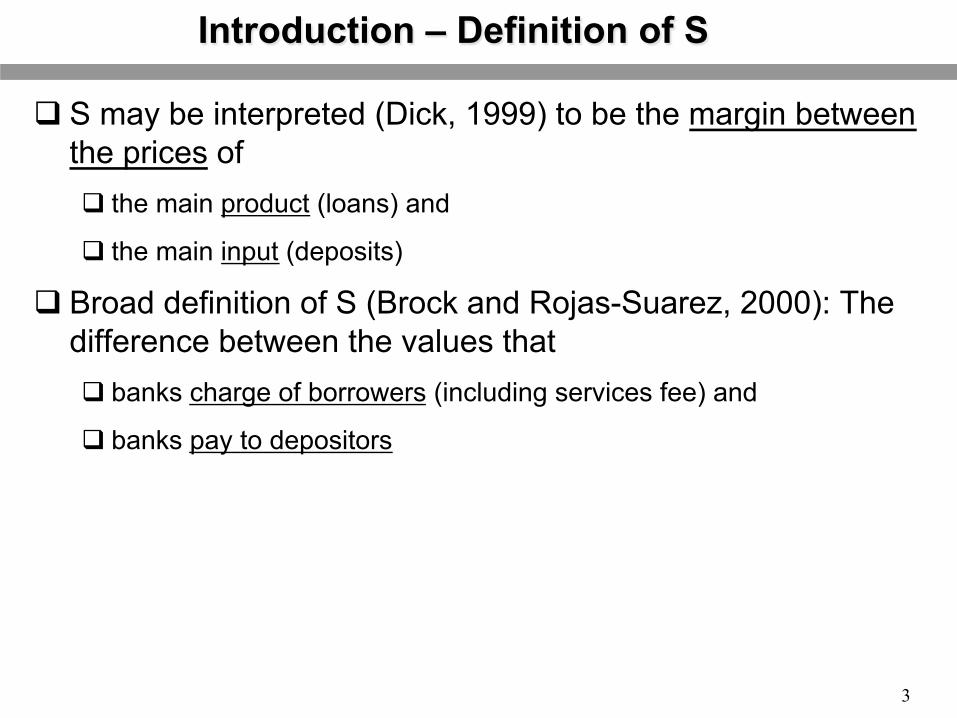
Introduction – Definition of S
q S may be interpreted (Dick, 1999) to be the margin between the prices of q the main product (loans) and
q the main input (deposits)
q Broad definition of S (Brock and Rojas-Suarez, 2000): The difference between the values that q banks charge of borrowers (including services fee) and
q banks pay to depositors

4
Introduction – Several Perspectives of S
q Perspectives of analysis (Dick, 1999) q Evolution: Variations and trajectory (descriptive statistics)
q Determinants: factors that explain the variations (econometrics)
q Structure: Decomposition among the destinations of the revenues (finance and accountancy)
q S doesn`t necessarily imply higher profitability, which is another analysis q Profit is just one of the components of the structure of S, in a similar
way as some banking costs (Leal and Paula, 2011), such as administrative, tax and loan losses.

5
Evolution of S in Brazil
q Brazil has high S compared to global standards, q In 2009, the highest S in the world (IMF, ex-ante measure)
q This contributes to high interest rates of loans, constituting restrictions on obtaining credit and, consequently, constraining economic growth (Reis Jr et al, 2013).

6
Evolution of S in Brazil
q After 2003, Brazil had
q the return of economic growth, and also a high increase of credit offer (Silva et al, 2013)
q the reducing of S, that was in very high levels in previous years.
q a strong reduction of interest rates (Selic and real interest rate)
7
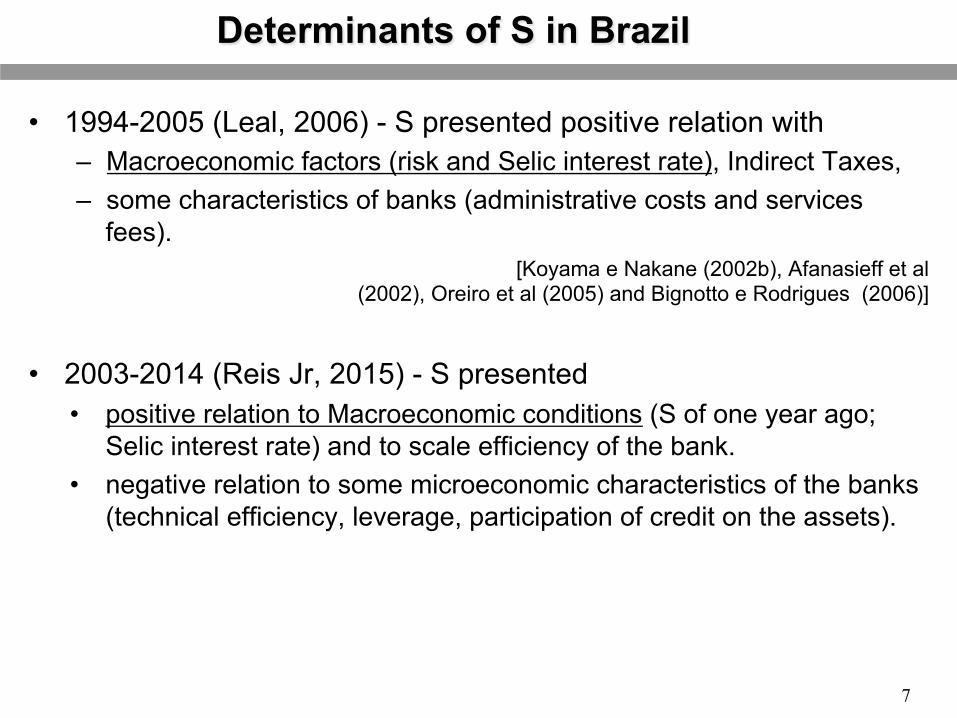
Determinants of S in Brazil
• 1994-2005 (Leal, 2006) - S presented positive relation with – Macroeconomic factors (risk and Selic interest rate), Indirect Taxes, – some characteristics of banks (administrative costs and services
fees). [Koyama e Nakane (2002b), Afanasieff et al
(2002), Oreiro et al (2005) and Bignotto e Rodrigues (2006)]
• 2003-2014 (Reis Jr, 2015) - S presented
• positive relation to Macroeconomic conditions (S of one year ago; Selic interest rate) and to scale efficiency of the bank.
• negative relation to some microeconomic characteristics of the banks (technical efficiency, leverage, participation of credit on the assets).

8
Structure of S in Brazil • 1994-2005 (Leal, 2006) - S had three main components (that
presented oscillation in trajectory): – Structural Expenses, – provisions for loan losses and – net earnings of bank.
[Ex-ante: BCB (1999, 2000, 2001, 2002, 2003, 2004 and 2005), Costa e Nakane (2005b)] [Ex-post: Fipecafi (2004, 2005), Matias (2006).]
• 2003-2014 (Reis Jr, 2015) - S presented – Structural Expenses was the big component and had the major reduction,
– Decrease in the “profitability on banking operations”.
9
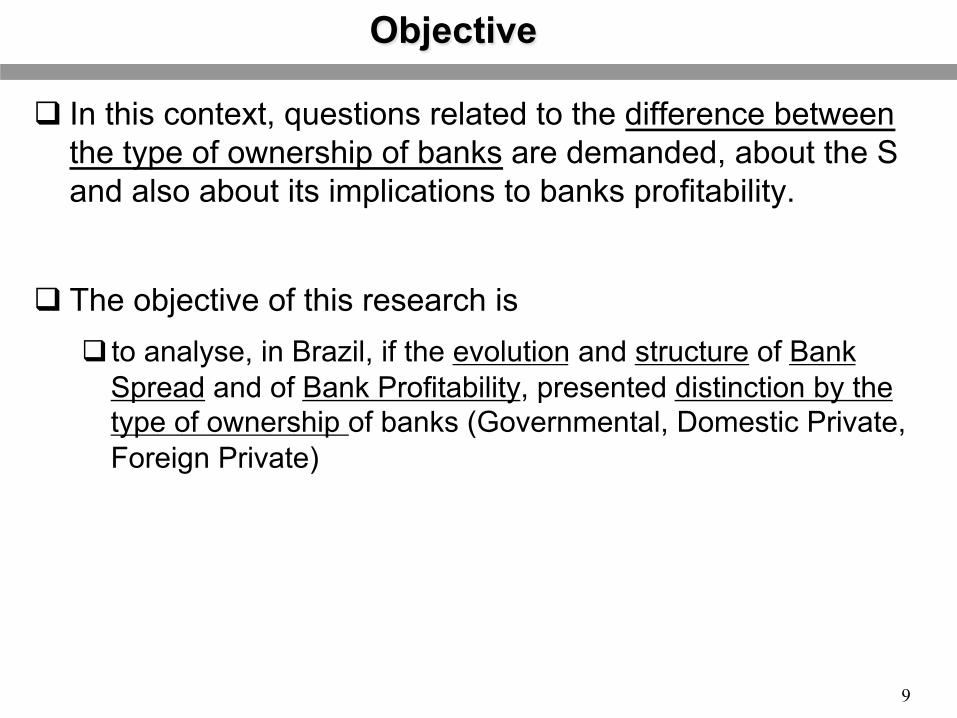
Objective
q In this context, questions related to the difference between the type of ownership of banks are demanded, about the S and also about its implications to banks profitability.
q The objective of this research is q to analyse, in Brazil, if the evolution and structure of Bank
Spread and of Bank Profitability, presented distinction by the type of ownership of banks (Governmental, Domestic Private, Foreign Private)

10
Methodology: Decomposition of Bank Spread q Following Paula (2014) and Reis Jr (2015):
• Π = profit on banking activities • r_a = average rate received from assets, • r_p = average rate that bank remunerates obligations/deposits, • V = trading volume (interest earning assets) • R_t = revenues from commissions and services charges, • C_a = Administrative and Staff Expenses • I = Expenses with provisions for loan losses • T = Expenses with direct and indirect taxes
q Dividing both sides for V: • (ra – rp) = Net (or financial) Spread, • Rt/V = Rate of Services Fee, • (ra – rp)+(Rt/V) = Gross Spread, • Ca/V = Rate of structural expenses, • I/V = Rate of provisions for loan losses, • T/V = Rate of taxes • Π/V = Profitability on banking operation

Net Profit
Profit
Margin /
Revenues
ROA X Revenues
Assets Turnover /
ROE X Assets Assets
Leverage /
Equity !ROE!=!Return!on!Equity!=!Net!Profit!/!Equity!ROA!=!Returno!n!Assets!=!Net!Profit!/!Assets!Leverage!=!Equity!Multiplier!=!Assets!/!Equity!Revenues!=!Financial!and!Services!Fee!
Methodology: Decomposition of profitability
11
DuPont Model of Financial analysis • International references (Saunders (2000) and Koch and MacDonald (2010)) to analyze financial institutions based on the DuPont System.
• “Profit Margin” differs from “Profitability on bank operation”: because the former includes other and non-operational earnings in the numerator and in the denominator has revenues on sales

12
Methodology: Data
q Accounting data, from June of 2003 to June of 2014 q from Central Bank of Brazil.
q The period selected begins in the lowest point in the trajectory of the Credit/GDP index and closes in the latest period available on the beginning of the research.
q The sample considers banks that take demand deposits. q It was composed of 131 banks represent more than 80% of of
Brazilian Financial System (the sample represents 83% of the assets and 93% of the deposits, in average).
q The big six banks (BB, Itau, Bradesco, CEF, Santander, HSBC) represent, in average of assets, 79% of the sample and 66% of Br. Financial System.

13
q Government B. increased in “market share” (MS), though they decreased in quantity.
Methodology: Sample by type of ownership
0%#5%#10%#15%#20%#25%#30%#35%#40%#45%#50%#
2003# 2004# 2005# 2006# 2007# 2008# 2009# 2010# 2011# 2012# 2013# 2014#
Par$cipa$on*by*total*assets*
Foreign#Private# Na9onal#Private# Public#
q After the Crisis of 2008, MS notably increased for “Governmental” and decreased for “Private”.

14
q “Net Spread” follows the reduction of costs of “obligations” and, in special, the decrease of revenues from “assets”, which had a major fall.
Results: Reduction of Financial Spreads
q Assets include loans that had a reduction of lending rates related to: q The creation of consigned credit (2004) and to q The reduction of federal interest rate (Selic) that were higher near
2002.

15
q “Gross Spread” follows the reduction of “Net Spread”, and also a minor reduction of “Service Fee” Rate.
Results: Reduction of Gross Spreads
q Reduction of “Services Fee” to steady level of 2% q Reasonable result in the context of enlargement of the scope of
Brazilian Central Bank regulation on transparency of the fees (more information available and obligation to inform total effective costs of credit operations).

16
q General reduction of Rates and “Net Spread” q Lower levels of “Receiving of
Assets” (blue) and “Net Spreads” (green) are offered by “Government B.”, that presented less fluctuation in the trajectory of the rates.
q Higher levels of “Net Spreads” and “Receiving from Assets” are offered by “Private Domestic B.”, which presented a high cost of “remuneration of obligations” (possibly for more corporative depositors)
Results: Reduction of Net Spread by ownership Governmental
_ Private Domestic
_ Private Foreign

17
Results: Reduction of Gross Spreads by Ownership Governmental
_ Private Domestic
_ Private Foreign
q “Gross Spreads” follows “Net Spreads”
q Lowest “Gross Spreads” by “Public”
q Reduction of “Service Fee” for all q To one homogeneous level of 2%.
Regulation on fees transparency was strengthened in this period.
q Especially strongly reduction for the “Private Domestic”, which used to have a higher initial level.
q Increase of Credit initiated in 2003: q Led, initially, by “Private Domestic B.” q After the Crisis of 2008,government
induced “Government B.” to offer more credit concession and reduce to interest rates (Paula et al, 2013), then, “Public B.” led the credit expansion and increased “market share”.
q It was intensified after 2012, when federal government induced BB and CEF to reduce BS (Serrano e Summa, 2012).

18
q “Structural Expenses” decreased, but maintained its predominance
q Decrease of “Profitability on Bank Operations”
q Increase of “Provision for Loan Losses” participation
Structure of Gross Spread*

19
q No exceptions for the general trajectory (direction of movement).
q In general, less fluctuation for “Government B.”
q Highlights q Lowest “Provision for Loan
Losses” for “Government”. (Possibly associated with scale effects)
q Highest “structural expenses” for “Foreign Private B.”.
q Highest “Profitability on Bank Operations” for “Domestic Private B.”
q “Taxes” had abnormal oscillation in 2008, mainly caused by an offset credit of Itaú.
_ Governmental Banks
_ Domestic Private
_ Foreign Private
Structure of Gross Spread by ownership*

20
q 2008 was an outstanding moment in which the trajectory of market shares by type of ownership begun to change.
q Then, we divided data in two periods: 2003-2007; 2008-2014.
q Following the reduction of “Banking Operations” Earnings (from S), q Decreased profitability (“Net Profit Margin”, “Return on Assets” and
“Return on Equity”), although “Equity Multiplier” represents an increasing on leverage.
Banks Profitability*
Index Average .2003-07 .2008-14
Net Profit Margin 9,4% 10,2% 8,9%
* Asset TurnOver 0,2 0,2 0,1
= ROA 1,5% 1,8% 1,2%
* Equity multiplier 11,7 11,0 12,2
= ROE 17,0% 19,8% 15,0%
q This results can be discussed on several perspectives, but we will focus on differences between types of ownership

q Different from others, “Government B.” increased “Net Profit Margin”.
q Highest “ROE” by “Government B.”, which has the highest leverage (“Equity Multiplier”), yet it doesn’t have the highest “ROA”.
q Highest “ROA” by “Domestic Private B.", which has high “Profit Margin”.
q “Foreign Private” has the lowest profitability (ROE, ROA and Profit Margin)
Profitability by ownership of Banks
Row Labels Foreign Private
Domes5c Private
Governmental
Net Profit Margin Average 6,6% 10,9% 9,3% ...2003-‐07 8,3% 12,5% 8,4% ...2008-‐14 5,4% 9,7% 10,0%
Asset TurnOver Average 0,16 0,17 0,14 ...2003-‐07 0,18 0,19 0,17 ...2008-‐14 0,14 0,15 0,12
ROA Average 1,0% 1,8% 1,3% ...2003-‐07 1,4% 2,3% 1,4% ...2008-‐14 0,8% 1,5% 1,2%
Equity mul5plier Average 8,8 10,4 17,8 ...2003-‐07 9,5 9,2 16,4 ...2008-‐14 8,3 11,2 18,8
ROE Average 9,4% 18,5% 22,6% ...2003-‐07 14,0% 21,5% 22,7% ...2008-‐14 6,1% 16,4% 22,5%

22
Conclusions (1/2)
q After 2003, in the context of the increase of credit offer, Brazilian Bank sector presented a general reduction of Bank Spread (S) and of services fee, as well as a reduction of structural expenses and profitability.
q There were some important differences in the group of banks by ownership: q Government B. increased market share and offered the lowest level
of S and, in spite of it, got high profitability, which is associated with an increase in the profit margin (considering non-operational revenues) and in the leverage (equity multiplier).
q Domestic Private B. maintain market share and reduced S and profitability.
q Foreign Private B. lost market share and S, but had the higher structural expenses, as well as the lowest profitability.

23
Conclusions (2/2)
q The limitations of this study are opportunities to advance in research: q To understand banks behaviour more profoundly, by analysing some
big banks, considering the particularities of there businesses.
q To analyse banks profitability considering the dimensions of stability of banking system, such as solvency and liquidity.

Bank Spread in Brazil
Thanks!
Rodrigo Mendes Leal – BNDES. [email protected] Henrique O. Massena Reis Junior – Eletrobrás, IE/UFRJ.
jan-2016