
THE COST OF CAPITAL FOR GNI FOR THE PERIOD … · distribution revenue controls for the period...
66
THE COST OF CAPITAL FOR GNI FOR THE PERIOD OCTOBER 2017 TO SEPTEMBER 2022 A REPORT TO THE COMMISSION FOR ENERGY REGULATION 16 JUNE 2017
Transcript of THE COST OF CAPITAL FOR GNI FOR THE PERIOD … · distribution revenue controls for the period...

THE COST OF CAPITAL FOR GNI FOR THE PERIOD
OCTOBER 2017 TO SEPTEMBER 2022
A REPORT TO THE COMMISSION FOR ENERGY
REGULATION
16 JUNE 2017

16 JUNE 2017 Confidential
Copyright 2016 FTI Consulting LLP. All rights reserved.
FTI Consulting LLP. Registered in England and Wales at 200 Aldersgate, Aldersgate Street, London EC1A 4HD.
Registered number OC372614, VAT number GB 815 0575 42. A full list of Members is available for inspection at the registered address.
Table of contents
Glossary
Section
1. Introduction 1
2. Executive summary 4
3. Our approach 9
4. Cost of debt 12
5. Cost of equity 30
6. Gearing 48
7. Other factors affecting the appropriate rate of return 51
16 JUNE 2017 Confidential
Report to the CER on the cost of capital for GNI for PC4 | i
Glossary
Term Definition
AGL Resources Southern Company Gas, formerly AGL Resources
Bps Basis points
Brexit The UK’s withdrawal from the European Union in accordance with the terms of Article 50 of the Treaty on the Functioning of the European Union
CC UK Competition Commission
CC Northern Ireland Electricity
The CC’s final determination on the Utility Regulator’s disputed license modifications for NIE
CAPM Capital Asset Pricing Model
CAR Commission for Aviation Regulation
CER Commission for Energy Regulation
CER ESBN/EirGrid PR4 Report prepared by Europe Economics for the CER PR4 review of cost of capital for EirGrid and ESB Networks
CER Irish Water IRC2 CER’s Interim Revenue Control for Irish Water for the two-year period from 1 January 2017 to 31 December 2018
CMA UK Competition and Markets Authority
CMA Bristol Water The CMA’s final determination on Bristol Water’s appeal of Ofwat’s PR14 final determination
CMA Energy Market Investigation
The CMA’s analysis of the cost of capital of UK energy firms
ComReg Commission for Communications Regulation
DSO Distribution Systems Operator
ECB European Central Bank
E.ON E.ON SE
ERP Equity risk premium

16 JUNE 2017 Confidential
Report to the CER on the cost of capital for GNI for PC4 | ii
Term Definition
Ervia Commercial semi-state company which owns GNI
ESB The Irish Electricity Supply Board
ESB Finance Subsidiary of the Electricity Supply Board, which acts as a debt issuing vehicle
EU European Union
Eurozone Monetary union comprising 19 member states of the EU, including the Republic of Ireland
Frontier Frontier Economics Ltd
FTI Consulting FTI Consulting LLP
GBP British pounds
GNI Gas Networks Ireland
HICP Irish (all-items) Harmonised Index of Consumer Prices
ILG Index-linked gilts
IMF International Monetary Fund
ITC Holdings ITC Holdings Corp
Moody’s Moody’s Investors Service
National Grid National Grid Plc
NIE Northern Ireland Electricity
Northwest Natural Gas NW Natural, formerly Northwest Natural Gas Company
Ofwat The Water Services Regulation Authority
Ofwat PR14 Ofwat’s final price control determination for 2015-2020
Ofgem RIIO ED1 Ofgem’s first electricity distribution price control using the 'Revenue = Incentives + Innovation + Outputs' model
OIS Overnight index swap
PC3 The CER’s third periodic gas transmission and distribution revenue controls for the period October 2012 to September 2017
16 JUNE 2017 Confidential
Report to the CER on the cost of capital for GNI for PC4 | iii
Term Definition
PC4 The CER’s fourth periodic gas transmission and distribution revenue controls for the period October 2017 to September 2022
Pennon Pennon Group plc
Piedmont Natural Gas Piedmont Natural Gas Company, Inc
PwC PricewaterhouseCoopers LLP
RAB/RAV Regulated asset base/value
RFR The risk free rate of return
RWE Rheinisch-Westfälisches Elektrizitätswerk AG
Severn Trent Severn Trent plc
SSE SSE plc
S&P Standard and Poor’s
TenneT TenneT B.V.
TC PipeLines TC PipeLines, LP
TMR Total equity market return
TSO Transmissions System Operator
United Utilities United Utilities Group Plc
Uregni GD17 The Utility Regulator’s final determination on the price control for Northern Ireland’s gas distribution networks
Utility Regulator Northern Ireland Authority for Utility Regulation
WACC Weighted average cost of capital

16 JUNE 2017 Confidential
Report to the CER on the cost of capital for GNI for PC4 | 1
1. Introduction
Background
This report was prepared by FTI Consulting LLP (“FTI Consulting”) for the 1.1
Commission for Energy Regulation (“CER”) in connection with its fourth periodic
gas transmission and distribution revenue control for the period October 2017 to
September 2022 (“PC4”). We were instructed to advise on the appropriate real
rate of return that Gas Networks Ireland (“GNI”) should be allowed to earn on the
operation of its transmission and distribution network assets.
GNI is the sole Transmission System Operator (“TSO”) and Distribution Systems 1.2
Operator (“DSO”) for the gas network in the Republic of Ireland. GNI is owned by
Ervia, a commercial semi-state company, which has responsibility for the delivery
of gas and water infrastructure and services in Ireland. The TSO and DSO gas
networks have been subject to ex-ante price regulation since 2002.
In line with established regulatory precedent in the Republic of Ireland and 1.3
elsewhere, the CER seeks to allow the regulated business sufficient revenues to
cover the total economic costs of its operations over the price control period.
Economic costs include a rate of return on the Regulatory Asset Base (“RAB”). The
appropriate rate of return is the expected Weighted Average Cost of Capital
(“WACC”) for the regulated businesses over the price control period.
GNI has submitted financial information and forecasts for PC4 to the CER. It has 1.4
also set out its assessment of the WACC for PC4, based on reports prepared by
Frontier Economics Ltd (“Frontier”) comprising:
(1) a report dated 3 November 2016 (“First Frontier Report”); and
(2) a supplemental report dated 29 March 2017 (“Second Frontier Report”).
Instructions
We have been engaged to assist the CER with an assessment of the WACC for 1.5
GNI’s transmission and distribution gas networks for PC4. Although some
components of the allowed revenues for transmission and distribution are
assessed separately, the WACC and the financeability of GNI are assessed from
the perspective of GNI as a single entity.
16 JUNE 2017 Confidential
Report to the CER on the cost of capital for GNI for PC4 | 2
We have been instructed to review the reports prepared by Frontier on behalf of 1.6
GNI (together, the “Frontier Reports”). We comment on Frontier’s approach and
conclusions where relevant.
Sources of information
In preparing this report, we have reviewed a number of sources of information. 1.7
These primarily fall into the following categories:
(1) confidential financial information and forecasts submitted by GNI;
(2) financial market data;
(3) prior price control decisions by the CER and other economic regulators and
competition authorities in the UK and the Republic of Ireland; and
(4) other information supplied to us by CER.
We have also had formal discussions with the CER, GNI and Frontier in meetings 1.8
held on 16 February 2017 and 22 March 2017.
Restrictions
This report has been prepared solely for the benefit of the CER to inform its 1.9
determination of GNI’s total allowed revenue for PC4. It should not be reproduced
or circulated, in whole or in part, by any party without the prior written consent
of FTI Consulting. We have agreed that CER may publish this report in the context
of the PC4.
FTI Consulting accepts no liability or duty of care to any person other than the CER 1.10
for the content of the report and disclaims all responsibility for the consequences
of any person other than the CER acting or refraining to act in reliance on the
report or for any decisions made or not made which are based upon the report.
Limitations to the scope of our work
This report contains information obtained or derived from a variety of sources. FTI 1.11
Consulting has not sought to establish the reliability of those sources or verified
the information provided.
No representation or warranty of any kind (whether express or implied) is given 1.12
by FTI Consulting to any person (except to the CER under the relevant terms of
our engagement) as to the accuracy or completeness of this report.

16 JUNE 2017 Confidential
Report to the CER on the cost of capital for GNI for PC4 | 3
This report is based on information available to FTI Consulting at the time of 1.13
writing of the report and does not take into account any new information that
becomes known to us after the date of the report. We accept no responsibility for
updating the report or informing any recipient of the report of any such new
information.
Structure of this report
In Section 2, we summarise our conclusions. In Section 3, we set out our 1.14
approach. In Section 4, we estimate GNI’s cost of debt. In Section 5, we estimate
GNI’s cost of equity. In Section 6, we consider the gearing assumption. In
Section 7, we consider other factors that might affect the appropriate allowed
rate of return.
16 JUNE 2017 Confidential
Report to the CER on the cost of capital for GNI for PC4 | 4
2. Executive summary
Introduction
We have been engaged to assist the CER with the assessment of the WACC for 2.1
GNI’s gas transmission and distribution networks for PC4.
2.2 We have considered the approach adopted in previous CER determinations. We
have assessed the cost of debt and equity from the perspective of a hypothetical
standalone efficient entrant of the same scale and scope of business as GNI. We
have estimated a range for GNI’s WACC on a real, pre-tax basis.
2.3 To assess each input, we have taken into account relevant theory, market data,
expected future market conditions and regulatory precedent. We set out our
approach in more detail in Section 3.
Cost of debt
2.4 We have followed the approach used by Frontier and previously by the CER to
calculate the cost of debt. That is, we calculate the cost of debt as the sum of the
estimated yield on government bonds plus a debt premium. The debt premium
reflects the difference between the yield on benchmark corporate bonds and the
yield on government bonds. We also consider direct calculations as a cross-check
and review regulatory precedent.
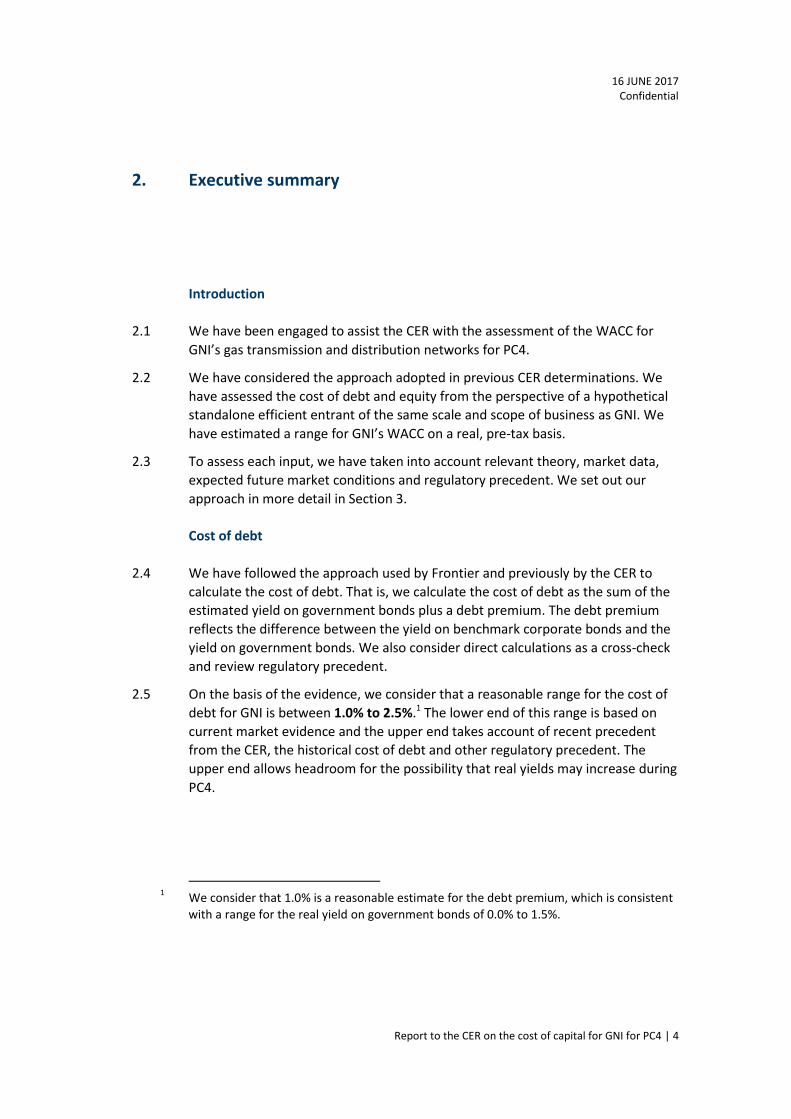
2.5 On the basis of the evidence, we consider that a reasonable range for the cost of
debt for GNI is between 1.0% to 2.5%.1 The lower end of this range is based on
current market evidence and the upper end takes account of recent precedent
from the CER, the historical cost of debt and other regulatory precedent. The
upper end allows headroom for the possibility that real yields may increase during
PC4.
1 We consider that 1.0% is a reasonable estimate for the debt premium, which is consistent
with a range for the real yield on government bonds of 0.0% to 1.5%.

16 JUNE 2017 Confidential
Report to the CER on the cost of capital for GNI for PC4 | 5
2.6 Frontier suggested that a “long-term approach” to setting the allowed cost of
debt is preferable because regulatory stability reduces the cost of capital and, in
the long-run and over time, under and over estimates of the cost of capital will
offset one another. We do not consider it appropriate to have no regard for
market evidence but accept that regulatory stability is important. We consider
that the CER should make incremental and conservative adjustments to its WACC
framework in response to new market data.
2.7 Therefore, based on the evidence summarised in Section 4, we recommend a
point estimate for the cost of debt of 2.5%, which is at the top end of our range.
2.8 This is lower than the point estimate proposed by Frontier. However, it allows
some headroom above the current actual cost of debt for future increases over
PC4. We consider that this a conservative allowance compared to current market
data. Consequently, we consider that a further explicit aiming up adjustment for
PC4 would not be required. We discuss our assessment of the cost of debt further
in Section 4.
Cost of equity
We have adopted the Capital Asset Pricing Model (“CAPM”) framework to assess 2.9
the cost of equity. This is consistent with prior CER determinations and the
approach adopted by Frontier. We discuss our assessment of the risk free rate,
beta and the equity market risk premium in more detail in Section 5.
Risk free rate
2.10 Yields on government bonds have fallen since the PC3 determination and the Irish
sovereign debt crisis that affected that assessment has abated. There is some
evidence to support that some of the fall in yields is due to longer-term
macroeconomic changes, rather than only the short-term market dislocations
following the 2008 financial crisis, which are cited by Frontier. However, there is
also evidence that government bond yields may understate the true long-term
risk free rate. The UK Competition Commission (“CC”) noted in the UK there is no
mechanistic way of interpreting current market yields.
2.11 UK economic regulators now appear to consider that the risk free rate is likely to
fall in the range 1.0% to 1.5%. However, we acknowledge that recent CER
determinations have reflected a view that the true risk free rate remains between
1.9% and 2.0% and that market conditions have not materially changed since the
time of those determinations.

16 JUNE 2017 Confidential
Report to the CER on the cost of capital for GNI for PC4 | 6
2.12 Based on the evidence we have reviewed, we consider that the risk free rate in
Ireland is likely to lie in the range 1.5% to 2.0%. This range is based on the upper
end of recent UK regulatory determinations and the CER’s recent determination.
In the interests of supporting stability in regulatory policy for Irish utilities, we
advise that any change from recent determinations is incremental in nature. In
the interests of supporting stability in Irish utility regulation policy, we
recommend that the CER adopts a point estimate for the risk free rate of 1.9%,
consistent with other recent determinations.
Equity market risk premium
2.13 Based on an assessment of the empirical evidence and regulatory precedent, we
consider that a reasonable range for the total equity market return is 6.5% to
6.75%. Based on our proposed range for the risk free rate (i.e. 1.5% to 2.0%), this
implies a range for the equity risk premium of 4.5% to 5.25%. The point estimate
proposed by Frontier of 4.75% falls within this range. Taking into account our
recommended point estimate for the risk free, we recommend a point estimate
for the equity risk premium of 4.75%.
Beta
2.14 We have adopted an empirical approach to estimating beta, based on market
data. We place primary weight on evidence from comparable listed companies
from the UK. We observe that betas have increased since the financial crisis. We
conclude that a reasonable range for GNI’s asset beta is between 0.37 and 0.44.
We recommend a point estimate of 0.42, which is slightly above the mid-point of
this range, reflecting the slightly higher average beta for the international
comparators. This implies an equity beta of 0.93.
Gearing
2.15 Our assessment of gearing is based on a review of regulatory precedent, the views
of credit ratings agencies and GNI’s historical gearing. We consider that a
reasonable gearing assumption for GNI is 55%, consistent with GNI’s proposal. We
discuss our review of the gearing assumption in more detail in Section 6.
Regulatory precedent
Table 2-1 below summarises the overall pre-tax WACC allowed in recent 2.16
regulatory determinations in the UK and Republic of Ireland. We provide these for
comparison purposes and note that the overall WACC reflects the combined
impact of estimates of each of the underlying parameters i.e. the costs of equity
and debt and the gearing.

16 JUNE 2017 Confidential
Report to the CER on the cost of capital for GNI for PC4 | 7
In forming our final recommendation, we have taken into account the views of 2.17
the CER concerning the weight that should be placed on regulatory precedent, in
particular recent determinations by the CER.
Table 2-1: Regulatory precedent on real pre-tax WACC
Regulatory decision Date Real pre-tax WACC(1)
CER Irish Water IRC2 Dec 2016 5.05%
CER ESBN/EirGrid PR4 Dec 2015 4.74%
Uregni GD17(2) Sep 2016 3.97% and 4.01%
CMA Bristol Water Oct 2015 4.09%
Ofwat PR14 Dec 2014 4.04%
ComReg Dec 2014 6.00%
Ofgem RIIO ED1 Jul 2014 4.09%
CAR Oct 2014 5.80%
CC Northern Ireland Electricity Mar 2014 4.49%
CER PC3(3) Nov 2012 6.70%
Sources: Published documents from relevant authorities.
Notes: (1) For the purposes of comparability, each WACC is expressed before any
additional adjustments and UK determinations have been adjusted for the
difference in corporate taxation rates between the UK and Republic of Ireland;
(2) The Utility Regulator’s determination related to two firms for which it
calculated different costs of debt and therefore a different overall WACC; and (3)
the PC3 WACC included a substantial uplift for the impact of the Irish financial
crisis.
From Table 2-1, we observe that recent regulatory determinations in the UK have 2.18
tended to adopt lower estimates of the real pre-tax WACC than recent CER
determinations. We discuss the conclusions on the individual parameters that
underlie these WACC estimates in the following sections of this report.
Summary of our proposed WACC for GNI
2.19 Table 2-2 below summarises our view of the reasonable range for each input and
our proposed overall reasonable range for the WACC.

16 JUNE 2017 Confidential
Report to the CER on the cost of capital for GNI for PC4 | 8
Table 2-2: FTI proposed WACC for GNI
Input GNI proposal FTI
recommendation
Risk free rate 1.9% 1.9%
Equity risk premium 4.75% 4.75%
Asset beta 0.44 0.42
Equity beta 0.98 0.93
Cost of equity (post tax) 6.54% 6.32%
Tax rate 12.5% 12.5%
Cost of equity (pre-tax) 7.48% 7.22%
Reference bond yield 1.9% 1.5%
Debt premium 1.0% 1.0%
Cost of debt 2.9% 2.5%
Gearing 55% 55%
WACC (pre-tax) 4.96% 4.63%
Sources: Section 4, 5 and 6.
We do not consider it appropriate to make any explicit adjustment to the 2.20
proposed WACC for Brexit. This is firstly because Brexit has not given rise to
exceptional market conditions which might affect GNI’s WACC and there is only a
risk that such conditions might arise in the future. Even if such market conditions
arise, it is then unclear what the scale and direction of the impact would be. We
discuss this further in Section 7.
Secondly, we consider that our recommended point estimate for the WACC is 2.21
conservative, for the reasons set out in Section 4 and 5.

16 JUNE 2017 Confidential
Report to the CER on the cost of capital for GNI for PC4 | 9
3. Our approach
Introduction
The WACC reflects the combination of a firm’s cost of equity and cost of debt, 3.1
weighted according to the relative market value of debt and equity. In this
section, we summarise the WACC calculation and our framework for assessing
each input.
Relevant WACC calculation
We estimate GNI’s cost of debt and equity in real terms (i.e. excluding the impact 3.2
of inflation) because GNI’s asset base is indexed to the Irish (all-items)
Harmonised Index of Consumer Prices (“HICP”).This is consistent with common
regulatory practice, which seeks to ensure that allowances for capital costs are
not overstated.
The returns to debt and equity investors receive different tax treatments. Returns 3.3
to debt investors (i.e. interest payments) are typically deductible before
corporation tax. The WACC can be expressed on one of the following bases:
(1) pre-tax, in which the cost of equity is grossed-up to reflect the return the
firm must earn before tax to fulfil equity investor requirements, which
receive returns after the deduction of corporation tax;
(2) post-tax, in which the cost of debt is reduced to reflect the benefit of the
“tax shield”; and
(3) “vanilla” in which the cost of debt is expressed on a pre-tax basis and the
cost of equity on a post-tax basis.
It should not matter which approach is adopted, so long as the correct 3.4
methodology is then selected to determine allowable revenues. The selected
approach is usually one of regulatory preference, commonly influenced by prior
precedent. Adopting the same approach aids regulatory consistency.

16 JUNE 2017 Confidential
Report to the CER on the cost of capital for GNI for PC4 | 10
The CER has historically expressed the WACC on a real, pre-tax basis.2 3.5
Consequently, in this report, we also determine the return on a real, pre-tax
basis.3 The pre-tax WACC is calculated as:
𝑊𝐴𝐶𝐶 = 𝑘𝑒 ×𝐸
𝐷 + 𝐸×
1
(1 − 𝑇)+ 𝑘𝑑 ×
𝐷
𝐷 + 𝐸
where:
𝑘𝑒 is the cost of equity (i.e. the return required by shareholders);
𝑘𝑑 is the cost of long-term debt (i.e. the return required by debt holders);
𝐸 is the market value of equity;
𝐷 is the market value of (long term) debt; and
𝑇 is the marginal rate of tax on corporate income.
Framework for estimating each input
We have assessed the costs of debt and equity by reference to economic theory 3.6
and regulatory practice. We adopt the commonly used regulatory principle that
regulated firms should be allowed to recover the costs of a hypothetical
standalone efficient entrant of the same scale and scope of business. In general,
we do not make adjustments for the particular circumstances of GNI.
In respect of each component of the calculation we have: 3.7
(1) considered the relevant economic and corporate finance theory;
(2) considered GNI’s / Frontier’s position;
(3) reviewed relevant current market data and forward-looking expectations;
(4) considered regulatory precedent in the Republic of Ireland and the UK; and
(5) recognised that there is uncertainty in the estimation of the WACC.
Consequently, we determine a reasonable range for each parameter.
We have assessed the expected average WACC over the course of PC4. Frontier 3.8
adopts a similar framework. We explain in subsequent sections, where our
approach and/or findings differ.
2 CER, ‘Decision on October 2012 to September 2017 transmission revenue for Bord Gáis
Networks’, 23 November 2012, page 4.
3 Frontier expressed the WACC on the same real, pre-tax basis. First Frontier Report: page 8.
16 JUNE 2017 Confidential
Report to the CER on the cost of capital for GNI for PC4 | 11
In performing our assessment, we have been instructed to place weight on the 3.9
approach that the CER has adopted in prior controls, whilst having regard to other
accepted practice and current market data.

16 JUNE 2017 Confidential
Report to the CER on the cost of capital for GNI for PC4 | 12
4. Cost of debt
Introduction
In this section, we summarise the approach we have used to estimate the cost of 4.1
debt and GNI’s approach. We then examine certain market evidence and review
regulatory precedent. Finally, we set out our recommendations.
Our approach
The cost of debt can be calculated by reference to the firm’s actual cost of debt, 4.2
reflecting a combination of debt previously issued (i.e. embedded debt) and new
debt to be issued over the relevant period. However, this approach is often
dismissed by regulators due to inter alia efficiency concerns.
The CER previously considered the cost of debt on a notional basis (i.e. the cost to 4.3
a hypothetical entrant).4 In these circumstances, the cost of debt can be
measured by reference to the expected yield to maturity on the regulated
company’s own recently issued bonds and/or by reference to a range of current
empirical market evidence.
The notional cost of debt can be estimated by reference to comparable 4.4
companies and can be decomposed into two components: the yield on
government bonds (or other proxies) and the difference between this yield and
the yield on comparable corporate bonds (i.e. the “debt premium”).
Based on regulatory theory, we consider that the CER’s approach is appropriate, 4.5
so long as it does not give rise to financeability issues. Hence, if the cost of
embedded debt were found to be significantly higher than the allowed notional
cost of debt, this would require further regulatory consideration.
As a simple check, we have examined GNI’s expected share of embedded debt 4.6
compared to its total debt funding over PC4, as shown below.
4 Europe Economics (January 2015) ‘PR4 WACC for EirGrid and ESB Network’: pages 12 -13.
16 JUNE 2017 Confidential
Report to the CER on the cost of capital for GNI for PC4 | 13
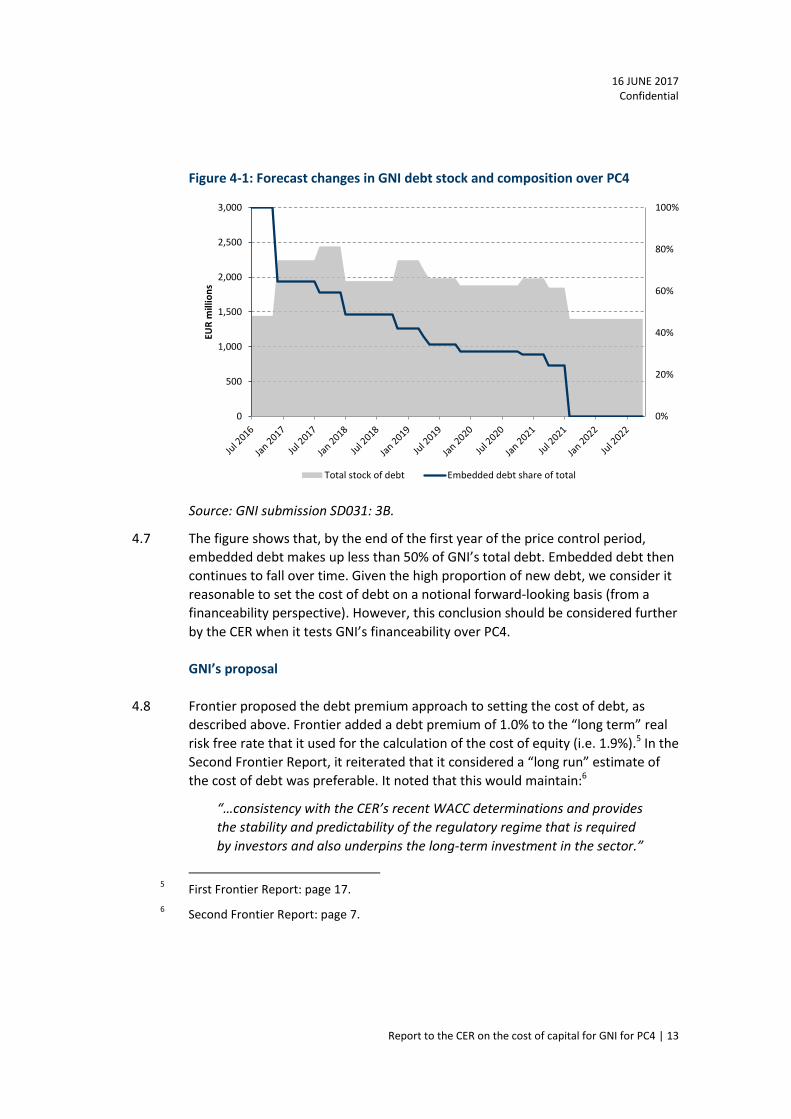
Figure 4-1: Forecast changes in GNI debt stock and composition over PC4
Source: GNI submission SD031: 3B.
The figure shows that, by the end of the first year of the price control period, 4.7
embedded debt makes up less than 50% of GNI’s total debt. Embedded debt then
continues to fall over time. Given the high proportion of new debt, we consider it
reasonable to set the cost of debt on a notional forward-looking basis (from a
financeability perspective). However, this conclusion should be considered further
by the CER when it tests GNI’s financeability over PC4.
GNI’s proposal
Frontier proposed the debt premium approach to setting the cost of debt, as 4.8
described above. Frontier added a debt premium of 1.0% to the “long term” real
risk free rate that it used for the calculation of the cost of equity (i.e. 1.9%).5 In the
Second Frontier Report, it reiterated that it considered a “long run” estimate of
the cost of debt was preferable. It noted that this would maintain:6
“…consistency with the CER’s recent WACC determinations and provides
the stability and predictability of the regulatory regime that is required
by investors and also underpins the long-term investment in the sector.”
5 First Frontier Report: page 17.
6 Second Frontier Report: page 7.
0%
20%
40%
60%
80%
100%
0
500
1,000
1,500
2,000
2,500
3,000EU
R m
illio
ns
Total stock of debt Embedded debt share of total

16 JUNE 2017 Confidential
Report to the CER on the cost of capital for GNI for PC4 | 14
Frontier estimated the debt premium by calculating the difference between the 4.9
nominal yield on a set of comparator corporate bonds and the nominal, current
yield on government bonds of similar tenor. It proposed a range for the debt
premium of 0.96% to 1.14%, with a point estimate of 1.0%. Frontier proposed a
range for the real cost of debt of between 2.86% and 3.14%, with a point estimate
of 2.90%.7
In the Second Frontier Report, Frontier argued, inter alia, that the use of a “long 4.10
run” cost of debt estimate “could … be considered analogous” to methodologies
used by other regulators which explicitly take account of historical debt costs,
such as those used by Ofgem and Ofwat in the UK.8
Frontier stated that:9 4.11
“… we have cross-checked the point estimate using direct estimates of
the long-term cost of debt (as proxied by the iBoxx index) and current
Irish inflation index. Our cross-check suggests a long-term average cost
of debt of c.3.2%, which is above GNI’s 2.9% point estimate.”
Empirical evidence on government bond yields
A benchmark yield, such as government bond yields, is used in two steps of the 4.12
cost of debt calculation. First, the debt premium is calculated by deducting the
nominal government bond yield from the yield of comparator corporate bonds.
Second, the estimated debt premium is added to the real government bond yield
to calculate the real cost of debt. It is important in each step to use consistent
estimates of the government yields.
It is common regulatory practice to use the yield on government bonds of the 4.13
relevant economy: in this case, Irish government bonds. However, during the
Eurozone financial crisis, a substantial spread opened up between the yields on
bonds issued by different Eurozone governments. This reflected an increase in the
perceived risk that some Eurozone countries – including the Irish state – might
default on their debts. Given this, it might be argued that Irish government bonds
can no longer be considered risk free. We understand that the current Irish
sovereign credit rating is currently A/A3, rather than AAA, which is typically taken
to represent a risk free bond.
7 First Frontier Report: page 17.
8 Second Frontier Report: page 7.
9 Second Frontier Report: page 10.
16 JUNE 2017 Confidential
Report to the CER on the cost of capital for GNI for PC4 | 15
To overcome this issue, in recent determinations, the CER used the yields on 4.14
other AAA rated Eurozone government debt.10 This approach appears reasonable,
and we have adopted this approach.
Nominal government bond yield for calculating the debt premium
To calculate the debt premium, we agree with the approach adopted by Frontier, 4.15
which deducts the nominal yield on government bonds (of similar tenor) from the
nominal yield of benchmark corporate bonds.11
Reference real government bond yield
Determining the real government bond yield to which the debt premium is added 4.16
is a more difficult exercise. The majority of government bonds issued in the
Eurozone have a fixed nominal rate. To estimate the real yield on these bonds it is
necessary to deduct expected price inflation from the nominal yield. Although a
real yield can be inferred in this way, estimates of expected inflation are
uncertain.12
A common approach is to consider the yields on index-linked government bonds 4.17
(“ILGs”), which exclude inflation risk. However, there is a more limited supply of
relevant ILGs. In addition, we are concerned that the high demand for inflation
protection from institutional investors may have reduced the yields on these
products.
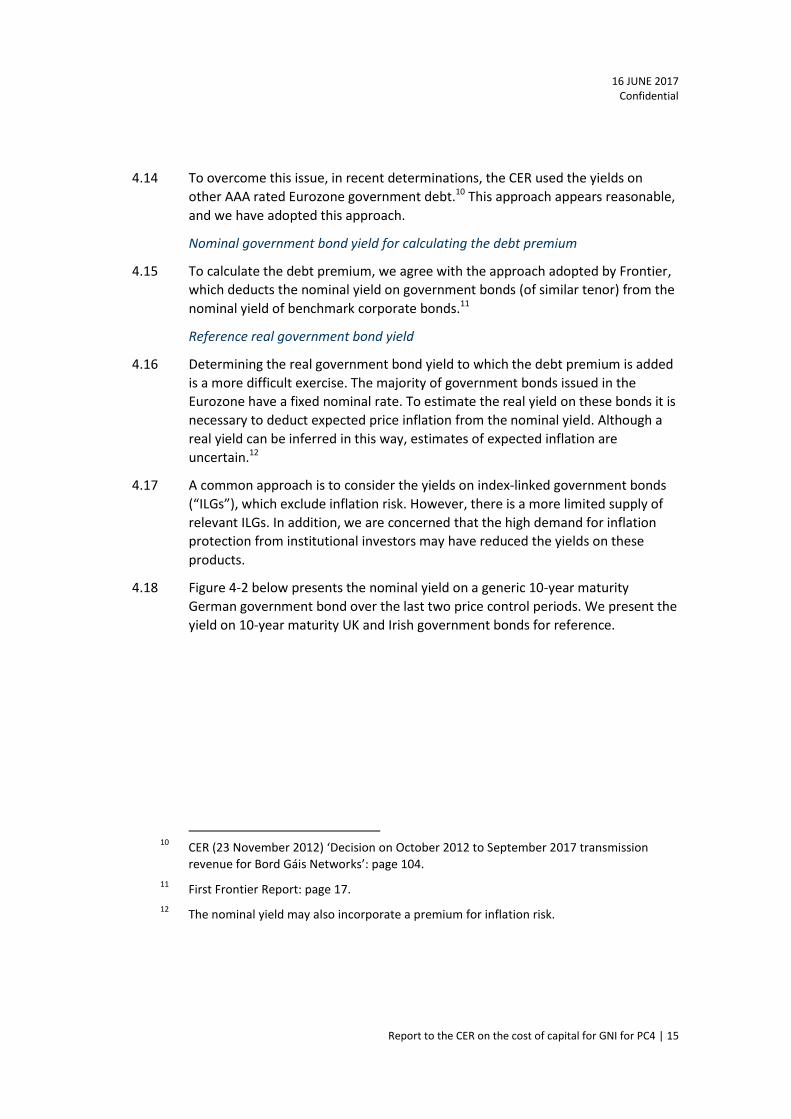
Figure 4-2 below presents the nominal yield on a generic 10-year maturity 4.18
German government bond over the last two price control periods. We present the
yield on 10-year maturity UK and Irish government bonds for reference.
10
CER (23 November 2012) ‘Decision on October 2012 to September 2017 transmission
revenue for Bord Gáis Networks’: page 104.
11 First Frontier Report: page 17.
12 The nominal yield may also incorporate a premium for inflation risk.
16 JUNE 2017 Confidential
Report to the CER on the cost of capital for GNI for PC4 | 16
Figure 4-2: Nominal mid yield to maturity on German, British and Irish 10-year
generic government bonds (%)
Source: Bloomberg.
Notes: Yields on the Irish government bond expiring 18/10/2020 were used for the
period from 12/10/2011 to 14/03/2013.
The figure shows that nominal yields to maturity have fallen over time and are 4.19
now close to zero. The annualised rate of Eurozone HICP inflation in
December 2016 was 1.1%.13 Inflation is forecast to increase by the ECB to 1.3% in
2017 and to 1.5% and 1.7% in 2018 and 2019, respectively.14 Given that the yield
on 10-year German government bonds is currently below 0.5%, this implies that
the expected real yield is currently negative.15
13
ECB Statistical Data Warehouse.
14 ECB (December 2016) ‘Eurosystem staff macroeconomic projections’.
15 The Fisher equation holds that, for low values of inflation and interest rates:
𝑛𝑜𝑚𝑖𝑛𝑎𝑙 𝑅𝐹𝑅 ≈ 𝑟𝑒𝑎𝑙 𝑅𝐹𝑅 + 𝑖𝑛𝑓𝑙𝑎𝑡𝑖𝑜𝑛
16 The Irish government does not currently issue ILGs.
-1.0%
0.0%
1.0%
2.0%
3.0%
4.0%
5.0%
6.0%
UK Germany Ireland

16 JUNE 2017 Confidential
Report to the CER on the cost of capital for GNI for PC4 | 17
In Figure 4-3, we present the yield on German ILGs and UK ILGs for comparison 4.20
purposes. We note that the German government has only relatively recently
begun to issue a limited amount of ILGs.16
Figure 4-3: Mid yield to maturity of British and German 10-year generic inflation-
indexed government bonds (%)
Source: S&P CapitalIQ.
From the figures above, our analysis suggests that the real yield on Eurozone 4.21
government bonds are currently low compared to the historical average and
current real yields are close to zero, confirming the finding in paragraph 4.19
above.
16
The Irish government does not currently issue ILGs.
-3.0%
-2.0%
-1.0%
0.0%
1.0%
2.0%
3.0%
4.0%
Generic UK 10-year ILG Generic German 10-year ILG
16 JUNE 2017 Confidential
Report to the CER on the cost of capital for GNI for PC4 | 18
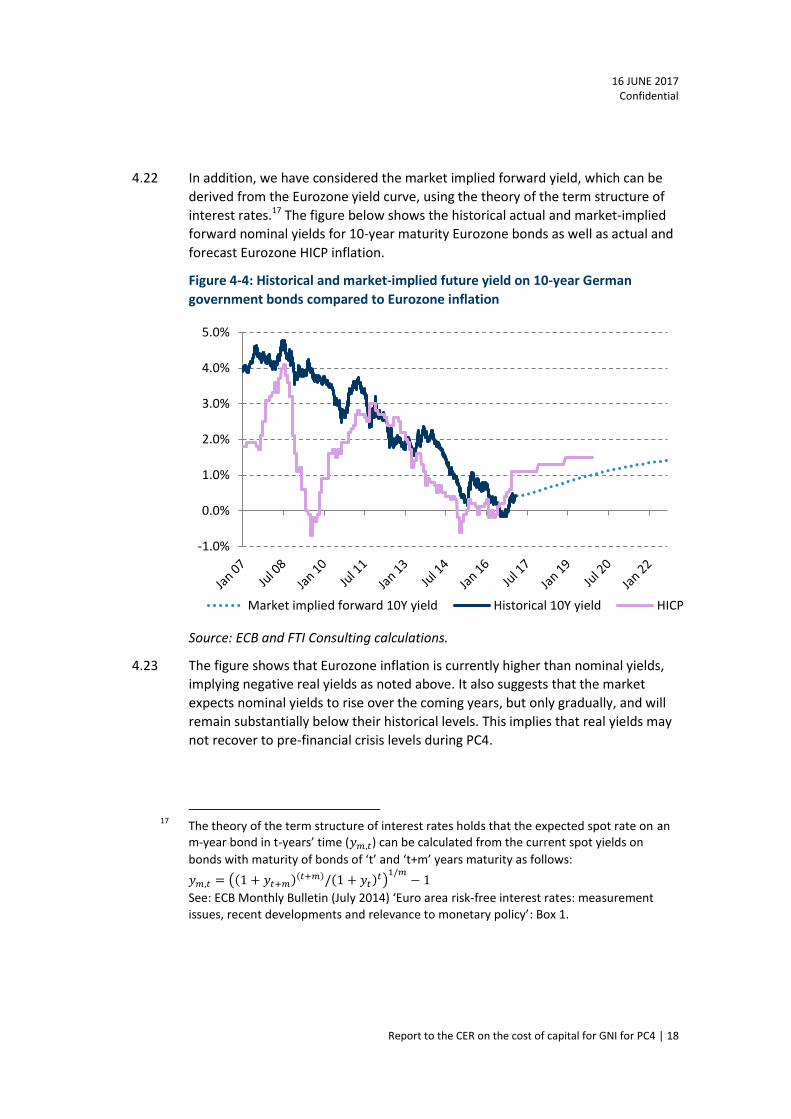
In addition, we have considered the market implied forward yield, which can be 4.22
derived from the Eurozone yield curve, using the theory of the term structure of
interest rates.17 The figure below shows the historical actual and market-implied
forward nominal yields for 10-year maturity Eurozone bonds as well as actual and
forecast Eurozone HICP inflation.
Figure 4-4: Historical and market-implied future yield on 10-year German
government bonds compared to Eurozone inflation
Source: ECB and FTI Consulting calculations.
The figure shows that Eurozone inflation is currently higher than nominal yields, 4.23
implying negative real yields as noted above. It also suggests that the market
expects nominal yields to rise over the coming years, but only gradually, and will
remain substantially below their historical levels. This implies that real yields may
not recover to pre-financial crisis levels during PC4.
17
The theory of the term structure of interest rates holds that the expected spot rate on an m-year bond in t-years’ time (𝑦𝑚,𝑡) can be calculated from the current spot yields on
bonds with maturity of bonds of ‘t’ and ‘t+m’ years maturity as follows:
𝑦𝑚,𝑡 = ((1 + 𝑦𝑡+𝑚)(𝑡+𝑚)/(1 + 𝑦𝑡)𝑡)1/𝑚
− 1
See: ECB Monthly Bulletin (July 2014) ‘Euro area risk-free interest rates: measurement
issues, recent developments and relevance to monetary policy’: Box 1.
-1.0%
0.0%
1.0%
2.0%
3.0%
4.0%
5.0%
Market implied forward 10Y yield Historical 10Y yield HICP

16 JUNE 2017 Confidential
Report to the CER on the cost of capital for GNI for PC4 | 19
We note that both nominal yields and future inflation are uncertain and this 4.24
uncertainty is greater over longer forecast horizons. This uncertainty needs to be
considered when determining the reference real government bond yield for
regulatory purposes.
Empirical evidence on the debt premium
The debt premium is the difference between the yield on the benchmark 4.25
corporate bonds and the market yield on benchmark government bonds. We have
estimated the debt premium based on the comparable corporate bonds
considered in the First Frontier Report and those considered in the CER PC3
determination.18 The debt premiums are calculated as the premium over the
term-matched benchmark government bond.19 We also consider GNI’s recently
issued debt instruments.
Figures 4-5 and 4-6 summarise how debt premiums have changed over time 4.26
based on Frontier’s comparator set. Figure 4-7 plots similar spreads for the PC3
comparators.
18
The specific bonds considered in PC3 have matured, so we use other bonds issued by the
same companies.
19 That is a government bond with a maturity date close to that of the subject bond.

16 JUNE 2017 Confidential
Report to the CER on the cost of capital for GNI for PC4 | 20
Figure 4-5: Spread of Euro denominated bonds used in First Frontier
Report (bps)
Source: Bloomberg data and FTI calculations.
Figure 4-6: Spread of Sterling denominated bonds used in First Frontier
Report (bps)
Source: Bloomberg data and FTI calculations.
0.0%
0.5%
1.0%
1.5%
2.0%
2.5%
3.0%
Jan 13 Jul 13 Jan 14 Jul 14 Jan 15 Jul 15 Jan 16 Jul 16 Jan 17
BOGAEI 3.625 12/17 Corp ESBIRE 3.494 CorpESBIRE 1.875 06/31 Corp ESBIRE 2.125 CorpESBIRE 4.375 Corp ESBIRE 6.25 Corp
0.0%
0.5%
1.0%
1.5%
2.0%
2.5%
3.0%
Jan 13 Jul 13 Jan 14 Jul 14 Jan 15 Jul 15 Jan 16 Jul 16 Jan 17
ESBIRE 6.875 09/18 Corp ESBIRE 6.375 06/02/26 Corp
ESBIRE 6.5 03/20 Corp

16 JUNE 2017 Confidential
Report to the CER on the cost of capital for GNI for PC4 | 21
Figure 4-7: Spread of corporate bonds issued by PC3 comparators over
time (bps)
Source: Bloomberg data and FTI calculations.
Our analysis suggests that higher debt premiums, which were associated with the 4.27
Irish sovereign debt crisis, have reduced to lower levels. The debt premiums have
become more stable from the start of 2015. Consequently, we have calculated
average premiums based on the last 12 months of available data (i.e. post
financial crisis). Tables 4-1 and 4-2 summarise the average spreads for two groups
of comparators over the last year.20
20
The spread is calculated for each trading day between 1 January 2016 to 31 December
2016 inclusive.
0.0%
0.5%
1.0%
1.5%
2.0%
2.5%
3.0%
Jan 13 Jul 13 Jan 14 Jul 14 Jan 15 Jul 15 Jan 16 Jul 16 Jan 17
TENN 1 ¾ 06/27 Corp RWE 3 01/17/24 Corp
EOANGR 5.528 23 Corp TENN 4 ¾ 06/30 Corp

16 JUNE 2017 Confidential
Report to the CER on the cost of capital for GNI for PC4 | 22
Table 4-1: Spread of Euro and Sterling denominated bonds used by Frontier
Corporate bond Currency Credit Rating
Years to maturity
2 year average spread (bps)
Bord Gais Eireann(1) Euro A 1 63.4
ESB Finance Euro A- 1 61.2
ESB Finance Euro A- 3 73.7
ESB Finance Euro A- 7 108.1
ESB Finance Euro A- 10 128.7
ESB Finance Euro A- 14 141.1
NIE Finance Sterling NR 2 114.2
ESB Finance Sterling A- 3 115.3
NIE Sterling BBB+ 9 127.3
Average (Euro-denominated) 96.0
Average (Sterling-denominated) 118.9
Average 103.7
Source: Bloomberg data and FTI calculations. Note: (1) Previous name for GNI.
Table 4-2: Spread of Euro denominated bonds issued by PC3 comparators
Corporate bond Currency Credit Rating
Years to maturity
2 year average spread (bps)
E.ON Euro BBB+ 6 117.2
RWE Euro BBB- 7 138.2
TenneT Euro A- 10 104.2
TenneT Euro A- 13 115.7
Average 118.8
Source: Bloomberg data and FTI calculations.
We observe that longer-maturity bonds attract higher premiums. GNI proposes to 4.28
raise new debt with a range of maturities, but with a weighted average tenor of
10 years.21
21
GNI submission SD031: 3B. The weighted average tenor is calculated by weighting the
tenor of each bond by the value of its principal.

16 JUNE 2017 Confidential
Report to the CER on the cost of capital for GNI for PC4 | 23
GNI has also issued corporate bonds on 28 November 2016.22 We have calculated 4.29
their average spread over benchmark government bonds from 1 December 2016
to 31 December 2016.
Table 4-3: Spread of newly issued GNI corporate bonds
Years to maturity Credit Rating Average spread
(bps)
10 years A 103.7
20 years A 152.2
Average 127.9
Source: Bloomberg, S&P CapitalIQ and FTI calculations.
Based on the analysis above, we agree with Frontier that an appropriate estimate 4.30
of the debt premium is around 100 bps (i.e. 1.0%). Our recommendation is
influenced by our consideration of the reference real government bond yield to
which the premium is added, which we discuss at the end of this section.
Cross-check to direct estimates of historical cost of debt
Frontier suggests that a “long run” estimate of the cost of debt is preferable and 4.31
asserts that Ofgem and Ofwat’s cost of debt methodologies are “analogous” to
the CER’s methodology.
We disagree with Frontier’s assertion that the CER’s previous approach should be 4.32
seen as analogous to Ofgem and Ofwat’s approaches because in the past the CER
has adopted a forward-looking approach. As such, in PC3 the CER allowed a
specific debt allowance for the crisis, which took account of the forward cost of
debt (i.e. it did not adopt a longer-term historical average, which may have
reduced the weight that would have been placed on crisis market conditions).
We have analysed the maturity profile of GNI’s debt and its expected refinancing 4.33
over PC4 above. From this, we observed that the majority of GNI’s debt has been
recently financed or will be refinanced in the initial years of PC4. On this basis, we
consider that it is reasonable to set the cost of debt by reference to the forward-
looking expectations of debt costs over PC4.
22
One was for €500m, due to mature in 2026, and one of €125m due to mature in 2036.

16 JUNE 2017 Confidential
Report to the CER on the cost of capital for GNI for PC4 | 24
As a cross-check, we have considered whether Frontier’s approach is consistent 4.34
with a historical cost approach. Frontier cross-checked their point estimate using
direct estimates of the long-term cost of debt (as proxied by the iBoxx index) and
current Irish inflation index. We consider that Frontiers’ calculation may be flawed
because the period over which Frontier calculates the average encompasses the
Eurozone financial crisis. This approach adds a large “crisis premium” to the
estimated historical cost of debt.23 The CER already included an explicit uplift for
the “crisis premium” in PC3, which we discuss further in Section 7. It might be
unreasonable to include this uplift again in PC4 now that the market conditions
have abated.
The figure below shows our calculation of the implied historical real cost of debt 4.35
calculated as an average of the Eurozone iBoxx A and BBB corporate bond indices
and historical Eurozone HICP inflation.
23
There are two further issues. First, the real cost of debt should not be estimated by
deducting a forward-looking inflation expectation from historical average nominal yields.
It is well understood that periods of higher inflation are associated with higher yields and
vice versa. The expected real return at a given point in time is calculated by deducting
forward-looking expectations of inflation from current nominal yields to maturity.
Equivalently, the historical realised real return should be calculated by deducting historical
inflation from historical yields. Second, the use of an Irish inflation index is not
appropriate. As set out above, we are assessing the real return required by a debt investor
from a whole Eurozone perspective, so the Eurozone HICP should be used.

16 JUNE 2017 Confidential
Report to the CER on the cost of capital for GNI for PC4 | 25
Figure 4-8: Impact of Eurozone crisis on historical real corporate bond yields
Source: Thomson Reuters, ECB and FTI analysis.
Note: We show the Eurozone crisis as lasting from the initial sudden jump in yields
in mid-2008 through to July 2012.
The figure illustrates how Frontier’s ten year historical average calculation is 4.36
distorted by the impact of the Eurozone debt crisis. To the extent that historical
debt costs are an appropriate cross-check, we consider that it is more appropriate
to examine the implied historical real cost of debt during periods of “normal”
market conditions prevailed. The figure shows that, since the European financial
crisis has abated, the real cost of debt as estimated from corporate indices was
below the 2.9% proposed by Frontier. The average real yield during the period
outside the crisis from January 2006 to December 2016 was 2.5% and the average
since the crisis (i.e. August 2012 to December 2016) was 2.3%.
Regulatory precedent
In this section, we consider regulatory precedent on the real cost of debt and 4.37
whether expected future changes in cost of debt should be taken into account.
Regulatory precedent on cost of debt
We summarise below recent regulatory precedent on the cost of debt and note 4.38
the assumed credit rating for the regulated businesses.
0%
2%
4%
6%
8%
10%
Crisis Average real yield on A and BBB EUR iBoxx indices

16 JUNE 2017 Confidential
Report to the CER on the cost of capital for GNI for PC4 | 26
Table 4-4: Regulatory precedent on the cost of new debt
Regulatory decision Date Assumed
credit rating Debt
premium Real cost of
new debt
CER Irish Water IRC2 Dec 2016 BBB+ or above 1.0% 3.0%
CER ESBN/EirGrid PR4 Dec 2015 BBB+ or above 1.0% 2.9%
Uregni GD17 Sep 2016 BBB- or above N/A 2.53% to 3.13%(1)
CMA Bristol Water Oct 2015 BBB+ N/A 1.6%
Ofwat PR14 Dec 2014 A/BBB N/A 2.00%
ComReg Dec 2014 BBB- 1.75% 3.58%
Ofgem RIIO ED1 Jul 2014 A/BBB N/A See chart
CAR Oct 2014 BBB N/A 3.0%
CC Northern Ireland Electricity
Mar 2014 BBB+ N/A 2.14%
CER PC3 Nov 2012 BBB+ 1.3% to
1.6% 4.8% to 7.1%(2)
Sources: Published documents from relevant authorities. Notes: (1) range of values
due to different costs of new debt for PNGL and FE; and (2) this includes a
Eurozone Crisis Premium.
For its ED1 and other recent determinations, Ofgem adopted an annual indexed 4.39
approach to setting the cost of debt. Ofgem calculated the current real cost of
debt on a daily basis using benchmark indices and allowed a real cost of debt
calculated on a trailing average basis. For “slow track” companies, this is an up to
20-year average (calculations begin from November 2004) and for “fast track”
companies, this is a 10-year trailing average. Figure 4-9 below illustrates the
calculated real cost of current debt and the resulting trailing average.
16 JUNE 2017 Confidential
Report to the CER on the cost of capital for GNI for PC4 | 27
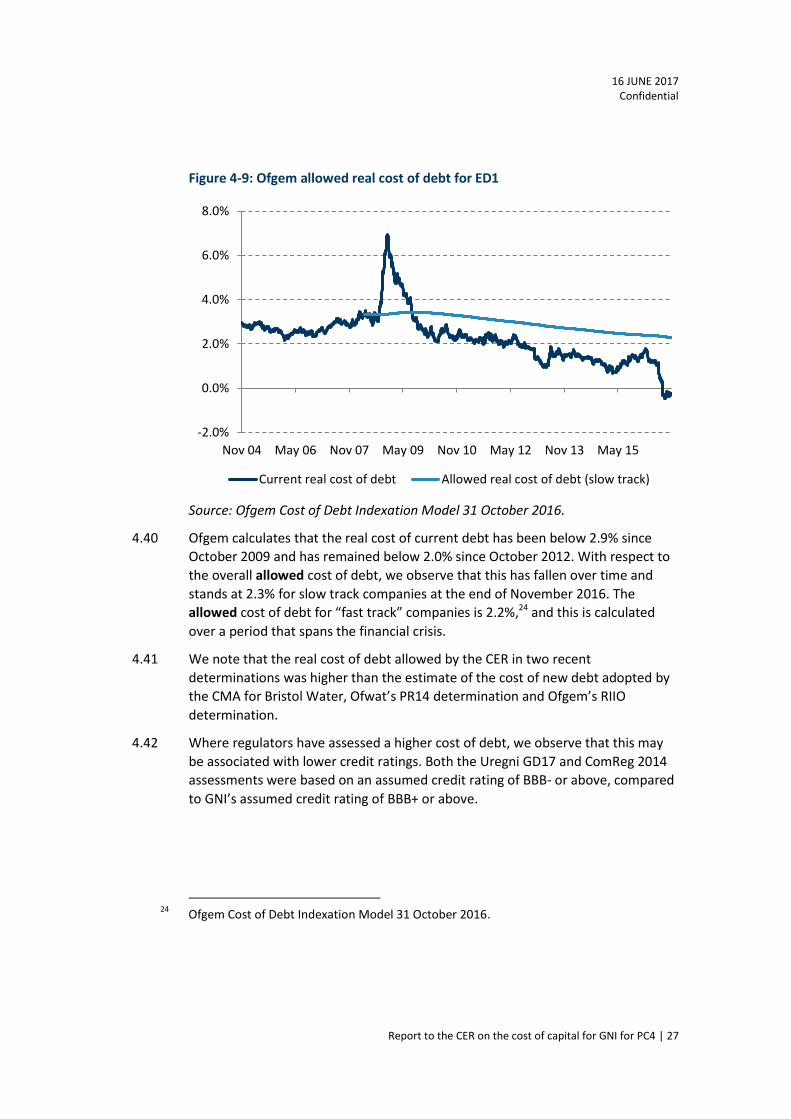
Figure 4-9: Ofgem allowed real cost of debt for ED1
Source: Ofgem Cost of Debt Indexation Model 31 October 2016.
Ofgem calculates that the real cost of current debt has been below 2.9% since 4.40
October 2009 and has remained below 2.0% since October 2012. With respect to
the overall allowed cost of debt, we observe that this has fallen over time and
stands at 2.3% for slow track companies at the end of November 2016. The
allowed cost of debt for “fast track” companies is 2.2%,24 and this is calculated
over a period that spans the financial crisis.
We note that the real cost of debt allowed by the CER in two recent 4.41
determinations was higher than the estimate of the cost of new debt adopted by
the CMA for Bristol Water, Ofwat’s PR14 determination and Ofgem’s RIIO
determination.
Where regulators have assessed a higher cost of debt, we observe that this may 4.42
be associated with lower credit ratings. Both the Uregni GD17 and ComReg 2014
assessments were based on an assumed credit rating of BBB- or above, compared
to GNI’s assumed credit rating of BBB+ or above.
24
Ofgem Cost of Debt Indexation Model 31 October 2016.
-2.0%
0.0%
2.0%
4.0%
6.0%
8.0%
Nov 04 May 06 Nov 07 May 09 Nov 10 May 12 Nov 13 May 15
Current real cost of debt Allowed real cost of debt (slow track)
16 JUNE 2017 Confidential
Report to the CER on the cost of capital for GNI for PC4 | 28
Regulatory precedent regarding expected future changes in cost of debt.
Regulators have adopted different approaches to expected future increases in the 4.43
cost of debt. In its NIE determination, the CC did not include an uplift in the
allowed cost of debt on the grounds that:25
“We consider that the timing of any future debt issuance is a matter for
NIE taking into account its view of debt market conditions over the price
control period. It could adopt hedging strategies to lock in current rates if
it considered this to be appropriate. Hence, we did not consider that it
was necessary to provide NIE with any additional allowances, over and
above that which it would face if it went to the debt markets now, in
anticipation of higher rates in the future.”
In its GD17 determination, the Utility Regulator allowed an uplift for future 4.44
expected increases in rates.26
Conclusion
Frontier suggested that a “long-term approach” to setting the allowed cost of 4.45
debt was preferable because regulatory stability reduces the cost of capital and,
over the long-run, under and over estimates of the cost of capital will offset one
another.27 We agree that regulatory stability is desirable and that the CER should
make incremental and conservative adjustments to its WACC framework in
response to new market data.
In reaching our conclusion on a range and point estimate for the cost of debt, we 4.46
have considered the following:
(1) current real government bond yields are close to zero or even negative.
When combined with debt premium of 1.0%, this implies an overall real
cost of debt up to 1.0%;
(2) direct evidence based on GNI’s currently issued bonds, which have current
nominal yields of between 1.0% and 1.5%.28 When combined with positive
Eurozone inflation this implies a real cost of debt of less than 1.0%;
25
CC, NIE Final Determination: paragraph 13.76.
26 Uregni GD17 Final Determination: Table 190.
27 Frontier response to CER follow up questions.
28 Source: Bloomberg.

16 JUNE 2017 Confidential
Report to the CER on the cost of capital for GNI for PC4 | 29
(3) there is uncertainty in relation to future yields. If nominal yields were to
rise to 1.4% over PC4, as implied by the market implied forward yield curve,
and if inflation was to fall towards the bottom of the ECB’s lower bound
forecast for 2018 of 0.7%, this would imply a positive real yield of circa
0.7%. Adding a debt premium of 1% suggests a real cost of debt of 1.7%.
Alternatively, lower yields and inflation towards the upper end of the
forecast range would imply a lower real cost of debt;
(4) to the extent that historical debt costs are an appropriate cross-check, we
consider that it is more appropriate to examine the implied historical real
cost of debt during periods of “normal” market conditions prevailed. The
average real yield during the period outside the crisis from January 2006 to
December 2016 was 2.5% and the average since the crisis (i.e. August 2012
to December 2016) was 2.3%.
(5) recent CER determinations have allowed an overall cost of debt of between
2.9% and 3.0%; and
(6) UK regulatory regimes that have explicitly taken into account historical debt
costs. Ofgem’s most recent determination (which updates the cost of debt
annually) allows a real cost of debt of between 2.2% and 2.3%.
Based on the evidence, we consider that a reasonable range for the cost of debt 4.47
for GNI is 1.0% to 2.5%.29 The lower end of this range is based on current market
evidence and the upper end takes account of recent precedent from the CER, the
historical cost of debt and other regulatory precedent. The upper end allows
headroom for the possibility that real yields may increase during PC4.
We do not consider it appropriate to have no regard for market evidence but 4.48
accept that regulatory stability is important. The CER will need to balance these
elements. If the CER considered it appropriate to place greater weight on
regulatory stability, then a reasonable point estimate for the cost of debt would
be 2.5%, which is at the top end of the range. This also allows some headroom
above the current actual cost of debt for future increases over PC4. We consider
that this a conservative allowance compared to current market data.
Consequently, we consider that a further explicit aiming up adjustment for PC4
would not be required.
We recommend that the CER should continue to take account of prevailing 4.49
market conditions in its future determinations.
29
We consider that 1.0% is a reasonable estimate for the debt premium, which is consistent
with a range for the real yield on government bonds of 0.0% to 1.5%.

16 JUNE 2017 Confidential
Report to the CER on the cost of capital for GNI for PC4 | 30
5. Cost of equity
Introduction
We have adopted the Capital Asset Pricing Model (“CAPM”) methodology to 5.1
calculate the cost of equity. Although other methodologies can be used to
estimate the cost of equity,30 regulators have tended to prefer CAPM.31 The CER
has used CAPM in its previous determinations.32 Frontier has also used CAPM.33
The cost of capital is calculated using the formula: 5.2
𝑘𝑒 = 𝑟𝑓 + 𝛽 × (𝑟𝑚 − 𝑟𝑓)
where:
𝑘𝑒 is the expected rate of return for the risky asset;
𝑟𝑓 is the rate of return on a ‘risk free’ asset (the “risk free rate” or “RFR”);
𝛽 is the ‘beta’ factor, which is correlation of the return on the risk asset with
the expected returns on a diversified portfolio of all investable assets; and
𝑟𝑚 is the expected rate of return on a market value-weighted portfolio of all assets (the ‘market portfolio’). The term 𝑟𝑚 − 𝑟𝑓 in the CAPM is referred to
as the market risk premium (“MRP”).
30
These include the Dividend Growth Model, the Fama French Three Factor Model and
Arbitrage Pricing Theory.
31 Sudarsanam et al. (2011): ‘Cost of Equity for Regulated Companies: An international
Comparison of Regulatory Practices’: Table 3.3.
32 CER’s ESB/EirGrid PR4 (January 2015) and Irish Water IRC2 (December 2016)
determinations.
33 First Frontier Report: page 4.

16 JUNE 2017 Confidential
Report to the CER on the cost of capital for GNI for PC4 | 31
Risk free rate
Theory and practice
The RFR theoretically represents the return required by investors on an 5.3
investment that is devoid of all risk, including interest rate risk, inflation risk,
default risk and liquidity risk. Established regulatory practice estimates the RFR
empirically, by reference to the returns on a risk free asset. The identification of
the risk free asset is not always straightforward, though government bonds have
traditionally been considered the best proxy. Consequently, the RFR is commonly
calculated from the yield on longer-dated government bonds in the country for
which the cost of capital is to be calculated.
The CER has previously considered evidence from the yields on AAA-rated 5.4
Eurozone government debt (rather than Irish government bond yields). In
principle, we consider that this approach remains appropriate.
It is generally accepted that an estimate of the long term RFR is required. 5.5
However, market yields, even on longer-dated government debt, have fluctuated
over time. Since the global financial crisis, academics and practitioners have
argued that factors may have distorted bond markets. Consequently, it is
necessary to consider whether observed market yields today provide evidence for
the long term expected RFR.
GNI’s proposal
Frontier proposes a risk free rate of between 1.9% and 2.0%. They suggest that 5.6
current market evidence understates RFR,34 and adopt a “long term view on the
risk free rate” consistent with the CER and other regulators.35 Frontier’s Second
Report expanded on this, stating that:36
“…the rationale to date behind the CER’s approach in relation to the RFR
has been to discount short term data due to a concern that that a
combination of QE and a ‘flight to safety’ has been artificially depressing
sovereign yields. In our view, this rationale makes sense and continues to
hold.”
34
First Frontier Report: pages 10 to 11.
35 First Frontier Report: page 15.
36 Second Frontier Report: page 12.

16 JUNE 2017 Confidential
Report to the CER on the cost of capital for GNI for PC4 | 32
Current bond yields and our interpretation
In Section 4, we noted that the current real yields on government bonds are close 5.7
to zero or even negative. The current yield curve implies that yields are expected
to rise over the course of PC4, but to a level that remains substantially lower than
the historical average.
A number of explanations have been advanced for the underlying cause of these 5.8
historically low yields and the period for which they are likely to persist.
Explanations include long-term macroeconomic changes and short-term market
dislocations. These include demographic changes,37 expectations of weak future
growth,38 market distortions resulting from extraordinary monetary policy; and a
flight to quality / increase in risk-aversion by investors.
The last two of these explanations imply that current yields are affected by 5.9
shorter-term one-off factors. Hence, the yields may understate the “true” long
run risk free rate, which should be embedded in an investor’s long run expected
return on equity. By contrast, the first two explanations imply that the risk free
rate itself may have fallen. It is not straightforward to distinguish between these
alternative explanations, and ultimately the assessment will require regulatory
judgment.
We note that there is some empirical analysis that suggests the fall in real interest 5.10
rates around the world began prior to the financial crisis.39 On interpretation of
this data might support the view that some of the observed fall reflected longer-
term factors, rather than transient market dislocations stemming from the global
financial crisis. The ECB also published a paper in 2014 discussing specific
challenges in estimating a Euro area RFR.40 It noted that yields have been affected
by a number of factors and that some implied that the current low yields are a
temporary distortion. However, other factors implied a longer-term change.
37
King, M. and Low, D. (February 2014) ‘Measuring the “World” real interest rate’ NBER
Working Paper no. 19887: page 1.
38 Lilico, A. and Ficco, S. (January 2012) ‘The Relationship between Sustainable Growth and
the Risk-free Rate: Evidence from UK Government Gilts’, page 6.
39 King, M. and Low, D. (February 2014) ‘Measuring the “World” real interest rate’ NBER
Working Paper no. 19887.
40 ECB Monthly Bulletin (July 2014) ‘Euro area risk-free interest rates: measurement issues,
recent developments and relevance to monetary policy’.
16 JUNE 2017 Confidential
Report to the CER on the cost of capital for GNI for PC4 | 33
We consider that there is mixed evidence on the factors that have influenced the 5.11
RFR and that it is not possible to determine with certainty the degree to which
short term and long term factors have affect current yields.
Other evidence for the RFR
Given the issues discussed above, regulators have sought other sources of 5.12
empirical evidence to determine the RFR. The ECB notes that one source of
market evidence is interest rate swaps.41 While longer-dated swaps are more
likely to incorporate a degree of credit risk, overnight index swap (“OIS”) rates do
not suffer this problem. The ECB’s analysis based on OIS does not imply a
materially different RFR to that implied by current bond yields.42
Some macroeconomic models suggest that there may be a relationship between 5.13
the RFR and other macroeconomic variables. Some macroeconomic models
predict that, in the long-run, the real RFR tends to converge toward the long run
real GDP growth rate.43 Mainstream economic forecasts project that Eurozone
GDP will continue to grow in real terms, but at a slower rate than the long-run
historical average. The ECB expects real term growth of 1.7% in 2016 and 2017,
slowing to 1.6% in 2018 and 2019.44 The ECB expresses significant uncertainty
regarding its forecasts further ahead.45 Assuming that there is a clear and robust
relationship between the real growth rate and the real RFR – which is not
necessarily the case – these forecasts support the view that the real RFR is lower
than the 1.9% proposed by Frontier.
We consider there is a lack of consensus concerning the weight that should be 5.14
placed on these alternative sources of evidence.
41
Ibid.
42 ECB Monthly Bulletin (July 2014) ‘Euro area risk-free interest rates: measurement issues,
recent developments and relevance to monetary policy’: Chart 3.
43 The Ramsey-Cass-Koopmans long run growth model is an example of such a model.
44 Source: ECB (December 2016) ‘Eurosystem staff macroeconomic projections’. The ECB
predicts that the Irish economy will continue to achieve rapid GDP growth in real terms, of
3.3% in 2017, falling to 3.0% in 2018 and 2.8% in 2019. Despite this positive outlook,
Ireland forms a small proportion of the Eurozone economy as a whole and suffered a
deeper recession than the Eurozone as a whole.
45 The ECB forecasts growth for 2019 of 0.4% to 2.8% (with a central projection of 1.6%).

16 JUNE 2017 Confidential
Report to the CER on the cost of capital for GNI for PC4 | 34
Regulatory precedent
We have reviewed recent regulatory precedent regarding the interpretation of 5.15
current market conditions and the implications for the risk free rate. Table 5-1
sets out recent regulatory decisions from the UK and the Republic of Ireland.
Table 5-1: Precedent regulatory decisions on RFR
Regulatory decision Determination date
Real risk free rate
CER Irish Water IRC2 Dec 2016 2.00%
CER ESBN/EirGrid PR4 Dec 2015 1.90%
Uregni GD17 Sep 2016 1.25%
CMA Bristol Water Oct 2015 1.25%
Ofwat PR14 Dec 2014 1.25%
ComReg Dec 2014 2.10%
Ofgem RIIO ED1 Jul 2014 1.0% to 1.5%
CAR Oct 2014 0% to 1.5%
CMA Northern Ireland Electricity Mar 2014 1.0% to 1.5%
CER PC3(1) Nov 2012 3.5% to 5.5%
Sources: Published documents from relevant authorities. Note: (1) The risk free
rate in this determination included a substantial uplift for the impact of the Irish
financial crisis.
Since 2014, regulators in the UK have determined that the RFR falls in a range of 5.16
1.0% to 1.5%. This contrasts with earlier determinations, where regulators
adopted an estimate of around 2.0%.46 However, in Ireland, ComReg concluded
that the RFR was higher noting that, while the rate implied by the yield on
German government bonds was lower, it placed weight on Irish regulatory
precedent for a higher RFR. The CER also adopted a higher RFR of 1.9% to 2.0%.
We note, the CAR concluded that the RFR fell in broad range of 0.0% to 1.5%.
46
See Figure 8 of the First Frontier Report. Determinations by Ofwat, Ofgem, the Utility
Regulator and the CC used an RFR of 2.0% in determinations between 2009 and 2012.

16 JUNE 2017 Confidential
Report to the CER on the cost of capital for GNI for PC4 | 35
In the UK, the CC made a number of observations in 2014 in relation to the 5.17
interpretation of the current low level of government bond yields:47
(1) UK ILG yields provided the best evidence for the UK RFR and nominal yields
could also be used if assumptions are made about expected inflation and
any inflation risk premium;
(2) longer-dated gilt yields may be affected by pension funds (a UK-specific
consideration) and shorter yields may be affected by extraordinary
monetary policy;
(3) the effects of monetary policies and pension fund dynamics are increasingly
well understood by the markets, which means that yields should provide a
better guide to future expected returns; and
(4) there is no “mechanistic” way of interpreting market yields.
Together, these observations provided a rationale for the CMA’s adoption of a 5.18
lower RFR assumption. By selecting an estimate of the RFR somewhat above the
current market yield, the CMA’s determination implicitly incorporated an
assumption that the RFR would increase. We note that this adjustment was based
on the CMA’s judgment.
Conclusion
Yields on all government bonds have fallen since the PC3 determination and the 5.19
Irish sovereign debt crisis that affected that assessment has abated. There is some
evidence to support that the fall is due to longer-term macroeconomic changes,
rather than only the short-term market dislocations following the 2008 financial
crisis. However, there is also some evidence that government bond yields may
understate the true long-term risk free rate. The CC has noted in the UK that there
is no mechanistic way of interpreting current market yields. As such, a degree of
regulatory judgment is required to determine an appropriate rate. Factors such as
regulatory consistency are an input into this judgment.
UK economic regulators have recently selected an RFR in the range 1.0% to 1.5%, 5.20
reflecting financial markets in the UK. However, recent CER and ComReg
determinations in Ireland have adopted an RFR of 1.9% to 2.1%. We note that
market conditions have not materially changed since these determinations.
47
CMA, NIE decision.

16 JUNE 2017 Confidential
Report to the CER on the cost of capital for GNI for PC4 | 36
We consider that the RFR in Ireland might lie in the range 1.5% to 2.0% for 5.21
regulatory purposes. This range is based on the upper end of recent UK regulatory
determinations and the most recent Irish determinations. To support the stability
of the CER’s regulatory policy, we consider that the CER could support a point
estimate for the RFR of 1.9%, consistent with other recent determinations. The
slight reduction from 2.0% would reflect the market evidence of a longer-term
shift in the real RFR. If current market conditions persistent, the CER may be
justified in adopting a lower RFR estimate in the future.
Market risk premium
Theory and practice
The MRP is the return that an investor expects in excess of the risk free return 5.22
from a fully diversified portfolio of all investable assets.48 It is not practical to
calculate the return on a true portfolio of all investable assets, so regulators
estimate the expected return on a broad equity market portfolio as a proxy. The
difference between the expected equity market return and the expected risk free
return is referred to as the MRP or the equity risk premium (“ERP”).
48
Smithers, A. and Wright, S. (2014): ‘The Cost of Equity Capital for Regulated Companies: A
Review for Ofgem’.

16 JUNE 2017 Confidential
Report to the CER on the cost of capital for GNI for PC4 | 37
The MRP is commonly calculated by reference to historical realised returns, 5.23
historical ex-ante expected returns or forward-looking expectations. The first of
these approaches has been widely used by regulators in the UK and abroad.49
There are two principal approaches to estimating the MRP on a historical basis. It 5.24
can be estimated directly over time by calculating the return on the market in
excess of an estimate of the RFR in each period. Alternatively, it can be derived by
estimating the Total Equity Market Return (“TMR”) over time (i.e. total returns
earned by equity investors) and then by deducting an estimate of the current RFR.
We have used the second approach in this case due to common regulatory
practice.50
GNI’s proposal
Frontier proposed a range for the ERP of 4.6% to 5.1%, calculated by deducting 5.25
their point estimate for the RFR of 1.9% from a range for the TMR of 6.5% to
7.0%.51 They noted that the CER’s recent determination on the ERP of 4.75%,52
was consistent with a point estimate for the TMR of 6.65% and an RFR of 1.9%.
49
Sudarsanam et al. (2011): ‘Cost of Equity for Regulated Companies: An international
Comparison of Regulatory Practices’: Table 3.4.
50 Wright, S. and Smithers, A. (2014) ‘The Cost of Equity Capital for Regulated Companies: A
Review for Ofgem’: pages 10 to 11. See CC’s approach in its 2014 NIE determination.
51 First Frontier Report: page 20.
52 Ibid.
16 JUNE 2017 Confidential
Report to the CER on the cost of capital for GNI for PC4 | 38
Empirical evidence for the TMR
Given the range of alternative approaches to estimating the TMR, it common 5.26
practice to consider a range of evidence. Frontier cites the latest estimates for
Ireland from the Credit Suisse Global Investment Returns Sourcebook 2016, which
was compiled by Dimson, Marsh and Staunton.53 This indicated a TMR of 7.0% and
an ERP of 4.8%.54 Regulators have commonly placed weight on long run evidence
from this dataset including the CC in its NIE determination.55 They also cited
regulatory precedent for the TMR of 6.5% to 6.75%.
The Dimson, Marsh and Staunton estimate of the ERP is a direct estimate (i.e. 5.27
calculated as the return on the market in excess of an estimate of the risk free
return in each period). Combined with Frontier’s proposed RFR of 1.9%, this
implies a TMR of 6.65%.
There is limited other direct empirical evidence relating specifically to Ireland. 5.28
However, evidence of investors required returns from the UK might provide a
relevant benchmark, given its close economic integration with the Republic of
Ireland.
First, Smithers and Wright (2014) proposed an overall estimated range for the 5.29
arithmetic TMR of 6.25% to 7.25%,56 which is derived from their own analysis of
the Dimson, Marsh and Staunton dataset for the UK.
Second, the historical ex ante analysis by Dimson Marsh and Staunton cited by the 5.30
CC in its NIE determination suggested a range for ex ante expected TMR of
between 5.5% and 6.0%.57 Ex ante approaches, disaggregate historical realised
returns into expected returns and unexpected positive or negative impact on
realised returns.
53
First Frontier Report: page 19.
54 Credit Suisse Global Investment Returns Sourcebook 2016: page 111.
55 CC Northern Ireland Electricity Final Determination: paragraphs 13.138 to 13.141.
56 Smithers, A. and Wright, S. (2014): ‘The Cost of Equity Capital for Regulated Companies: A
Review for Ofgem’: page 11.
57 CC Northern Ireland Electricity Final Determination: paragraph 13.145.

16 JUNE 2017 Confidential
Report to the CER on the cost of capital for GNI for PC4 | 39
Third, forward-looking estimates of the expected TMR for the UK, based on Bank 5.31
of England calculations using assumed future dividend growth rates, fall in the
range 5.0% to 6.5%.58 These estimates are sensitive to the long run assumed
dividend growth rate, which is highly uncertain. Therefore, we place less weight
on this evidence.
In conclusion, empirical evidence suggests that the reasonable range for the TMR 5.32
lies between 5.5% and 7.25%.
Regulatory precedent
The table below sets out the MRP in recent regulatory decisions in the UK and 5.33
Ireland. It also shows the assumed TMR range, calculated by adding the RFR
adopted in each determination to the MRP. We note that, in some
determinations, regulators select a point estimate for the WACC without adopting
a specific point estimate for each of the underlying parameters.
Table 5-2: Precedent regulatory decisions on market risk premium and implied
total market return
Regulatory decision Determination date
Market risk premium
Total market return
CER Irish Water IRC2 Dec 2016 4.75% 6.75%
CER ESBN/EirGrid PR4 Dec 2015 4.75% 6.65%
Uregni GD17 Sep 2016 5.25% 6.50%
CMA Bristol Water Oct 2015 5.25% 6.50%
Ofwat PR14 Dec 2014 5.50% 6.75%
Ofgem RIIO ED1 Dec 2014 4.0% to 5.0% 5.0% to 6.5%
ComReg Jul 2014 5.0% 6.75% to 7.5%
CAR Oct 2014 5.0% 6.5%(2)
CMA Northern Ireland Electricity
Mar 2014 4.0% to 5.0% 5.0% to 6.5%
CER PC3(1) Nov 2012 4.0% to 5.0% 7.5% to 9.5%
58
CC Northern Ireland Electricity Final Determination: paragraphs 13.151 to 13.155.

16 JUNE 2017 Confidential
Report to the CER on the cost of capital for GNI for PC4 | 40
Sources: Published documents from relevant authorities. Note: (1) The risk free
rate in this determination included a substantial uplift for the impact of the Irish
sovereign debt crisis. (2) In the CAR’s most recent airport charge determination,
although it adopted a point estimate of the ERP of 5.0%, this was in conjunction
with an RFR of 1.5%, implying an overall TMR of 6.5%.
We observe that while there is wider range of values for the ERP, there appears to 5.34
be regulatory consensus that the TMR lies in the range 6.5% to 6.75%.
Conclusion
Based on empirical evidence and regulatory precedent, we consider that a 5.35
reasonable range for the TMR is 6.5% to 6.75%. Based on an RFR of 1.5% to 2.0%,
this implies a range for the MRP of 4.5% to 5.25%. The point estimate proposed
by Frontier of 4.75% falls within this range. Taking into account our recommended
point estimate for the risk free, we consider that a point estimate for the market
risk premium of 4.75% could be supported by the CER.59
Beta
Approach
We have used an empirical approach to determine beta. As GNI is not publicly 5.36
traded, its equity beta cannot be measured directly. Following common practice,
we have based our analysis on a set of comparable companies. As estimates of
beta can vary over time and between companies, we have examined the historical
evolution of beta over time.
GNI’s proposal
Frontier proposed a range for the asset beta of between 0.43 and 0.45, with a 5.37
point estimate of 0.44. This is based on a two-year average of traded regulated
network utility companies in the UK.60
59
Estimate based on the average TMR of 6.5% to 6.75% less 1.9%.
60 First Frontier Report: pages 20 to 21.

16 JUNE 2017 Confidential
Report to the CER on the cost of capital for GNI for PC4 | 41
Comparator companies
Frontier explained that their comparator set was based on traded regulated 5.38
network utilities in the UK and that this comparator set was used by the CC in its
NIE determination in 2014.61 Table 5-3 below summarises the characteristics of
the comparators used by Frontier. This includes: (1) main business activities; (2)
country of operation; (3) extent of regulation in their businesses; and (4) size
based on turnover.
Table 5-3: Comparators used for beta analysis in First Frontier report
Business activities Country Extent of price regulation
Turnover (2015 £m)
GNI Gas transmission and distribution
Rep. of Ireland
All business areas 321
National Grid
Gas transmission and electricity transmission
UK Majority of business areas
15,201
SSE Electricity generation, retail supply and transmission
UK Small proportion of business areas
31,654
United Utilities
Water and wastewater management
UK Majority of business areas
1,730
Severn Trent
Water and wastewater management
UK Majority of business areas
1,801
Pennon Water and wastewater management, waste recycling and recovery
UK Water and wastewater business
1,352
Sources: Bloomberg and corporate websites.
We note that SSE has significant unregulated activities. Of its total external 5.39
revenue in 2016 of GBP 29bn, approximately GBP 20bn was earned through
generation and approximately GBP 8bn was earned from retail supply. Just GBP
1bn was earned from its network.62 Both generation and supply are subject to
competition, neither is price regulated and both are likely to be subject to more
market risk. Figure 15 of the First Frontier Report shows that SSE’s beta is
consistently higher than that of the other comparators.
61
CC Northern Ireland Electricity Final Determination: Table 13.9.
62 SSE plc Annual Report 2016, Note 5.1, page 130.

16 JUNE 2017 Confidential
Report to the CER on the cost of capital for GNI for PC4 | 42
In the Second Frontier Report, Frontier disagreed with our initial proposal to 5.40
exclude SSE from the set of comparable companies to GNI. Although Frontier
acknowledged that SSE’s Networks business represented only a small proportion
of its total revenues, it pointed out that the division represents a larger share of
its operating profits. Frontier concluded that:63
“Given the percentage of SSE’s return driven by network activities, we
suggest it is appropriate to consider SSE amongst the comparator set.”
We do not agree with Frontier’s argument. SSE itself acknowledges in its Risk 5.41
Appetite Statement that there are significant differences in the risks of its
difference divisions, stating:64
“Each of SSE’s business divisions has a distinctly different risk profile. For
example, the Networks business is heavily regulated and is characterised
by stable, inflation linked cash flows whereas the Wholesale business is
heavily exposed to energy market and commodity risk. Affordability,
transformation and political risk particularly affect the Retail business,
while Enterprise is exposed to the risks that come with rapid growth in a
highly competitive market place.”
On this basis, we consider that it is unlikely that SSE provides a reasonable 5.42
comparator for the operator of a regulated gas network and we exclude it from
our analysis.
For PC3, CER’s advisors considered a wider set of eight international comparators. 5.43
We have also examined these companies. Table 5-4 below summarises the key
characteristics of these companies.
63
Second Frontier Report: page 11.
64 SSE plc 2016 Annual Report, p17.

16 JUNE 2017 Confidential
Report to the CER on the cost of capital for GNI for PC4 | 43
Table 5-4: Comparators used for beta analysis in PC3
Business activities Country of operations
Extent of regulation
Turnover (2015 £m(1))
APA Group Gas transmission and distribution
Australia Assets in certain geographies
1,003
TC Pipelines Gas transmission USA Majority of business areas
220
AGL Resources
Electricity and gas distribution
USA Majority of business areas
11,441
Piedmont Natural Gas
Gas distribution USA Utilities business 587
Northwest Natural Gas
Gas distribution USA Gas storage and utilities businesses
474
ITC Holdings Electricity transmission
USA Transmission business
684
Sources: Bloomberg and corporate websites. Note: (1) Converted from dollar
amounts using average GBP/USD spot rate in 2015.
However, because these businesses are outside of Europe and are subject to 5.44
different risks and regulatory frameworks we place less weight on these
comparators.
Beta calculation
We have obtained equity beta estimates for each comparator group. We have 5.45
calculated asset beta estimates using historical gearing ratios.65 This is the same
approach adopted by Frontier.66
Following the preferred approach set out in the Smithers & Co (2003) report (and 5.46
consistent with the calculations of Frontier and the approach used by the CER in
other determinations) we calculate beta using 2-year daily data from 2006 to
2016. As a crosscheck, we estimate betas using weekly data. Figures 5-1 and 5-2
summarise the 2-year daily asset betas for each of the comparator groups.
65
We assume no debt beta, in common with approach adopted in PC3 and in other recent
CER decisions.
66 First Frontier Report: page 20, footnote 6.

16 JUNE 2017 Confidential
Report to the CER on the cost of capital for GNI for PC4 | 44
Figure 5-1: Asset beta estimates of the Frontier comparator group, excluding SSE
(2-year daily)
Source: Bloomberg
We note that the UK comparators betas appear highly correlated. 5.47
Figure 5-2: Asset beta estimates of the PC3 comparator group (2-year daily)
Source: Bloomberg
0.0
0.2
0.4
0.6
0.8
1.0
National Grid United Utilities Severn Trent Pennon
0.0
0.2
0.4
0.6
0.8
1.0
APA Group TC Pipelines Piedmont Natural Gas
Northwest Natural Gas ITC Holdings

16 JUNE 2017 Confidential
Report to the CER on the cost of capital for GNI for PC4 | 45
For the UK comparators, we observe a fall in the asset beta around the onset of 5.48
the financial crisis, followed by a recovery. This apparent increase in relative
riskiness may reflect a fall in overall market volatility, rather than an increase in
the volatility of the comparator companies’ returns. Market volatility during the
financial crisis was higher than usual. Consistent with Frontier, we consider that
average betas since the crisis are likely to provide a better estimate of GNI’s beta
over PC4.
In Tables 5-5 below, we present our average beta calculations for the Frontier 5.49
comparator group.
Table 5-5: Average beta for Frontier comparator group (ex. SSE)
1 year average 2 year average
Comparator 2 year
daily 2 year
weekly 2 year
daily 2 year
weekly
National Grid 0.396 0.388 0.416 0.412
United Utilities 0.380 0.404 0.372 0.406
Severn Trent 0.378 0.425 0.380 0.435
Pennon 0.413 0.426 0.388 0.402
Average 0.392 0.411 0.389 0.411
Source: Bloomberg and FTI calculations. Note: Averages are taken over the two-
year period up to 31/12/2016. The reference index used to calculate all these
betas is the FTSE All-share.
We observe that the calculated averages are robust to the different calculation 5.50
frequencies and the period of averaging.67
In Tables 5-6 below, we present our average beta calculations for the PC3 5.51
comparator group.
67
We also calculated betas over a five-year period based on monthly data, which yielded
lower estimates. However, as we note above, these estimates include the period of the
financial crisis when measured betas were generally lower for these companies.

16 JUNE 2017 Confidential
Report to the CER on the cost of capital for GNI for PC4 | 46
Table 5-6: Average beta for PC3 comparator group
1 year average 2 year average
Comparator 2 year daily
2 year weekly
2 year daily
2 year weekly
APA Group 0.504 0.561 0.483 0.505
TC Pipelines 0.676 0.862 0.536 0.663
Piedmont Natural Gas
0.277 0.293 0.372 0.357
Northwest Natural Gas
0.317 0.290 0.351 0.334
ITC Holdings 0.304 0.282 0.312 0.263
Average 0.416 0.458 0.411 0.425
Source: Bloomberg and FTI calculations. Notes: Averages are taken over the period
up to 31/12/2016; we have omitted AGL Resources due to data limitations. For
APA group, the reference index is the Australian “All Ordinaries” index and for the
other comparators we use the S&P 500.
Using UK comparators based on 2-year data suggests that a reasonable range for 5.52
the beta is 0.37 to 0.44 (see figures in bold in relevant table above). Based on this
range we consider that a point estimate of 0.42 (which is slightly above the mid-
point) could be supported by the CER.
A point estimate of 0.42 is consistent with the higher “average” for the 5.53
international comparators based on two-year data. We note that the betas for
international comparators vary widely from a minimum of 0.26 to a maximum of
0.86. This suggests that some of these companies are less comparable to GNI and
that an average across these comparators may be less meaningful.
Conclusion on the inputs to the cost of equity
In Table 5-7 below, we summarise our view of the reasonable range for each input 5.54
for the cost of equity. For comparison, we also present Frontier’s proposals.

16 JUNE 2017 Confidential
Report to the CER on the cost of capital for GNI for PC4 | 47
Table 5-7: Summary of FTI recommended cost of equity and GNI proposals
GNI proposed FTI analysis
Input Min Max Point Min Max Point
Risk free rate 1.90% 2.00% 1.90% 1.50% 2.00% 1.9%
Equity risk premium(1) 4.60% 4.75% 4.75% 5.0% 4.75% 4.75%
Asset beta 0.43 0.45 0.44 0.37 0.44 0.42
Equity beta 0.96 1.00 0.98 0.82 0.98 0.93
Cost of equity (post tax) 6.30% 6.75% 6.54% 5.60% 6.66% 6.32%
Sources: Paragraphs 5.21, 5.35 and 5.52-53 above. Note: (1) We combine our
ranges of estimates for the risk free rate and equity risk premium so as to be
consistent with our estimated range for the total equity market return of 6.5% to
6.75%.

16 JUNE 2017 Confidential
Report to the CER on the cost of capital for GNI for PC4 | 48
6. Gearing
Introduction
Gearing is defined as the ratio of a company's debt to its equity capital, usually 6.1
expressed in percentage form as follows:
𝐷
𝐷 + 𝐸
In this section, we first discuss how gearing affects the WACC. We then consider 6.2
relevant empirical evidence and regulatory precedent. We then conclude on the
appropriate level of gearing for GNI.
How gearing affects the WACC
Gearing primarily affects the WACC through the relative weighting of debt and 6.3
equity. Equity capital typically has a higher required return than debt capital, due
to the greater risk borne by equity investors. In isolation, higher gearing levels
reduce the WACC. However, gearing also affects the WACC in two further ways.
First, higher gearing increases the riskiness of equity holders’ returns. This 6.4
increases the calculated equity beta, which increases the cost of equity. This
partially offsets the reduction in the WACC discussed above. Second, gearing is
one of the factors considered by credit ratings agencies in their assessment of the
creditworthiness of companies. In general, companies with higher credit ratings
have lower debt costs. Therefore, an increase in gearing may result in a higher
cost of debt if the change leads to a lower credit rating.
GNI’s proposal
Frontier proposes a gearing assumption of 55%. They note that this is consistent 6.5
with the PC3 determination and that it is “broadly consistent” with GNI’s actual
gearing.68
68
First Frontier Report: page 18.

16 JUNE 2017 Confidential
Report to the CER on the cost of capital for GNI for PC4 | 49
Empirical evidence
GNI’s level of gearing was circa 55% as at 31 December 2015.69 Figure 6-1 below 6.6
presents GNI’s initial forecast of its gearing over PC4, based its initial proposed
business plan capital investment.
Figure 6-1: GNI’s forecast gearing over PC4
Source: GNI submission SD031: 3A(ii).
Although GNI forecasted an increase in its gearing over PC4, GNI’s actual financial 6.7
plans do not inherently provide direct evidence for the appropriate notional
gearing. In addition, these forecasts are based on GNI’s proposed capital
expenditure plans, rather than its final plans as approved by the CER.
GNI currently receives credit ratings from Moody’s and S&P of A3 and A, 6.8
respectively. Moody’s has stated that, “[a]ny debt-funded acquisition or increase
in leverage [by GNI] to a level persistently above 60% (Net Debt to RAV) could lead
to a downgrade.”70 On this basis, we consider that a notional gearing of 55% is
consistent with GNI maintaining its current credit rating, which is comfortably
investment grade.
69
Moody’s Credit Opinion, 18 August 2016.
70 Moody’s Credit Opinion, 18 August 2016.
0%
10%
20%
30%
40%
50%
60%
70%
2017 2018 2019 2020 2021

16 JUNE 2017 Confidential
Report to the CER on the cost of capital for GNI for PC4 | 50
Regulatory precedent
The table below summarises the allowed level of gearing levels in recent 6.9
regulatory determinations.
Table 6-1: Precedent regulatory decisions on gearing
Regulatory decision Determination
date Gearing
CER Irish Water IRC2 Dec 2016 45%
CER ESBN/EirGrid PR4 Jan 2015 55%
Uregni GD17 Sep 2016 55%
CMA Bristol Water Feb 2015 62.5%
Ofwat PR14 Dec 2014 62.5%
ComReg Dec 2014 30%
Ofgem RIIO ED1 July 2014 65%
CAR May 2014 50% to 60%
CMA Northern Ireland Electricity Mar 2014 45%
CER PC3 Nov 2012 55%
Sources: Published documents from relevant authorities.
Recent Irish regulatory precedent is generally lower than the gearing levels 6.10
adopted by UK regulators. This can be explained by differences in corporate tax
regimes. Ireland has lower tax rates so the benefits of the tax shield are lessened.
Conclusion
We consider that a reasonable notional gearing assumption for GNI is 55%, 6.11
consistent with PC3. This also consistent with the gearing assumption proposed by
Frontier for GNI.

16 JUNE 2017 Confidential
Report to the CER on the cost of capital for GNI for PC4 | 51
7. Other factors affecting the appropriate rate of return
Introduction
In PC3, the CER adjusted the WACC for the impact of exceptional market 7.1
conditions.71 In this section, we first briefly comment on the impact of the global
financial crisis. We then consider the impact of the UK’s withdrawal from the
European Union (“EU”) in accordance with the terms of Article 50 of the Treaty on
the Functioning of the European Union – commonly referred to as “Brexit” –
following a referendum held on 23 June 2016.
Impact of the global financial crisis on Ireland
In PC3, the cost of capital included an allowance for a “Eurozone Crisis Premium”, 7.2
which was added to both the cost of debt and cost of equity. Frontier stated that,
in recommending a WACC:72
“We have been mindful of the particular economic situation that Ireland
and the Eurozone more generally are in and the footprint that the recent
Irish sovereign debt crisis has left on GNI’s cost of finance.”
We consider that much of the market dislocation and associated uncertainty that 7.3
affected Ireland and other Eurozone economies at the time of PC3 has now largely
subsided. To the extent that there is any residual impact of the global financial
crisis, we have considered this in our interpretation of the historical evidence, as
noted in the preceding sections. Our finding is consistent with Frontier.
Consequently, we would not propose to adjust the WACC in PC4 for the impact of
the global financial crisis.
71
CER (23 November 2012) ‘Decision on October 2012 to September 2017 transmission
revenue for Bord Gáis Networks’: Section 11.3.
72 First Frontier Report: page 9.

16 JUNE 2017 Confidential
Report to the CER on the cost of capital for GNI for PC4 | 52
Impact of Brexit
GNI’s position
Frontier stated that:73 7.4
“[T]here is currently significant market uncertainty due to the, as yet,
unknown consequences of Brexit, which could result in severe financial
market conditions in both the short and medium term. As a result, it is
important that the CER is conservative in its approach to setting WACC
allowances to ensure that there is sufficient headroom on the allowed
WACC to allow for any volatility in the market due to Brexit.”
In a separate response, Frontier acknowledged that “it is obviously very difficult to 7.5
predict how an unknown and highly uncertain outcome may affect GNI’s WACC”,
but suggested that possible consequences include:74
(1) an increase in Irish sovereign bond yields, which would increase GNI’s cost
of debt;
(2) a “flight to safety” by investors and/or further exceptional monetary policy,
which might reduce yields on risk free assets; and
(3) higher equity market volatility, resulting in a higher implied equity risk
premium and/or lower estimates of beta.
We note that Frontier published a review of the impact of Brexit on the cost of 7.6
capital. However, this review was based on market data shortly after the Brexit
referendum.75
In the First Frontier Report, it expressed the view that due to Brexit:76 7.7
“[T]he CER should either implement a specific aiming up allowance, or
use point estimates towards the high end of the range for the various
WACC parameters.”
73
First Frontier Report, page 23.
74 Frontier Economics (23 January 2017): Response to follow-up questions from FTI
Consulting.
75 Frontier Economics (10 August 2016) ‘Paying the full WACC? Impact of Brexit on the cost
of capital’.
76 First Frontier Report: page 23.
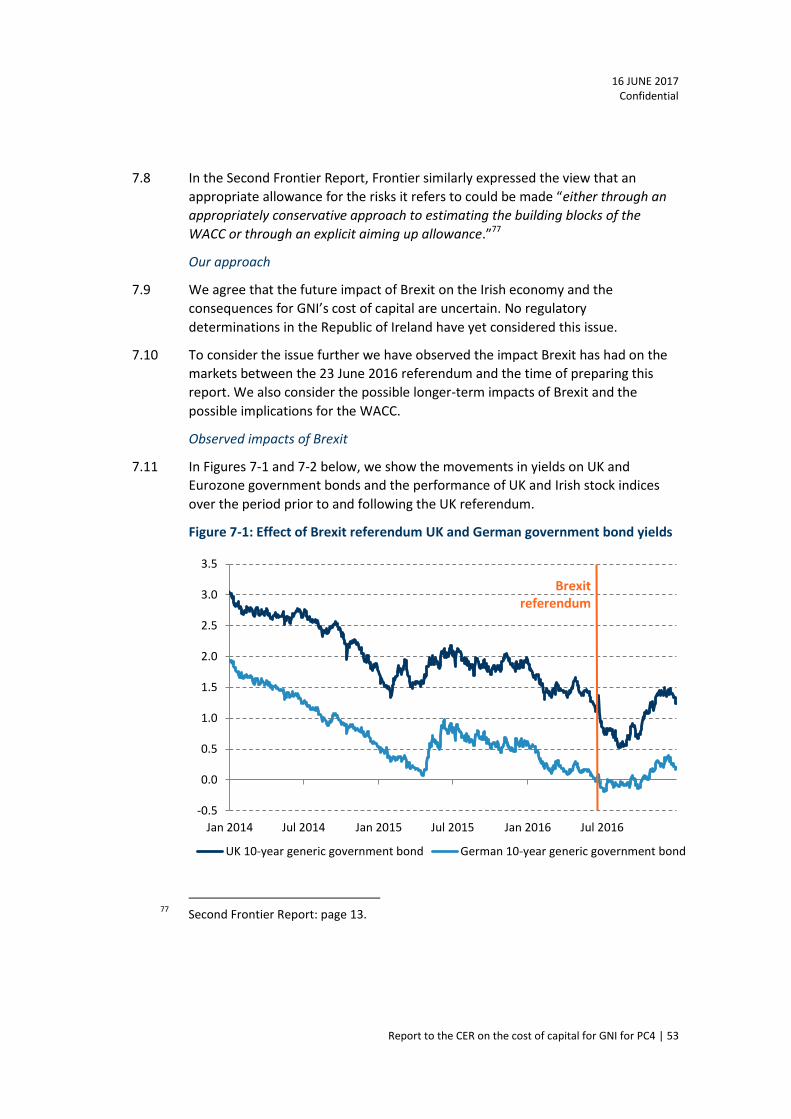
16 JUNE 2017 Confidential
Report to the CER on the cost of capital for GNI for PC4 | 53
In the Second Frontier Report, Frontier similarly expressed the view that an 7.8
appropriate allowance for the risks it refers to could be made “either through an
appropriately conservative approach to estimating the building blocks of the
WACC or through an explicit aiming up allowance.”77
Our approach
We agree that the future impact of Brexit on the Irish economy and the 7.9
consequences for GNI’s cost of capital are uncertain. No regulatory
determinations in the Republic of Ireland have yet considered this issue.
To consider the issue further we have observed the impact Brexit has had on the 7.10
markets between the 23 June 2016 referendum and the time of preparing this
report. We also consider the possible longer-term impacts of Brexit and the
possible implications for the WACC.
Observed impacts of Brexit
In Figures 7-1 and 7-2 below, we show the movements in yields on UK and 7.11
Eurozone government bonds and the performance of UK and Irish stock indices
over the period prior to and following the UK referendum.
Figure 7-1: Effect of Brexit referendum UK and German government bond yields
77
Second Frontier Report: page 13.
-0.5
0.0
0.5
1.0
1.5
2.0
2.5
3.0
3.5
Jan 2014 Jul 2014 Jan 2015 Jul 2015 Jan 2016 Jul 2016
UK 10-year generic government bond German 10-year generic government bond
Brexit referendum

16 JUNE 2017 Confidential
Report to the CER on the cost of capital for GNI for PC4 | 54
Source: Bloomberg
A general prediction is that Brexit would lead to a reduction in the yield on 7.12
government bonds, which might imply a reduction in the RFR and a lower cost of
capital. The data shows that there was a drop in yields at the time of the
referendum; however, yields have subsequently increased.
Figure 7-2: UK and Irish equity performance following Brexit referendum
Source: Bloomberg
The figure above shows that there was a short-term market reaction to the 7.13
outcome of the UK referendum. Subsequently however, fears of a market
downturn as a consequence of the referendum result appear to have been
overplayed.
80
100
120
140
160
Jan 2014 Jul 2014 Jan 2015 Jul 2015 Jan 2016 Jul 2016 Jan 2017
Ind
ex,
Jan
20
14
= 1
00
FTSE All share Irish ISEQ
Brexit referendum

16 JUNE 2017 Confidential
Report to the CER on the cost of capital for GNI for PC4 | 55
The longer term impact remains more uncertain. In a publication issued in August 7.14
2016, Frontier noted that:78
“In the medium-term, there could be more movement in these markets
depending on the terms on which the UK exits the EU; whether or not the
UK remains in the single market; and how its trading arrangements with
the EU and elsewhere evolve more generally. There is at present little
basis on which to speculate how this may affect investor perceptions of
risk in the long run.”
We agree that from current data we are unable to determine how the markets 7.15
will react in the future. In the article, it appears that Frontier considered that the
market impact of Brexit could lower the cost of capital. They state:79
“Regulators will need to be careful in interpreting market data and
making consistent estimates which are appropriate for price controls
which span several years. If the WACC is genuinely lower as a result of
Brexit, this will generally be good news for customers if regulators can
translate this into lower bills. But setting the allowed return too low off
the back of market evidence that may prove to be ephemeral will deter
much-needed investment, particularly in times of greater market
volatility and economic uncertainty.” (Emphasis added)
We consider that market recovery in the period following the referendum and our 7.16
long run approach to assessing the WACC reduce the risk of underestimating the
WACC.
78
Frontier Economics (10 August 2016) ‘Paying the full WACC? Impact of Brexit on the cost
of capital’: page 9.
79 Frontier Economics (10 August 2016) ‘Paying the full WACC? Impact of Brexit on the cost
of capital’: page 20-21.

16 JUNE 2017 Confidential
Report to the CER on the cost of capital for GNI for PC4 | 56
Forecasts of the possible future impact of Brexit
The impact of Brexit on Ireland is highly uncertain. In part, this is because the 7.17
form of the UK’s future legal and economic relationships with the EU remain
largely unknown.80 The Governor of the Central Bank of Ireland has noted that
this could lead to volatility in financial markets and the macro-economy:81
“Looking ahead, the design and timing of the new relationship between
the UK and the EU remain quite uncertain. It is reasonable to expect
some volatility in financial markets and macroeconomic variables as the
negotiations move along.”
Even if the form of the future relationship were known, there would still be 7.18
uncertainty surrounding the economic impact on the UK. In addition, the knock-
on impact on the Republic of Ireland would be uncertain.
Impact on the UK
A meta-analysis of estimates of the impact of Brexit on the UK describes the range 7.19
of estimates as “amazingly wide”.82 It notes that the most optimistic study
suggested that Brexit could increase GDP by over 11 per cent while the post
pessimistic studies suggested a negative impact of around 20 per cent of GDP.
Although some forecasts of the short term impact of a vote to leave the EU have 7.20
proven to be too pessimistic, we do not consider that this necessarily provides any
indication of the reliability of estimates of the longer term impact of Brexit, after
the UK’s withdrawal from the EU actually takes effect.
80
The UK Prime Minister, Theresa May, outlined some general objectives in a speech at
Lancaster House on 17 January 2017.
82
Busch, B. and Matthes, J. (April 2016) ‘Brexit – The Economic Impact: A Meta-Analysis’,
Section 4.2.

16 JUNE 2017 Confidential
Report to the CER on the cost of capital for GNI for PC4 | 57
Impact on the Republic of Ireland
Economists, politicians and other commentators have suggested that Brexit may 7.21
have a particularly significant impact on the Republic of Ireland.83 Studies have
identified that there is substantial economic integration between the UK and
Ireland. For example, a 2013 report commissioned jointly by the Department of
the Taoiseach in Ireland and the Department for Business Innovation and Skills in
the UK found that: (1) the UK is a major trade partner for Ireland in goods and
services; (2) the UK is a major source of tourist visitors to Ireland; (3) there is
significant bilateral direct investment from the UK into Ireland (and vice versa);
and (4) there is a “significant exchange of labour in a wide range of sectors”
between the two economies.84
Given these economic linkages, it is complicated to evaluate the impact that 7.22
Brexit might have on the Irish economy, particularly given the uncertainty about
the form of the UK’s future relationship with the EU. We have reviewed studies of
possible impacts on both financial markets and the real economy in the Republic
of Ireland.
In relation to financial market impact, the International Monetary Fund (“IMF”) 7.23
expressed the view that:85
“The UK vote to leave the EU is very likely to have negative effects on the
Irish financial system, at least in the short term… Adverse effects are
likely to come mainly through banks’ operations in the UK and a
slowdown affecting Irish firms, employment, and investment, rather than
short-term market volatility and funding risk. The impact could be large,
but should still be manageable.”
83
For example, the website of Fine Gael, the Irish governing party says “This is probably the
greatest economic challenge facing not just Ireland but the EU in the last 50 years... €1.2
billion per week in goods and services is traded between Ireland and the UK and therefore,
Brexit has implications for business and self-employed people right across the country.” A
study by the Irish Economic and Social Research Institute: Barrett et al (Nov 2015),
‘Scoping the Possible Economic Implications of Brexit on Ireland’ found that Brexit could
reduce bilateral trade flows between Ireland and the UK by 20 per cent or more as well as
having impacts through foreign direct investment and migration.
84 PA Consulting Group and Cambridge Econometrics (June 2013) ‘Evaluating the value of the
economic relationship between the United Kingdom and Ireland’.
85 IMF Country Report No. 16/258, ‘Ireland Financial System Stability Assessment’ (July
2016).

16 JUNE 2017 Confidential
Report to the CER on the cost of capital for GNI for PC4 | 58
Regarding the impact on the real economy, a study by the European Union 7.24
Committee of the United Kingdom House of Lords concluded that:86
“Any potential negative impact of Brexit will probably be more
significant for Ireland than for any other Member State, in particular in
the event of any economic downturn in the UK, or in the event of tariffs
or other barriers to trade being introduced between the UK and the EU.”
The Governor of the Central Bank of Ireland, Philip Lane, expressed the following 7.25
view of the short term impact from Brexit on the Irish economy in a speech on
28 October 2016:87
“[T]he extensive linkages between the UK and Ireland mean that Irish
economic performance is especially sensitive to shifts in UK output levels
and the Sterling-euro exchange rate. Accordingly, the Central Bank of
Ireland has adjusted its 2017 growth forecast from 4.2 percent to 3.6
percent. … [W]e view Brexit as a major downside risk for the Irish
economy and will be closely monitoring developments in the UK
economy as the full impact of Brexit takes hold.”
We note that, although this is a significant downward revision, real GDP growth of 7.26
3.6% is markedly above the forecast Eurozone average growth rate. Furthermore,
studies have observed that, while there is a high degree of integration between
the Irish and UK economies, there could also be off-setting benefits for certain
sectors of the Irish economy, as a result of its continuing membership of the EU
and the Eurozone.
The House of Lords study for example concluded that:88 7.27
“Notwithstanding the potentially negative economic outlook overall,
some sectors may stand to benefit. As an English-speaking member of
the Single Market, Ireland may be able to attract increased inward
investment post-Brexit. The contingency planning undertaken by the Irish
Government also means that it is well placed to respond to the economic
challenges that Brexit will represent.”
86
House of Lords, European Union Committee, 6th Report of Session 2016–17 (12 December
2016), ‘Brexit: UK-Irish relations’: paragraph 39.
87 Speech by Philip Lane at the Euro50 Group and CIGI Breakfast Meeting, Washington DC,
on 9 October 2016.
88 House of Lords, European Union Committee, 6th Report of Session 2016–17 (12 December
2016), ‘Brexit: UK-Irish relations’: paragraph 40.

16 JUNE 2017 Confidential
Report to the CER on the cost of capital for GNI for PC4 | 59
The balance of evidence suggests that the impact of Brexit on the Irish economy is 7.28
highly uncertain.
The impact on the WACC
Irrespective of the impact of Brexit on the Irish economy, we consider that its 7.29
impact on GNI’s WACC over PC4 may be limited. In respect of the cost of equity,
we estimate the required return on equity based on estimates of the total return
on equity over the very long run. Frontier itself does not suggest a higher ERP,
noting that:89
“For the purposes of setting WACC allowances for regulated utilities,
many regulators draw evidence from historical averages of observed
market returns over very long-term time horizons, often using the
database developed by academics Dimson, Marsh and Staunton (DMS)
and published by the Credit Suisse Global Investment Returns
Sourcebook.”
The concern with the calculation of the RFR is that a “flight to safety” and/or 7.30
quantitative easing could reduce the yield on government bonds, implying a
reduction in the RFR. In Section 5, we propose a range for the RFR which is above
current real yields on government bonds, based on recent regulatory precedent
pre Brexit. Hence, it is unlikely that we have underestimated the RFR.
Frontier explains that greater market volatility would be likely to decrease the 7.31
estimated beta of regulated utilities, all else being equal.90 In Section 5, we explain
that we have avoided placing excessive weight on short run fluctuations in
estimated beta by considering 1 and 2-year averages. Our approach is likely to be
conservative (i.e. overstates the cost of capital) if the concern is that estimated
betas might fall in the future.
89
Frontier Economics (10 August 2016) ‘Paying the full WACC? Impact of Brexit on the cost
of capital’: page 9.
90 Frontier Economics (10 August 2016) ‘Paying the full WACC? Impact of Brexit on the cost
of capital’: page 12.

16 JUNE 2017 Confidential
Report to the CER on the cost of capital for GNI for PC4 | 60
With respect to debt, Frontier has noted that falls in government bond yields have 7.32
been matched by falls in A- and BBB rated corporate bond indices, suggesting that
Brexit could lead to cheaper debt for utilities.91 In addition, in Section 4, we
explain that we have taken a conservative approach to the cost of debt because
expected real yields on government bonds are currently negative. We also
explained that GNI could hedge its exposure to future fluctuations in the cost of
debt, particularly in the near term.
On balance, we do not consider that the uncertain impact of Brexit on the 7.33
Republic of Ireland financial markets and economy provide a strong justification
for a higher cost of capital.
Impact of other political uncertainty
GNI’s position
In the Second Frontier Report, Frontier identified additional factors other than 7.34
Brexit which it suggested might be relevant to GNI’s WACC for PC4:92
“The uncertainty relating to Brexit is exacerbated by uncertainty
regarding the future direction of US economic and trade policy, and by
the potential impact of elections in a number of Eurozone countries
(including France and Germany).”
Our view
We do not consider that periodic national elections should be viewed as 7.35
exceptional events in developed economies with stable democracies. While the
outcome of elections may be a source of uncertainty about future economic
policy-making, we do not consider that there is any clear or objective basis on
which to conclude that the uncertainty regarding the true parameters for
components of GNI’s WACC has materially increased. Further, we consider that
these are short term factors whose impact on markets – and therefore the WACC
– is transient.
91
Frontier Economics (10 August 2016) ‘Paying the full WACC? Impact of Brexit on the cost
of capital’: page 12.
92 Second Frontier Report: page 13.

16 JUNE 2017 Confidential
Report to the CER on the cost of capital for GNI for PC4 | 61
Conclusion
In summary, we consider that: 7.36
(1) the Brexit referendum has impacted the markets during the period over
which we have performed our empirical analysis. On that basis, some of its
impact will be reflected in our assessment;
(2) Brexit is likely to have some further impact in the future, however the
nature, direction and magnitude of this impact are uncertain, as Frontier
acknowledges. However, there are some reasons to believe that Brexit may
reduce the cost of capital for utilities;
(3) for the calculation of the cost of equity we have adopted longer term
estimates, which are not impacted by short term volatility;
(4) Frontier suggested that bonds yields may increase, resulting in an increase
in the cost of debt. However, Frontier also expresses the view that the cost
of debt could fall. The IMF considers that Ireland’s financial system has
become more robust and the main risk to the Irish economy from Brexit is
that economic growth is lower; and
(5) to the extent that GNI considers that there is a risk that the cost of debt
might increase during PC4, it has the option to use financial instruments to
“lock in” the current low cost of debt.
At the time of the PC3 determination, exceptional market conditions already 7.37
existed and it was unclear when they would abate. In these circumstances, it was
appropriate to include an additional allowance. However, in PC4, similar
exceptional market conditions have not yet arisen and there is only a risk that
they might in the future. Even if such market conditions were to arise, it is then
unclear what the scale and direction of the impact would be.
We agree with Frontier that, where an “appropriately conservative” point 7.38
estimate of the WACC is adopted, then an explicit aiming up allowance is not
required in addition. We consider that, in several respects, our proposed point
estimate is conservative and therefore no aiming up adjustment is required.