The Cost and Quality of Full Day, Year-round Early Care and ...
71
The Cost and Quality of Full Day, Year-round Early Care and Education in Massachusetts: Preschool Classrooms An executive summary of a report on the findings from The Massachusetts Cost and Quality Study Funded by the Massachusetts Department of Education Center for Research on Women a part of The Wellesley Centers for Women
Transcript of The Cost and Quality of Full Day, Year-round Early Care and ...

The Cost and Quality of Full Day, Year-roundEarly Care and Education in Massachusetts:Preschool Classrooms
An executive summary of a report on the findings fromThe Massachusetts Cost and Quality StudyFunded by the Massachusetts Department of Education
Center for Researchon Women
a part of The Wellesley Centers for Women

The Cost and Quality of Full Day, Year-round Early Care and Education in Massachusetts:
Preschool Classrooms
A report on the findings from The Massachusetts Cost and Quality Study
Funded by the Massachusetts Department of Education


Massachusetts Cost/Quality Study: Preschool Classrooms Acknowledgements The research team would like to recognize the work of the Data Collection Advisory Committee in supporting the development of the Massachusetts Cost/Quality Study; their comments on the study at various stages were invaluable and we look forward to future collaborative efforts. However, any errors in this report are solely the responsibility of the authors. Members of this Advisory Committee include state and federal agencies, local Child Care Resource and Referral Agencies, local Community Partnership Council coordinators, early childhood coordinators, higher education institutions, legislative aides and other interested individuals; current members are listed below. The authors also wish to thank the directors, teachers and other staff of the centers who participated in this study, and gave freely of their time and information. Barbara Aiken Deborah Amaral Marica Arvanites Jennifer Bailey Phil Baimas Douglas Baird Vicki Bartolini Geraldine Begonis Ron Benham Joni Benn Janice Brindisi Roger Brown Helen Charlupski Julie Culhane David Dann Nomi Davidson Tricia DeSiata Stacy Dimino Mary Donnellan Elaine Fersh Laura Gang
Barbara Gardner Lisa George-Murray Christine Germano Kristen Gleasen Joanne Gravell Sue Halloran Cindy Harrington Julie Johnson Frances Joseph Melissa Kaden Kimberly Kinsella Edgar Klugman Barbara Lee Val Livingston Kathleen Lockyer Peggy McDonald Pam Memmolo Cindy Mis-Palley Kathy Modigliani Gwen Morgan Henry Morgan
Marianne Padien Margaret Reed Linda Reed Michelle Regan-Ladd Jim Robertson Marta Rosa Lori Rushia Sharon Scott Shirley Smith Rod Southwick Chris St. Hilaire Maggie Steele Richard Stirling Carl Sussman Jane Taylor Roy Walker Nancy Ward Ellen Weinstein Mary Wile Pat Xavier


Massachusetts Cost/Quality Study: Preschool Classrooms
i
Copyright © 2001 Wellesley Centers for Women Permission is granted to copy all or parts of this document for non-commercial educational purposes. Citation: Nancy L. Marshall, Cindy L. Creps, Nancy R. Burstein, Frederic B. Glantz, Wendy Wagner Robeson, Steve Barnett. 2001. The Cost and Quality of Full Day, Year-round Early Care and Education in Massachusetts: Preschool Classrooms. Wellesley Centers for Women and Abt Associates Inc.


Massachusetts Cost/Quality Study: Preschool Classrooms
i
Table of Contents Preface .................................................................................................................. ii
Introduction............................................................................................................. 1
Research Questions and Study Design ................................................................. 3
The Quality of Early Care and Education in Preschool Classrooms ...................... 5
What is Quality Early Care and Education? ................................................... 5
Structural Characteristics of Quality ........................................................ 6
Process Characteristics of Quality........................................................... 6
The Quality of Massachusetts Early Care and Education
in Preschool Classrooms .............................................................................. 17
Structural Characteristics of Quality ........................................................ 17
Process Characteristics of Quality........................................................... 19
Massachusetts Compared to Other States ............................................. 28
Improving the Quality of Preschool Care and Education in Massachusetts .. 32
Family Income and the Quality of Early Care and Education ........................ 40
Summary ....................................................................................................... 44
Revenues, Expenditures and Full Costs ................................................................ 47
Revenues....................................................................................................... 48
Expenditures .................................................................................................. 48
Revenues and Expenditures by Incomes of Families Served ....................... 49
Full Costs ....................................................................................................... 50
Summary........................................................................................................ 51
The Relationship Between Cost and Quality .......................................................... 52
A Multivariate Framework .............................................................................. 53
Labor Costs.................................................................................................... 54
Non-Labor Costs............................................................................................ 55
Total Costs..................................................................................................... 55
Implications .................................................................................................... 56
References..................................................................................................... 58
Appendix: Measurement and Estimation for the Cost-Quality Models.................... 60

ii
Preface The message emanating from brain research and research on early care and education programs is clear: quality early experiences have a positive impact on the development of a young child, and contribute to greater school readiness. Providing early educational, emotionally supportive and nurturing experiences are vital in order for children to develop successfully. There are an estimated 167,000 children in early education and care programs in Massachusetts. The Commonwealth’s substantial investment of over $500 million in early childhood education, coupled with the high numbers of children in child care programs, makes understanding the quality of services imperative, both to children’s welfare and for planning effective state investments. In 2000, the Department of Education, Early Learning Services, contracted with Wellesley College Center for Research on Women and Abt Associates to conduct a study of the cost and quality of early care and education in Massachusetts. We are pleased to present the first report from this study, addressing early care and education for preschool-aged children in full-day, year-round centers. Future reports will address early care and education for infants and toddlers in full-day, year-round centers, as well as early care and education in publicly-administered preschool classrooms and in family child care homes.

Massachusetts Cost/Quality Study: Preschool Classrooms
1
Introduction Over the last 30 years, there has been an enormous increase in the rate at which mothers with young children enter the labor force. By 1996, two-thirds of the nation’s preschoolers and three-quarters of school-age children had mothers who were employed outside the home (Kids Count 1998). Early care and education is a vital community resource enabling parents to work; early care and education also contributes to children’s development (Smith 1998). The Cost, Quality and Child Outcomes Study (Helburn 1995) provided dramatic evidence of the lack of quality early care and education in the four states studied, with 76% of the observed center-based programs rated “poor” or “mediocre” on the Early Childhood Environment Rating Scale. Infant/toddler rooms were of even lower quality, with about 90% rated less than “good”. The Relative and Family Day Care Study (Galinsky et al. 1994) found that relative care was of lower quality than regulated family child care, with 69% of relative caregivers rated “inadequate”, compared to only 13% of regulated family child care providers. In a study of multiple forms of non-maternal care (including centers, family child care and relative care), the NICHD Study of Early Child Care found that 57% of the children in non-maternal care received poor or mediocre care (NICHD ECRN 2000). Children in center-based care with higher ratios of children to adults received the poorest quality care. Given the national picture generated by the cumulative evidence from these and other studies, serious questions are raised about the quality of early care and education in Massachusetts. While Massachusetts has many exemplary programs, what is the range of quality in the state? How does the quality of center-based care vary for infants/toddlers and preschoolers? What is the quality of family child care, care and education in public preschools, and school-age care? The Quality of Care
A key element of any response to these questions is the measurement of the quality of care that children are receiving. Two main aspects of quality have been the focus of many studies of early care and education quality: structure and process. Structural characteristics such as group size, staff-child ratios, and caregiver education have been associated with children’s development—the ultimate indicator of quality care. These characteristics, however, only explain a portion of the variance in children’s development. A more thorough understanding of the quality of care that children experience requires an examination of what actually happens in the care setting—How do caregivers and children interact? What materials are available for the children and how do adults support children’s use of those materials? These process characteristics of care tell us a great deal about the quality of care that children experience. By

2
examining both structural and process characteristics, we can describe more fully the care that children receive. Then, by examining the relationships between the two aspects of quality, we can begin to address ways to improve quality. The Cost of Quality Care
Another central component of the early care and education puzzle is the cost of care—for families and for providers. For children in center-based care, the relationship between family income and quality is not linear. Rather, children in either lower-income families or higher-income families are more likely to receive higher quality care than children in moderate-income families (Phillips et. al. 1994). Low-income families, however, are less likely to use center-based care, at least in part because the cost of this form of care can be prohibitive. The questions remain: Do families with low or moderate incomes have access to quality early care and education in Massachusetts? If we want to raise the overall level of quality of care in Massachusetts and make high quality care available to families from all income levels, what might it cost? In order to answer the second question, we must first understand what the cost of providing early care and education is in Massachusetts. One of the challenges we are presented with is the proper measurement of the full cost of early care and education. As noted in the Cost, Quality, and Child Outcomes Study, full costs include both costs incurred by a center and reported on its statement of income and expense, as well as the value of in-kind contributions (e.g. volunteer labor and donated or subsidized space). To truly understand what early care and education costs to provide, it is essential to gather information in both areas. Then, by gathering information on the cost of care, we are able to explore the relationship between cost and quality and understand how much more higher quality care costs.

Massachusetts Cost/Quality Study: Preschool Classrooms
3
Research Questions and Study Design The Massachusetts Cost and Quality Study was designed to address four broad research questions: ❖ What is the quality of early care and education services in Massachusetts? ❖ What are the costs of early care and education services? ❖ What is the relationship between quality and costs? Does it cost more to provide
higher quality care? ❖ What is the relationship between the family income of children served and the quality
of care provided by early care and education programs? This report presents the findings from the first phase of the Massachusetts Cost and Quality Study, which examined the research questions in community-based centers serving preschool-aged children (2.9 years to 5 years). This study was designed to provide an accurate, up-to-date picture of the cost and quality of early care and education services for preschoolers. This study was not designed to evaluate the effectiveness of specific regulations, subsidies or other policies. Answers to these and other questions would require a different study design than that used to provide this snapshot of early care and education for preschoolers in Massachusetts. Study Design. We drew a random sample of 90 community-based centers serving preschoolers on a full-day, full-year basis. The centers were randomly sampled from the Office for Child Care Services (OCCS) licensing lists for the six OCCS regions. Head Start programs were not included in the sample because other on-going studies were addressing the specific needs of this program model. Centers were drawn from across the state, in direct proportion to each region’s market share of the state’s center-based, early care and education market. Figure 1 shows the number of centers in this sample in each of the six OCCS regions: Region 1 (Western Massachusetts), Region 2 (Central Massachusetts), Region 3 (Northeastern Massachusetts) Region 4 (MetroWest), Region 5 (Southeastern Massachusetts) and Region 6 (the Boston area).
Figure 1: Number of Centers in Sample, by OCCS Region
118
1824
18
11

4
Sixty-five percent of the selected centers agreed to participate in the study. This is comparable to, or better than, the response rates from the original Cost, Quality and Child Outcomes Study, which ranged from 41% in North Carolina and 44% in California, to 68% in Colorado and Connecticut. Each center’s likelihood of being selected into the sample was proportional to their share of the market. That is, their likelihood reflected the number of children they served, relative to the number of children served by other centers in their OCCS region. In our descriptive analyses, the data from each center were weighted to reflect their market share. In addition, all data have been weighted to adjust for sampling probability, ineligibility for the study, and non-response, to produce descriptive statistics representative of the entire state. This report includes data from centers from all regions of the state, from not-for-profit and for-profit centers, and serving a variety of children and their families. To measure the quality of care, a single preschool-aged classroom was chosen in each of the licensed centers in our sample. Specially-trained data collectors observed classrooms for three to four hours, working with center staff to select a time that was convenient for the providers and that was typical of the usual care environment for that classroom provider (i.e., not on a day when a field trip was planned, nor when half the class or the regular provider was sick). At the conclusion of the observation, data collectors interviewed providers to gather information on their education and training. Center directors or owners were interviewed separately, by another research team member, about general center characteristics, enrollment, staffing, revenues and expenditures. Cost analyses are based on the 84 of the 90 centers that provided complete financial information.

Massachusetts Cost/Quality Study: Preschool Classrooms
5
The Quality of Early Care and Education in Preschool Classrooms What is Quality Early Care and Education?
Quality of early care and education has been defined differently across numerous studies of the quality of care. Many studies have relied on structural characteristics as the sole measure of quality. Structural characteristics include classroom characteristics, such as the child:staff ratio (number of children per qualified classroom staff) and group size (number of children in the classroom). It also includes features of providers and directors including education and specialized training. The features of structural quality are regulatable, and most states set minimum standards for at least some aspects of structural quality. These structural characteristics have been shown to be associated with children’s development (c.f., Howes 1997; NICHD Early Child Care Research Network 1999; Burchinal, Roberts, Riggins et al 2000), the ultimate indicator of quality care. These characteristics are only one piece of the overall quality, however, and help to set the stage for the process characteristics. A more thorough understanding of the components of quality requires an examination of what actually happens in the early care setting (that is, the process). How do adults and children interact? What materials are available for the children and how do adults support children’s use of those materials? It is these aspects of the early care and education environment that scales like the Early Childhood Environment Rating Scale-Revised Edition (ECERS-R; Harms, Clifford, & Cryer 1998) have been designed to measure. These process measures tell us much more about the quality of care children receive. The process characteristics refer to the nature of the care that children experience and are often harder to measure than the structural characteristics. They include the warmth, sensitivity, and responsiveness of the caregivers, the emotional tone of the setting, the activities available to children, the developmental appropriateness of activities, and the learning opportunities available to children. These process measures of quality have been shown to be associated with children’s cognitive and socio-emotional development (c.f., Helburn et al 1996). Unlike the features of structural quality, process characteristics are not generally subject to state or local regulations. To fully understand the quality of care children are receiving, it is necessary to understand both aspects of quality. Then, we can examine the relationship between structural and process characteristics of quality to begin to address ways to improve the quality of early care and education.
6
Structural Characteristics of Quality
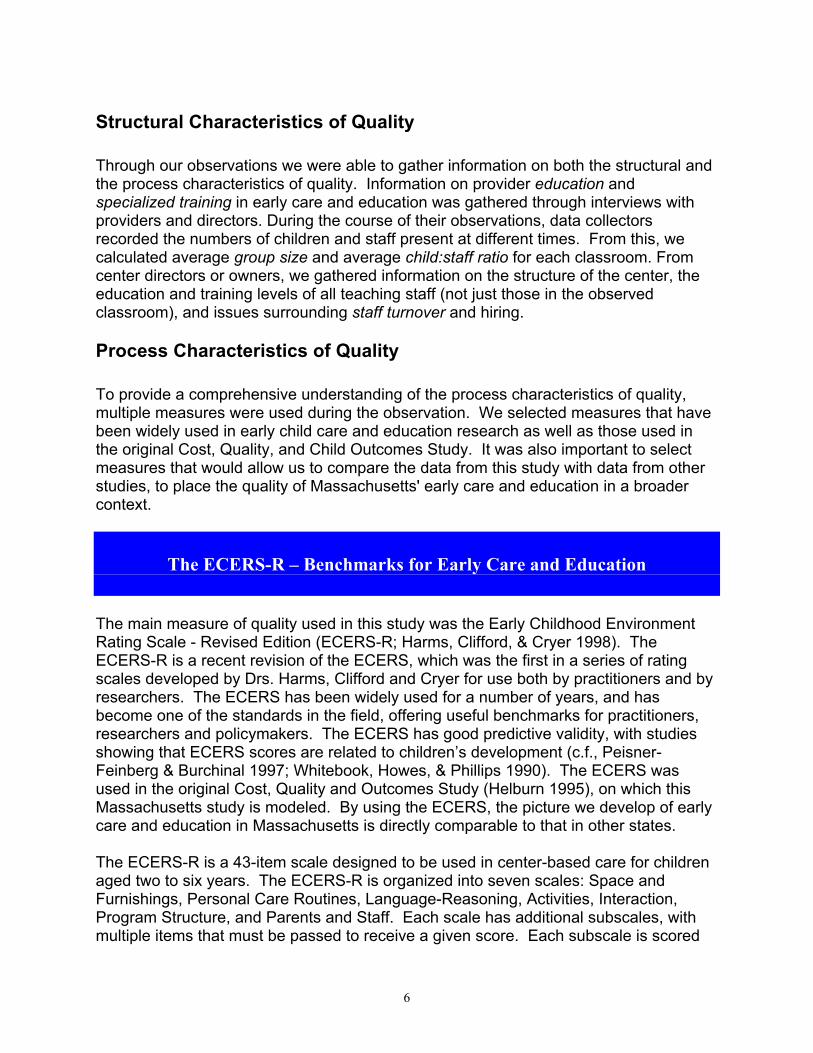
Through our observations we were able to gather information on both the structural and the process characteristics of quality. Information on provider education and specialized training in early care and education was gathered through interviews with providers and directors. During the course of their observations, data collectors recorded the numbers of children and staff present at different times. From this, we calculated average group size and average child:staff ratio for each classroom. From center directors or owners, we gathered information on the structure of the center, the education and training levels of all teaching staff (not just those in the observed classroom), and issues surrounding staff turnover and hiring. Process Characteristics of Quality
To provide a comprehensive understanding of the process characteristics of quality, multiple measures were used during the observation. We selected measures that have been widely used in early child care and education research as well as those used in the original Cost, Quality, and Child Outcomes Study. It was also important to select measures that would allow us to compare the data from this study with data from other studies, to place the quality of Massachusetts' early care and education in a broader context.
The ECERS-R – Benchmarks for Early Care and Education
The main measure of quality used in this study was the Early Childhood Environment Rating Scale - Revised Edition (ECERS-R; Harms, Clifford, & Cryer 1998). The ECERS-R is a recent revision of the ECERS, which was the first in a series of rating scales developed by Drs. Harms, Clifford and Cryer for use both by practitioners and by researchers. The ECERS has been widely used for a number of years, and has become one of the standards in the field, offering useful benchmarks for practitioners, researchers and policymakers. The ECERS has good predictive validity, with studies showing that ECERS scores are related to children’s development (c.f., Peisner-Feinberg & Burchinal 1997; Whitebook, Howes, & Phillips 1990). The ECERS was used in the original Cost, Quality and Outcomes Study (Helburn 1995), on which this Massachusetts study is modeled. By using the ECERS, the picture we develop of early care and education in Massachusetts is directly comparable to that in other states. The ECERS-R is a 43-item scale designed to be used in center-based care for children aged two to six years. The ECERS-R is organized into seven scales: Space and Furnishings, Personal Care Routines, Language-Reasoning, Activities, Interaction, Program Structure, and Parents and Staff. Each scale has additional subscales, with multiple items that must be passed to receive a given score. Each subscale is scored

Massachusetts Cost/Quality Study: Preschool Classrooms
7
on a seven-point scale, with benchmarks established for 1 = “Inadequate”, 3 = “Minimal”, 5 = “Good”, and 7 = “Excellent”. Programs that pass some of the items that are part of the benchmark for a “3”, but not all of them, are scored a “2” on that subscale. Similarly, programs that fall between “Minimal” and “Good” are scored a “4”, and programs that fall between “Good” and “Excellent” are scored a “6”. The ECERS-R ratings were based on observations by trained observers. As a measure of the inter-rater reliability of the observations, we calculated the proportion of the items on which a pair of observers, observing the same classroom, agreed exactly on the ratings. On average (across all possible pairs of observers), a pair of observers agreed exactly on 67% of the ECERS-R items; on average, a pair of observers agreed within one point on the seven-point scale on 84% of the ECERS-R items. In the following sections, we provide an overview of the meaning of these benchmarks in the seven ECERS-R scales. Space and Furnishings. The setting is the context in which early care and education takes place. Inadequate space is crowded, poorly lit and poorly ventilated, in poor repair. Settings are described as having inadequate furnishings when there is not enough basic furniture and equipment (e.g., enough chairs for all the children; soft toys and gross motor equipment, such as climbing equipment or balls, are not available) or furniture is in poor repair, and when the space is arranged in such as a way as to make it difficult for children to play – materials aren’t grouped in ways that encourage children to use them, walls between areas make it difficult for staff to supervise children at play, or children do not have access to play areas apart from the main flow of the classroom. Classrooms that provide this bare minimum – enough space and basic furniture for children and adults, adequate light and ventilation, space and furnishings in good repair and safe, some age-appropriate play equipment available – are rated as meeting Minimal standards. To be rated as Good on Space and Furnishings, a classroom must provide ample indoor and outdoor space with room for the children to move around freely; the space and furnishings must be arranged in a way that facilitates play and minimizes disruptions (for example, in well-defined activity centers – art area, blocks; trike-riding is separated from the ball-play area; quiet areas and active areas do not interfere with each other); and children’s artwork or photos of recent activities must be displayed, with many items at children’s eye level, among other standards. Classrooms are rated as Excellent on Space and Furnishings only if they meet all of the above standards, plus additional, higher standards, including: light and ventilation that can be controlled (windows that open; blinds that close); special furnishings such as a woodwork bench, sand/water table or art easels; accessible areas with cushions or other cozy play areas; at least five
Spac
e an
d Fu
rnis
hing
s B
ench
mar
ks

8
different activity areas to provide a variety of learning experiences; activity areas that are organized so that materials are nearby and children can access the materials themselves (e.g., open shelves, labeled containers); some quiet activities, for one or two children at a time, are available; projects which reflect individual children’s creativity (not simply copies of adult examples) are displayed; outdoor space has some protection from the elements, convenient features such as close to drinking water, accessible storage of equipment.
Personal Care Routines. A classroom is rated as Inadequate in Personal Care Routines if: children are often not greeted on arrival; children’s departure is disorganized or parents are not allowed to bring their children into the classroom; meals and snacks do not meet USDA nutritional guidelines, children’s food allergies are not accommodated, staff force children to eat, or there is a chaotic atmosphere at meal times; nap/rest times are too early or too late, or children are required to nap for more than 2 ½ hours, nap/rest times are not supervised or are supervised too harshly; toileting/diapering area is not sanitary, handwashing is often neglected after toileting; staff do not act to reduce the spread of germs (noses not wiped, diapers not disposed of properly, food preparation and toileting/diapering done near one another); smoking is allowed in child care areas; inadequate supervision to protect children’s safety, several indoor or outdoor hazards that could result in serious injuries. A classroom that meets Minimal standards is one in which: most children are greeted warmly on arrival and their departure is well-organized; well-balanced meals and snacks are provided in an atmosphere that is non-punitive and meets children’s needs; nap times are scheduled appropriately for most children with sufficient, non-punitive supervision; the toileting schedule meets the individual needs of children, with age-appropriate supervision; and staff take action to minimize the spread of infectious diseases. To be rated as Good, classrooms must: greet each child individually by name; have pleasant departure routines; welcome parents in the classroom and greet them warmly; most staff sit with the children at mealtimes; there is a pleasant social atmosphere at mealtimes and children are encouraged to eat independently with child-appropriate eating utensils; individual children’s dietary restrictions are followed; at nap/rest time, staff help children to relax with soft music, cuddly toys or back rubs, the nap space is dimly lit, quiet and arranged to help children rest (cots or mats are placed for privacy, or separated by a solid barrier); when toileting/diapering, sanitary conditions are easy to maintain and there are pleasant interactions between staff and children; staff model good health practices; children are dressed properly for conditions (dry clothes, warm clothes on cold days, aprons for messy play); staff explain reasons for safety rules to children; staff anticipate safety problems and take action to prevent problems (e.g., remove toys under climbing equipment, lock dangerous areas, wipe up spills to prevent falls).
Pers
onal
Car
e R
outin
es B
ench
mar
ks
Spac
e

Massachusetts Cost/Quality Study: Preschool Classrooms
9
Classrooms are rated as Excellent on Personal Care Routines only if they meet these standards, plus other, higher standards, including: on arrival, children are helped to become involved in activities, if needed; staff use greeting and departure times as information-sharing time with parents; children help during meal times (e.g. set the table, wipe up spills), children use child-size serving utensils, such as small pitchers, mealtimes are used for conversations, staff encourage children to talk about things of interest to children; nap/rest schedule is flexible to meet individual needs, provisions made for early-risers or non-nappers; child-sized toilets and low sinks available, self-help skills while toileting promoted as children are ready; children taught own health practices (proper handwashing, putting on own coat or art apron); play areas arranged to avoid safety problems, children generally follow safety rules (e.g., no crowding on slides, no climbing on bookcases). Language-Reasoning. A classroom is rated as Inadequate in the Language-Reasoning area when there are very few books out for children to use and staff rarely read to children; staff do not use activities that encourage children to communicate (talking about drawings, dictating stories, sharing ideas at circle time, finger plays, singing songs), there are very few materials accessible that encourage children to communicate (play telephones, puppets, dolls and dramatic play props, small figures and animals); staff do not talk with children about logical relationships (staff ignore children’s questions about why, do not call attention to sequence of daily events – what happens first, next – or to differences and similarity in number, size, shape; cause and effect); staff introduce concepts that are too difficult or with teaching methods that don’t include concrete experiences, staff give answers without helping children to figure things out; staff talk to children primarily to control their behavior and manage routines, staff rarely respond to children’s talk, children’s talk is discouraged much of the day. Classrooms that provide the bare minimum – some books accessible, at least one staff-initiated language activity daily (e.g., story-time), staff sometimes encourage children to communicate and talk about logical relationships and concepts, some concepts are introduced appropriate to the ages and abilities of the children, some staff-child conversation (e.g., short answer questions), children allowed to talk much of the day - are rated as Minimal. To be rated as Good, classrooms must: have a wide selection of books accessible for a substantial portion of the day, organized in a reading area, use some additional age-appropriate language materials daily, staff read books to children informally (e.g., during free play); communication activities take place during free play and group times, materials that encourage children to communicate are accessible in a varietly of interest centers (e.g. in the block area, the book area, the dramatic play area); staff talk about logical relationships while children play with materials that stimulate reasoning (e.g.,
Lang
uage
-Rea
soni
ng B
ench
mar
ks
Pers
onal
Car
e

10
size and shape toys, sorting games), children are encouraged to talk through or explain their reasoning when solving problems; there are many staff-child conversations throughout the day, language is primarily used to exchange information with children and for social interaction, staff add information to expand on ideas presented by children, staff encourages communication among children. To be rated as Excellent on Language-Reasoning, a classroom must meet all the above standards, plus other stricter standards, including: books and language materials are rotated to maintain interest, some books related to current classroom activities or themes; staff leave time for children to respond in conversations, balance listening and talking appropriately for age and abilities of children, link children’s spoken communication with written language (e.g., write down what children dictate and read it back to them); staff encourage children to reason throughout the day, using actual events and experiences, concepts are introduced in response to children’s interests or needs to solve problems; staff have individual conversations with most of the children, children are asked questions to encourage them to give longer and more complex answers (e.g., younger children are asked “what” and “where” questions, older children are asked “why” and “how” questions).
Activities. A classroom is rated as Inadequate on the Activities scale if there are very few developmentally-appropriate materials available; if the activities available for children do not include music/movement, sand/water play, or nature/science activities, and rarely include art activities, and if TV/videos or computer games are not developmentally appropriate, or children have no alternatives to watching TV when it is on. In addition, a classroom is rated as Inadequate if, instead of including activities that promote acceptance of diversity, staff demonstrate prejudice towards others, and materials present only
What Is the Difference Between “Good” and “Excellent”? Sample Items on Informal Use of Language (from the Language-Reasoning Scale)
To Receive a Score of “5: Good,” a Classroom Must Pass: 5.1 Many staff-child conversations during free play and routines. 5.2 Language is primarily used by staff to exchange information with children and for social
interaction. 5.3 Staff add information to expand on ideas presented by children. 5.4 Staff encourage communication among children (e.g. remind children to listen to each other) To Receive a Score of “7: Excellent,” a Classroom Must Pass: 7.1 Staff have individual conversations with most of the children 7.2 Children are asked questions to encourage them to give longer and more complex answers
(younger children are asked “what” or “where” questions; older children are asked “why” or “how” questions)
Act
iviti
es
Lang
uage
-Rea
soni
ng B
ench
mar
ks

Massachusetts Cost/Quality Study: Preschool Classrooms
11
stereotypes. A classroom is rated as meeting Minimal standards if some of each of the following types of materials are available: small building toys, such as Lincoln logs or Legos, art materials, such as crayons and scissors, manipulatives, such as beads for stringing, and puzzles, as well as some simple musical instruments, sand toys, blocks, dramatic play materials, nature/science materials, math/number materials, and materials showing diversity in a positive way. In addition, to meet Minimal standards, a classroom must also include the following activities: art activities with some individual expression allowed (not just teacher-directed products); staff initiate at least one music activity daily, and some movement/dance at least weekly; children encouraged to bring in natural things to share or add to collections (e.g., fall leaves from playground); TV/video is limited to one hour daily in full-day programs, computer turns are limited to 20-minutes daily; staff intervene appropriately to counteract prejudice shown by children or other adults (for example, by discussing similarities and differences, establishing rules for fair treatment of others). To receive a Good rating, a classroom must provide more of the above materials, and a greater variety of each type of material, and the materials must be organized in such a way as to facilitate children’s creative use of the materials. In addition, a classroom with a Good rating uses everyday events as the basis of learning, for example, talking about the weather, discussing the change of the seasons, counting while climbing the steps. To receive an Excellent rating on Activities, a classroom must meet all the above standards, plus: rotate materials regularly to maintain interest; store materials on open, labeled shelves so that children can take initiative in play; provide more elaborate or extended activities (for example, 3-D sculpture, projects that last several days; block play outdoors, bubbles in the water table, rice instead of sand, counting and recording the number of birds at the bird feeder); integrate activities across domains (for example, children making music instruments; paints available in fall colors when learning about seasons; dramatic play props linked to field trips or guests; books, computers and videos used to add information and extend children’s hands-on experiences); include diversity as part of daily routines and activities (for example, foods from different cultures as regular part of meals, music from different cultures, parents encouraged to share family customs with children). Interactions. A classroom is rated as Inadequate on the Interaction scale if: supervision of children is inadequate to keep children safe; most supervision is punitive (for example, yelling, belittling children); children are disciplined severely (spanking, withholding food) or discipline is so lax that there is little order; expectations for behavior are largely inappropriate for the children’s age and developmental level; staff ignore the children, staff-child interactions In
tera
ctio
ns
Act
iviti
es B
ench
mar
ks

12
are unpleasant; interactions among children are not encouraged, little or no staff guidance in how to get along with other children, few positive interactions among children - teasing, bickering, and fighting are common. A classroom that meets Minimal standards for Interactions is one in which supervision is adequate to protect children’s health and safety; there are some positive interactions between staff and children and staff usually respond to children in a warm, supportive manner; most supervision and discipline is not harsh and expectations for children’s behavior are largely appropriate for the age and developmental level of the children; children are encouraged to interact positively, and staff interrupt negative or hurtful behaviors (name-calling, fighting).
A classroom that receives a Good rating is one in which: classroom staff act preventively, to remove unsafe equipment or defuse potentially dangerous situations; most staff-child interactions are positive; supervision is adjusted appropriately for age and abilities (e.g., younger or more impulsive children are supervised more closely); staff give children help and encouragement when needed; staff are aware of the whole group, even when working with one child or a small group; staff use non-punitive discipline measures effectively (giving attention for positive behaviors, redirecting children from unacceptable to acceptable activities); the classroom environment is set up to reduce conflict among children (enough toys, travel paths do not lead through activity areas); staff react consistently to children’s behavior (basic rules followed with all children); staff show warmth and respect for children, respond sympathetically to an upset child; staff model good social skills and help children develop appropriate social behavior (help children talk through conflicts instead of fighting, help children understand the feelings of others).
What Is the Difference Between “Good” and “Excellent”? Sample Items on Discipline (from the Interactions Scale)
To Receive a Score of “5: Good,” a Classroom Must Pass: 5.1 Staff use non-punitive discipline methods effectively (Ex. Giving attention for positive
behaviors; redirecting children from unacceptable to acceptable activity). 5.2 Program is set up to avoid conflict and promote age-appropriate interaction (Ex. Duplicate
toys accessible, child with favorite toy given protected place to play). 5.3 Staff react consistently to children’s behavior (Ex. Different staff apply same rules and use
same methods; basic rules followed with all children). To Receive a Score of “7: Excellent,” a Classroom Must Pass: 7.1 Staff actively involve children in solving their conflicts and problems (Ex. Help children
talk out problems and think of solutions; sensitize children to feelings of others). 7.2 Staff use activities to help children understand social skills (Ex. Use storybooks and group
discussions with children to work through common conflicts).
Inte
ract
ions
In
tera
ctio
ns B
ench
mar
ks

Massachusetts Cost/Quality Study: Preschool Classrooms
13
To receive an Excellent rating, classrooms must meet all of the above standards, plus: staff engage the children to elaborate their play (talking about what they’re doing, helping to set up play areas); staff maintain a balance between the child’s need to explore independently and staff input into learning; when problems arise, staff involve the children in solving their conflicts (e.g., help children think of solutions), use activities such as storybooks to help children understand social skills, and seek advice from other professionals about behavior problems; staff seem to enjoy the children and encourage the development of mutual respect between children and adults (for example, staff wait until children finish asking questions before answering, encourage children in a polite way to listen when adults speak); children usually get along with each other, and staff encourage the development of these skills through group activities (e.g., painting a mural together, making soup with many ingredients). Program Structure. A classroom is rated as Inadequate on the Program Structure scale if: the schedule is either too rigid, with little time for individual interests or free play, or too chaotic, with little predictable sequencing of daily events or much of the day spent in unsupervised free play; children are kept in a group all day, with all children doing the same activity at the same time throughout the day; staff are not aware of children’s special needs and no attempt is made to meet children’s special needs or to involve children with disabilities with the rest of the group. A classroom that meets Minimal standards in this area has a basic schedule that is familiar to the children; includes some outdoor and some indoor time each day, weather permitting, as well as some quiet play and some active play each day; some activities are done in small groups or individually; staff have information about children’s special needs and make minor modifications to include such children; some effort is made to involve parents in setting goals and to involve children with disabilities in the ongoing activities of other children. A classroom that meets Good standards is one in which the daily schedule provides a balance of structure and flexibility, with a variety of activities each day, including some that are child initiated; children do not spend long periods of time waiting between daily events; free play occurs for a substantial portion of the day, with appropriate staff involvement to facilitate children’s play; whole group gatherings are limited to short periods, suited to the age and needs of the children, with many activities done in small groups or individually; staff make modifications to the program so that children with special needs can participate, follow through on the recommendations of other professionals, and keep parents involved in sharing information and setting goals. To receive an Excellent rating, a classroom must meet the above standards, plus: staff act to make transitions in the schedule smooth (have materials for
Prog
ram
Str
uctu
re B
ench
mar
ks
Inte
ract
ions
Ben
chm
arks

14
next activity ready before current activity ends; help a few children at a time wash up for lunch, rather than the whole group at once); the schedule is flexible to respond to individual children’s needs (e.g., a shorter story time for a child with a short attention span); staff use their involvement in free play as an educational interaction (e.g., help children think through solutions to problems in play); different groupings of children used throughout the day, and staff engage in educational interaction with small groups and individual children as well as with large groups; children with special needs are integrated into the larger group in most activities.
Parents and Staff. A classroom is rated as Inadequate on the Parents and Staff scale if: no written information about the program is given to parents and parents are discouraged from observing or being involved in their child’s program; there are no separate areas for staff and no staff breaks; staff do not have access to a phone, storage space for materials, or separate space for individual conferences when children are in attendance; staff do not communicate with each other about children’s needs, or spend time socializing with each other instead of looking after the children, or do not share duties fairly with other staff; there is no supervision or feedback provided to staff; and no in-service training or staff meetings. To meet Minimal standards, programs must: provide written information about the program to parents, share child-related information between parents and staff, allow some involvement of parents and family in program, and interactions between family members and staff are generally respectful and positive; make provisions for the personal needs of staff (e.g., separate adult restrooms, at least one staff break per day) and for the professional needs of staff (access to a phone, storage space, individual conference space); provide a means for staff to share basic information about children’s needs (e.g., food allergies); some staff supervision is provided, provide orientation for new staff and some in-service training, and hold some staff meetings to handle administrative concerns. In addition, staff interactions must not interfere with caregiving responsibilities and staff duties must be shared fairly. A program that receives a Good rating on Parents and Staff is one in which parents are encouraged to observe before enrolling their child, and are provided with information about the philosophy and approaches of the program; there is much sharing of child-related information between parents and staff, and parent involvement is encouraged in a variety of ways; there is a separate staff lounge (may have dual use as administrative space); three staff breaks are allowed in an 8-hour day; there is on-site, separate administrative office space and satisfactory space for conferences; staff communicate effectively and supportively with each other; an annual supervisory observation and written evaluation is conducted, noting strengths as well as areas for improvement; regular in-service training is provided; monthly staff meetings are held that include staff development activities; some professional resource materials are
Pare
nts
and
Staf
f Ben
chm
arks
Pr
ogra
m

Massachusetts Cost/Quality Study: Preschool Classrooms
15
available on-site. To receive an Excellent rating, a program must: ask parents for an evaluation of the program annually, involve parents in decision-making roles in the program along with staff; provide a separate staff lounge and some flexibility in scheduling staff breaks; have well-equipped office space for program administration and separate conference and group meeting space; provide planning time for staff working in the same classroom at least every other week; provide clear guidelines for individual staff responsibilities and promote positive interactions among staff members; involve staff in self-evaluation and offer frequent observations and feedback on staff performance, in a helpful and supportive way; provide support for staff professional development and require staff with less than an A.A. degree in early childhood education to continue formal education.
Other Measures of Quality While the ECERS-R provides an excellent set of benchmarks for many aspects of quality, we also used additional measures that provide more specific information about caregiver behavior. These additional measures included:
• the Global Caregiving Rating Scale (Arnett, 1989), a 26-item scale that measures caregiver involvement and teaching style with children;
• the Teacher Involvement Scale (Howes & Stewart, 1987), a time-sample measure of the specific kinds of interaction that occur between a provider and a child, from ignoring to simple contact to intense contact; and
• the ORCE Qualitative Ratings (NICHD Early Child Care Research Network, 1996), ratings of caregiver behavior including Sensitivity/Responsiveness to Non-distressed Communication; Detachment; Intrusiveness; Stimulation of Cognitive Development; Positive Regard for the Child; Negative Regard for the Child; Flat Affect; and Sensitivity to Distress.
As a measure of the inter-rater reliability of these observations, we calculated the proportion of the items on which a pair of observers, observing the same classroom, agreed exactly on the ratings. On average (across all possible pairs of observers), a pair of observers agreed exactly on 71% of the Global Caregiving Rating Scale items, 79% of the Teacher Involvement Scale items, and 81% of the ORCE Qualitative Ratings. The percent agreement within one point was 87%, 86% and 92% respectively.
The Process Quality Index
To allow the results of the Massachusetts study to be compared to the results of the original Cost, Quality and Child Outcomes Study, we created a general Process Quality Index, comparable to the Process Quality Index created in the original Cost, Quality, and Child Outcomes Study. This composite is derived from subscales of the ECERS-R,
Pare
nts
& S
taff
16
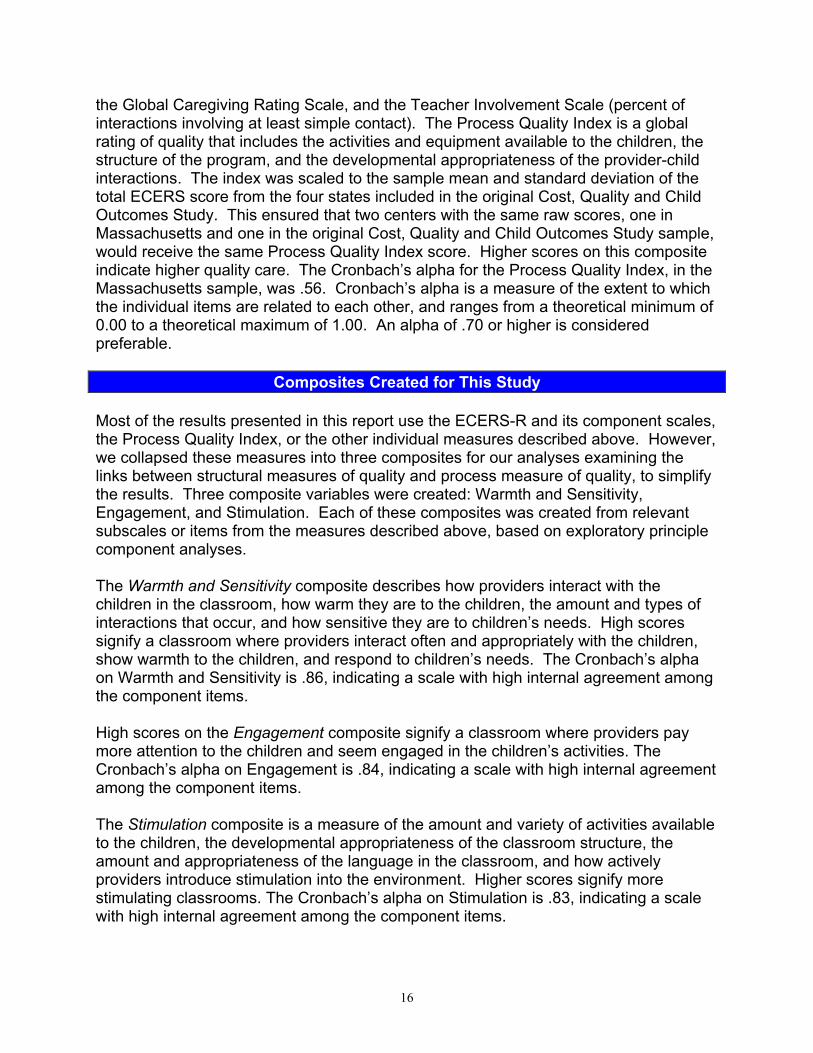
the Global Caregiving Rating Scale, and the Teacher Involvement Scale (percent of interactions involving at least simple contact). The Process Quality Index is a global rating of quality that includes the activities and equipment available to the children, the structure of the program, and the developmental appropriateness of the provider-child interactions. The index was scaled to the sample mean and standard deviation of the total ECERS score from the four states included in the original Cost, Quality and Child Outcomes Study. This ensured that two centers with the same raw scores, one in Massachusetts and one in the original Cost, Quality and Child Outcomes Study sample, would receive the same Process Quality Index score. Higher scores on this composite indicate higher quality care. The Cronbach’s alpha for the Process Quality Index, in the Massachusetts sample, was .56. Cronbach’s alpha is a measure of the extent to which the individual items are related to each other, and ranges from a theoretical minimum of 0.00 to a theoretical maximum of 1.00. An alpha of .70 or higher is considered preferable.
Composites Created for This Study Most of the results presented in this report use the ECERS-R and its component scales, the Process Quality Index, or the other individual measures described above. However, we collapsed these measures into three composites for our analyses examining the links between structural measures of quality and process measure of quality, to simplify the results. Three composite variables were created: Warmth and Sensitivity, Engagement, and Stimulation. Each of these composites was created from relevant subscales or items from the measures described above, based on exploratory principle component analyses. The Warmth and Sensitivity composite describes how providers interact with the children in the classroom, how warm they are to the children, the amount and types of interactions that occur, and how sensitive they are to children’s needs. High scores signify a classroom where providers interact often and appropriately with the children, show warmth to the children, and respond to children’s needs. The Cronbach’s alpha on Warmth and Sensitivity is .86, indicating a scale with high internal agreement among the component items. High scores on the Engagement composite signify a classroom where providers pay more attention to the children and seem engaged in the children’s activities. The Cronbach’s alpha on Engagement is .84, indicating a scale with high internal agreement among the component items. The Stimulation composite is a measure of the amount and variety of activities available to the children, the developmental appropriateness of the classroom structure, the amount and appropriateness of the language in the classroom, and how actively providers introduce stimulation into the environment. Higher scores signify more stimulating classrooms. The Cronbach’s alpha on Stimulation is .83, indicating a scale with high internal agreement among the component items.

Massachusetts Cost/Quality Study: Preschool Classrooms
17
The Quality of Massachusetts Early Care and Education in Preschool Classrooms
Structural Characteristics of Quality
The most commonly reported measures of the structural characteristics of quality are child:staff ratio, group size and teacher education and training. All of these characteristics can be and are regulated by the state. There are age-related guidelines for maximum group size and child:staff ratio as well as minimum educational requirements for early childhood teachers. The Massachusetts child care licensing regulations require that for full day care for preschool-aged children, group sizes must be no greater than 20 children, and the minimum allowable ratio is one teacher for every 10 children. The state regulations allow for different levels of teacher education and experience, but for preschool-aged children, at least one staff person in the room must be Preschool Teacher qualified. That is, the person must have a high school diploma or equivalent and have some minimal training in child development or early childhood education (three credits in child development coursework and a practicum; Child Development Associate credential; or graduate of a two-year vocational program in early childhood education). For assistant teachers, the minimum education requirement is also a high school diploma or equivalent, but no specialized training in child development or early childhood education is required. Assistant teachers must work at all times under the supervision of a teacher (2000, Massachusetts Office of Child Care Services, Regulations for Group Day Care). Child: Staff Ratios. The average observed child:staff ratio over the course of the observation time for the classrooms in our sample was just under seven children to every staff member (minimum: 3:1; maximum: 15:1). The average observed child:staff ration is well below the state licensing regulations that allow no more than ten preschool-aged children to every staff member in full-day centers. However, observed child:staff ratios tend to be lower than the maximum capacity ratios used for licensing, because of variations in children’s attendance from day to day, throughout any given day, and even minute-to-minute during an observation. In addition, observations were conducted over the course of a morning, continuing through lunch time. This is typically the busiest time of day in child care centers and is the time when there is likely to be the largest number of staff present. Had the observations been conducted very early in the morning or late in the afternoons, it is possible that there would have been a larger average observed ratio. Finally, other studies often report observed ratios that are lower than state minimums, for the reasons noted above (see for example the Cost, Quality, and Child Outcomes Study, 1995, described in the next section of this report). Group Size. When average group size was examined, once again we found that the classrooms in our sample had smaller group sizes than required by state regulations. While state regulations require a maximum group size of 20 for preschool-aged children in full time care, the average group size in the current study was about 12 children (mean = 12.18, std = 3.91). One percent of the classrooms had an average group size that was greater than 20. Again, observed group size is different from licensed

18
capacity, because of children’s absences for illness, children’s temporary absence from the classroom for toileting or activities outside of the classroom, and under-enrollment. Staff Education. In addition to child:staff ratios and group size, we also examined classroom staff education and training levels. During the interview, center directors categorized all center staff based on their responsibilities. We provided specific definitions for each classification, however, we did not specify that directors classify staff according to OCCS regulations. Rather, we asked them to classify staff according to what their job responsibilities entailed. Thus, a staff person identified as an assistant teacher here may not meet the exact requirements as outlined by OCCS. Fifty-seven percent of all center staff in our sample were classified by the directors as teachers; these were staff who had primary responsibility for the children in their classroom, whether alone or with another teacher. Assistant teachers, who comprised 21% of all staff, were defined as staff who work under the supervision of a teacher and do not have primary responsibility for a classroom. The smallest category is teacher-director. These are classroom staff who have both teaching and administrative responsibilities on a regular basis. Teacher-directors comprised just over 2% of all staff in the sample. The other 20% of center staff are primarily administrative personnel, as well as floaters, other professionals, and other center staff. As shown in Figure 2, just under half of the teachers in the sample reported that a high school diploma or GED was the highest level of education completed, the minimum required by state regulations (regulations also require some college-level training in early child care and education; this question did not ask specifically about training - we will address training in the following section). Twenty percent of teachers have a two-year Associates degree, and over 30% have a four-year college degree or higher. The majority of assistant teachers reported that a high school diploma or GED was the highest level of education completed. According to OCCS regulations, both teachers and assistant teachers are required to have a high school diploma or its equivalent, although assistant teachers are not required to have college-level courses in early child
Figure 2: Years of Education by Job Title
18.36
0.59
62.05
44.41
9.2
7.3
19.59
30.54
11.01
32.88
52.93
0 15 30 45 60
AssistantTeachers
Teachers
Teacher-Directors
Percent of Staff
Less than HS HS/some CollegeA.A. 4 yr degree +
Massachusetts Cost/Quality Study: Preschool Classrooms
19
care and education. As Figure 2 shows, 18% of staff described by directors as “assistant teachers” had less than a high school education; however, some of the assistant teachers in this sample may not have been OCCS-qualified assistant teachers. Still, this suggests that a significant proportion of classroom staff have not finished high school. Process Characteristics of Quality
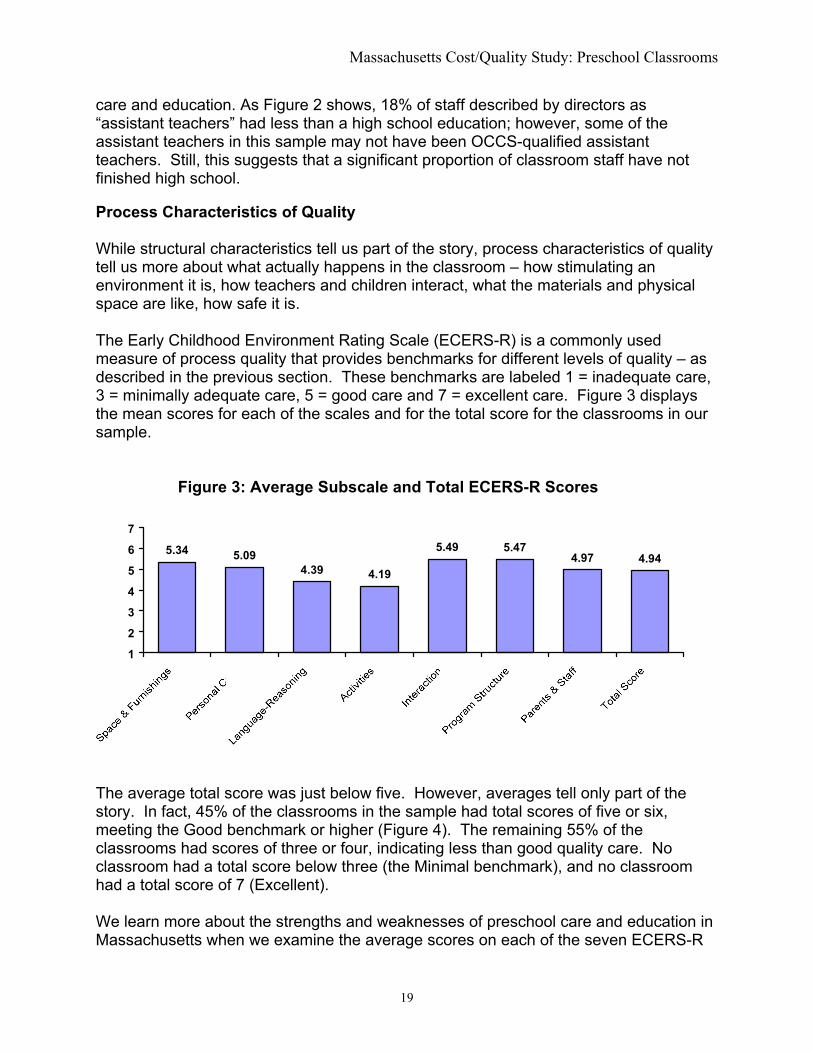
While structural characteristics tell us part of the story, process characteristics of quality tell us more about what actually happens in the classroom – how stimulating an environment it is, how teachers and children interact, what the materials and physical space are like, how safe it is. The Early Childhood Environment Rating Scale (ECERS-R) is a commonly used measure of process quality that provides benchmarks for different levels of quality – as described in the previous section. These benchmarks are labeled 1 = inadequate care, 3 = minimally adequate care, 5 = good care and 7 = excellent care. Figure 3 displays the mean scores for each of the scales and for the total score for the classrooms in our sample.
The average total score was just below five. However, averages tell only part of the story. In fact, 45% of the classrooms in the sample had total scores of five or six, meeting the Good benchmark or higher (Figure 4). The remaining 55% of the classrooms had scores of three or four, indicating less than good quality care. No classroom had a total score below three (the Minimal benchmark), and no classroom had a total score of 7 (Excellent). We learn more about the strengths and weaknesses of preschool care and education in Massachusetts when we examine the average scores on each of the seven ECERS-R
Figure 3: Average Subscale and Total ECERS-R Scores
5.34 5.094.39 4.19
5.49 5.474.97 4.94
1
2
34
5
6
7
20
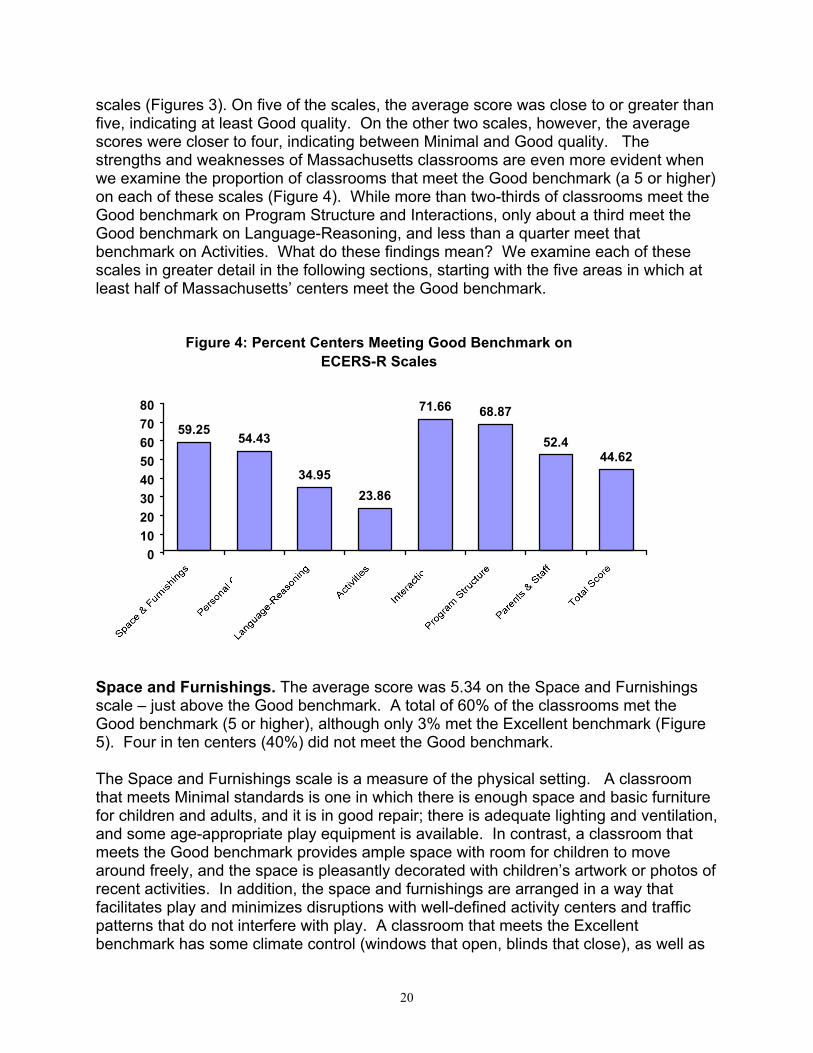
scales (Figures 3). On five of the scales, the average score was close to or greater than five, indicating at least Good quality. On the other two scales, however, the average scores were closer to four, indicating between Minimal and Good quality. The strengths and weaknesses of Massachusetts classrooms are even more evident when we examine the proportion of classrooms that meet the Good benchmark (a 5 or higher) on each of these scales (Figure 4). While more than two-thirds of classrooms meet the Good benchmark on Program Structure and Interactions, only about a third meet the Good benchmark on Language-Reasoning, and less than a quarter meet that benchmark on Activities. What do these findings mean? We examine each of these scales in greater detail in the following sections, starting with the five areas in which at least half of Massachusetts’ centers meet the Good benchmark.
Space and Furnishings. The average score was 5.34 on the Space and Furnishings scale – just above the Good benchmark. A total of 60% of the classrooms met the Good benchmark (5 or higher), although only 3% met the Excellent benchmark (Figure 5). Four in ten centers (40%) did not meet the Good benchmark.
The Space and Furnishings scale is a measure of the physical setting. A classroom that meets Minimal standards is one in which there is enough space and basic furniture for children and adults, and it is in good repair; there is adequate lighting and ventilation, and some age-appropriate play equipment is available. In contrast, a classroom that meets the Good benchmark provides ample space with room for children to move around freely, and the space is pleasantly decorated with children’s artwork or photos of recent activities. In addition, the space and furnishings are arranged in a way that facilitates play and minimizes disruptions with well-defined activity centers and traffic patterns that do not interfere with play. A classroom that meets the Excellent benchmark has some climate control (windows that open, blinds that close), as well as
Figure 4: Percent Centers Meeting Good Benchmark on ECERS-R Scales
59.25 54.43
34.9523.86
71.66 68.87
52.444.62
01020304050607080

Massachusetts Cost/Quality Study: Preschool Classrooms
21
special furnishings, such as art easels or a sand/water table, as well as quiet, cozy areas for children. In addition, the variety of furnishings in an Excellent classroom supports a range of learning experiences for the children, and furnishings are used in ways that foster children’s individuality (open shelves so that children can reach materials themselves; wall-displays of children’s individual art creations, rather than only copies of adult examples).
Figure 5: Percent of Centers Meeting Space & Furnishings Benchmarks
Good +57%
Minimal +39%
Inadequate1%
Excellent3%
Program Structure. The average score was 5.47 on the Program Structure scale – just above the Good benchmark. A total of 69% of the classrooms met the Good benchmark (a score of 5 or higher, with fully 18% meeting the Excellent benchmark (Figure 6). Almost one in five (24%) of the centers met the Minimal standards benchmark but did not meet the Good benchmark; while 7% failed to meet even Minimal standards.
Figure 6: Percent of Centers Meeting Program Structure Benchmarks
Good +51%
Minimal +24%
Inadequate7%
Excellent18%
The Program Structure scale is a measure of the predictability and variability of the structure of daily activities. A classroom that meets Minimal standards, has a basic schedule that is familiar to the children, and includes some variety of activities throughout the day, including some time in small groups or in individual activities. In contrast, a classroom that meets the Good benchmark balances structure and flexibility in the daily schedule, with more time spent in small groups or individual activities, including some activities that are child-initiated. Staff are involved in children’s play appropriately, and make modifications as needed so that children with special needs can participate. A classroom that meets the Excellent benchmark is flexible enough to respond to individual children’s needs, and structured in ways that reduce the time that

22
children wait between activities. In addition, different types of activities, including free play, individual and small group times, as well as whole group times, are used to further children’s learning and development.
Personal Care Routines. The average score was 5.09 on the Personal Care Routines scale – just above the Good benchmark. Fifty-four percent scored between Good and Excellent, with 3.27% meeting the Excellent benchmark (Figure 7). Forty-six percent met the Minimal standards benchmark.
Figure 7: Percent of Centers Meeting Personal Care Routines Benchmarks
Good +51%
Minimal +46%
Inadequate0%
Excellent3%
The Personal Care Routines scale is a measure of the quality of care routines for meals, naps, toileting and diapering, and separations and reunions with parents or guardians at drop-off and pick-up. A classroom that meets Minimal standards is one in which most children are greeted warmly on arrival and their departure is well-organized, and children’s personal care needs are attended to in a non-punitive manner, and at scheduled times that meet the needs of most or all of the children.
A classroom that meets the Good benchmark goes beyond this. Staff greet children individually by name, welcome parents in the classroom and greet them warmly, and have pleasant departure routines. Personal care routines are designed not just to meet basic needs, but to allow pleasant social interactions between staff and children, and
More than two-thirds of the classrooms received a score of 5 or better, on the Program Schedule scale of the ECERS-R. The majority of Massachusetts’ preschool classrooms appear to be doing a good job of providing a varied and flexible structure to the day.
Almost half of the classrooms did not meet the Good benchmark on Personal Care Routines. While these classrooms met minimal standards of tending to meals, naps, and toileting in a non-punitive manner and in a way that met the needs of most of the children, classrooms that met the Good benchmark used meals, naptimes and other personal care routines as an opportunity for pleasant social interactions between staff and children, and among the children.

Massachusetts Cost/Quality Study: Preschool Classrooms
23
among the children. At mealtimes, most staff sit with the children, and children are encouraged to eat independently with child-appropriate utensils. At nap times, staff help children to relax, with soft music, cuddly toys or back rubs, and the nap space is quiet and arranged in a way that helps children to rest. Staff also model good health practices around personal care routines (washing hands, wiping noses, covering mouth when coughing). In a classroom that meets the Excellent benchmark, staff help children to get involved in activities when they first arrive, if needed, and use drop-off and pick-up times as an opportunity to share information with parents and guardians. Personal care routines are used as an opportunity to develop children’s social skills and for conversation about things of interest to the children. Personal care routines are also individualized: the nap schedule is flexible enough to meet individual children’s needs with provisions for early risers or non-nappers; serving pitchers at meal-times are child-size so that children can serve themselves, bathrooms have child-sized toilets and low sinks so that children can develop autonomy in toileting. Parents and Staff. The average score was 4.97 on the Parents and Staff scale – just below the Good benchmark. A total of 53% scored between Good and Excellent, with 2% meeting the Excellent benchmark (Figure 8). Forty-one percent met the Minimal standards benchmark; while 6% failed to meet Minimal standards.
Figure 8: Percent of Centers Meeting Parents & Staff Benchmarks
Good +51%
Minimal +41%
Inadequate6%
Excellent2%
The Parents and Staff scale is a measure of the quality of communication between staff and parents, of the working environment for staff, and of professional development support for staff. A program that meets Minimal standards is one in which programs provide written information about the program to parents, share child-related information between parents and staff, and one in which interactions between parents and staff are generally respectful and positive. The Minimal work environment is one in which staff have a separate adult bathroom, and at least one break per 8-hour work day, with access to a telephone, storage space, and individual conference space. Staff also receive some staff supervision and in-service training, and attend some staff meetings to handle administrative concerns.

24
A classroom that meets the Good benchmark is one in which there is more extensive involvement of parents/guardians, including the sharing of information about the philosophy and approaches of the program. In addition, staff communicate effectively and supportively with each other, with monthly staff meetings that include staff development activities. Staff have a staff lounge area (which may be shared with administrative space) and three breaks in an 8-hour day, plus an annual supervisory observation and written evaluation, as well as regular in-service training. To receive an Excellent rating, a program would involve parents in decision-making roles in the program along with staff, and annually ask parents to evaluate the program. The program would also provide staff with clear guidelines for their individual responsibilities, involve staff in self-evaluation and offer frequent observations and feedback to staff, and provide separate administrative space, as well as conference and group meeting space. Finally, a program with an Excellent rating would provide support for staff professional development and require that staff with less than an A.A. degree in early childhood education continue their formal education. Interactions. The average score was 5.49 on the Interactions scale – just above the Good benchmark. A total of 72% met the Good benchmark (a score of 5 or higher), but only 4% met the Excellent benchmark (Figure 9). Almost one in five (24%) of the centers met the Minimal standards benchmark for Interactions, but did not meet the Good benchmark; 4% failed to meet even Minimal standards.
Figure 9: Percent of Centers Meeting Interactions Benchmarks
Good +68%
Minimal +24%
Inadequate4%
Excellent4%
The Interactions scale is a measure of the quality of interactions between staff and children, and among the children themselves. A classroom that meets Minimal standards is one in which staff supervision is adequate to keep the children safe, there are some positive interactions between staff and children, without the use of harsh discipline styles, and children are encouraged to interact with each other in a positive manner.
More than two-thirds of the classrooms met the Good benchmark on the Interactions scale of the ECERS-R. Interactions in these classrooms were characterized by staff who modeled good social skills, showed warmth and respect for the children, and used such non-punitive discipline methods as redirecting children from unacceptable to acceptable behaviors.
Massachusetts Cost/Quality Study: Preschool Classrooms
25
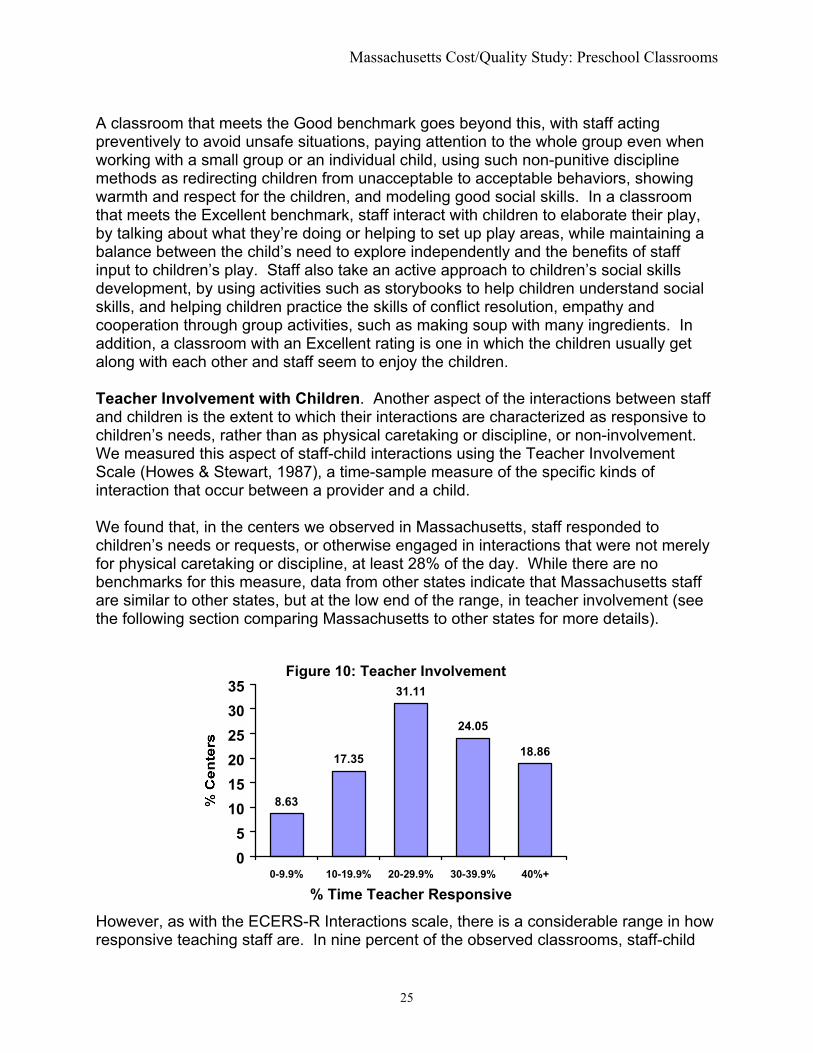
A classroom that meets the Good benchmark goes beyond this, with staff acting preventively to avoid unsafe situations, paying attention to the whole group even when working with a small group or an individual child, using such non-punitive discipline methods as redirecting children from unacceptable to acceptable behaviors, showing warmth and respect for the children, and modeling good social skills. In a classroom that meets the Excellent benchmark, staff interact with children to elaborate their play, by talking about what they’re doing or helping to set up play areas, while maintaining a balance between the child’s need to explore independently and the benefits of staff input to children’s play. Staff also take an active approach to children’s social skills development, by using activities such as storybooks to help children understand social skills, and helping children practice the skills of conflict resolution, empathy and cooperation through group activities, such as making soup with many ingredients. In addition, a classroom with an Excellent rating is one in which the children usually get along with each other and staff seem to enjoy the children. Teacher Involvement with Children. Another aspect of the interactions between staff and children is the extent to which their interactions are characterized as responsive to children’s needs, rather than as physical caretaking or discipline, or non-involvement. We measured this aspect of staff-child interactions using the Teacher Involvement Scale (Howes & Stewart, 1987), a time-sample measure of the specific kinds of interaction that occur between a provider and a child. We found that, in the centers we observed in Massachusetts, staff responded to children’s needs or requests, or otherwise engaged in interactions that were not merely for physical caretaking or discipline, at least 28% of the day. While there are no benchmarks for this measure, data from other states indicate that Massachusetts staff are similar to other states, but at the low end of the range, in teacher involvement (see the following section comparing Massachusetts to other states for more details).
However, as with the ECERS-R Interactions scale, there is a considerable range in how responsive teaching staff are. In nine percent of the observed classrooms, staff-child
Figure 10: Teacher Involvement
8.63
17.35
31.11
24.05
18.86
05
101520253035
0-9.9% 10-19.9% 20-29.9% 30-39.9% 40%+
% Time Teacher Responsive

26
interactions were primarily for routine care or discipline – responsive interactions were observed during less than 10% of the day (Figure 10). In another 17% of classrooms, responsive interactions were observed during 10% to 20% of the day. At the other end of the scale, 19% of classroom teachers were responsive at least 40% of the day.
Language-Reasoning. The average score was 4.39 on the Language-Reasoning scale of the ECERS-R – between Minimal and Good. Only 35% of the classrooms in the sample were rated as Good quality or better on Language-Reasoning (Figure 11). In addition, 8% of classrooms did not even meet Minimal standards.
Figure 11: Percent of Centers Meeting Language-Reasoning Benchmarks
Minimal +57%
Good +31%
Inadequate8%
Excellent4%
The Language-Reasoning scale is a measure of the books available for the children, how those books are used, and the communication and language skills that are used and encouraged in the setting. A score below five (Good) on this scale indicates a classroom that does not have a wide variety of books and other language materials available to the children for a large portion of the day and where staff do not frequently encourage communication and reasoning skills. For example, a classroom that meets Minimal standards on the Books and Pictures item of this scale has some books available for the children and at least one daily staff-initiated receptive language activity such as storytelling.
On the other hand, to meet the Good benchmark, a classroom must have other language materials such as flannel boards or picture card games available, the books and other language materials must be developmentally appropriate, and staff must read to children informally rather than only at scheduled times. Thus, for a rating of Good, there are not only more materials required but also the staff must integrate language and reasoning skills into all areas of the program. To receive an Excellent rating, classroom staff must also link children’s spoken communication with written language (for example, by writing down what children tell them about their paintings), and encourage children to reason throughout the day, using actual events and experiences,
Almost two-thirds of the classrooms did not meet the Good benchmark on the Language-Reasoning scale of the ECERS-R. These classrooms did not have a wide variety of developmentally-appropriate books and other language materials available to the children for a large portion of the day and classroom staff did not regularly encourage communication and reasoning skills.

Massachusetts Cost/Quality Study: Preschool Classrooms
27
and questions that encourage children to give more complex answers (e.g., younger children are asked “what” and “where” questions, older children are asked “why” and “how” questions). Activities. The average score on the Activities scale was just over a four (4.19) – Minimal to Good quality. Only 25% of the classrooms had a score of Good or better, and 69% were rated as Minimal or between Minimal and Good (Figure 12). Seven percent were rated as Inadequate.
The Activities scale is a measure of the types and variety of materials and activities available for the children such as fine motor materials, art, music, sand & water play, and dramatic play. A score below five (i.e., not meeting the Good benchmark) indicates a classroom that is lacking in many of these activities and materials. A classroom rated as Good provides a greater range of materials and activities, and uses everyday events as the basis for learning, for example, talking about the change of seasons, counting while climbing the steps. None of the classrooms in this sample met the Excellent benchmark – to do so, they would have needed to provide more opportunities for elaborate or extended activities, and would have integrated activities across domains (for example, making musical instruments as an art project, having paints available in fall colors when talking about the seasons, including props in the dramatic play area that are linked to field trips or guests). In addition, to meet the Excellent benchmark , classrooms must include diversity as part of daily routines and activities.
Figure 12: Percent of Centers Meeting Activities Benchmarks
Minimal +68%
Good +25%
Inadequate7%
Excellent0%

28
Figure 14: State Comparisons on the ECERS
2
3
4
5
6
7
Figure 13: State Comparison of Average Observed Child:Staff
Ratios
6.74 7.095.7 5.4
7.48
2.53.54.55.56.57.58.5
Massachusetts Compared to Other States
To place these findings in context, we compared this study of Massachusetts to two other studies done on larger samples in multiple states.
The Cost, Quality and Outcomes Study
The Cost, Quality and Outcomes Study (Helburn 1995) included full-day, full-year centers in four states: California, Colorado, Connecticut and North Carolina. The Massachusetts Cost and Quality Study used many of the same measures so that we would be able to compare the quality of early care and education for preschool-age children in Massachusetts to the quality of early care and education in these four states. We compared one structural measure of quality, child: staff ratio, to the four states in the Cost, Quality and Outcomes Study (Helburn 1995). As shown in Figure 13, the average observed ratio for these centers is comparable to the ratios found in the four states in the original Cost, Quality, and Child Outcomes Study. While lower ratios were found in centers in Colorado and Connecticut, slightly higher ratios (more children per adult) were found in both California and North Carolina.
The average ECERS-R total score for the Massachusetts sample is higher than the total ECERS score for any of the states in the original Cost, Quality, and Child Outcomes Study. As shown in Figure 14, the average rating for the Massachusetts centers was 4.94 compared to average scores ranging from 3.82 to 4.49 for the four states in the original study. Figure 14 also shows the range within each state on the ECERS scores. The bottom point of each line is one standard deviation (SD) below the mean score, and the top point of each line is one standard

Massachusetts Cost/Quality Study: Preschool Classrooms
29
deviation above the mean score. In the Massachusetts sample, 63% of the centers scored within one standard deviation of the mean. Figure 14 provides a picture of the overlap in ECERS scores across the states. While Massachusetts’ average score is higher than the average scores of other states, there are centers in Massachusetts that received lower scores than some of the centers in other states; and some Massachusetts’ centers scored higher than the highest-scoring centers in other states. As described earlier, we created a Process Quality Index that is a composite of multiple measures of process characteristics of quality and is comparable to the index created in the Cost, Quality, and Child Outcomes Study. As seen in Figure 15, the average index score for the centers in Massachusetts was 4.56. This is higher than the scores in any of the states in the earlier study whose scores ranged from 3.66 to 4.34 (Helburn 1995). Teacher-Involvement. To further understand the environment that the children experienced in the classrooms, one of our observation measures, the Teacher-Involvement Scale, assessed the details of teacher-child interactions. We calculated the percentage of interactions that were rated as responsive -- that is, how often did the staff person respond to a child’s needs or requests, initiate conversation or interaction,
or engage in more intense, elaborate positive interaction during the course of the observations. Alternatively, a staff person was not within three feet of any child, or, if near a child, ignored that child, engaged only in routine caregiving with no attempts to engage the child, or engaged only in minimally directive interactions. In the Massachusetts sample, we found that 28% of the time, staff responded to children’s needs or requests or otherwise engaged in interactions that were not merely for physical caretaking or discipline (see Figure 16). Thirteen percent of interactions were either routine or minimal care, and 16% of the time the staff ignored a child who was within three feet of a staff member. The rest of the time,
Figure 15: State Comparisons of Average
Process Quality Index
4.56
4.2
3.86
4.34
3.66
1 3 5 7
Massachusetts
California
Colorado
Connecticut
North Carolina
Process Quality Index Score
Figure 16: State Comparisons of Teacher Involvement
28%
32%
25%
39%
30%
0% 10% 20% 30% 40% 50%
Massachusetts
California
Colorado
Connecticut
North Carolina
% Time Teacher Responsive

30
the child was not within three feet of staff and there were no interactions. Massachusetts teachers were slightly more responsive than teachers in Colorado, but less responsive than teachers in California, Connecticut and North Carolina. The NICHD Study of Early Child Care The NICHD Study of Early Child Care is a study of over 1300 children from ten locations, in nine different states: Eastern Massachusetts, Pennsylvania (two locations), Virginia, North Carolina, Arkansas, Kansas, Wisconsin, Washington, and California. The children have been followed from birth. When they were 36 months old, those children who were in non-maternal care were observed for two days in their child care setting. Over six hundred children were in center-based care. We used one set of rating scales from the NICHD Study of Early Child Care. This measure rates providers’ interactions with children on the following scales: sensitivity/ responsiveness to non-distress, intrusiveness, detachment/ disengagement, stimulation of development, positive regard for the children, negative regard for the children, and flatness of affect. For all scales, a score of 1 indicates that the behavior is not at all characteristic of the provider and a score of 4 indicates that the behavior is highly characteristic of the provider. Figure 17 displays the average ratings for the Massachusetts Cost and Quality sample as well as the average ratings for preschool classrooms in the NICHD study. For the Massachusetts centers, being sensitive to children and showing positive regard for them was ‘characteristic’ of the staff (scores of 3). Similarly, staff were not very intrusive or detached and did not show much negative regard for the children. While staff were somewhat stimulating of children’s development, they were not rated as highly on this scale. In comparison, ratings from the NICHD study indicate that teachers in those care situations showed less positive regard for the children, were less stimulating, more detached, and less sensitive to children’s needs. On the other hand, they also displayed less negative regard for the children and were less flat in their affect.
Figure 17: Comparison to NICHD SECC
1.32
1.21
3.14
2.56
1.37
1.33
3
1.17
1.06
2.06
1.69
1.84
1.3
2.23
1 2 3 4
Flatness of Affect
Negative Regard
Positive Regard
Stimulation
Detachment
Intrusiveness
Sensitivity to NonDistress
Qualitative Rating Score
NICHDMassachusetts

Massachusetts Cost/Quality Study: Preschool Classrooms
31
In general, staff in the Massachusetts sample were rated more positively than staff in the NICHD sample. This is in contrast to the ratings of teachers on the Teacher-Involvement Scale. The Teacher Involvement Scale measures frequency of responsiveness, while the NICHD measures assess the global quality of the involvement. It appears that while teachers in Massachusetts may respond less frequently, when they do respond, their responses are sensitive to the children’s needs, convey positive regard and provide age-appropriate stimulation.

32
Improving the Quality of Preschool Care and Education in Massachusetts
As we noted earlier, there are two main aspects of quality of care that we measured: structural and process. Many of the structural aspects of quality can be and are regulated by states. Process characteristics are not easily regulated but help us to understand the environments in which children spend their time, and are directly related to children’s development. To the extent that regulatable structural indicators of quality are related to process quality – to what happens in the classroom – regulations can improve children’s outcomes. To understand how such regulatables are related to process, we examined the relationship between several structural variables and our process measures: stimulation in the classroom, the teacher-child relationship, and our two overall measures -- the ECERS-R total score and the Process Quality Index. We used three structural variables that are most often subject to state regulations: • child:staff ratio; • group size; and • teaching staff education (measured as average years of education). Table 1 reports the estimates of the extent to which an increment in each of these structural variables is associated with an increment in the observed quality of preschool care and education in Massachusetts. Because the estimates are standardized, they can be compared to each other, both within each model, and across models. We will discuss each of these models in turn. The table also reports the significance level (p) of each estimate, that is, the probability that this estimate is not a valid estimate of the population of all full-day preschool classrooms in Massachusetts. For example, an estimate significant at the p < .05 level has five chances in 100 of not being valid. Put another way, that same estimate has 95 chances out of 100 of being a valid estimate of the population. In this report, we treat as significant those estimates that have at least 90 chances out of 100 of being valid (p < .10). The table also reports the R2 for each model (column); R2 indicates the proportion of the variation in the process quality measure that is explained by all of the listed regulatables combined. Table 1: Standardized Estimates of Relationships Between Regulatables and Process Quality Measures (N = 88) Stimulation Warmth &
Sensitivity Engagement ECERS-R Process
Quality Index Child:Staff Ratio -.23^ -.17 -.15 -.27 * -.24 ^ Group Size .14 .05 -.07 .17 .05 Teacher Educ. .31 ** .23 ^ .32 ** .26 * .26 * R2 .10 * .06 .10 * .10 * .08 * ^ = p < .10, * = p < .05, ** = p < .01

Massachusetts Cost/Quality Study: Preschool Classrooms
33
Regulatables and Stimulation. We examined the relationships between the structural variables and the quality of the stimulation provided in the classroom. The Stimulation composite is a measure of the amount and variety of activities available to the children, the developmental appropriateness of the classroom structure, the amount and appropriateness of the language in the classroom, and how actively classroom staff introduce stimulation into the environment. Higher scores signify more stimulating classrooms. As Table 1 shows, classrooms in centers with more highly educated teachers provided higher levels of age-appropriate stimulation. Centers in which the average staff education level was no greater than a high school diploma (with or without some college-level training) had an average Stimulation score of 4.69, while centers in which the average education level was at least a two year college degree had an average score of 5.29 (Figure 18). The Stimulation scores are comparable to ECERS-R scores, so that a score of 4.69 can be interpreted as slightly lower than the Good benchmark, while a score of 5.29 is slightly higher than the Good benchmark. In addition, when child:staff ratios were lower (fewer children per teaching staff member) the classroom environment was more likely to provide age-appropriate stimulation. However, after considering the role of teacher education and child:staff ratios, group size was not a significant predictor of the quality of the stimulation provided. However, this does not mean that group size is not important. Child:staff ratios and group size are linked, by definition, since child:staff ratio is calculated as group size divided by the number of teaching staff. Regulatables and the Teacher-Child Relationship. We also examined the relationships between regulatables and specific aspects of teachers’ interactions with children. The Warmth and Sensitivity composite describes how providers interact with the children in the classroom, how warm they are to the children, the amount and types of interactions that occur, and how sensitive they are to children’s needs. High scores signify a classroom where providers interact often and appropriately with the children, show warmth to the children, and respond to children’s needs. While teacher education was associated with teacher Warmth and Sensitivity at the p < .10 level, the overall model did not explain a significant portion of the variance in teacher’s behavior. Other factors would need to be included to understand why some classroom environments offer more warmth and sensitivity than others. We will return to this question in the section on training, below.
Figure 18: Average Stimulation Score by
Teacher Education Level
4.695.29
1234567
H.S.+ A.A. +
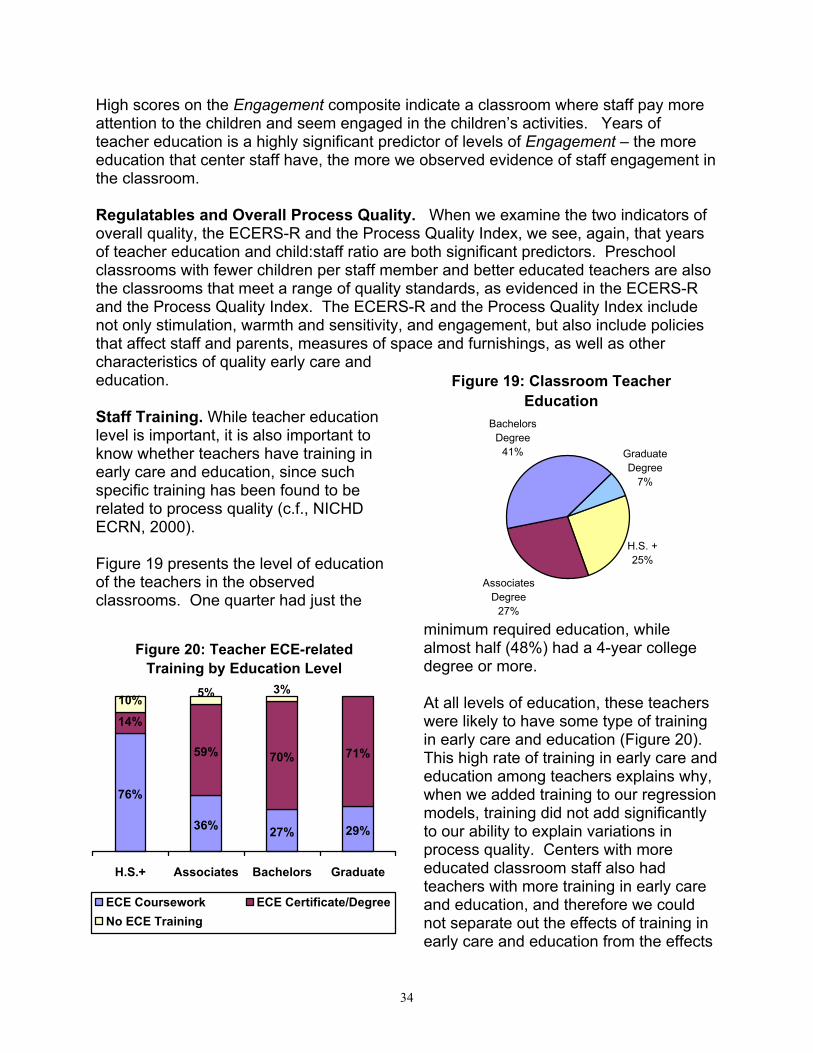
34
High scores on the Engagement composite indicate a classroom where staff pay more attention to the children and seem engaged in the children’s activities. Years of teacher education is a highly significant predictor of levels of Engagement – the more education that center staff have, the more we observed evidence of staff engagement in the classroom. Regulatables and Overall Process Quality. When we examine the two indicators of overall quality, the ECERS-R and the Process Quality Index, we see, again, that years of teacher education and child:staff ratio are both significant predictors. Preschool classrooms with fewer children per staff member and better educated teachers are also the classrooms that meet a range of quality standards, as evidenced in the ECERS-R and the Process Quality Index. The ECERS-R and the Process Quality Index include not only stimulation, warmth and sensitivity, and engagement, but also include policies that affect staff and parents, measures of space and furnishings, as well as other characteristics of quality early care and education. Staff Training. While teacher education level is important, it is also important to know whether teachers have training in early care and education, since such specific training has been found to be related to process quality (c.f., NICHD ECRN, 2000). Figure 19 presents the level of education of the teachers in the observed classrooms. One quarter had just the
minimum required education, while almost half (48%) had a 4-year college degree or more. At all levels of education, these teachers were likely to have some type of training in early care and education (Figure 20). This high rate of training in early care and education among teachers explains why, when we added training to our regression models, training did not add significantly to our ability to explain variations in process quality. Centers with more educated classroom staff also had teachers with more training in early care and education, and therefore we could not separate out the effects of training in early care and education from the effects
Figure 19: Classroom Teacher Education
H.S. +25%
Associates Degree
27%
Bachelors Degree
41% Graduate Degree
7%
Figure 20: Teacher ECE-related Training by Education Level
76%
36% 27% 29%
14%
59% 70% 71%
5% 3%10%
H.S.+ Associates Bachelors Graduate
ECE Coursework ECE Certificate/DegreeNo ECE Training

Massachusetts Cost/Quality Study: Preschool Classrooms
35
of education level. Because of this association between training and education, we only included teacher education in our model in Table 1. However, it is important to remember that the teachers with the most education overall are also most likely to have their highest degree in early childhood education or a related field.1
The role of trained teachers is evidenced in other ways in this study. As part of this study, we collected information on the number of hours each teacher and assistant teacher spent in the classroom. We calculated the proportion of classroom teaching hours that were provided by teachers vs. assistant teachers. When we added “proportion of classroom hours provided by teachers” to our models, we were able to explain more of the variation in process quality. Most importantly, classrooms with a greater proportion of classroom hours by teachers provided care rated significantly higher on Warmth And Sensitivity, and on Engagement (see Table 2).
Table 2: Standardized Estimates of Relationships Between Percent Teacher Hours and Process Quality Measures (N = 88) Stimulation Warmth &
Sensitivity Engagement ECERS-R Process
Quality Index Child:Staff Ratio -.23^ -.17 -.05 -.27 * -.24 ^ Group Size .15 .05 -.07 .17 .05 Teacher Educ. .30 ** .20 ^ .29 ** .24 * .23 * Percent Hours by Teachers
.10 .23 * .23 * .14 .19
R2 .12 * .11 * .15 * .12 * .12 * ^ = p < .10, * = p < .05, ** = p < .01
1 It is also possible that teachers with more experience provide better quality care and education, and that these might be the same teachers with more training. However, we examined whether teacher experience was a significant predictor, and found that there were no differences in process quality between newer and more experienced teachers in this sample. Education and training appear to be the key factors.
The majority of teachers in Massachusetts currently have more than the required training in early care and education. Seventy-five percent of teachers have an Associates degree or higher. More than half of these teachers have their highest degree in early care and education or a related field.
Classrooms that relied more on teachers, rather than assistant teachers, had staff who were more sensitive to children and more engaged in their activities.

36
As Figure 21 shows, classrooms that scored above 5.5 on the Warmth and Sensitivity composite – Good or better – were in centers that were staffed in such a way that 78% of classroom hours were provided by teachers, and 22% by assistant teachers. In contrast, classrooms that scored below 4.5 on the Warmth and Sensitivity composite – below the Good benchmark – were in centers that were staffed in such a way that only 65% of their classroom hours were provided by teachers, and 35% were provided by assistant teachers. Turnover. While regulatable aspects of early care and education are important to understanding and improving quality, other aspects of early care and education are potentially important as well. The question of staff turnover is particularly key to the cost and quality of Massachusetts early care and education, given the current low unemployment rate. If, as we found in previous sections, qualified staff are important to the quality of the early care and education that Massachusetts children receive, it becomes important that centers be able to recruit and maintain qualified teaching staff. Therefore, we asked the center directors or owners a series of questions about their experiences with staff turnover in the previous 12 months.
Turnover rates. On average, centers reported that 26% of their teaching staff had left in the past year; half of all centers reported that 20% or more of their teaching staff had left in the past year. However, this varied considerably from center to center, with about one in three centers (32%) reporting fewer than 10% of staff had left in the previous year, and a little more than one in four (27%) reporting that more than a third of their staff had left in the previous year (Figure 22).
Figure 21: Average Proportion of Classroom Hours By Job Title
65% 72% 78%
35% 28% 22%
0%
25%
50%
75%
100%
Below 4.5 4.5 to 5.5 Above 5.5
Warmth & Sensitivity Scores
By Teachers By Assistant Teachers
Figure 22: Proportion of Centers with Low, Moderate and High Turnover
Low32%
Moderate41%
High27%

Massachusetts Cost/Quality Study: Preschool Classrooms
37
We also asked directors why staff had left. The most common reason was to take another job, outside of early care and education (ECE) (Figure 23). In fact, among those teaching staff who left in the past year, a minimum of 41% of teachers, and 39% of assistant teachers left the field of early child care and education altogether. This figure, combined with the average turnover rates, suggests that about 10% of the teaching staff in the centers in this sample left the field of ECE in the past year.
Replacing Teaching Staff. The other aspect of staff turnover that is important for understanding the quality of early care and education in Massachusetts is the ease with which teaching staff can be replaced. If teaching staff are replaced within a couple of weeks, with teachers of comparable education and training, then the disruptions to the classroom and to the children, while not insignificant, are easier to manage. However, if it takes a while to hire new teachers, and these teachers are less well-qualified, then the quality of the classroom is compromised by both the lower levels of training of the new teachers, as well as by the longer period of time when children are in the care of temporary teachers (either existing teachers or administrators who cover the classroom, or substitute teachers). Directors reported that, about half of the time, it took more than a month to fill the most recent vacancies for teachers or assistant teachers (Figure 24). It was particularly difficult to find teachers, with 58% of the vacancies requiring more than a month to fill.
Figure 23: Reasons for Leaving
27%31%
9%
24%
2%6%
29%
10%
20%26%
10%
10%0%
10%
20%
30%
40%
Teachers Assistant Teachers
Figure 24: Time to Fill Last Staff Vacancy
10% 16%13% 10%19%
31%
58%43%
Teachers Assistant Teachers< 1 wk 1-2 wks 3-4 wks > 4 wks
On average, centers reported that 26% of their teaching staff had left in the past year. Some of the teaching staff went to other centers or preschool classrooms, but about 40% left the field of early care and education. Overall, about 10% of all the teaching staff in the centers in this sample completely left the field of early care and education in the past year.

38
In addition, more than a third of the time, the newly hired staff were less qualified than the teachers or assistant teachers who had left (Figure 25). Again, it was most difficult to find teachers, with 48% of new hires being less qualified than their predecessors.
NAEYC Accreditation. The National Association for the Education of Young Children has established an accreditation standard for early care and education. For example, NAEYC recommends that 4- to 5-year-olds should be in groups of 16 to 20 children, and that staff have specialized training in child development and early education. As of February 1, 2001, there were 735 NAEYC-accredited programs in Massachusetts. In the sample for this study, 35% of centers were accredited by NAEYC. Centers rated as Good or higher on the Process Quality Index were more likely to have received NAEYC accreditation than were centers rated as of Minimal quality (less than 4.0), or between Minimal and Good (between 4.0 and 4.9) (Figure 26).
Improving Quality
When structural aspects of quality are discussed, it is often child:staff ratio and group size that are emphasized. They are both regulated by the state and are an easy means by which someone can check to see if a center is in compliance. Child:staff ratio was related to overall quality and to Stimulation, although it was not significantly related to Warmth and Sensitivity or staff Engagement. Even in Massachusetts, with regulations that are among the most stringent in the nation (reflected in the relatively high overall quality compared to other states), variations in observed child:staff ratios are associated with variations in process quality. 2 2 Variations in group size did not add to our ability to predict process quality in this study; however, other
Figure 25: Comparability of New Hires
52% 67%
48%34%
0%
20%
40%
60%
80%
100%
Teachers AssistantTeachers
Comparable Not Comparable
Figure 26: NAEYC Accreditation By Process
Quality Index
26% 24%
43%
0%
10%
20%
30%
40%
50%
< 4.0 4.0 - 4.9 5.0 - 5.9Process Quality Index
For 58% of the most recent teacher vacancies, it took more than one month to hire a replacement. In addition, 48% of newly-hired teachers were less qualified than their predecessors.
Massachusetts Cost/Quality Study: Preschool Classrooms
39
Teaching staff education was more strongly associated with process quality than were either child:staff ratios or group size. We also found that, above and beyond these regulatable aspects of preschool care and education, the use of more teacher hours in the classroom, rather than staffing with assistant teachers, was associated with higher process quality ratings.
studies have found that group size is related to quality. It may be that, in Massachusetts strict regulatory environment, the variations in group size are not great enough to add predictive power after we consider child:staff ratios.
Classrooms with well-educated teaching staff, and a greater proportion of classroom hours provided by teachers, rather than assistant teachers, received higher process quality ratings.
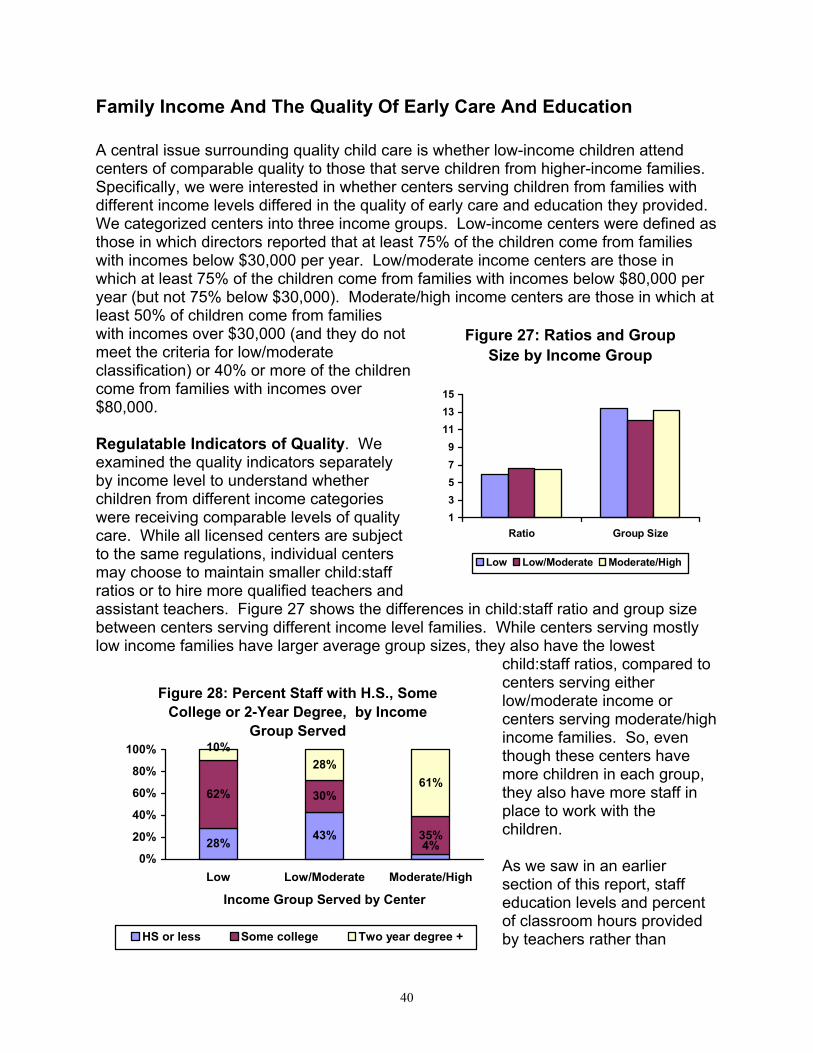
40
Family Income And The Quality Of Early Care And Education
A central issue surrounding quality child care is whether low-income children attend centers of comparable quality to those that serve children from higher-income families. Specifically, we were interested in whether centers serving children from families with different income levels differed in the quality of early care and education they provided. We categorized centers into three income groups. Low-income centers were defined as those in which directors reported that at least 75% of the children come from families with incomes below $30,000 per year. Low/moderate income centers are those in which at least 75% of the children come from families with incomes below $80,000 per year (but not 75% below $30,000). Moderate/high income centers are those in which at least 50% of children come from families with incomes over $30,000 (and they do not meet the criteria for low/moderate classification) or 40% or more of the children come from families with incomes over $80,000. Regulatable Indicators of Quality. We examined the quality indicators separately by income level to understand whether children from different income categories were receiving comparable levels of quality care. While all licensed centers are subject to the same regulations, individual centers may choose to maintain smaller child:staff ratios or to hire more qualified teachers and assistant teachers. Figure 27 shows the differences in child:staff ratio and group size between centers serving different income level families. While centers serving mostly low income families have larger average group sizes, they also have the lowest
child:staff ratios, compared to centers serving either low/moderate income or centers serving moderate/high income families. So, even though these centers have more children in each group, they also have more staff in place to work with the children. As we saw in an earlier section of this report, staff education levels and percent of classroom hours provided by teachers rather than
Figure 27: Ratios and Group Size by Income Group
13579
111315
Ratio Group Size
Low Low/Moderate Moderate/High
Figure 28: Percent Staff with H.S., Some College or 2-Year Degree, by Income
Group Served
28% 43%4%
62% 30%
35%
10%28%
61%
0%
20%
40%
60%
80%
100%
Low Low/Moderate Moderate/High
Income Group Served by Center
HS or less Some college Two year degree +
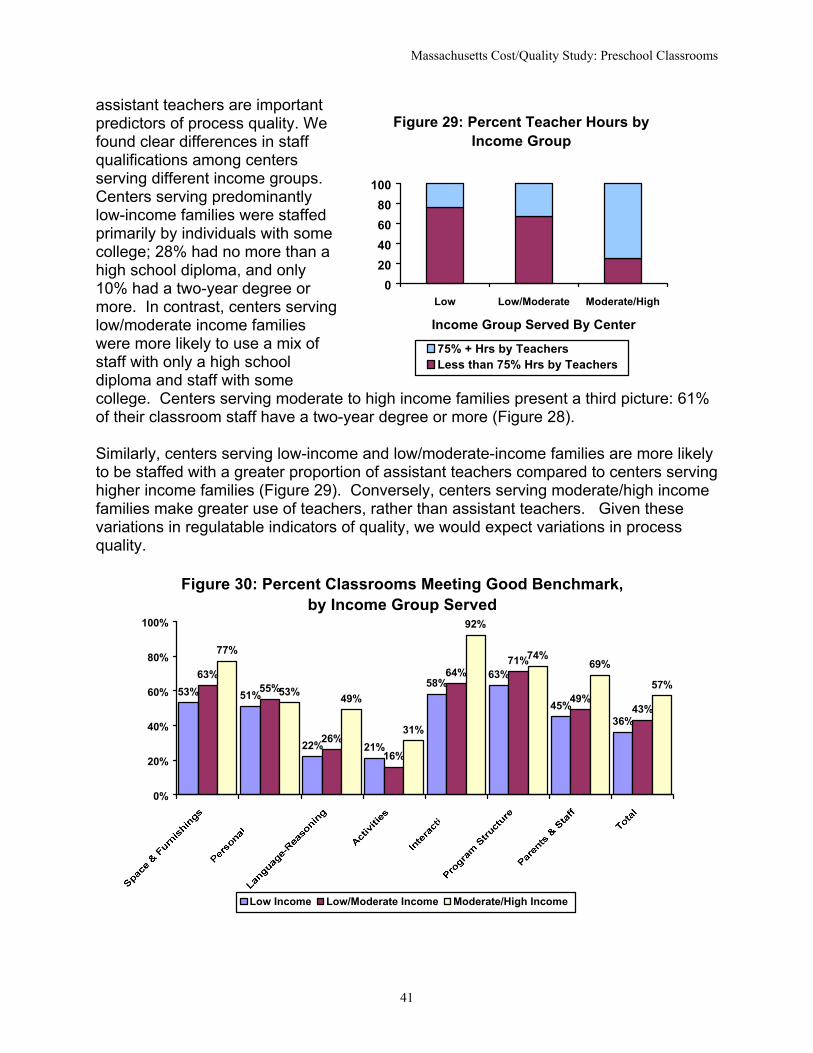
Massachusetts Cost/Quality Study: Preschool Classrooms
41
assistant teachers are important predictors of process quality. We found clear differences in staff qualifications among centers serving different income groups. Centers serving predominantly low-income families were staffed primarily by individuals with some college; 28% had no more than a high school diploma, and only 10% had a two-year degree or more. In contrast, centers serving low/moderate income families were more likely to use a mix of staff with only a high school diploma and staff with some college. Centers serving moderate to high income families present a third picture: 61% of their classroom staff have a two-year degree or more (Figure 28). Similarly, centers serving low-income and low/moderate-income families are more likely to be staffed with a greater proportion of assistant teachers compared to centers serving higher income families (Figure 29). Conversely, centers serving moderate/high income families make greater use of teachers, rather than assistant teachers. Given these variations in regulatable indicators of quality, we would expect variations in process quality.
Figure 29: Percent Teacher Hours by Income Group
020406080
100
Low Low/Moderate Moderate/High
Income Group Served By Center
75% + Hrs by TeachersLess than 75% Hrs by Teachers
Figure 30: Percent Classrooms Meeting Good Benchmark, by Income Group Served
53% 51%
22% 21%
58%63%
45%36%
63%55%
26%16%
64%71%
49%43%
77%
53% 49%
31%
92%
74%69%
57%
0%
20%
40%
60%
80%
100%
Low Income Low/Moderate Income Moderate/High Income

42
Process Quality. We found that centers serving a majority of moderate/high income families were more likely to meet the Good benchmark on the total ECERS-R score and on many of the subscales (Figure 30). Centers serving low and low/moderate income families, on the other hand, had scores that were much more similar to each other. The greatest gaps between income groups (differences of 20 percentage points or more) appear on the Space and Furnishings, Parents and Staff, Language-Reasoning, and Interactions scales. We will examine each of these scales in greater detail.
Space and Furnishings. The average Space and Furnishings score for centers serving low income families was 5.23, compared to 5.73 for centers serving moderate/high income families. However, averages don’t tell the whole story. As Figure 31 shows, 77% of centers serving moderate/high income families met the Good benchmark for Space and Furnishings, compared to only 53% of centers serving low-income families. A classroom that meets the Good benchmark provides ample space with room for children to move around freely, and the space is pleasantly decorated with children’s artwork or
photos of recent activities. In addition, the space and furnishings are arranged in a way that facilitates play and minimizes disruptions with well-defined activity centers and traffic patterns that do not interfere with play. Parents and Staff. As Figure 32 shows, about half of centers serving low-income families or low/moderate income families only met Minimal standards for Parents and Staff. A program that meets Minimal standards is one that facilitates parent-staff communication about the children, and one in which interactions between parents and staff are generally respectful and positive. The Minimal work environment for staff provides some support to staff, including some in-service training. On contrast, over two-thirds of centers serving moderate-to-high income families met the Good benchmark. These centers provided more support for communication among staff and between parents and staff. In addition,
Figure 31: Space & Furnishings Scores, by Income Group Served
4%47% 33%
23%
53%60% 77%
3%
0%
20%
40%
60%
80%
100%
Low Low/Mod Mod/High
Income Group Served by CenterInadequate+ Minimal+ Good+ Excellent
Figure 32: Parents and Staff Scores, by Income Group Served
5% 6%
50% 45%31%
43% 45%69%
3% 4%
0%
20%
40%
60%
80%
100%
Low Mod/High
Income Group Served by CenterInadequate+ Minimal+ Good+ Excellent

Massachusetts Cost/Quality Study: Preschool Classrooms
43
staff received several breaks in an eight-hour day, regular in-service training, plus supervisory observation and a written evaluation. Language-Reasoning. The average Language-Reasoning score for centers serving low-income families was 4.07, compared to 4.93 for centers serving moderate/high income families. As Figure 33 shows, 16% of centers serving low-income families did not even meet Minimal standards for Language-Reasoning. All told, 70% of centers serving low-income children, and 75% of centers serving low/moderate income children did not meet the Good benchmark, compared to 51% of centers serving moderate/high income families. These classrooms at best, met only minimal standards, and did not provide the developmentally-appropriate language materials, and regular language and reasoning enrichment activities required to meet the Good benchmark. In fact, only 22% of low-income centers met the Good benchmark, compared to 49% of centers serving moderate/high income families. Interactions. The average Interactions score for centers serving low-income families was 5.32, compared to 5.81 for centers serving moderate/high income families. As Figure 34 shows, centers serving low-income families were four times as likely as centers serving moderate/high income families to be rated as meeting only Minimal standards for Interactions. The Interactions scale is a measure of the quality of interactions between staff and children, and among the children themselves. A classroom that meets Minimal standards is one in which staff supervision is adequate to keep the children safe, there are some positive interactions between staff and children, without the use of harsh discipline styles, and children are encouraged to interact with each other in a positive manner. A classroom that meets the Good benchmark goes beyond this, with
Figure 33: Language-Reasoning Scores, by Income Group Served
16% 4% 3%
54%71%
48%
22% 26%
42%
7%
0%
20%
40%
60%
80%
100%
Low Low/Mod Mod/High
Income Group Served by CenterInadequate+ Minimal+ Good+ Excellent
Figure 34: Interaction Scores, by Income Group Served
8% 3%34% 33%
8%
54% 64%
81%
4%11%
0%
20%
40%
60%
80%
100%
Low Low/Mod Mod/High
Income Group Served by CenterInadequate+ Minimal+ Good+ Excellent

44
staff acting preventively to avoid unsafe situations, paying attention to the whole group even when working with a small group or an individual child, using such non-punitive discipline methods as redirecting children from unacceptable to acceptable behaviors, showing warmth and respect for the children, and modeling good social skills. While 58% of low-income centers met, or exceeded, the Good benchmark, fully 92% of centers serving moderate/high income families met, or exceeded, the Good benchmark. Summary
This study was undertaken to provide a picture of the quality of Massachusetts early care and education for preschoolers. The impetus for this study came from previous research that found that both structural and process quality make a difference in children’s development. Child:staff ratios and teacher training have been found to be related to children’s development in several studies (c.f., Howes, Phillips & Whitebook 1992; NICHD ECCRN 1999). These regulatable measures impact children’s lives through their links to process quality – the actual experiences of children in classrooms (NICHD ECCRN 2001). Higher process quality, including age-appropriate stimulation, as well as sensitive and responsive caregiving, has been found to be associated with better developmental outcomes in most studies of early care and education, including the Bermuda Study (McCartney 1984; Phillips, McCartney & Scarr 1987); the Chicago Study (Clarke-Stewart, Gruber & Fitzgerald 1994); the Child Care and Family Study (Kontos, Howes, Shim & Galinsky 1995); the Cost, Quality and Outcomes Study (Peisner-Feinberg & Burchinal 1997) and the NICHD Study of Early Child Care (NICHD ECCRN 1998, 2000a). Recent research on brain development, coupled with rising concerns about school readiness, has fueled an interest in the ways in which early care and education can support young children’s cognitive and language development. The research on early child care clearly indicates that child care can play an important role. Children who attend child care centers that offer high quality care, particularly more language stimulation, show more advanced cognitive and language development (Burchinal, Roberts, Riggins et al, 2000; NICHD ECCRN 2000). The early years are also crucial years for the development of social skills – the ability to make friends, to get along well with others, to cooperate in group activities, to understand others’ perspectives – skills that are necessary to the development of self-esteem and social relationships, and to later school success. Research has found that higher process quality is associated with young children’s social and emotional development (c.f., Lamb 1998). The quality and stability of children’s relationships with their child care providers appears to be particularly important to children’s social and emotional development (c.f., Howes & Hamilton 1992, 1993; Howes, Matheson & Hamilton 1994). The cumulative evidence of the research on early child care and children’s development is clear; for children in child care, the quality of that care is consistently associated with children’s development. As the National Research Council notes (2000, pg. 313),

Massachusetts Cost/Quality Study: Preschool Classrooms
45
“…high-quality care is associated with outcomes that all parents want to see in their children, ranging from cooperation with adults to the ability to initiate and sustain positive exchanges with peers, to early competence in math and reading.” On average, full-day, year-round Massachusetts early care and education for preschoolers received a rating of Good on the ECERS-R. Moreover, Massachusetts does as well as, or better than, several other states examined in comparable studies. This overall picture of Massachusetts may reflect the state’s relatively strict regulations governing licensed early child care centers. However, more than half of the classrooms did not meet the ECERS-R benchmark for Good care. Children in these classrooms are receiving less than the standards set for developmentally-appropriate care, and, while they may be in care that meets minimal standards, many opportunities to enhance their development are being missed. Many children are in care for 8 to 10 hours a day, and this care could be an ideal opportunity to enrich their lives. In addition, Massachusetts’ performance is uneven across different areas of early care and education practice. More than two-thirds of the centers in the sample met the Good benchmark on Program Structure and Interactions; more than half of the centers met the Good benchmark on Space and Furnishings, Parents and Staff, and Personal Care Routines. However, more than two-thirds of classrooms were rated as less than Good quality on Language-Reasoning and Activities. These classrooms do not provide the rich language environment that research has found is essential to children’s language and cognitive development, and that is related to later school success. In addition, these classrooms do not provide the variety of activities that would give children the opportunity to explore and learn about their environment. Massachusetts’ performance is also uneven across centers serving different income groups. We found that centers that serve predominantly low- or low/moderate income families were rated as poorer quality than centers that serve predominantly moderate/high income families. Centers serving predominantly low-income or low/moderate income families had poorer quality space and furnishings, poorer supports for parents and staff, and offered the children poorer quality language-reasoning activities plus poorer quality staff-child and child-child interactions. It has been suggested by some that we do not all have to drive a Cadillac, or attend “the best” center. However, the activities and staff behaviors that are necessary to meet the Good benchmarks on the Language-Reasoning and Interactions scales are precisely those behaviors that have been shown to be linked to better child outcomes. Children attending centers that serve predominantly low-income or low/moderate families are less likely to receive the level of early care and education that will prepare them for school and later life. How can Massachusetts ensure that all children have access to quality early care and education, and that centers provide the stimulation and strong teacher-child relationships important to children’s development? There are many options to be
46
considered, and this study was not designed to evaluate specific policies. However, the study found that centers with better child:staff ratios, better educated teachers, and more classroom hours from teachers rather than from assistant teachers, provided better quality care overall, including more developmentally-appropriate stimulation, and better relationships between classroom staff and children. In addition, the study found that centers serving different income groups varied considerably in both the education levels of their teachers, and the extent to which they used teachers rather than assistant teachers in the classroom. While qualified teachers are clearly an important part of quality early care and education, center directors reported that it was difficult to hire qualified teachers – in fact, 48% of newly-hired teachers were less qualified than their predecessors.

Massachusetts Cost/Quality Study: Preschool Classrooms
47
Revenues, Expenditures and Full Costs In this section we present descriptive data on center revenues and the costs of center care for preschool aged children. These data come from an interview which collected information from center directors on general center characteristics, enrollment, staffing, sources of income, and expenditures. The findings in this section are based on 84 centers; four of the centers in the sample did not provide complete financial information and are excluded from the cost analyses. It is useful to distinguish between expenditures and full costs. Expenditures comprise centers’ actual outlays over the course of a year. These are typically less than the full costs incurred for center care, because many centers are able to obtain resources -- especially space -- at below-market rates. Their operations may be subsidized in other ways as well, for example, through the receipt of goods and services from parent organizations. Full costs include the true cost of these additional resources. It is important to consider full costs as well as expenditures. If one wants to expand early care and education slots by replicating existing centers, one should expect to pay the true market cost for inputs. For comparability, all costs and revenues have been expressed in terms of dollars per child care hour. For illustrative purposes, we also calculate the cost of care for a hypothetical child in full-time care, defined as 45 hours per week, for 52 weeks a year. The data in these analyses have been weighted to adjust for sampling probability, ineligibility for this study, and non-response to produce statistics representative of the entire state.
Revenues were grouped in the following categories: • parent fees • state and federal government subsidies: government food program funds,
government non-food program funds • sponsoring organization contributions: funds from churches or synagogues, non-
profit agencies, employers or other sponsors • fundraising and foundation grants, including nonprofit and community donations. Expenditures were classified as: • labor: salaries and wages, fringe benefits and payroll taxes • occupancy: rent or mortgage • food • other: office supplies, insurance, professional fees, professional development,
repairs and maintenance, contractual services, educational supplies, advertising, utilities, miscellaneous.
Full Costs exceed expenditures by the value of goods and services used by centers beyond what they pay for – primarily space made available for free or below market rent.

48
Revenues
Across all centers in the sample, the average revenues per hour of care were $3.71. This is equivalent to $8,681 per year for one child in full-time care. Parent fees, averaging $2.16 per hour, comprise 58% of total revenues, on average (Figure 35). Government subsidies contribute 36% of revenues, on average (33% from vouchers, 3% from food programs). The remaining 6% of revenues come from two sources: 3% from sponsoring organizations like churches, other non-profit agencies, and employers, and 3% from fundraising and foundation grants. However, the actual distribution of revenue sources varied from center to center.
Expenditures
Expenditures average $3.41 per hour of care provided. This is the equivalent of $7,979 per year for a child in full-time care. Non-labor expenditures. The single largest component of non-labor expenditures is occupancy expenditures (rent or mortgage payments). The mean occupancy expenditure is $0.21 per child hour. However, occupancy expenditures vary considerably (see the following section for more detail). Food expenditures comprise $0.12 per child hour, while other expenses average $0.63 per child hour (Figure 36). Labor expenditures. Labor expenditures comprise 72% of center expenditures, averaging $2.45 per child hour (Figure 36). Directors were asked for salaries and wages for all teaching staff. To make salaries and wages comparable for staff working part-time and full-time, we computed the mean hourly wage for teaching staff (those who spent more than 75% of their paid time in the classroom). Salaries and wages for teaching staff varied by job title and by region of the state. Teaching staff with more education received higher wages in all regions. In addition, teaching staff in Region 6 (Boston area) received relatively higher wages, and teaching staff in Regions 1 and 2
Figure 35: Revenue Sources
Sponsoring Organization
3%Parent fees58%
Fundraising3%
Government subsidies
36%
Figure 36: Average Expenditures
Labor72%
Occupancy6%
Food4%
Other18%

Massachusetts Cost/Quality Study: Preschool Classrooms
49
(mid- and western Massachusetts) received the lowest wages at each level of education (Figure 37).
Revenues and Expenditures by Income of Families Served
Centers serving moderate to high income families reported higher revenues from all sources than centers serving low-income families, with centers serving low/moderate families falling somewhere in between the two, a J-shaped curve (Figure 38). However, we see different patterns when we look at specific revenue sources. Parent fees are higher in centers serving higher-income families, while government funding is less. These two counteracting tendencies result in the J-shaped curve for total revenues. The relationship between family income and total expenditures is also characterized by a J-shaped curve (Figure 39). Centers serving low-income families spend a mean of $3.20 per child hour, the equivalent of $7,488 for a full-time child. In contrast, low/moderate-income centers spend a mean of $2.92, and moderate/high-income centers spend a mean of $4.38 per child hour.
However, when we break out labor and non-labor expenditures, we see that the sharpest contrasts are in labor expenditures, with centers serving moderate/high income families spending 1.7 times as much on labor as do low-income centers, and 1.6 times as much as centers serving low/moderate income families. Mean labor
Figure 38: Revenue Sources by Income of Families Served
012345
Total ParentFees
Gov't Other
Sources of Revenue
Rev
enue
per
Chi
ld H
our
Low Low/Moderate Moderate/High
Figure 37: Mean Hourly Wage of Teaching Staff By OCCS Region and Education
$5.00
$8.00
$11.00
$14.00
$17.00
Region 1 Region 2 Region 3 Region 4 Region 5 Region 6
< H.S. H.S. A.A. B.A. M.A. +

50
expenditures for centers serving the three income groups are $2.04, $2.13, and $3.41 per child hour, respectively. These mean expenditures are the equivalent of labor expenditures of $4,774 for a full-time child at a low-income center, $4,984 for a full-time child at a low/moderate income center, and $7,979 for a full-time child at a moderate/high income center. These higher labor expenditures by centers serving moderate/high income families could, in theory, be the result of lower child:staff ratios, with more staff working with fewer children, or the result of higher pay to staff. However, we found that the higher labor expenditures in moderate/high-income centers are not due to lower ratios of children to staff in these centers, but rather to higher pay to staff in these centers. In fact, the average child:staff ratio was actually a little lower in centers serving low-income families (6.2) than in the other two groups of centers (6.6). Full Costs
Annual expenditures do not correspond to the full cost of operating a center. Centers may receive goods and services from parent organizations and may benefit from volunteer workers and in-kind donations. The major divergence between centers’ expenditures and their true costs, however, is their occupancy costs, which are often substantially subsidized by sponsoring groups and landlords.
To put a value on the rent subsidy centers receive, we estimated the market commercial rent per square foot for each town using real estate data. Centers were then classified as paying market rental rates if they paid 80% or more of the market rate per square foot of space. Only 8 centers paid market rates for rent, paying a mean of $0.89 per child hour for occupancy costs. Centers paying less than the market rate spent an average of $0.17 per child hour. Centers with occupancy costs “subsidized” by sponsoring groups and landlords are able to afford more space – they rent an average of 103 square feet per child as opposed to the 75 square feet per child rented by the centers paying market rent.
It is important to consider full costs as well as expenditures. If one wants to expand early care and education slots by replicating existing centers, one should expect to pay the true market cost for inputs.
Figure 39: Expenditures by Income of Families Served
0
1
2
3
4
5
Total Labor Non-Labor
Expenditure CategoriesLow IncomeLow/Moderate IncomeModerate/High Income

Massachusetts Cost/Quality Study: Preschool Classrooms
51
It is misleading, however, to calculate occupancy costs for “space-subsidized” centers at the going commercial rate. If “space-subsidized” centers paid the going rate, they would pay a mean of $1.07 per child hour, which is higher than the occupancy costs of unsubsidized centers. In all likelihood, currently subsidized centers would rent less space if they had to pay full price for it. Therefore we calculated an estimate of true occupancy costs using two estimates of space used per full-time equivalent child, one corresponding to the 50th percentile for all centers, and one corresponding to the maximum amount of indoor space used by any of the centers that paid market price for space (146 square feet per full-time equivalent child), or about the 80th percentile of space used for all centers.1 If no center used more than 146 square feet per child and all paid market rent, child care centers would spend a total of $4.24 per child hour to provide care, $0.91 of which would go toward occupancy costs. Alternatively, if no center used more than the median amount of space, while paying market rents, expenditures per child hour would total $3.99, $0.66 of which would go toward occupancy costs. We made similar estimates of the value of other in-kind contributions, including contributions from sponsoring organizations. Other in-kind contributions adds another $0.13 per child hour, including an average of $0.08 per child hour from sponsoring organizations. The full cost of care, including the full market rent for all space used, at the median square footage, and the value of other in-kind contributions, averages $4.12 per child hour$0.71, or 21 percent higher, than expenditures. Summary
On average, the bulk of centers’ revenues (58 percent) are from parent fees, with government subsidies comprising nearly all of the rest (33 percent). The average expenditure for care is about $3.41 per child hour, or $7,979 per year for a child in full-time care. Center expenditures go largely to labor (72 percent). Both revenues and expenditures are highest for centers serving moderate/high income families. Although government subsidies are 8 times as high for centers serving low-income families compared to centers serving moderate/high income families, parent fees in the moderate/high income centers more than make up the difference, contributing to 28 percent greater revenues overall. This difference in revenues is reflected in substantially higher average expenditures on labor in those centers. Factoring in the in-kind donations that centers receive, as below-market rents and other contributions, raises the average cost of care by about 21 percent, to $4.12 per child hour.
1 The minimum space required in Massachusetts is 35 square feet per child, allowing for office and storage space.

52
The Relationship Between Cost and Quality This section of the report examines the relationship between preschool classroom quality and center costs. We would have preferred to estimate costs at the classroom level as well, but the data did not support this. Instead, we follow the practices of the original Cost, Quality and Outcomes study (Helburn et al. 1996), and estimate costs at the center level.1 The analyses in the following sections use modified full costs (excluding occupancy costs), not just expenditures. Because of the uncertainty inherent in estimating the value of rent subsidies, and the likelihood that centers would use less space if they had to pay for it at the going rate, we have used actual rent paid, rather than estimated market rents (see Appendix). To understand the relationship between cost and quality, it is important to consider not only structural and process measures of quality, but also other factors that may be related to costs and/or quality, such as the local labor markets and local markets for commercial space, as well as variations in center characteristics, such as size, for-profit status or participation in a multi-service or sponsoring organization. Before we discuss these more complex, multivariate models, we first examine average costs among groups of centers varying in structural and process measures of quality. Structural Measures of Quality and Costs. In our quality analyses in earlier sections of this report, we found that higher process quality was predicted by better ratios (fewer children per staff member), better educated staff and a higher proportion of classroom hours from teachers. Given what we know about labor costs, we would expect that each of these factors is associated with higher labor costs. In fact, the mean costs for centers with child-staff ratios of 5 children or fewer per teaching staff member are $2.91 per child hour, compared to $2.24 for centers with more than 5 children per staff member. Similarly, higher staff education levels translate into higher labor costs. Mean costs for centers with an average education level of 16 years or more (the equivalent of a B.A. or more) 1 Using center-level costs and classroom-level quality measures is not unreasonable if classrooms within one center are of similar levels of quality – that is, if centers that have relatively high quality in the observed preschool classrooms tend to have relatively high quality in other rooms. As a partial test of this, we examined the relationship between the ECERS scores for the preschool classrooms in the Cost, Quality and Outcomes study and the ITERs scores for the infant/toddler classrooms in those same centers. We found that two classrooms in the same center did tend to meet similar benchmarks (X2 = 45.05, p < .01).
Figure 40: Labor Costs by Center's Average Education Level
$2.29 $2.40$2.87
$0.00$0.50$1.00$1.50$2.00$2.50$3.00
Centers Grouped by Average Education Level
H.S. Some College B.A. +

Massachusetts Cost/Quality Study: Preschool Classrooms
53
are $2.87 per child hour, compared to only $2.29 per child hour for centers with an average education level of high school or less (Figure 40). On the other hand, classroom staffing using at least 75% teacher time costs more in labor than staffing using more time from assistant teachers or aides, but the increased labor costs are almost completely offset by lower non-labor costs at those centers that use more classroom time from assistant teachers and aides, spread across all components of non-labor. Process Measures of Quality and Costs. The ECERS-R, a continuous measure, is benchmarked at values of 1, 3, 5, and 7, corresponding to “inadequate,” “minimal”, “good”, and “excellent” care. However, when we examined mean costs for centers grouped according to their total ECERS-R scores, the breakpoints in levels of costs did not correspond to these benchmarks (Figure 41). Instead, it appears that mean costs do not vary much between centers scoring below 4.0 and centers scoring between 4.0 and 4.5, so that these centers might reasonably be grouped together for our analyses. Similarly, mean costs do not vary much between centers with ECERS-R scores between 4.5 and 4.99, and centers with ECERS-R scores between 5.0 and 5.5; these centers can also be grouped together in our multivariate analyses. Instead, the changes in the mean costs of groups of centers seem to occur at ECERS-R scores of 4.5 and again at 5.5. This pattern is seen in both total costs and labor costs. We also found the same pattern in the Process Quality Index measure. Therefore, in our multivariate analyses (below), we contrast centers with ECERS-R (or Process Quality Index) scores below 4.5, centers with scores between 4.5 and 5.49, and centers with scores of 5.5 or higher.
A Multivariate Framework The patterns of mean costs for groups of centers that differ on structural and process measures of quality are suggestive, but they are not conclusive, because centers may vary in many ways that affect cost and quality. Following Helburn et al. (1995), we therefore proceed to relate center costs to classroom quality in a multivariate framework. Expenses incurred for operating a center during a year, like the cost of operating any business, are assumed to be determined by output, input prices, quality, and type of establishment. Output is measured as the number of child hours of early care and education provided per year at the center. Input prices include market wages, rent per
Figure 41: Mean Costs By ECERS-R Score
$0.00$1.00$2.00$3.00$4.00$5.00$6.00
< 4 4-4.49 4.5-4.99 5.0-5.49 5.5-5.99 6.0+
ECERS-R total score
Ave
rage
exp
endi
ture
s pe
r chi
ld h
our
Labor Nonlabor

54
square foot, and the local unemployment rate. Quality is measured by the ECERS-R or the Process Quality Index, depending on the model. Separate models were estimated for labor costs, non-labor costs, and both combined. While the main policy implications are drawn from the combined model, it is illuminating to see which components of costs are most affected by various factorse.g. that quality has a significant impact on labor but not on non-labor costs. Caution must be exercised in interpreting the component models, however, because centers may trade off one type of expenditure for another. Model Estimation. A multiplicative functional form is assumed, i.e. ∏=
j
bijijXTC
where TCi is the annual expenditure of operating a center, Xij is the jth characteristic of center i (output, input prices, etc.), and bj is the estimated parameter associated with that characteristic, corresponding to the elasticity of total cost with respect to that characteristic (continuous) or the percent change (dichotomous). The models were estimated using the SAS GENMOD procedure, assuming a log link function and a gamma error distribution. Two centers were dropped from the multivariate analysis due to incomplete data. Different versions of the expenditure models were estimated, using various specifications. The estimated relationships between each quality measure and costs were remarkably stable. Results for two typical modelsone including ECERS-R, the other including the Process Quality Index -- are reported below for labor, nonlabor, and total costs. Because of the pattern appearing in Figure 41, suggesting that average costs changed at mid-points, rather than at the benchmark scores, the measures of quality have been broken out into the following ranges: • “less than good”: under 4.5 • “good-minus to good-plus”: 4.5 to 5.49 • “better quality”: 5.5 and above. While these breaks do not correspond to the ECERS-R benchmarks, they do appear to represent cost benchmarks faced by centers. Labor costs Labor costs were found to be strongly related to higher levels of quality. Controlling for number of children served, input prices, and center characteristics such as for-profit status, we found that preschool care and education in the “good-minus to good-plus” range of the ECERS-R scale was associated with an increase in labor costs of 16 percent (p < 0.10) relative to the reference category of less-than-good care (Table 3). “Better quality” care was estimated to lead to 40 percent higher labor costs, on average, than “less than good care” (p < 0.01.).

Massachusetts Cost/Quality Study: Preschool Classrooms
55
Table 3. Estimated Percent Increase in Labor Costs Associated with Increase in Child Care Quality from Reference Category (Under 4.5 on Indicated Quality Measure) ECERS-R Process Quality Index Quality level 4.50 to 5.49 (“Good-minus to good-plus”) 0.1550 ^ 0.0975 ns
Quality level 5.50 + (“Better quality”) 0.4013 ** 0.4614 **
^ = p < .10, * = p < .05, ** = p < .01 Similar results were seen when labor costs were related to the Process Quality Index: An increase from “less than good” to “good-minus to good-plus” care was associated with an increase in labor costs of 10 percent (n.s.), while an increase from “less than good” to “better quality” was associated with an increase of 46 percent (p < 0.01). Non-Labor Costs
We found that non-labor costs were not related to quality. The coefficients for both the ECERS-R and Process Quality Index were virtually zero (Table 4).
Table 4. Estimated Percent Increase in Non-Labor Costs Associated with Increase in Child Care Quality from Reference Category (Under 4.5 on Indicated Quality Measure) ECERS-R Process Quality Index Quality level 4.50 to 5.49 (“Good-minus to good-plus”) -0.0313 ns -0.0846 ns
Quality level 5.50 + (“Better quality”) -0.0767 ns -0.1140 ns
^ = p < .10, * = p < .05, ** = p < .01
Total Costs Combining labor and non-labor costs, we see results that are consonant with the separate analyses of labor and non-labor costs. The point estimates of the increase in costs associated with raising total quality from “less than good” to “good-minus to good-plus” are 5 to 9 percent, not statistically significant (Table 5). An increase from “less than good” to “better quality” would raise costs by an estimated 27 percent (ECERS-R scale), or by an estimated 36 percent (Process Quality Index).
Labor costs were found to be strongly related to higher levels of quality, while non-labor costs were unrelated to quality.

56
Table 5. Estimated Percent Increase in Total Costs Associated with Increase in Child Care Quality from Reference Category (Under 4.5) ECERS-R Process Quality Index Quality level 4.50 to 5.49 (“Good-minus to good-plus”) 0.0892 ns 0.0527 ns
Quality level 5.50 + (“Better quality”) 0.2732 ** 0.3612 **
^ = p < .10, * = p < .05, ** = p < .01 Implications
Using the data from this sample of centers, we found slightly higher costs associated with “good-minus to good-plus” quality (the 4.5-5.49 range) compared to “less than good” quality (below a 4.5), and significantly higher costs associated with “better quality” (5.5 or higher) compared to “less than good” quality (below a 4.5). The exact numerical relationship varies depending on which quality measure is chosen. Taking these results at face value, we may ask what it might cost to raise those centers that are “less than good” to the next higher level, or to raise all centers to the “better quality” level. Because 31.9 % of centers are “less than good” according to the ECERS-R scale, and 46.2 % according to the Process Quality Index, bringing all centers up to the “good-minus to good-plus” level on either scale would cost an estimated additional 2-3% of total current costs of all centers. Because only 27.6 percent of centers are “better quality” according to the ECERS-R scale and 7.9 percent according to the Process Quality Index, raising all centers to the “better quality” level on the ECERS-R would cost an estimated additional 23% of total current costs of all centers. Raising all centers to the “better quality” level on the Process Quality Index would cost an estimated additional 36% of total current costs of all centers.2
Of course these results should not be treated as precise, for at least two reasons. First, the sample comprises a limited number of centers, so that there is statistical error around the estimates. Second, and more seriously, we cannot necessarily infer that lower-quality centers can achieve higher levels of quality by spending more. There may
2 These values were calculated as follows. To raise “less than good” quality to “good-minus to good-plus” would, for the ECERS-R, incur increased costs of 8.92% on 31.9% of centers, i.e. 2.8 percent. For the Process Quality Index, the analogous calculation is 5.27 % of 46.2%, which is 2 percent. To then bring these centers plus the “good-minus to good-plus” ones up the higher quality level would incur additional costs of 27.32 % on 72.4% of centers (ECERS-R), or nearly 20 percent; alternatively, 36.12 % on 92.1% of centers (process quality), or 33.3 percent. Each of these new values is added to the previous 2.4 to 2.7 percent increase to get the total cost increment.
Higher quality early care and education costs significantly more than care that does not meet the Good benchmark on the ECERS-R.

Massachusetts Cost/Quality Study: Preschool Classrooms
57
be other unmeasured characteristics of centers that contribute to quality, such as directors’ training and experience. Furthermore, these models do not address how additional funds should be spent. Reasonably, additional funds should be spent on those factors that will improve quality. This study may suggest what those factors are, but it can not guarantee success. Other factors may well operate. Future research should examine centers at various levels of quality and see how they differ in their operations -- and whether the ensuing differences in quality are “things money can buy”. Evaluation research is also needed to determine whether policies that target additional funds to specific areas do, in fact, increase observed quality of early care and education in preschool classrooms. Nonetheless, these data present compelling evidence that higher quality early care and education is associated with greater costs. And indeed, it would be surprising if this were not the case. Many improvements in quality may be attainable nearly for free, by putting certain “best practices” into place. In order to reach the highest levels of quality early care and education, however, centers must be able to spend real resources if they are to increase the quality of their staff, who are a key link to better quality early care and education.
In order to reach the highest levels of quality early care and education, however, centers must be able to spend real resources if they are to increase the quality of their staff, who are a key link to better quality early care and education.
58
References Arnett, J. (1989). Caregivers in day-care centers: Does training matter? Journal of
Applied Developmental Psychology, 10, 541-552. Burchinal, M.R., Roberts, J.E., Riggins Jr., R. Zeisel, S.A., Neebe, E., & Bryant, D.
(2000). Relating quality of center-based child care to early cognitive and language development longitudinally. Child Development, 71, 339-357.
Galinsky, E., Howes, C., Kontos, S., & Shinn, M. (1994) The Study of Children in Family Child Care and Relative Care: Highlights of Findings. New York: Families and Work Institute.
Harms, T., & Clifford, R. M. (1980). Early Childhood Environment Rating Scale. New York: Teachers College Press.
Harms, T. & Clifford, R. M. (1983). Assessing preschool environments with the Early Childhood Environment Rating Scale. Studies in Educational Evaluation, 8, 261-269.
Harms, T.,Clifford, R. M. & Cryer, D. (1998). Early Childhood Environment Rating Scale. Revised Edition. New York: Teachers College Press.
Helburn, Suzanne, W., and Howes, Carollee. (1996). Child care cost and quality. The future of children, Volume 6, Number 2, pp. 62-82.
Helburn, Suzanne W. (Ed.). (1995). Cost, Quality and Child Outcomes in Child Care Centers, Technical Report. Denver, Department of Economics, Center for Research in Economic and Social Policy, University of Colorado at Denver.
Howes, C. & Stewart, P. (1987). Child’s play with adults, toys, and peers: An examination of family and child care influences. Developmental Psychology, 23, 423-430.
Howes, C., Phillips, D. & Whitebook, M. (1992). Thresholds of quality: Implications for the social development of children in center-based child care. Child Development, 63, 449-460.
Howes, C. & Hamilton, C.E. (1992). Children’s relationships with caregivers: Mothers and child care teachers. Child Development, 63, 859-866.
Howes, C. & Hamilton, C.E. (1993). The changing experiences of child care: Changes in teachers and in teacher-child relationships and children’s social competence with peers. Early Childhood Research Quarterly, 8, 15-32.
Howes, C., Matheson, C.C. & Hamilton, C.E. (1992). Maternal, teacher and child care correlates of children’s relationships with peers. Child Development, 63, 449-460.
Lamb, M.E. (1998). Nonparental child care: Context, quality, correlates. Pp. 73-134 In Handbook of Child Psychology, Volume 4: Child Psychology in Practice, 5th Edition. W. Damon, I.E. Sigel, and K.A. Renninger, eds. New York: John Wiley & Sons, Inc.
National Research Council and Institute of Medicine. (2000). From Neurons to Neighborhoods: The Science of Early Childhood Development. Jack P. Shonkoff and Deborah Phillips, eds. Board of Children, Youth, and Families, Commission on Behavioral and Social Sciences and Education. Washington, D.C.: National Academy Press.
NICHD Early Child Care Research Network. (1996). Characteristics of infant child care: factors contributing to positive caregiving. Early Childhood Research Quarterly, 11, 269-306.
NICHD Early Child Care Research Network. (1999). Child outcomes when child-care

Massachusetts Cost/Quality Study: Preschool Classrooms
59
center classes meet recommended standards for quality. American Journal of Public Health.
NICHD Early Child Care Research Network. (2000a). The relations of early child care to cognitive and language development. Child Development. 71(4), 960-980.
NICHD Early Child Care Research Network. (2000b). Characteristics and quality of child care for toddlers and preschoolers. Applied Developmental Science, 4(3), 116-135.
NICHD Early Child Care Research Network. (2001). Structure → process → outcome: direct and indirect effects of caregiving quality on young children’s development. Paper presented at the 2001 Biennial Meeting of the Society for Research on Child Development, Minneapolis, Minnesota.
Peisner-Feinberg, E. Burchinal, M. (1997). Relations between preschool children’s child care experiences and concurrent development: The Cost, Quality and Child Outcomes Study. Merrill-Palmer Quarterly, 43 (3), 451-477.
Whitebook, M. Howes, C. & Phillips, D. (1990). Who Cares? Child Care Teachers And The Quality Of Care In America. Final Report of the National Child Care Staffing Study. Oakland, CA: Child Care Employee Project.

60
APPENDIX: Measurement and Estimation for the Cost-Quality Models As described in the text, the variables included in the cost-quality models are measures of output, input prices, quality of care, and center type. The specific measures used for the dependent and explanatory variables are described below. Expenditures are what centers spend over the course of the year. Costs, in contrast, in principle include the value of all resources used by centers, whether they pay for them or not. The value of services provided by parent organizations, for example, are included in costs but not in expenditures. We have used costs, rather than expenditures, in our examination of the relationship between quality and cost. However, the measure of cost used in the regression modelsexcludes the value of subsidized space. We relate this modified measure of full costs to the price actually paid for space (the expenditure for space). Although we could equally well have explained the relationship between full cost (including the value of subsidized space) and the market rent, we preferred not to, because both of these values (market rent and value of subsidized space) are estimates, with the problems associated with estimates, and both estimates are correlated with each other. Using subsidized space in our full cost measure, and market rent as the input, would merely have added noise to both the dependent and independent variables, and not improved our ability to estimate the relationship between cost and quality. See below for more information on the input price of space. Output is measured as the number of child-hours of care provided over the course of the year. It is calculated based on centers’ enrollment, hours of operation per week, and weeks of operation per year. Input prices are the costs faced by centers in purchasing the resources they need to operate: labor, space, and other items. We used two measures for labor: an index of market wages, and the unemployment rate. We used wage rates in 1998 for comparable occupations as an index of market wages for early care and education teaching staff in full-day centers. The Massachusetts Division of Education and Training data source provides wage rates for a wide variety of job classificationsfood service workers, service station attendants, doctors, teachers, and so on – in 16 economic regions. We tested several categories of workers, including elementary school teachers, licensed practical nurses, cashiers, orderlies, and packaging machine operators -- as possible indices of market wages in different regions of the state. While obviously none of these categories is equivalent to early care and education teaching staff, we felt that variations in their wages across the economic regions might proxy well for variations in wages that child care centers would have to pay to entry-level workers. The three criteria on which we chose these categories were that they were common types of employment, so that the regional means were likely to be based on reasonably large sample sizes; that the wage levels corresponded approximately to those of early care and education teaching staff either entry level or more experienced; and that they represented job classifications that were likely to be homogeneous throughout the state. We found that when we ran the models with alternative versions of the wage index the
Massachusetts Cost/Quality Study: Preschool Classrooms
61
only coefficients that changed meaningfully were the intercept and the coefficient on the wage index itself. The labor cost and total cost models were also estimated both including and excluding the local unemployment rate, with no significant differences between the models. We considered unemployment rate to be an indicator of labor inputs because centers located in parts of the state with high unemployment could logically pay lower wages, even holding constant the general wage level in their region. Alternative formulations of our cost models dropped the wage and unemployment measures and included indicators for the six OCCS regions instead. Including OCCS regions in the models did not substantially change the relationship between cost and quality. Therefore, we report the final models using the wage and unemployment measures. As mentioned above, the measure of cost used as a dependent variable excluded the value of the space subsidy. Consequently, the input price for “non-labor” was based on the (potentially subsidized) price per square foot that centers actually pay. Even centers that pay nothing for rent, however, obviously incur costs for other non-labor inputs: office supplies, insurance, equipment, food, and so on. We assumed that these other costs were proportional to the true (unsubsidized) cost of space. We estimate that if centers paid full market rent, they would pay an average of $18 per square foot, and occupancy costs would comprise 64 percent of non-labor costs. We therefore estimated the composite price of “non-labor” to be the actual rent per square foot paid by the center plus $10 -- the $10 increment corresponding to the average non-labor cost per square foot ($18 ÷ 0.64 = $28 = $18 + $10). Despite its apparent arbitrariness, the chosen value of this increment was validated in two ways. First, when we tried a wide range of alternative increments ($5, $10, $25, $50) we found that the coefficients in the model (other than the intercept and that on the price of non-labor itself) were virtually unchanged. Second, the $10 increment yielded a coefficient on the price of non-labor of around 0.9, an economically sensible result. Quality of care was measured by two summary indicators: the total ECERS-R score and the Process Quality Index (scaled to be similar to the ECERS-R). These two indicators have been discussed in detail in the body of the report. We also explored three components of quality: indices of Warmth And Sensitivity, Engagement, And Stimulation. It was not possible to disentangle the effects of these components, however, because of the high correlations among them. We have therefore presented results for the two summary measures only. Type of center was captured by a number of indicators that could be expected to affect the structure of costs. These were:
• Profit Status. For-profit centers and not-for-profit centers may differ in their costs for labor, non-labor or both.

62
• Enrollment of 40 or fewer children. Smaller centers may incur lower costs because they are not required by state regulations to have a full-time administrative person on staff.
• Inclusion in a multiservice organization. Centers in this situation may be cross-subsidized by their parent organization.
• Participation in CACFP. This indicator was included because centers may incur additional expenses to comply with CACFP requirements.
• Presence of infants and toddlers. Because infants and toddlers are more expensive to serve than preschoolers, we would expect that centers that include these age groups would incur higher costs for a given level of preschool room quality.
• NAEYC accreditation. Centers of a given quality may incur additional costs to be accredited.
The models were estimated using the SAS GENMOD procedure, assuming a log link function and a gamma error distribution. This is conceptually equivalent to regressing the log of costs on the log of the various explanatory variables, but is preferred because it gives econometrically consistent results. It can be shown that if the underlying model is multiplicative, directly regressing the log of the dependent variable on the log of the explanatory variables yields inconsistent parameter estimates that confound the impacts with differences in the variances. For example, if participation in an employment program reduces the variation in wages (because participants do not accept low-paying jobs), then a regression on the logs will show a positive impact on mean wages even if it has not occurred. The models reported in the text include all of the above mentioned variables, regardless of statistical significance.