The copyright © of this thesis belongs to its rightful ...etd.uum.edu.my/6721/2/s91054_02.pdf ·...
119
The copyright © of this thesis belongs to its rightful author and/or other copyright owner. Copies can be accessed and downloaded for non-commercial or learning purposes without any charge and permission. The thesis cannot be reproduced or quoted as a whole without the permission from its rightful owner. No alteration or changes in format is allowed without permission from its rightful owner.
Transcript of The copyright © of this thesis belongs to its rightful ...etd.uum.edu.my/6721/2/s91054_02.pdf ·...

The copyright © of this thesis belongs to its rightful author and/or other copyright
owner. Copies can be accessed and downloaded for non-commercial or learning
purposes without any charge and permission. The thesis cannot be reproduced or
quoted as a whole without the permission from its rightful owner. No alteration or
changes in format is allowed without permission from its rightful owner.

THE EFFECT OF MANAGEMENT CONTROL SYSTEM ON THE
RELATIONSHIP BETWEEN BUDGET PARTICIPATION AND
BUDGET SLACK
MASNAWATY SANGKALA
DOCTOR OF PHILOSOPHY
UNIVERSITI UTARA MALAYSIA
August 2015

i
THE EFFECT OF MANAGEMENT CONTROL SYSTEM ON THE
RELATIONSHIP BETWEEN BUDGET PARTICIPATION AND
BUDGET SLACK
TITLE PAGE
By
MASNAWATY SANGKALA
Thesis Submitted to
Tunku Puteri Intan Safinaz, School of Accountancy, Universiti Utara Malaysia,
in Fulfillment of the Requirement for the
Degree of Doctor of Philosophy


iv
PERMISSION TO USE
In presenting this thesis in fulfilment of the requirements for a postgraduate degree from
Universiti Utara Malaysia, I agree that the Universiti Library may make it freely
available for inspection. I further agree that permission for the copying of this thesis in
any manner, in whole or in part, for scholarly purpose may be granted by my
supervisor(s) or, in their absence, by the Dean of Tunku Puteri Intan Safinaz School of
Accountancy, College of Business. It is understood that any copying or publication or
use of this thesis or parts thereof for financial gain shall not be allowed without my
written permission. It is also understood that due recognition shall be given to me and
to Universiti Utara Malaysia for any scholarly use which may be made of any material
from my thesis.
Requests for permission to copy or to make others use of materials in this thesis, in
whole or in part, should be addressed to:
Dean of Tunku Puteri Intan Safinaz School of Accountancy
College of Business
Universiti Utara Malaysia
06010 UUM Sintok

v
ABSTRACT
The research objective of this research is to examine the effect of budget participation
on budget slack in Indonesian manufacturing firms. In addition, this study investigates
the moderating effect of the management control system on the relationship between
budget participation and budget slack. The population of the study is manufacturing
firms listed on the Jakarta Stock Exchange. Questionnaires were distributed to finance
managers, production managers and marketing managers.The respondents of the study
are functional managers which represents 34.22 percent of the response rate. Factor
analysis, reliability analysis and hierarchical regression analysis are used to analyze the
data. The findings are as follows: (a) there is a negative relationship between budget
participation and budget slack; (b) there is a negative relationship between budget
participation and each of the management control system elements (which are
interactive control system, boundary control system, diagnostic control system and
beliefs control system) on budget slack; and (c) the management control system
package negatively moderates the relationship between budget participation and budget
slack. The results of this study suggest that the use of management control system
package can reduce the dysfunctional behaviour of managers. The results of the study
are also expected to have implications on the manufacturing sector on the importance
of managers to participate in the budgeting process and integrate it with management
control system to reduce budget slack.
Keywords: budget participation, budget slack, management control system package,
management control system elements.

vi
ABSTRAK
Objektif kajian ini adalah untuk mengkaji kesan penyertaan belanjawan ke atas
regangan belanjawan di firma perkilangan di Indonesia. Di samping itu, kajian ini
mengkaji kesan sistem kawalan pengurusan terhadap hubungan antara penyertaan
belanjawan dan regangan belanjawan. Populasi kajian ini adalah firma perkilangan
yang disenaraikan di Bursa Saham Jakarta. Borang soal selidik telah diedarkan kepada
pengurus kewangan, pengurus pengeluaran dan pengurus pemasaran. Responden kajian
adalah 140 functional managers yang mewakili 34.22 peratus kadar maklum balas.
Analisis faktor, analisis kebolehpercayaan dan analisis regresi berhierarki digunakan
untuk menganalisis data. Dapatan kajian ini adalah seperti berikut: (a) terdapat
hubungan yang negatif di antara penyertaaan belanjawan dan regangan belanjawan; (b)
terdapat hubungan yang negatif antara penyertaan belanjawan dan setiap elemen dalam
sistem kawalan pengurusan (iaitu sistem kawalan interaktif, sistem kawalan sempadan,
sistem kawalan diagnostik dan sistem kawalan kepercayaan) ke atas regangan
belanjawan; dan (c) pakej sistem kawalan pengurusan menunjukkan kesan yang negatif
terhadap hubungan antara penyertaan belanjawan dan regangan belanjawan. Dapatan
kajian ini mencadangkan bahawa penggunaan pakej sistem kawalan pengurusan boleh
mengurangkan gelagat salah laku pengurus. Dapatan kajian ini juga dijangka
mempunyai implikasi terhadap sektor perkilangan tentang kepentingan pengurus
mengambil bahagian di dalam proses penyediaan belanjawan dan mengintegrasikan
penyertaan belanjawaan dengan sistem kawalan pengurusan untuk mengurangkan
regangan belanjawan.
Kata kunci: penyertaan belanjawan, regangan belanjawan, pakej sistem kawalan
pengurusan, elemen sistem kawalan pengurusan.

vii
ACKNOWLEDGEMENT
In the name of Allah, the Most Gracious, the Merciful. I am grateful to the Almighty
Allah for giving me the opportunity to complete my PhD thesis. May peace and blessing
of Allah be upon His beloved Prophet Muhammad (SAW), his family and his
companions.
In completing this thesis, I owe a debt of gratitude and thanks to many persons and
institutions that have supported me throughout this difficult yet challenging journey.
First and foremost, I would like to express my deepest appreciation to my supervisors
Associate Professor Dr. Che Zuriana binti Muhammad Jamil and Associate Professor
Dr. Hasnah Kamardin who had assisted, guided and rendered their best supervisory
know how throughout the entire process of completing my thesis. Any error I made was
always corrected gently and with great care.
Then, my beloved husband, Mansyur Sain, who has constantly inspired, encouraged me
and provided emotional support, helped me whenever and wherever needed. I also truly
owe my special dedication to my two sons for their love, caring and understanding.
Muhammad Rezha and Muhammad Fuadunnurul Mahfud, your patience to get my
attention was really touching me and motivated me to finish my work quickly. Also, I
would like to extent my deepest love to my mother Hj. Rusnia Daming and my father
H. Sangkala Seleng who had sacrificed much to see me as the person I am now. I would
like to extend my gratitude to my dear brothers (Syamsul Alam, Kamaluddin, Syamsir,
Muhammad Natsir), they have been with infinite patience especially during my life
with them, my sincere gratitude goes to you dear brothers. In addition, I dedicate this
thesis to other colleagues who have contributed in no small way in making this work a

viii
success include Dr. Noriah, Dr. Asma Lode, Anas Salameh, Irene, Rina, fifi, Etry and
Ika Indra Harnizah. I also would like to thank the Universiti Utara Malaysia especially
School of Accountancy at College of Business for accepting me as a PhD candidate.
Finally, I would like to extend my gratitude to the Universitas Negeri Makassar and the
Indonesian Government for the financial support they have given me to pursue my
study.
Last but not least, I dedicated this thesis to my precious son, Muhammad Mirzha. Even
though you are not here with me in this world, but you will always be in my deepest
heart. I love you and miss you so much. You provide such inspiration for the completion
of this work.

ix
TABLE OF CONTENTS
TITLE PAGE ............................................................................................................... i
CERTIFICATION OF THESIS ................................................................................ ii
PERMISSION TO USE ............................................................................................. iv
ABSTRACT ................................................................................................................ vi
ABSTRAK ................................................................................................................. vii
ACKNOWLEDGEMENT ....................................................................................... viii
TABLE OF CONTENTS ............................................................................................x
LIST OF TABLES ................................................................................................. xviii
LIST OF FIGURES ...................................................................................................xx
LIST OF ABBREVIATIONS ................................................................................. xxi
CHAPTER ONE: INTRODUCTION ........................................................................1
1.1 Background of the Study ........................................................................................1
1.1.1 Budget Scenario in Indonesian Manufacturing Firms ...................................6
1.2 Problem Statement .................................................................................................9
1.3 Research Questions ..............................................................................................14
1.4 Research Objectives .............................................................................................14
1.5 Significance of the Study .....................................................................................15
1.6 Scope of the Study ................................................................................................16
1.7 Definition of Key Terms ......................................................................................17
1.8 Organization of the thesis .....................................................................................18
CHAPTER TWO: LITERATURE REVIEW .........................................................20
2.1 Introduction ..........................................................................................................20
2.2 Budget Participation .............................................................................................20
2.3 Budget Slack .........................................................................................................24
2.4 Management Control Systems ..............................................................................28
x
2.4.1 Definitions ...................................................................................................28
2.4.2 Various Models of Management Control System Packages .......................33
2.4.2.1 Merchant and Van der Stede’s Model Framework. .......................34
2.4.2.2 Malmi and Brown’s Framework ....................................................35
2.4.2.3 Simon’s Framework.......................................................................37
2.4.3 Discussion on the Presented Framework.....................................................38
2.5 Dimensions of Management Control System Packages .......................................40
2.5.1 Interactive Control Systems ........................................................................40
2.5.2 Boundary Control Systems ..........................................................................44
2.5.3 Diagnostic Control Systems ........................................................................46
2.5.4 Belief Control Systems ................................................................................48
2.6 Empirical Related Studies ....................................................................................51
2.6.1 Budget Participation and Budget Slack .......................................................52
2.6.2 Budget Participation, Interactive Control System and Budget Slack ..........57
2.6.3 Budget Participation, Boundary Control System and Budget Slack ...........60
2.6.4 Budget Participation, Diagnostic Control System and Budget Slack .........64
2.6.5 Budget Participation, Belief Control System and Budget Slack .................67
2.7 Summary studies budget participation and budget slack............... ......................68
2.8 Research Gap ........................................................................................................72
2.9 Related Theories on Buget Participation ..............................................................73
2.9.1 Under Pinning Theory .................................................................................74
2.9.1.1 Agency Theory ...............................................................................74
2.9.2 Others Related Theories ...............................................................................75
2.9.2.1 Behavioral Theory ..........................................................................75
2.9.2.2 Goal-Setting Theory .......................................................................77
2.9.2.3 Motivational Theory .......................................................................79
2.10 Summary of Chapter ............................................................................................80

xi
CHAPTER THREE: THEORETICAL FRAMEWORK AND HYPOTHESES
DEVELOPMENT ................................................................82
3.1 Introduction ...........................................................................................................82
3.2 Theoretical Framework .........................................................................................82
3.3 Agency Theory......................................................................................................82
3.1.1 Budget Slack and Agency Theory ..............................................................84
3.4 Conceptual Model and Hypotheses ......................................................................86
3.4.1 The Conceptual Framework Model ............................................................86
3.4.2 Hypotheses Development ...........................................................................87
3.4.2.1 Budget Participation and Budget Slack .........................................88
3.4.2.2 Moderating Effect of Interactive Control System (ICS) on
Budget Participation and Budget Slack .........................................89
3.4.2.3 Moderating Effect of Boundary Control System (BCS) on
Budget Participation and Budget Slack .........................................91
3.4.2.4 Moderating Effect of Diagnostic Control System (DCS) on
Budget Participation and Budget Slack .........................................93
3.4.2.5 Moderating Effect of Belief Control System (BLFCS) on
Budget Participation and Budget Slack .........................................95
3.4.2.6 Moderating Effect of MCS Package (MCSP) on Budget
Participation and Budget Slack .....................................................96
3.5 Summary of Chapter .............................................................................................98
CHAPTER FOUR: RESEARCH METHODOLOGY ..........................................99
4.1 Introduction ..........................................................................................................99
4.2 Research Design ...................................................................................................99
4.3 Information Sources ...........................................................................................101
4.4 Population and Data Collection ..........................................................................101
4.5 Operational Definition and Measurement of Variables ......................................103
4.5.1 Budget Participation ..................................................................................105

xii
4.5.2 Budget Slack..............................................................................................106
4.5.3 Interactive control System (ICS) ...............................................................107
4.5.4 Boundary Control System (BCS) ..............................................................108
4.5.5 Diagnostic Control System (DCS) ............................................................109
4.5.6 Belief Control System (BLFCS) ...............................................................110
4.5.7 Summary of Measurement ........................................................................111
4.6 Data Analysis ......................................................................................................112
4.6.1 Factor Analysis ..........................................................................................112
4.6.2 Reliability Analysis ...................................................................................114
4.6.3 Regression Analysis ..................................................................................115
4.6.3.1 Assumptions in Regression Analysis ............................................115
4.5.3.1.1 Linearity .........................................................................115
4.5.3.1.2 Homoscedasticity ...........................................................115
4.5.3.1.3 Multicollinearity ............................................................116
4.5.3.1.4 Outliers ...........................................................................116
4.5.3.2 Regression Functions ..................................................................117
4.6 Summary of Chapter ..........................................................................................118
CHAPTER FIVE: ANALYSIS AND FINDINGS ................................................119
5.1 Introduction ........................................................................................................119
5.2 Criterion Validity ................................................................................................119
5.3 Factor Analysis ...................................................................................................120
5.3.1 Budget Participation (BP) .........................................................................120
5.3.2 Budget Slack (BS) ....................................................................................122
5.3.3 Interactive Control System (ICS) .............................................................123
5.3.4 Boundary Control System (BCS) .............................................................124
5.3.5 Diagnostic Control System (DCS) ............................................................126
5.3.6 Belief Control System (BLFCS) ...............................................................127

xiii
5.4 Reliability Test ....................................................................................................128
5.5 Response Rate ....................................................................................................129
5.6 Test of Non-Response Bias .................................................................................130
5.7 Testing the Assumptions of Multiple Regression ...............................................132
5.7.1 Normality ..................................................................................................132
5.7.2 Linearity ....................................................................................................134
5.7.3 Multicollinearity .......................................................................................134
5.8 Profile of Respondents .......................................................................................135
5.9 Descriptive Statistics Analysis ............................................................................139
5.9.1 Dependent Variable – Budget Slack (BS) ................................................140
5.9.2 Independent Variable – Budget Participation (BP) ..................................141
5.9.3 Moderating Variable – Interactive Control System (ICS) ........................142
5.9.4 Moderating Variable – Boundary Control System (BCS) ........................143
5.9.5 Moderating Variable – Diagnostic Control System (DCS) ......................144
5.9.6 Moderating Variable – Belief Control System (BLFCS) .........................145
5.9.7 Moderating Variable – MCSP ..................................................................146
5.10 Summary of Chapter .........................................................................................147
CHAPTER SIX : FINDINGS AND DISCUSSION .............................................149
6.1 Introduction .........................................................................................................149
6.2 Correlation Analysis ...........................................................................................149
6.3 Multiple Regression ............................................................................................151
6.4 Moderating Effect ...............................................................................................152
6.5 Regression Result................................................................................................153
6.6 Hypothesis Testing..............................................................................................156
6.6.1 Hypothesis 1: Budget Participation has Positive and Significant
Relationship with Budget Slack. .............................................................157

xiv
6.6.2 Hypothesis 2: ICS Moderates the Relationship between Budget
Participation and Budget Slack .................................................................158
6.6.3 Hypothesis 3: BCS Moderates the Relationship between Budget
Participation and Budget Slack .................................................................160
6.6.4 Hypothesis 4: DCS Moderates the Relationship between Budget
Participation and Budget Slack .................................................................163
6.6.5 Hypothesis 5: BLFCS Moderates the Relationship between Budget
Participation and Budget Slack .................................................................164
6.6.6 Hypothesis 6: MCSP Moderates the Relationship between Budget
Participation and Budget Slack .................................................................166
6.7 Discussion of Results ...........................................................................................169
6.7.1 Hypothesis 1: Budget Participation has Positive and Significant
Relationship with Budget Slack. ...............................................................170
6.7.2 Budget Participation, Elements of Management Control System
Package and Budget Slack ........................................................................172
6.7.2.1 Hypothesis 2: Budget Participation, Interactive Control System
and Budget Slack (H2) ................................................................173
6.7.2.2 Hypothesis 3: Budget Participation, Boundary Control System
and Budget Slack (H3) ................................................................178
6.7.2.3 Hypothesis 4: Budget Participation, Diagnostic Control System
and Budget Slack (H4) ................................................................181
6.7.2.4 Hypothesis 5: Budget Participation, Belief Control System
and Budget Slack (H5) ................................................................184
6.7.2.5 Hypothesis 6: Budget Participation, Management Control
Systems Package and Budget Slack (H6) ...................................187
6.8 Summary of Chapter ..........................................................................................191
CHAPTER SEVEN : CONCLUSIONS .................................................................193
7.1 Introduction .........................................................................................................193
7.2 Summary of the Study ........................................................................................193
7.2.1 Budget Participation and Budget Slack ....................................................194

xv
7.2.2 Budget Participation, Elements of Management Control System
Package and Budget Slack ........................................................................194
7.2.2.1 Budget Participation, Interactive Control System and Budget
Slack ............................................................................................195
7.2.2.2 Budget Participation, Boundary Control System and Budget
Slack ............................................................................................195
7.2.2.3 Budget Participation, Diagnostic Control System and Budget
Slack ............................................................................................196
7.2.2.4 Budget Participation, Belief Control System and Budget Slack .197
7.3 Contribution of The Study ..................................................................................198
7.3.1 Theoretical Contributions .........................................................................198
7.3.2 Methodological Contributions ..................................................................200
7.4 Implications of The Study ...................................................................................200
7.4.1 Theoretical Implications ...........................................................................201
7.4.2 Practical Implications ...............................................................................201
7.5 Limitations ..........................................................................................................203
7.6 Suggestions for Future Research ........................................................................205
7.7 Concluding Comment and Summary ..................................................................205
REFERENCES .........................................................................................................207
APPENDIX A ...........................................................................................................231
APPENDIX B ...........................................................................................................249
APPENDIX C ...........................................................................................................252
APPENDIX D ...........................................................................................................265
APPENDIX E ...........................................................................................................275
APPENDIX F ...........................................................................................................300

xvi
LIST OF TABLES
Table Page
Table 2.1 Characteristics of Four Levers of Simons’ (1995) Control System 30
Tabel 2.2 Summary studies Budget Participation and Budget Slack 68
Table 4.1 Summary of Measurements of Independent Variable (IV) and
Dependent Variable (DV) and Moderating Variables. 111
Table 5.1 Factor Analysis for Budget Participation (BP) 121
Table 5.2 Factor Analysis for Budget Slack (BS) 122
Table 5.3 Factor Analysis for Interactive Control System 123
Table 5.4 Factor Analysis for Boundary Control System 125
Table 5.5 Factor Analysis for Diagnostic Control System 126
Table 5.6 Factor Analysis for Belief Control System 127
Table 5.7 Reliability Analysis 129
Table 5.8 Response Rate of the Questionnaires 130
Table 5.9 Test of Non-Response Bias 132
Table 5.10 Statistic Values of Skewness and Kurtosis Ratios 133
Table 5.11 Linearity Test 134
Table 5.12 Collinearity Diagnostic Test 135
Table 5.13 Profile of Respondents 136
Table 5.14 Descriptive Statistics for BS 140
Table 5.15 Descriptive Statistics for BP 142
Table 5.16 Descriptive Statistics for ICS 143
Table 5.17 Descriptive Statistics for BCS 143
Table 5.18 Descriptive Statistic DCS 145
Table 5.19 Descriptive Statistics for BLFCS 146
Table 5.20 Summary of Descriptive Statistics of All Variables 146

xvii
Table Page
Table 6.1 Pearson Correlation 150
Table 6.2 Moderated Multiple Regression Analysis : Budget Slack 154
Table 6.3 Result of Examination of Hypothesis 1 157
Table 6.4 Result of Examination of Hypothesis 2 159
Table 6.5 Result of Examination of Hypothesis 3 161
Table 6.6 Result of Examination of Hypothesis 4 163
Table 6.7 Result of Examination of Hypothesis 5 165
Table 6.8 Result of Examination of Hypothesis 6 167
Table 6.9 Summary of Results 169

xviii
LIST OF FIGURES
Figure 3.1 The Conceptual model ................................................................................ 87
Figure 4.1 Research Design ....................................................................................... 100
Figure 5.1 Histogram Normality Test ........................................................................ 133
Figure 6.1 The Effect of Direct Relationship between Budget Participation and
Budget Slack. .......................................................................................... 158
Figure 6.2 The Moderating Effect of Interactive Control System on the Relationship
between Budget Participation and Budget slack. .................................... 160
Figure 6.3 The Moderating Effect of Boundary Control System on the Relationship
between Budget Participation and Budget Slack. ................................... 162
Figure 6.4 The Moderating Effect of Diagnostic Control System on the Relationship
between Budget Participation and Budget Slack. ................................... 164
Figure 6.5 The Moderating Effect of Belief Control System on the Relationship
between Budget Participation and Budget Slack. ................................... 166
Figure 6.6 The Moderating Effect of Management Control System Package on the
Relationship between Budget Participation and Budget Slack ............... 168
Figure 6.7 Summary of the Moderating Effect of ICS on the Relationship
between Budget Participation and Budget Slack .................................... 177
Figure 6.8 Summary of the Moderating Effect of BCS on the Relationship
between Budget Participation and Budget Slack .................................... 180
Figure 6.9 Summary of the Moderating Effect of DCS on the Relationship
between Budget Participation and Budget Slack .................................... 183
Figure 6.10Summary of the Moderating Effect of BLFCS on Relationship
between Budget Participation and Budget Slack .................................... 186
Figure 6.11Summary of the Moderating Effect of MCS Package on the
Relationship between Budget Participation and Budget Slack ............... 190

xix
LIST OF ABBREVIATIONS
BS Budget Slack
BP Budget Participation
ICS Interactive Control system
BCS Boundary Control System
DCS Diagnostic Control System
BLFCS Belief Control System
MCS Management Control System
MCSP Management Control System Package

1
CHAPTER ONE
INTRODUCTION
1.1 Background of the Study
Budgets are tools that managers can use to assist them in carrying out their activities
(Tanase, 2013). For achieving the goals of a firm, budgets are necessary for providing
information for planning, controlling and determining strategies (Triana & Yuliusman
2012; Maksum, 2009; Ramdeen, Santos, & Chatfiel 2007; Baiman, 1982); as well as
for forecasting events (Onsi, 1973). In the increasingly competitive global market,
budgets are becoming more and more significant to facilitate the implementation and
achievement of business goals (Huang & Chen 2009).
Many employees’ participate in budget preparation, known as budget participation
(hereafter called BP). It can involve junior employees (Sholihin, Pike, Mangena & Li,
2011), up to all levels of management, and is considered to be the best method for
budget preparation (Garrison; Eric, Peter, Chesley & Ray 2006).
Generally, BP has a direct relationship with employees’ performance. They drive for
success and subordinates’ attitude towards their superiors, jobs and firms. According to
Nur (1993), the participation of employees in budget preparation has a noticeable effect
on the effectiveness of the organization. The process of preparing a BP a proposal by
managers. The lower level employees are responsible for the allocation of resources
considering the goals of the proposal. In order to receive a large amount of funds for
BP, managers are more likely to use a number of action plans. According to Van der
Stede, Hansen, and Otley (2003), creating budget slack (hereafter called BS) is one of

The contents of
the thesis is for
internal user
only

207
REFERENCES
Abernethy, M. A., & Brownell, P. (1999). The role of budgets in organizations facing
strategic change: an exploratory study. Accounting, organizations and society,
24(3), 189-204.
Abernethy, M. A., & Lillis, A. M. (1995). The impact of manufacturing flexibility on
management control system design. Accounting, Organizations and Society, 20(4),
241-258.
Abernethy, M. A., & Lillis, A. M. (2001). Interdependencies in organization design: a
test in hospitals. Journal of Management Accounting Research, 13(1), 107-129.
Abernethy, M.A, & Vagnoni. (2004). Power organization design and managerial
behavior. A Interdependencies in organization design. Accounting Organization
and Society, 29, 207-225.
Adnan & Sulaiman. (2007). Organizational, cultural and religious factors of budgetary
slack creation: Empirical Evidence from Malaysia. International Review of
Business Research Papers: 3 (3), 17-34.
Afiani, D, N. (2010). Effect of budget participation, budget emphasis and information
asymmetry against budget slack. E-Jurnal Binar Akuntansi, 1 (1).
Agbejule, A., & Saarikoski, L. (2006). The effect of cost management knowledge on
the relationship between budgetary participation and managerial performance. The
British Accounting Review, 38(4), 427-440.
Ahmad, Z.U. (2005). Implementing participating budgeting approach in Least
Developed Countries (LDC): Myth and reality, the cost and management 33(4),
75-84.
Ahrens, T., & Chapman, C. S. (2004). Accounting for flexibility and efficiency: A Field
Study of Management Control Systems in a Restaurant Chain. Contemporary
Accounting Research, 21(2), 271-301.

208
Ajibolade, S. O., & Akinniyi, O. K. (2013). The influence of organisational culture and
budgetary participation on propensity to create budgetary slack in public sector
organisations. British Journal of Arts & Social Sciences, 13 (1).
Alreck, P. L., & Settle, R. B. (1995). The Survey Research Handbook: Guidelines and
Strategies for Conducting a Survey, 2E.
Annissarahma, Dinni. (2008). Effect of budgety participation, information asymmetry,
budget emphasis, and organizational commitment against budget slack. Thesis UII.
Yogyakarta.
Anthony, Robert N, & V. Govindarajan. (1965). Planning and control system: A
framework for analysis. Boston, Harvard University.
Anthony, R. N., & Govindarajan, V. (1995). Management Control Systems (eight ed.).
Richard D. Irwin.
Anthony, R.N. & Govindarajan, V. (1998). Management control systems. Boston et
al.,: IrwinMc Graw-Hill.
Anthony, Robert N. & V. Govindarajan. (2001). Service organizations in management
control systems, (10th ed.) New York: McGraw-Hill/Irwin.
Anthony, Robert N, & V. Govindarajan. (2007). MCS. 12, New York. NY: Mc Grow-
Hill. Chicago: Richard D, Irwin, Inc.
Apriantini,N.K.E., Adiputra, I.M.P & Sujana E. (2014) Pengaruh partisipasi anggaran
terhadap senjangan anggaran dengan penekanan anggaran dan komitmen
organisasi sebagai variable moderating. E-Journal S1 Ak Universitas Pendidikan
Gamnesha, 2 (1).
Aprila, N. & Hidayani, S. (2012). The Effect of budgetary participation, Information
asymmetry, budget emphasis and commitment organization to budgetary slack.
Proceeding the 13 th Malaysia Indonesia Conference on Economic, Management
and Accounting MIICEMA.

209
Argyris, C. (1952). The impact of budget on people. The Controllership Foundation,
Inc., Cornell University, Ithaca, NY.
Armstrong, J. S., & Overton, T. S. (1977). Estimating nonresponse bias in mail surveys.
Journal of Marketing Research, 14, 396-402.
Baba, H.N. (2004). Corporate social responsiveness and environmental performance
of Small Medium Enterprise: An empirical study. Unpublished Thesis, Universiti
Utara Malaysia.
Badan Kebijakan Fiskal, Kementerian Keuangan Republik Indonesia (2010). Potret
industri manufaktur Indonesia sebelum dan pasca krisis.
Baiman. S. (1982). Agency research in managerial accounting: A survey. Journal of
Accounting Literature, 1, 154-213.
Baiman, S., & Evans, J. H. (1983). Pre-decision information and participative
management control systems. Journal of Accounting Research, 22, 371-395.
Baiman, S., & Lewis, B. L. (1989). An experiment testing the behavioral equivalence
of strategically equivalent employment contracts. Journal of Accounting Research,
27, 1-20.
Baiman, S. (1990). Agency research in managerial accounting: A second look.
Accounting, Organizations and Society, 15(4), 341-371.
Bedford, D.S, (2006). PhD Proposal, School of Accounting. University of Technology,
Sydney.
Baron, R. M., & Kenny, D. A. (1986). The moderator–mediator variable distinction in
social psychological research: Conceptual, strategic, and statistical considerations.
Journal of personality and social psychology, 51(6), 1173-1182.
Belsley, D. A, Kuh, E. & Welsch, R. E. (1980) Regression diagnostics: identifying
influential data and sources of collinearity

210
Bisbe, J., & Otley, D. (2004). The effects of the interactive use of management control
systems on product innovation. Accounting, organizations and society, 29(8), 709-
737.
Bedford, D.S (2006). PhD Proposal, School of Accounting, University of Technology,
Sidney.
Bergen, M., Dutta, S., & Walker Jr, O. C. (1992). Agency relationships in marketing: a
review of the implications and applications of agency and related theories. The
Journal of Marketing, 1-24.
Blanchard, G. A., & Chow, C. W. (1983). Allocating indirect costs for improved
management performance. Strategic Finance, 64(9), 38-41.
Bonner, S.E & Sprinkle, G. B (2002). The effect of monetary incentives on effort and
task performance : Theories, evidence, and a framework for research. Accounting,
organizations and society, 27, 303-345.
Brown, J. L., Evans III, J. H., & Moser, D. V. (2009). Agency theory and participative
budgeting experiments. Journal of Management Accounting Research, 21(1), 317-
345.
Brownell, P. (1981). Participation in budgeting, locus of control and organizational
effectiveness. Accounting Review, 56 (4), 844-860.
Brownell, P. (1982). Participation in the budgeting process when it works and when it
doesn’t. Journal of Accounting Literature, Spring. 124-53.
Brownell, P. (1985). Budgetary System and the control of functionally differentiated
organizational activities. Journal of Accounting Research, 23(2), 502-512.
Bruining, H., Bonnet, M., & Wright, M. (2004). Management control systems and
strategy change in buy outs. Management Accounting Research, 15(2), 155-177.
Cameron, K. S., & Quinn, R. E. (1999). Diagonising and changing organizational
culture. NY: Addison, Wesley Inc.

211
Cammann, C. (1976). Effects of the use of control systems. Accounting, Organizations
and Society, 1(4), 301-313.
Chalos, P., & Haka, S. (1989). Participative Budgeting and Managerial Performance.
Decision Sciences, 20(2), 334-347.
Chenhall, R., & Morris, D. (1995). Organic decision and communication processes and
management accounting systems in entrepreneurial and conservative business
organizations. International Journal of Managemant Science, 23(5), 485-497.
Chenhall, R. H. (2003). Management control systems design within its organizational
context: findings from contingency-based research and directions for the
future. Accounting, Organizations and Society, 28(2), 127-168.
Chong, V. K., & Ferdiansah, I. (2011). The effect of trust-in-superior and truthfulness
on budgetary slack: An experimental investigation. Advances in Management
Accounting, 19, 55-73.
Chow, C. W., Cooper, J. C., & Waller, W. S. (1988). Participative budgeting: effects
of a truth-inducing pay scheme and information asymmetry on slack and
performance. Accounting Review, 63(1), 111-122.
Chow, C. W., Cooper, J. C., & Haddad, K. (1991). The effects of pay schemes and
ratchets on budgetary slack and performance: A multiperiod experiment.
Accounting, Organizations and Society, 16(1), 47-60.
Christensen, J. (1982). The determination of performance standards and participation.
Journal of Accounting Research, 589-603.
Church, B.K., Hannan, R. L., Kuang, X. J. (2012). Shared interest and honesty in budget
reporting. Accounting, Organizations and Society. 37 (3), 155–167.
Clarkson, M. E. (1995). A stakeholder framework for analyzing and evaluating
corporate social performance. Academy of Management Review, 20(1), 92-117.

212
Coughlan, A. T., & Schmidt, R. M. (1985). Executive compensation, management
turnover, and firm performance: An empirical investigation. Journal of Accounting
and Economics, 7(1), 43-66.
Cyert, R. M. & J. G. March (1992). A behavioral theory of the firm. Cambridge, MA:
Blackwell Publishers, Inc.
Dakhli Anissa (2009). Budgetary participation, locus of control and job satisfaction in
Tunisia. La place de la dimension europeenne dans la compatibilite control Audit,
Strasbourg France.
Davila, T. (2000). An empirical study on the drivers of management control systems'
design in new product development. Accounting, organizations and society, 25(4),
383-409.
Davila, T., & Wouters, M. (2005). Managing budget emphasis through the explicit
design of conditional budgetary slack. Accounting, Organizations and Society,
30(7), 587-608.
Douglas, P. C., & Wier, B. (2000). Integrating ethical dimensions into a model of
budgetary slack creation. Journal of Business Ethics, 28(3), 267-277.
Douthit, J., & D. Stevens, (2015). The Robustness of honesty effects on budget
proposals when the superior has rejection authorit. The Accounting Review 76 (4),
467-493.
Dunk, A. S. (1993). The effect of budget emphasis and information asymmetry on the
relation between budgetary participation and slack. Accounting Review, 68(2), 400-
410.
Dunk, A. S., & Perera, H. (1997). The incidence of budgetary slack: a field study
exploration. Accounting, Auditing & Accountability Journal, 10(5), 649-664.
Dunk, A. S., & Nouri, H. (1998). Antecedents of budget slack: a literature review and
synthesis. Journal of Accounting Literature, 17, 72-96.

213
Dunk, A. S., & Lal, M. (1999). Participative budgeting, process automation, product
standardization, and managerial slack propensities. Advances in Management
Accounting, 8, 139-158.
Dwi, K.S.C., & Agustina, L. (2010). The effect of budget participation, information
asymmetry and job relevant information on budget slack. Accounting Journal, 2(2),
101-121.
Eisenhardt, K. M. (1989). Agency theory: An assessment and review. Academy of
management review, 14(1), 57-74.
Eker, M., & Üniversitesi, U. (2006). The impact of budget participation on managerial
performance via organizational commitment: A study on the top 500 firms in
Turkey. Ankara Universitesi SBF Dergisi, 118-136.
Eker, Melek. (2008). The affect of the relationship between budget participation and
job-relevan information on managerial performance. Ege Academic Review. 8 (1),
183-198.
Elizabeth, V. P. (2014). The effect of informasi asymmetry locus of control on the
relationship between budget participation and budget slack. E-Journal
Accountancy 6(2), 287-305.
Elmassri, M., & Harris, E. (2011). Rethinking budgetary slack as budget risk
management. Journal of Applied Accounting Research, 12(3), 278-293.
Emsley, D. (2001). Redesigning variance analysis for problem solving. Management
Accounting Research, 12(1), 21-40.
Epstein, M. J. (1996). Measuring corporate environmental performance. Irwin,
Chicago.
Evans III, J. H., Hannan, R. L., Krishnan, R., & Moser, D. V. (2001). Honesty in
managerial reporting. The Accounting Review, 76(4), 537-559.

214
Everitt, B. S., & Dunn, G. (1983). Advanced methods of data exploration and
modelling. London: Heinemann educational books.
Ezzamel, M., & Hart, H. (1987). Advanced management accounting: an organisational
emphasis. London: Cassell.
Falikhatun, F. (2007). Pengaruh Partisipasi Penganggaran terhadap Budgetary Slack
dengan Variabel Pemoderasi Ketidakpastian Lingkungan dan Kohesivitas
Kelompok. Jurnal Akuntansi dan Keuangan, 6(2), 207-221.
Fisher, J. (1995). Contingency-based research on management control systems:
categorization by level of complexity. Journal of accounting literature, 14, 24-53.
Fisher, J. G. (1998). Contingency theory, management control systems and firm
outcomes: past results and future directions. Behavioral Research in Accounting,
10, 47-64.
Flamholtz, E. G. (1983). Accounting, budgeting and control systems in their
organizational context: theoretical and empirical perspectives. Accounting,
Organizations and Society, 8(2), 153-169.
Flamholtz, E. G., Das, T. K., & Tsui, A. S. (1985). Toward an integrative framework
of organizational control. Accounting, Organizations and Society, 10(1), 35-50.
Frow, N., Marginson, D., & Ogden, S. (2005). Encouraging strategic behaviour while
maintaining management control: multi-functional project teams, budgets, and the
negotiation of shared accountabilities in contemporary enterprises. Management
Accounting Research, 16(3), 269-292.
Gamal Muhammad, (2001), Pengaruh interaksi partisipasi anggaran, informasi
asimetris dan penekanan anggaran terhadap budget slack (The interaction effect of
budget participation and information asymmetry on budget slack). Theses for
Master Degree Post Graduate Program Universitas Diponegoro.
Garrison, Ray; Eric Noreen; Peter Brewer; G. Chesley & Ray Carroll (2006)
Managerial Accounting, Mc Graw Hill Publisher.

215
Ghozali Imam., Yusfaningrum K., (2005), Analisis pengaruh partisipasi anggaran
terhadap kinerja manajerial melalui komitmen tujuan anggaran dan job relevan
information (JRI) sebagai variable intervening. Symposium Nasional Akuntansi
VIII.
Givindarajan, V. (1986). Decentralization, Strategy and Effectiveness of Strategy and
Business Units in Multi-Business Organizations. Academy of Management Review,
11, 844-856.
Gujarati, D. N. & Porter, D. C. (2009). Basic Econometrics. New Delhi. Mc Grow Hill
International Book company.
Hansen, D. R., & Mowen, M. M. (1997). Cost management: accounting and control
South Western College publishing, Cincinnati Ohio.
Hair, J., Black, W. C., Babin, B. J., & Anderson, R. E. (2010). Multivariate data
analysis (7th ed.). Upper saddle River, New Jersey: Pearson Education
International.
Hanifah, I. A. (2013). Cognitive effects in the relationship between budgetary
participation and job performance: A case study of manufacturing industry in
Banten, Indonesia. International Journal of Social Science and Humanity, 3(4).
Harris, E. & Elmassri, M. (2011). Rethinking budgetary slack as budget risk
management. Journal of Applied Accounting Research 12 (3), 278-293.
Harris, M., & Raviv, A. (1978). Some results on incentive contracts with applications
to education and employment, health insurance, and law enforcement. The
American economic review, 20-30.
Harvey, O and Ellen, M. (2012). Budget slack in the workplace: The effect of
employees’ ethical ideology predisposition. The 2012 Orlando International
Academic Conference, Orlando, Florida, USA.

216
Hayes, A.F. (2013). Introduction to mediation, moderation, and conditional process
analysis.
Henri, J. F. (2006). Management control systems and strategy: a resource-based
perspective. Accounting, Organizations and Society, 31(6), 529-558.
Hirst, M. K. (1983). Reliance on accounting performance measures, task uncertainty,
and dysfunctional behavior: Some extensions. Journal of Accounting Research,
596-605.
Hobson, J. L., Mellon, M. J., & Stevens, D. E. (2011). Determinants of moral judgments
regarding budgetary slack: An experimental examination of pay scheme and
personal values. Behavioral Research in Accounting, 23(1), 87-107.
Hofstede , Geer, H, (1968). The game of budget control. London, Taviastock: Assen,
Van Gorcum.
Hofstede (1980). Culture’s consequences : International differences in work related
values. Sage publications, Beverly Hills, CA.
Hopwood, A. G. (1972). An empirical study of the role of accounting data in
performance evaluation. Journal of Accounting Research, 10, 156-182.
Hopwood, A. G. (1974). Leadership climate and the use of accounting data in
performance evaluation. Accounting Review, 485-495.
Horngren, C.T., Bhimani, A., Datar, S.M. & Foster, G. (2008), Management and cost
accounting, Pearson Education.
Huang, C.L., & Chen, M.L (2009). The effect of attitudes towards the budgetary
process on attitudes towards budgetary slack and behaviors to create budgetary
slack. Social Behavior and Personality. 37 (5) 661-671.
Hughes, M. A. & Kwon, S. Y. (1990). An integrative framework for theory construction
and testing . Accounting Organizations and Society, 15, 179-191.

217
Indonesian Commercial Newsletter (ICN, December, 2009). Prospects of
manufacturing industry 2010.
Ittner, C. D., & Larcker, D. F. (1998). Innovations in performance measurement: Trends
and research implications. Journal of Management Accounting Research, 10, 205–
238.
Jensen, M. C., & Meckling, W. H. (1979). Theory of the firm: Managerial behavior,
agency costs, and ownership structure. Journal of Fincial Economics, 163-231
Jensen, M. C., & Meckling, W. H. (2000). The theory of the firm: managerial
behavior, agency costs and ownership structure. Theory of the Firm, Bd, 1, 248-
306.
Jaworski, B. J., & Young, S. M. (1992). Dysfunctional behavior and management
control: an empirical study of marketing managers. Accounting, Organizations and
Society, 17(1), 17-35.
Jobber, D. (1989). An examination of the effects of questionnaire factors on response
to an industrial mail survey. International Journal of Research in Marketing, 6(2),
129-140.
Kato, Y., Boer, G., & Chow, C. W. (1995). Target costing: an integrative management
process. Journal of Cost Management, 9(1), 39-51.
Kim, D. C. (1992). Risk preferences in participative budgeting. Accounting Review, 67,
303-318.
Kim, J. S., Kaye, J., & Wright, L. K. (2001). Moderating and mediating effects in
causal models. Issues in Mental Health Nursing, 22(1), 63-75.
Kenis, I. (1979). Effects of budgetary goal characteristics on managerial attitudes and
performance. Accounting Review, 54(4), 707-721.
Kilfoyle, E., & Richardson, A. J. (2011). Agency and structure in budgeting: thesis,
antithesis and synthesis. Critical Perspectives on Accounting, 22(2), 183-199.
218
Kim, J.-O. (1975). Factor analysis. In N.H. Nie, C. H. Hull, J. G. Jenkins, K.
Steinbrenner & D. H. Bent (Eds.), SPSS: Statistical Package for the Social Sciences
(pp.468-514.). New York, etc.: Mc Graw Hill.
Kirby, A. J., Reichelstein, S., Sen, P. K., & Paik, T. Y. (1991). Participation, slack, and
budget-based performance evaluation. Journal of Accounting Research, 109-128.
Kren, L., & Kerr, J. L. (1993). The effect of behaviour monitoring and uncertainty on
the use of performance-contingent compensation. Accounting and Business
Research, 23(90), 159-167.
Kren, L. (1997) The role of accounting information in organizational control: The state
of the art, in Arnold, V. & Sutton, S.G. (ads) Behavioral accounting research:
Foundations and frontiers, American Accounting Association, Sarasota.
Kren, L. (2003). Effects of uncertainty, participation, and control system monitoring on
the propensity to create budget slack and actual budget slack created. Advances in
Management Accounting, 11, 143-167.
Krishnan, R., Marinich, E., & Shields, M. D. (2012, June). Participative budgeting,
psychological contracts, and honesty of communication. AAA.
Kristianto, Dj. (2009) Pengaruh Informasi Asymmetry dan Budget Emphasis sebagai
variable Moderating Terhadap Hubungan Antara Budgetary Participation dan
Budgetary Slack. Journal Manajemen Sumberdaya Manusia. Vol 3(2)
Lal, M., Dunk, A. S., & Smith, G. D. (1996). The propensity of managers to create
budgetary slack: A cross-national re-examination using random sampling. The
International Journal of Accounting, 31(4), 483-496.
Landfield-Smith, K. (2007). A review of quantitative research in management control
system and strategy, in Chapman, C.S., Hopwood, A.G., and Shield, M.D.
Handbook of Management Accounting Research, 2, 753-783.

219
Langevin A, P., & Mendoza C. (2013). How can management control system fairness
reduce managers unethical behaviours. European Management Journal, 31, 209-
222.
Latuheru, B.T, (2005). Pengaruh partisipasi anggaran terhadap senjangan anggaran
dengan komitmen organisasi sebagai variabel moderating (The effect of budget
participation on budget slack with organizational commitment as moderating
variable). Jurnal Akuntansi dan Keuangan. 117-130.
Lau, C. M, (1999). The effects of emphasis on tigh budget targets and cost control on
production anf marketing managers’ propensity to create slack. Br. Account. Rev.,
31(4), 415-437.
Lau, C.M., & Tan,S. L.C. (2006). The effects of procedural fairnessand interpersonal
trust on job tension in budgeting. Management Accounting Research.
Libby, T. (1999). The influence of voice and explanation on performance in a
participative budgeting setting. Accounting, Organizations and Society, 24(2), 125-
137.
Little, H. T., Magner, N. R., & Welker, R. B. (2002). The Fairness of Formal Budgetary
Procedures and Their Enactment Relationships with Managers’ Behavior. Group
& Organization Management, 27(2), 209-225.
Linn, G., Casey, K. M., Johnson, G. H., & Ellis, T. S. (2001). Do broad scope
managerial accounting systems moderate the effects of budget emphasis, budget
participation and perceived environmental uncertainty on the propensity to create
budgetary slack? Journal of Computer Information Systems, 42(1), 90-96.
Leach-López, M. A., Stammerjohan, W. W., & McNair, F. M. (2007). Differences in
the role of job-relevant information in the budget participation-performance
relationship among US and Mexican managers: a question of culture or
communication. Journal of Management Accounting Research, 19(1), 105-136.
Lowe, E. A., & Shaw, R. W. (1968). An analysis of managerial biasing: Evidence from
a company's budgeting process. Journal of Management Studies, 5(3), 304-315.

220
Lukka, K. (1988). Budgetary biasing in organizations: theoretical framework and
empirical evidence. Accounting, Organizations and Society, 13(3), 281-301.
Macintosh, N. B. (1985). Social software of accounting and information systems. John
Wiley & Sons, Inc.
Magner, N., Welker, R. B., & Campbell, T. L. (1996). Testing a model of cognitive
budgetary participation processes in a latent variable structural equations
framework. Accounting and Business Research, 27(1), 41-50.
Maiga, A. S., & Jacobs, F. (2007). Budget participation's influence on budget slack the
role of fairness perceptions, trust and goal commitment. Journal of Applied
Management Accounting Research.
Maiga, A. S. & Jacobs, F. A. (2008). Moderating Effect of Manager’s Ethical Judgment
on the relationship between budget participation and budget slack. Advances in
Accounting, 23, 113– 145
Maksum, A. (2009). Peran ketidakpastian lingkungan dan karakter personal dalam
memoderasi pengaruh partisipasi anggaran terhadap senjangan anggaran. Jurnal
Keuangan & Bisnis Program Studi Magister Manajemen Sekolah Tinggi Ilmu
Ekonomi Harapan, 1(1), 1-17.
Malmi, T., & Brown, D. A. (2008). Management control systems as a package-
Opportunities, challenges and research directions. Management accounting
research, 19(4), 287-300.
March, J. G. (1988). Decisions and organizations (p. 15). Oxford: Blackwell.
Marginson, D. E. (2002). Management control systems and their effects on strategy
formation at middle‐management levels: evidence from a UK organization.
Strategic management journal, 23(11), 1019-1031.
Matteson, M. T., Ivancevich, J. M., & Smith, S. V. (1984). Relation of Type A behavior
to performance and satisfaction among sales personnel. Journal of Vocational
Behavior, 25(2), 203-214.

221
Merchant, K. A. (1981). The design of the corporate budgeting system: influences on
managerial behavior and performance. Accounting Review, 813-829.
Merchant, K. A. (1985). Organizational controls and discretionary program decision
making: a field study. Accounting, Organizations and Society, 10(1), 67-85.
Merchant, K. A. (1985). Budgeting and the propensity to create budgetary slack.
Accounting, Organizations and Society, 10(2), 201-210.
Merchant, K. A. (1998). Modern management control systems: text and cases (p. 851).
Upper Saddle River: Prentice Hall.
Merchant, K. A. (1990). The effects of financial controls on data manipulation and
management myopia. Accounting, Organizations and Society, 15(4), 297-313.
Merchant, K. A. (1997). Modern management control systems: Prentice Hall.
Merchant, K. A. & Manzoni, J-F (1989). The achievability of budget targets in profit
centers : A field study. The Accounting Review, 1(3)
Merchant, K. A. and Van der Stede, W.A. (2003). MCS, performance measurement,
evaluation and incentives. Harlow, England; New York: FT Prentice Hall.
Merchant, K. A. and Otley, D.T, (2007). MCS: Performance measurement, evaluation
and incentives, 2nd ed,. Prentice Hall.
Milani, K. (1975). The relationship of participation in budget-setting to industrial
supervisor performance and attitudes: A field study. Accounting Review, 274-284.
Mohamed, R. (2011). Strategic performance measurement system, organisational
capabilities and organisation competitive advantage: using levers of control
framework (Doctoral dissertation, Universiti Teknologi MARA).
Murray, D. (1990). The performance effects of participative budgeting: An integration
of intervening and moderating variables. Behavioral Research in Accounting, 2(2),
104-123.

222
Naranjo-Gil, D., & Hartmann, F. (2007). Management accounting systems, top
management team heterogeneity and strategic change. Accounting, Organizations
and Society, 32(7), 735-756.
Norman, R. (2001). Letting and making managers manage: the effect of control systems
on management action in New Zealand’s central government. International Public
Management Journal, 4(1), 65-89.
Nota Keuangan dan Rancangan Anggaran Pendapatan dan Belanja Negara, Republik
Indonesia, tahun Anggaran 2014.
Nouri, H. (1994). Using organizational commitment and job involment to predict
budgetary slack: A research note. Accounting, Organizations and Society, 19(3),
289-295.
Nouri, H., & Parker, R. J. (1996). The effect of organizational commitment on the
relation between budgetary participation and budgetary slack. Behavioral
Research in Accounting, 8, 74-90.
Nouri, H., & Parker, R. J. (1998). The relationship between budget participation and
job performance: The roles of budget adequacy and organizational
commitment. Accounting, Organizations and Society, 23(5), 467-483.
Nunnaly, J. C. (1978). Psychometric theory (2nd ed.). New York: McGraw Hill.
Nur Afiani, D., Syafruddin, M. (2010). Pengaruh partisipasi anggara, penekanan
anggaran dan asimetri informasi terhadap senjangan anggran pada instansi
pemerintah daerah (studi pada pemerintah daerah Kabupaten Semarang). Doctoral
dissertation, Universitas Diponegoro.
Nur, I. (1993). The Effect of Participative Budgeting on Job Performance and Job
Satisfaction with Locus of Control & Cultur Dimension as Moderating Variable
(Doctoral dissertation, Dissertation).
Oktorina, M., & Soenarno, Y. N. (2013). Effect of Budget Participation, Budget
Emphasis, and Fairness Perception on the Budgetary Slack with Managerial
223
Trustworthy Behavior as Moderating Variable at Manufacturing Company in
Jakarta.
Omobola, A. (2013). The influence of organizational culture and budgetary
participation on propensity to create budgetary slack in public sector organizations
: British Journal of Arts and Social Science, 13(1).
Onsi, M. (1973). Factor analysis of behavioral variables affecting budgetary slack. The
Accounting Review, 48, 535-548.
O’Reilly, C.a. & Chatman, J. A. (1996). Culture as a social control: corporations,
culture and commitment. In B.M. Staw & L. L. Cummings (ads.). research in
organizational Behaviour, 18, 157-200.
Otley, DT. (1978). Budget use and managerial performance. Journal of Accounting
Research. 16(1), 122-149.
Otley, D. T. (1980). The contingency theory of management accounting: achievement
and prognosis. Accounting, Organizations and Society, 5(4), 413-428.
Otley, D. T. (1985). The accuracy of budgetary estimates: Some statistical
evidence. Journal of Business Finance & Accounting, 12(3), 415-428.
Otley, D., Broadbent, J., & Berry, A. (1995). Research in Management Control: An
Overview of Its Development. Paper presented at the The International
Management Accounting Conference, Universiti Kebangsaan Malaysia.
Otley, D. (1999). Performance management: a framework for management control
systems research. Management accounting research, 10(4), 363-382.
Otley, D., & Tessier, S. (2012). A conceptual development of Simons’ levers of control
framework. Management Accounting Reseach, 23, 241-258.
Pallant, J. (2001). SPSS survival manual: A step-by-step guide to data analysis using
SPSS for Windows (Version 10). Allen & Unwin.

224
Parker, R. J., & Kyj, L. (2006). Vertical information sharing in the budgeting
process. Accounting, Organizations and Society, 31(1), 27-45.
Pearce, J. A., & David, F. (1987). Corporate mission statements: The bottom line. The
Academy of Management Executive, 1(2), 109-115.
Penno, M. (1984). Asymmetry of pre-decision information and managerial
accounting. Journal of Accounting Research, 22, 177-191.
Perera, S., Harrison, G., & Poole, M. (1997). Customer-focused manufacturing strategy
and the use of operations-based non-financial performance measures: a research
note. Accounting, Organizations and Society, 22(6), 557-572.
Putranto, Y.A. (2012). The Moderating effect of Information Asymmetry and Group
Cohesiveness on the Relationship between Budget Participation and Budget slack.
Journal of Economia, 8, no, 2.
Rachman, A.A. (2012). The Influence of Budgetray Participation on Budgetary Slack:
The Role of Organizational Fairness, Managerial Trust, and Budget Goal
Commitment. DOI: 10.7763/IPDR. 2012. V50.16.
Ramden, C., Santos, J., & Chatfield, H. K (2007). An exanimation of impact of
budgetary participation, budget emphasis and information asymmetry on
budgetary slack in the hotel industry. [email protected].
Roberts, J. (1990). Strategy and accounting in a UK conglomerate. Accounting,
Organizations and Society, 15(1), 107-126.
Rodgers, R., & Joyce, P. (1996). The effect of under forecasting on the accuracy of
revenue forecasts by state governments. Public Administration Review 56(1): 48–
56. http://dx.doi.org/10.2307/3110053
Roscoe, J. T. (1975). Fundamental Statistics for the Behavioural Science. New York:
Holt.

225
Ross, A. (1994). Trust as a moderator of the effect of performance evaluation style on
job-related tension: a research note. Accounting, Organizations and Society, 19(7),
629-635.
Rousseau, D. M. (1990). Organizational culture: The case for multiple methods. In B.
Schneider (Ed), Organizational Culture and Leadership. San Fransisco: Jossey-
Bass.
Sekaran, U. (2000). Research methods for business: A skill building approach (4thed).
New York: John Wiley.
Sekaran, U. (2003). Research methods for business: A skill building approach (4thed).
New York: John Wiley.
Sekaran, U. (2006). Research methods for business: A skill building approach (4thed).
New Delhi: Wiley India.
Sekaran, U., & Bougie, R. (2010). Research methods for business: A skill building
approach. Wiley.
Sandelin, M. (2008). Operation of management control practices as a package A case
study on control system variety in a growth firm context. Management Accounting
Research, 19(4), 324-343. .
Schiff, M., & Lewin, A. Y. (1968). Where traditional budgeting fails. Financial
executive, 36(5), 51-62.
Schiff, M., & Lewin, A. Y. (1970). The impact of people on budgets. Accounting
Review, 259-268.
Schaltegger, S., Burritt, R., & Petersen, H. (2003). An introduction to corporate
environmental management: Striving for sustainability. Sheffiled. UK: Greenleaf
Publishing Limited.
Siegel, G., & Marconi, H. R. (1989). Behaviorial Accounting, Cincinnati, Ohio : South
– Western Publishing Co.

226
Shields, J.F., & Shields, M.D. (1998). Antecedents of participative budgeting.
Accounting, Organizations and Society, 23 (1): 49-76
Shields, J. F., & Young, S.M, (1993). Antecedents and consequences of participate
budgeting : Evidence on the effects of information asymmetry, Journal of
Management Accounting Research: 5, 265-280.
Sholihin, M., Pike, R., Mangena, M., & Li, J. (2011). Goal-setting participation and
goal commitment: Examining the mediating roles of procedural fairness and
interpersonal trust in a UK financial services organisation. The British Accounting
Review, 43(2), 135-146.
Simon, H. A. (1951). A formal theory of the employment relationship. Econometrica:
Journal of the Econometric Society, 293-305.
Simons, R. (1987). Accounting control system and business strategy: An empirical
Analysis. Accounting, Organization and Society, 12(4), 357-374.
Simons, R. (1990). The role of management control systems in creating competitive
advantage: new perspectives. Accounting, organizations and society, 15(1), 127-
143.
Simons, R. (1991). Strategic orientation and top management attention to control
systems. Strategic Management Journal, 12(1), 49-62.
Simons, R. (1995). Levers of control: how managers use innovative control systems to
drive strategic renewal. Boston, MA: Harvard Business School Press.
Simons, R. (1997). Administrative Behavior: A study of division Making Process in
Administrative Organization (4th ed.) The free Press: New York.
Simons, R (2000). Performance measurement and control systems for implementing
strategy. Upper Saddle River, NJ: Prentice Hall.

227
Snell, S.A. & Dean, J. W. Jr. (1992). Integrated manufacturing an human resource
management: A human capital perspective. Academy of Management Journal, 35:
467-5.
Soebaroyen, T (2005). MCS and dysfunctional behavior: An empirical investigation.
Research Paper 2005-10 School of Management and Business, University of
Wales, United Kingdom
Speklé, R. F. (2001). Explaining management control structure variety: a transaction
cost economics perspective. Accounting, Organizations and Society, 26(4), 419-
441.
Stevens, D. E. (2002). The effects of reputation and ethics on budgetary slack.Journal
of Management Accounting Research, 14(1), 153-171.
Suhartono, Ehrmann, & Mochammad Solichin, (2007), Pengaruh kejelasan sasaran
anggaran terhadap senjangan anggaran instansi pemerintah daerah dengan
komitmen organisasi sebagai pemoderasi. Simposium Nasional Akuntansi (SNA)
X, Makassar.
Sujana, I. K. (2010). Pengaruh Partisipasi Penganggaran, Penekanan Anggaran,
Komitmen Organisasi, Asimetri Informasi, dan Ketidakpastian Lingkungan
terhadap Budgetary Slack pada Hotel-Hotel Berbintang di Kota Denpasar. Jurnal
Ilmiah Akuntansi dan Bisnis, 5(2).
Sulaiman, M., & Adnan, M., (2005) Does Islam influence budgetary slack creation ?.
Empirical evidence from Malaysia. Conference on emergency issues in accounting
business and technologies.
Sulaiman, M., and Mohamed Adnan, S. (2007) Organizational, cultural and religious
factors of budgetary slack creation: Empirical evidence from Malaysia.
International Review of Business Research Papers, 3 (3), 17-34.
Supanto, S. (2010). Analisis pengaruh partisispasi penganggaran terhadap budgetary
slack dengan informasi asimetri, motivasi, budaya organisasi sebagai pemoderasi
(Doctoral dissertation, Diponegoro University).

228
Tabachnick, G. B., & Fidell, L. S. (2007). Using multivariate statistics (5th ed.).Boston:
Pearson.
Tanase, G, L., (2013). An overall analysis of participatory budgeting advantages and
essential factors for an effective implementation in economic entities. Journal of
Eastern Europe Research in Business and Economics.
Tay Su and Ling Lin, (2002a). The impact of information asymmetry and budget
emphasis on budgetary participation and slack, Department of Finance, Southern
Taiwan University of Technology.
Tiessen, P., & Waterhouse J. H. (1983). Towards a descriptive theory at management
accounting. Accounting Organizations and Society. 8 (2-3), 251-267.
Triana, M., Yuliusman, Putra. W.E. (2012). Pengaruh partisipasi anggaran, budget
emphasis dan locus of control terhadap budget slack. E-Journal Binar Akuntansi,
1 (1).
Tuomela, T. S. (2005). The interplay of different levers of control: A case study of
introducing a new performance measurement system. Management Accounting
Research, 16(3), 293-320.
Utami, Pramuditha (2011). Pengaruh Kerja LOC, Pembelajaran Organisasi Internal dan
Eksternal Terhadap Hasil Akhir Strategi Kompetitif. Universitas Sultan Ageng
Tirtayasa.
Utami, R. F. S (2013). Pengaruh interaksi budaya organisasi dan group cohesiveness
dalam hubungan antara partisipasi anggaran dan senjangan anggaran. Journal
Accounting.(1).
Van der Stede, W. A. (2000). The relationship between two consequences of budgetary
controls: budgetary slack creation and managerial short-term orientation.
Accounting, Organizations and Society, 25(6), 609-622.

229
Van der Stede, W.A, Hansen, S.C, Otley, D.T. (2003), Practice developments in
budgeting: An overview and research perspective. Journal of Management
Accounting Research,15, 95-116.
Walker, K.B., & E.N., Johnson, (1999). The effect of budget–based incentive
compensation scheme, on the budgeting behavior of managers and subordinates,
Journal of Management Accounting Research, 11, 1-27.
Waller, W.S. 1988, Slack in Participative Budgeting. The Joint Effect of a Truth-
Inducing Pay Scheme and Risk Preferences. Accounting, Organizations and
Society, 13, 87-98.
Widener, S. K. (2007). An empirical analysis of the levers of control framework.
Accounting, Organizations and Society, 32(7), 757-788.
Welsh Glenn A., Hilton Ronald W., & Gordon Paul N.(1988). Budgeting: Profit
Planning and Control, 5th ed. Englewood Cliffs : Prentice-Hall.
Wouters, M., & Wilderom, C. (2008). Developing performance-measurement systems
as enabling formalization: a longitudinal field study of a logistics
department. Accounting, Organizations and Society, 33(4), 488-516.
Yang, M., Wang, A. M., & Cheng, K. (2009). The impact of quality of IS information
and budget slack on innovation performance. Technovation, 29 527–536
Yilmaz, E. (2011). The effects of environmental uncertainty and budgetary control
effectiveness on propensity to create budgetary slack in public sector African.
Journal of Business Management, 5(22), 8902-8908.
Young, S. M. (1985). Participative budgeting: The effects of risk aversion and
asymmetric information on budgetary slack. Journal of accounting research,
23(2), 829-842.
Young, S.M & B. Lewis (1995). Experimental intensive contracting research in
management accounting. "In R. Ashton and A. Ashton (Ads) judgment and

230
decision making research in accounting and auditing, Cambridge, England,
Cambridge University Press, 55-75
Zhang, Y. (2008). The effects of perceived fairness and communication on honesty and
collusion in a multi-agent setting. The Accounting Review, 83(4), 1125-1146.
Zikmund, W. G. (2000). Business Research Methods (Sixth Ed.). Published by The
Dryden Press, Orlando, Florida, U.S.A.
Zimmerman, D. W.(1998). Invalidation of Parametric and Nonparametric statistical
tests by concurrent violation of two assumptions. Journal of Experimental
Education, 67, 55-68.

231
APPENDIX A
1. LETTERS
* Cover Letter
* First Reminder Letter
* Second Reminder Letter
2. QUESTIONNAIERS TO MANAGERS OF
INDONESIAN MANUFACTURING FIRMS
232
Dear Sir/Madam,
Regarding the study on “THE EFFECT OF MANAGEMENT CONTROL SYSTEM
ON THE RELATIONSHIP BETWEEN BUDGET PARTICIPATION AND BUDGET
SLACK” for my dissertation at the College of Business, Universiti Utara Malaysia,
herewith I would like to ask for permission for data collection in your company. This
study will involve the managers of manufacturer companies in Indonesia.
Attached is the certification letter of data collection from the Dean of Business
Universiti Utara Malaysia. The study will bring benefit to the budgeting process and
the application of controlling management system of a company in Indonesia.
The detail of the respondents will be kept confidential. The data will be collected
through questionnaires that will reveal the perception of the managers of the company.
Therefore, the data will be used for academic purpose solely. The data will be analyzed
and presented cumulatively in the dissertation, thus the data will only show the
accumulated managerial companies that participate in the study. The summary of the
findings of the study will be presented to the participants as well.
According to result of the questionnaire’s pretesting showed that the questionnaire will
require not more than 30 minutes. The questionnaires will be distributed and collected
by the researcher at the latest June 25, 2012. Your participation will be highly
appreciated. If you have any questions related to the study, please do not hesitate to
contact me through email or phone below. Thank you for your assistance.
Kind regards,
Masnawaty Sangkala
Phone : 082187515141
Email : [email protected]
Othman Yeob Abdullah School of Business
Universiti Utara Malaysia 06010, Sintok Kedah Darul Aman,
Malaysia Tel : (604) 9283902 Fax : (604) 9285220
Website: www.oyagsb.uum.edu.my

233
Dear Participants,
Last week a questionnaire seeking your opinions about management control system was
mailed to you. Your name was choosen from a list of people that hold a key position in
the company.
If you have already completed and returned the questionnaire to us, please accept our
sincere thanks. If not, please complete and return the questionnaire today. We are
especially thankful for your assistance because it is only by asking people like you to
share your experience that we can understand the importance of management control
system and how it can assist on the relationship between budget participation and
budget slack.
If you did not receive a questionnaire, or if it was misplaced, please email to us at
[email protected], or may call at +6282187515141 and we will get another one
in the mail to you today.
Thank you very much for helping with this important study.
Sincerely,
Masnawaty Sangkala
PhD Student
School of Accounting
Universiti Utara Malaysia
06010 Sintok
Kedah Darul Aman

234
Dear participants
Re: We need your help
About a month ago we sent a questionnaire that ask your opinion about the effect of
management control system on the relationship between budget participation and
budget slack to you. To the best of our knowledge, it is not yet been returned.
We are writing again because it is very important to have your response in helping to
get accurate results. Although we sent questionnaire to managers of production,
managers of marketing, and managers of finance and accounting of every company
listed in Jakarta Stock Exchange, it is only by hearing from nearly everyone in the
sample that we can sure that the results are truly representative.
We understand that you are a busy person, but we are very appreciated if you can take
30 minutes of your time to answer the questionnaire. Your voluntary participation is
extremely important. We therefore encourage you to participate in this voluntary survey
by completing this questionnaire and help us to get accurate results.
A questionnaire of identification number is printed on the questionnaire so that we can
check your name off of the mailing list when it is returned. This will not affect the
confidentiality of your answer. Protecting the confidentiality of people’s answers is
very important to us as well as the university.
We hope that you will fill out and return the questionnaire soon, however, if for any
reasons you prefer not to answer it, please let us know by returning a blank
questionnaire in the enclosed stamped envelope so that we can delete your name from
the mailing list.
Sincerely,
Masnawaty Sangkala
PhD Student
School of Accounting
Universiti Utara Malaysia
06010 Sintok
Kedah Darul Aman

235
THE EFFECT OF MANAGEMENT CONTROL SYSTEM
ON THE RELATIONSHIP BETWEEN BUDGET
PARTICIPATION AND BUDGET SLACK
MASNAWATY SANGKALA
PHD STUDENT
SUPERVISORS
ASSOC PROF DR CHE ZURIANA BT MOHD JAMIL
ASSOC PROF DR HASNAH KAMARDIN
SCHOOL OF ACCOUNTING
UNIVERSITI UTARA MALAYSIA

236
Budget Participation Measure (Milani, 1975)
The following items can be used to describe the role which you play in
the development of the budget for your department. Please respond by
circling a number from 1 to 7 on the scale for each of the following
items.
(1) Which category below best describes your activity when the
budget is being set? I am involved in setting:
1 2 3 4 5 6 7
All of
the budget
None of
the
budget
(2) Which category below best describes the reasoning provided by
your superior when budget revisions are made? The reasoning is:
1 2 3 4 5 6 7
Very
sound
and/or
logical
Very
arbitrary
and/or
Illogical
(3) How often do you state your requests, opinions and/or
suggestions about the budget to your superior without being
asked?
1 2 3 4 5 6 7
Very
frequently
Never
(4) How much influence do you feel you have on the final budget?
1 2 3 4 5 6 7
Very high
amount
None

237
(5) How do you view your contribution to the budget? My contributions:
1 2 3 4 5 6 7
Very
important
Very
Unimpor2tant
(6) How often does your superior seek your requests, opinions and/or
suggestions when the budget is being set?
1 2 3 4 5 6 7
Very
frequently
Never
238
Interactive Control System Measure (Widener, 2007)
Please indicate the extent to which you agree or disagree with the
following statements (1=SD, 7=SA) based on the following scale:
1. Strongly disagree 5. Mildly agree
2. Moderately disagree 6. Moderately agree
3. Mildly disagree 7. Strongly agree
4. Neutral
(1) Manager pays little day-to-day attention on the budget
system.
1 2 3 4 5 6 7
Strongly
disagree
Strongly
agree
(2) Manager relies heavily on staff specialist in preparing and
interpreting information from the budget system.
1 2 3 4 5 6 7
Strongly
disagree
Strongly
agree
(3) Operating managers are involved infrequently and on an
exception basis with the budget system
1 2 3 4 5 6 7
Strongly
disagree
Strongly
agree
(4) Managers pay day-to-day attention to the budget system.
1 2 3 4 5 6 7
Strongly
disagree
Strongly
agree

239
(5) Managers interpret information from the budget system.
1 2 3 4 5 6 7
Strongly
disagree
Strongly
agree
(6) Operating managers are frequently involved with the budget system.
1 2 3 4 5 6 7
Strongly
disagree
Strongly
agree

240
Boundary Control System Measure (Widener, 2007)
Please rate the extent to which you agree or disagree with the following
(1=strongly disagree (SD), 7 strongly agree (SA) :
1. Strongly disagree 5. Mildly agree
2. Moderately disagree 6. Moderately agree
3. Mildly disagree 7. Strongly agree
4. Neutral
(1) Our firm relies on a code of business conduct to define
appropriate behavior for managers.
1 2 3 4 5 6 7
Strongly
disagree
Strongly
agree
(2) Our code of business conduct informs our managers about behaviors
that are off-limits.
1 2 3 4 5 6 7
Strongly
disagree
Strongly
agree
(3) Our firm has a system that communicates to our managers’ risks
that should be avoided.
1 2 3 4 5 6 7
Strongly
disagree
Strongly
agree
(4) Managers are aware of the firm’s code of business conduct.
1 2 3 4 5 6 7
Strongly
disagree
Strongly
agree

241
Diagnostic Control System Measure (Widener, 2007)
Please rate the extent to which your top manager currently rely currently
on budget measures based on the following scale (1=Small extent, 7=
Large extent):
(1) Track progress towards goals.
1 2 3 4 5 6 7
Small
extent
Large
extent
(2) Monitor results.
1 2 3 4 5 6 7
Small
extent
Large
extent
(3) Compare outcomes to expectation.
1 2 3 4 5 6 7
Small
extent
Large
extent
(4) Review key measures.
1 2 3 4 5 6 7
Small
extent
Large
extent
(5) Enable discussion in meeting of superiors, subordinates and
peers.
1 2 3 4 5 6 7
Small
extent
Large
extent

242
(6) Enable continual challenge and debate of underlying data,
assumption, and action plans.
1 2 3 4 5 6 7
Small
extent
Large
extent
(7) Provide a common view of the organization.
1 2 3 4 5 6 7
Small
extent
Large extent
(8) Tie the organization together.
1 2 3 4 5 6 7
Small
extent
Large
extent
(9) Enable the organization to focus on common issues.
1 2 3 4 5 6 7
Small
extent
Large
extent
(10) Enable the organization to focus on critical success factors.
1 2 3 4 5 6 7
Small
extent
Large
extent
(11) Develop a common vocabulary in the organization.
1 2 3 4 5 6 7
Small
extent
Large
extent

243
Belief Control System Measure (Widener, 2007)
Please indicate the extent to which the following items describe your
organization (1= not descriptive, 7= very descriptive):
(1) Our mission statement clearly communicates the firm’s
core values to our managers.
1 2 3 4 5 6 7
Not
descriptive
Very
descriptive
(2) Top managers communicate core values to our managers.
1 2 3 4 5 6 7
Not
descriptive
Very
descriptive
(3) Our managers are aware of the firm’s core values.
1 2 3 4 5 6 7
Not
descriptive
Very
descriptive
(4) Our mission statement inspires our managers.
1 2 3 4 5 6 7
Not
descriptive
Very
descriptive

244
Budget Slack Measure (Dunk, 1993)
The following statements relate to the budgetary environment in which
you work. Please indicate the extent of your agreement with each
statement by circling a number from 1 to 7, based on the following scale:
1. Strong disagree 5. Mildly agree
2. Moderately disagree 6. Moderately agree
3. Mildly disagree 7. Strongly agree
4. Neutral
(1) Standards set in the budget induce high productivity in my area
of responsibility.
1 2 3 4 5 6 7
Strongly
disagree
Strongly
agree
(2) Budgets set for my area of responsibility are safely attainable.
1 2 3 4 5 6 7
Strongly
disagree
Strongly
agree
(3) I have to carefully monitor costs in my area of responsibility
because of budgetary constraints
1 2 3 4 5 6 7
Strongly
disagree
Strongly
agree
(4) Budget for my area of responsibility is not particularly demanding.
1 2 3 4 5 6 7
Strongly
disagree
Strongly
agree

245
(5) Budgetary targets have not caused me to be particularly concerned with
improving efficiency in my area of responsibility.
1 2 3 4 5 6 7
Strongly
disagree
Strongly
agree
(6) Targets incorporated in the budget are difficult to reach.
1 2 3 4 5 6 7
Strongly
disagree
Strongly
agree

246
Demographics Questions
Please answer the following questions:
1. Age:_________
2. Gender: [ ] Male [ ] Female
3. Religion:
Islam Buddha
Kristen Others
Hindu
4. Ethnic :_______________________( please state, e.g. java, batak, bugis, etc.)
5. Position in the company: ____________________________________________
6. Length of time in the current position: ____years
7. Length of time you work for the company:____years
8. Length of time you work in Jakarta:____years
9. Educational background:
Diploma PhD
Degree Others
Master
10. Citizenship :_________________________________( please state )
11. In the company how many levels are above you?
Please tick ( )
You report directly to the director of the company
The person you report to is directly at the level below the director of the
company
The person you report to is 2 level below the director of the company
The person you report to Is 3 level below the director of the company
The person you report to is 4 level below the director of the company

247
12. Total numbers of employee in the company
1 - 25 26 - 100 101 - 1000 1001 - 10.000
10.000-50.000 more than 50.000
13 .Type of Business (Please tick)
Food and Beverages
Tobacco Manufacturers
Textile Mill Product
Apparel and other Textile Products
Lumber and Wood Products
Paper and Allied Products
Chemical and Allied Products
Adhesive
Plastics and Glass Products
Cement
Metal and Allied Products
Fabricated Metal Products
Stone, Clay, Glass and Concrete Products
Cables
Electronic and Office Equipment
Automotive and Allied Products
Photographic Equipment
Pharmaceuticals
Consumer Goods
Others ………………………………. (Please State)

248
14. Department / Function (please tick)
Accounting/Finance Manager
Production/Operation Manager
Marketing Manager
PLEASE PUT THE COMPANY STAMP HERE:

249
APPENDIX B
TEST OF NON-RESPONSE BIAS

250
T-Test
Group Statistics
BIAS N Mean Std. Deviation Std. Error Mean
ICS Non Late 100 3.3450 .63177 .06318
late 40 3.2750 .49721 .07862
BP Non Late 100 6.0933 .85816 .08582
late 40 6.1000 .82586 .13058
DCS Non Late 100 5.9882 .86954 .08695
late 40 6.0727 .55017 .08699
BCS Non Late 100 6.1950 .61297 .06130
late 40 6.0813 .56723 .08969
BLFCS Non Late 100 6.2850 .73942 .07394
late 40 6.2063 .63014 .09963
BS Non Late 100 4.3067 .62752 .06275
late 40 4.1375 .46053 .07282

251
Independent Samples Test
Levene's Test
for Equality of
Variances t-test for Equality of Means
F Sig. t df
Sig. (2-
tailed)
Mean
Differenc
e
Std. Error
Difference
95% Confidence
Interval of the
Difference
Lower Upper
ICS Equal variances
assumed
2.047 .155 .627 138 .532 .07000 .11166 -.15078 .29078
Equal variances
not assumed
.694 90.730 .489 .07000 .10086 -.13035 .27035
BP Equal variances
assumed
.742 .390 -.042 138 .967 -.00667 .15886 -.32079 .30745
Equal variances
not assumed
-.043 74.489 .966 -.00667 .15625 -.31798 .30464
DCS Equal variances
assumed
3.413 .067 -.570 138 .569 -.08455 .14825 -.37768 .20859
Equal variances
not assumed
-.687 111.87
3
.493 -.08455 .12300 -.32825 .15916
BCS Equal variances
assumed
.001 .975 1.013 138 .313 .11375 .11232 -.10835 .33585
Equal variances
not assumed
1.047 77.299 .298 .11375 .10863 -.10255 .33005
BLFCS Equal variances
assumed
.913 .341 .593 138 .554 .07875 .13287 -.18398 .34148
Equal variances
not assumed
.635 83.779 .527 .07875 .12407 -.16799 .32549
BS Equal variances
assumed
3.490 .064 1.545 138 .125 .16917 .10948 -.04730 .38564
Equal variances
not assumed
1.760 97.298 .082 .16917 .09613 -.02161 .35994

252
APPENDIX C
FACTOR ANALYSIS RESULTS

253
Factor Analysis for Budget Participation
KMO and Bartlett's Test
Kaiser-Meyer-Olkin Measure of Sampling Adequacy. .914
Bartlett's Test of Sphericity Approx. Chi-Square 545.218
Df 15
Sig. .000
Communalities
Initial Extraction
BP1 1.000 .734
BP2 1.000 .752
BP3 1.000 .644
BP4 1.000 .675
BP5 1.000 .662
BP6 1.000 .795
Extraction Method: Principal
Component Analysis.
Total Variance Explained
Component
Initial Eigenvalues Extraction Sums of Squared Loadings
Total % of Variance Cumulative % Total % of Variance Cumulative %
1 4.262 71.033 71.033 4.262 71.033 71.033
2 .483 8.056 79.089
3 .422 7.026 86.115
4 .305 5.077 91.192
5 .294 4.894 96.086
6 .235 3.914 100.000
Extraction Method: Principal Component Analysis.

254
Component Matrixa
Component
1
BP1 .857
BP2 .867
BP3 .802
BP4 .822
BP5 .814
BP6 .891
Extraction Method:
Principal Component
Analysis.
a. 1 components
extracted.

255
Factor Analysis for Interactive Control System
KMO and Bartlett's Test
Kaiser-Meyer-Olkin Measure of Sampling Adequacy. .900
Bartlett's Test of Sphericity Approx. Chi-Square 1244.422
Df 15
Sig. .000
Communalities
Initial Extraction
ICS1 1.000 .896
ICS2 1.000 .887
ICS3 1.000 .884
ICS4 1.000 .923
ICS5 1.000 .865
ICS6 1.000 .887
Extraction Method: Principal
Component Analysis.
Total Variance Explained
Component
Initial Eigenvalues Extraction Sums of Squared Loadings
Total % of Variance Cumulative % Total % of Variance Cumulative %
1 5.342 89.041 89.041 5.342 89.041 89.041
2 .243 4.050 93.092
3 .166 2.770 95.861
4 .110 1.829 97.690
5 .086 1.426 99.116
6 .053 .884 100.000
Extraction Method: Principal Component Analysis.

256
Component Matrixa
Component
1
ICS1 .947
ICS2 .942
ICS3 .940
ICS4 .961
ICS5 .930
ICS6 .942
Extraction Method:
Principal Component
Analysis.
a. 1 components
extracted.

257
Factor Analysis for Diagnostic Control System
KMO and Bartlett's Test
Kaiser-Meyer-Olkin Measure of Sampling Adequacy. .947
Bartlett's Test of Sphericity Approx. Chi-Square 1509.873
Df 55
Sig. .000
Communalities
Initial Extraction
DCS1 1.000 .774
DCS2 1.000 .760
DCS3 1.000 .767
DCS4 1.000 .705
DCS5 1.000 .711
DCS6 1.000 .738
DCS7 1.000 .814
DCS8 1.000 .764
DCS9 1.000 .682
DCS10 1.000 .640
DCS11 1.000 .564
Extraction Method: Principal
Component Analysis.
Total Variance Explained
Component
Initial Eigenvalues Extraction Sums of Squared Loadings
Total % of Variance Cumulative % Total % of Variance Cumulative %
1 7.919 71.988 71.988 7.919 71.988 71.988
2 .856 7.780 79.767
3 .416 3.779 83.547
4 .358 3.256 86.802
5 .287 2.612 89.414
6 .249 2.266 91.680
7 .232 2.113 93.793
8 .219 1.992 95.785
9 .177 1.606 97.391
10 .153 1.391 98.782
11 .134 1.218 100.000
Extraction Method: Principal Component Analysis.

258
Component Matrixa
Component
1
DCS1 .880
DCS2 .872
DCS3 .876
DCS4 .840
DCS5 .843
DCS6 .859
DCS7 .902
DCS8 .874
DCS9 .826
DCS10 .800
DCS11 .751
Extraction Method: Principal
Component Analysis.

259
Factor Analysis for Boundary Control System
KMO and Bartlett's Test
Kaiser-Meyer-Olkin Measure of Sampling Adequacy. .866
Bartlett's Test of Sphericity Approx. Chi-Square 678.572
Df 6
Sig. .000
Communalities
Initial Extraction
BCS1 1.000 .914
BCS2 1.000 .902
BCS3 1.000 .906
BCS4 1.000 .893
Extraction Method: Principal
Component Analysis.
Total Variance Explained
Component
Initial Eigenvalues Extraction Sums of Squared Loadings
Total % of Variance Cumulative % Total % of Variance Cumulative %
1 3.616 90.392 90.392 3.616 90.392 90.392
2 .171 4.282 94.674
3 .110 2.753 97.426
4 .103 2.574 100.000
Extraction Method: Principal Component Analysis.

260
Component
1
BCS1 .956
BCS2 .950
BCS3 .952
BCS4 .945
Extraction Method:
Principal Component
Analysis.
a. 1 components
extracted.

261
Factor Analysis for Belief Control System
KMO and Bartlett's Test
Kaiser-Meyer-Olkin Measure of Sampling Adequacy. .861
Bartlett's Test of Sphericity Approx. Chi-Square 634.533
Df 6
Sig. .000
Communalities
Initial Extraction
BLFS1 1.000 .899
BLFS2 1.000 .874
BLFS3 1.000 .904
BLFS4 1.000 .895
Extraction Method: Principal
Component Analysis.
Total Variance Explained
Component
Initial Eigenvalues Extraction Sums of Squared Loadings
Total % of Variance Cumulative % Total % of Variance Cumulative %
1 3.571 89.275 89.275 3.571 89.275 89.275
2 .176 4.392 93.667
3 .151 3.783 97.449
4 .102 2.551 100.000
Extraction Method: Principal Component Analysis.
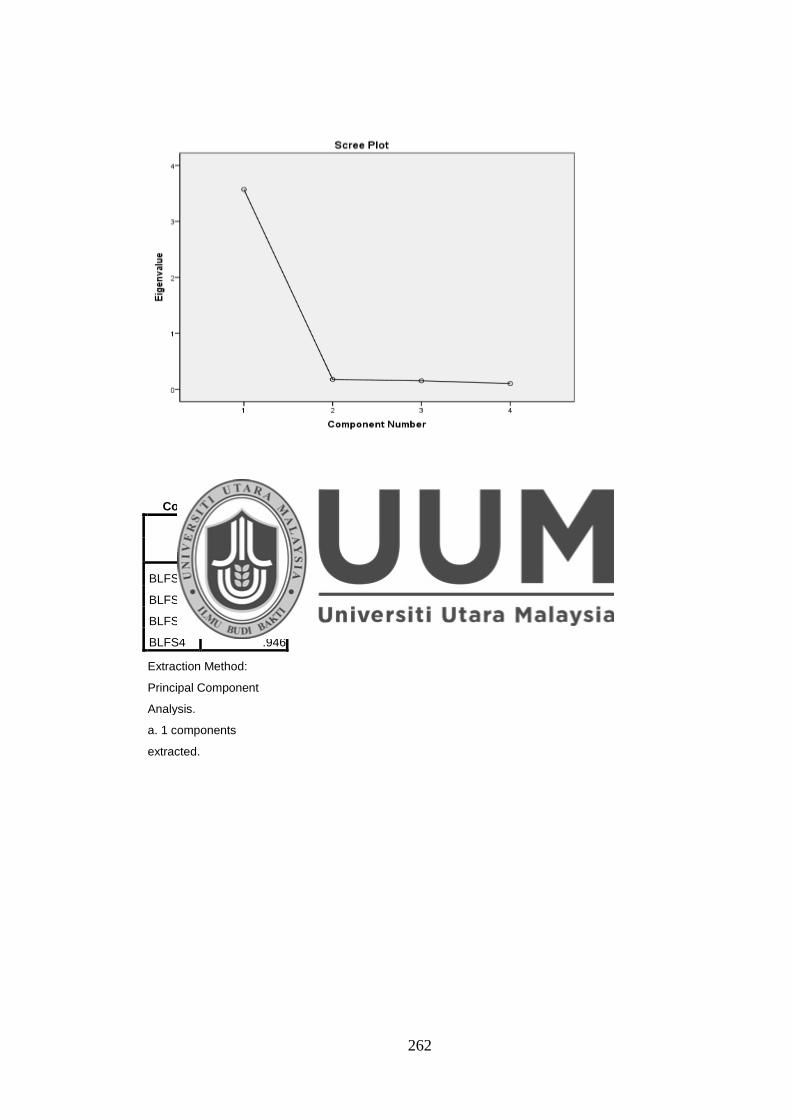
262
Component Matrixa
Component
1
BLFS1 .948
BLFS2 .935
BLFS3 .951
BLFS4 .946
Extraction Method:
Principal Component
Analysis.
a. 1 components
extracted.

263
Factor Analysis for Budget Slack
KMO and Bartlett's Test
Kaiser-Meyer-Olkin Measure of Sampling Adequacy. .924
Bartlett's Test of Sphericity Approx. Chi-Square 1204.212
Df 15
Sig. .000
Communalities
Initial Extraction
BS1 1.000 .877
BS2 1.000 .917
BS3 1.000 .894
BS4 1.000 .877
BS5 1.000 .878
BS6 1.000 .901
Extraction Method: Principal
Component Analysis.
Total Variance Explained
Component
Initial Eigenvalues Extraction Sums of Squared Loadings
Total % of Variance Cumulative % Total % of Variance Cumulative %
1 5.345 89.086 89.086 5.345 89.086 89.086
2 .212 3.540 92.626
3 .161 2.691 95.317
4 .113 1.886 97.203
5 .093 1.552 98.755
6 .075 1.245 100.000
Extraction Method: Principal Component Analysis.

264
Component Matrixa
Component
1
BS1 .937
BS2 .958
BS3 .946
BS4 .937
BS5 .937
BS6 .949
Extraction Method:
Principal Component
Analysis.
a. 1 components
extracted.

265
APPENDIX D
RELIABILITY RESULTS

266
Reliability scale for Budget Participation
Reliability Statistics
Cronbach's
Alpha
Cronbach's
Alpha Based on
Standardized
Items N of Items
.918 .918 6
Inter-Item Correlation Matrix
BP1 BP2 BP3 BP4 BP5 BP6
BP1 1.000 .678 .671 .671 .587 .718
BP2 .678 1.000 .627 .658 .676 .735
BP3 .671 .627 1.000 .572 .558 .645
BP4 .671 .658 .572 1.000 .582 .675
BP5 .587 .676 .558 .582 1.000 .717
BP6 .718 .735 .645 .675 .717 1.000
Summary Item Statistics
Mean Minimum Maximum Range
Maximum /
Minimum Variance N of Items
Item Means 5.856 5.757 6.043 .286 1.050 .010 6
Item Variances 1.259 1.154 1.394 .240 1.208 .007 6
Inter-Item Covariances .820 .679 .969 .290 1.426 .007 6
Inter-Item Correlations .651 .558 .735 .176 1.316 .003 6

267
Item-Total Statistics
Scale Mean if
Item Deleted
Scale Variance if
Item Deleted
Corrected Item-
Total Correlation
Squared Multiple
Correlation
Cronbach's
Alpha if Item
Deleted
BP1 29.0929 22.056 .786 .636 .901
BP2 29.3786 22.654 .800 .644 .899
BP3 29.3357 23.534 .717 .529 .910
BP4 29.2929 23.058 .740 .559 .907
BP5 29.3357 22.958 .729 .570 .909
BP6 29.2429 21.941 .833 .701 .894
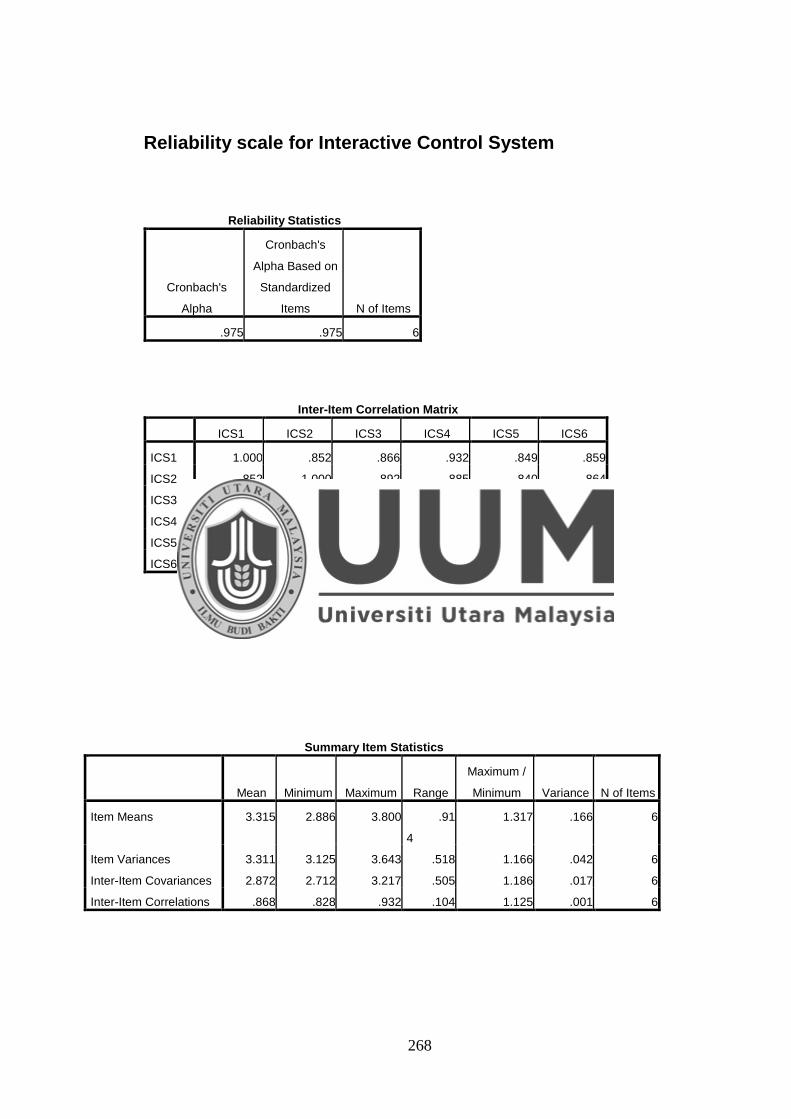
268
Reliability scale for Interactive Control System
Reliability Statistics
Cronbach's
Alpha
Cronbach's
Alpha Based on
Standardized
Items N of Items
.975 .975 6
Inter-Item Correlation Matrix
ICS1 ICS2 ICS3 ICS4 ICS5 ICS6
ICS1 1.000 .852 .866 .932 .849 .859
ICS2 .852 1.000 .892 .885 .840 .864
ICS3 .866 .892 1.000 .908 .828 .829
ICS4 .932 .885 .908 1.000 .840 .872
ICS5 .849 .840 .828 .840 1.000 .910
ICS6 .859 .864 .829 .872 .910 1.000
Summary Item Statistics
Mean Minimum Maximum Range
Maximum /
Minimum Variance N of Items
Item Means 3.315 2.886 3.800 .91
4
1.317 .166 6
Item Variances 3.311 3.125 3.643 .518 1.166 .042 6
Inter-Item Covariances 2.872 2.712 3.217 .505 1.186 .017 6
Inter-Item Correlations .868 .828 .932 .104 1.125 .001 6

269
Item-Total Statistics
Scale Mean if
Item Deleted
Scale Variance if
Item Deleted
Corrected Item-
Total Correlation
Squared Multiple
Correlation
Cronbach's
Alpha if Item
Deleted
ICS1 16.9643 74.625 .922 .884 .970
ICS2 16.5429 73.847 .916 .852 .970
ICS3 16.7571 74.948 .913 .866 .971
ICS4 17.0071 74.022 .941 .918 .968
ICS5 16.1000 73.904 .900 .854 .972
ICS6 16.0929 72.560 .917 .876 .971
Reliability scale for Diagnostic Control System
Reliability Statistics
Cronbach's Alpha
Cronbach's Alpha
Based on
Standardized
Items N of Items
.960 .961 11
Inter-Item Correlation Matrix
DCS1 DCS2 DCS3 DCS4 DCS5 DCS6 DCS7 DCS8 DCS9 DCS10 DCS11
DCS1 1.000 .784 .764 .683 .770 .784 .768 .721 .708 .659 .535
DCS2 .784 1.000 .759 .772 .777 .788 .779 .716 .595 .586 .546
DCS3 .764 .759 1.000 .738 .708 .703 .812 .727 .653 .639 .651
DCS4 .683 .772 .738 1.000 .692 .742 .758 .696 .609 .560 .565
DCS5 .770 .777 .708 .692 1.000 .751 .766 .685 .612 .583 .493
DCS6 .784 .788 .703 .742 .751 1.000 .708 .693 .681 .597 .547
DCS7 .768 .779 .812 .758 .766 .708 1.000 .800 .687 .688 .623
DCS8 .721 .716 .727 .696 .685 .693 .800 1.000 .706 .737 .669
DCS9 .708 .595 .653 .609 .612 .681 .687 .706 1.000 .747 .738
DCS10 .659 .586 .639 .560 .583 .597 .688 .737 .747 1.000 .703
DCS11 .535 .546 .651 .565 .493 .547 .623 .669 .738 .703 1.000

270
Summary Item Statistics
Mean Minimum Maximum Range
Maximum /
Minimum Variance N of Items
Item Means 5.858 5.650 6.014 .364 1.064 .015 11
Item Variances 1.295 1.078 1.589 .511 1.474 .039 11
Inter-Item Covariances .885 .645 1.165 .520 1.805 .012 11
Inter-Item Correlations .690 .493 .812 .319 1.647 .006 11
Item-Total Statistics
Scale Mean if
Item Deleted
Scale Variance if
Item Deleted
Corrected Item-
Total Correlation
Squared Multiple
Correlation
Cronbach's
Alpha if Item
Deleted
DCS1 58.4714 93.301 .846 .780 .955
DCS2 58.6286 91.127 .833 .780 .955
DCS3 58.6214 93.532 .844 .752 .955
DCS4 58.5643 93.456 .800 .701 .956
DCS5 58.4714 94.366 .801 .713 .956
DCS6 58.6571 92.659 .822 .745 .955
DCS7 58.4286 92.650 .874 .802 .954
DCS8 58.4571 90.437 .845 .738 .955
DCS9 58.7929 91.058 .794 .731 .956
DCS10 58.5643 93.312 .766 .678 .957
DCS11 58.7714 92.753 .711 .660 .960

271
Reliability scale for Boundary Control System
Reliability Statistics
Cronbach's
Alpha
Cronbach's
Alpha Based on
Standardized
Items N of Items
.964 .965 4
Inter-Item Correlation Matrix
BCS1 BCS2 BCS3 BCS4
BCS1 1.000 .872 .872 .892
BCS2 .872 1.000 .892 .848
BCS3 .872 .892 1.000 .856
BCS4 .892 .848 .856 1.000
Summary Item Statistics
Mean Minimum Maximum Range
Maximum /
Minimum Variance N of Items
Item Means 5.657 5.600 5.736 .136 1.024 .004 4
Item Variances 2.228 2.081 2.579 .499 1.240 .056 4
Inter-Item Covariances 1.938 1.771 2.066 .294 1.166 .015 4
Inter-Item Correlations .872 .848 .892 .044 1.052 .000 4
Item-Total Statistics
Scale Mean if
Item Deleted
Scale Variance if
Item Deleted
Corrected Item-
Total Correlation
Squared Multiple
Correlation
Cronbach's
Alpha if Item
Deleted
BCS1 16.9500 17.285 .921 .853 .951
BCS2 17.0286 18.675 .910 .837 .953
BCS3 17.0143 18.489 .913 .841 .952
BCS4 16.8929 18.787 .903 .825 .955

272
Reliability scale for Belief Control System
Reliability Statistics
Cronbach's
Alpha
Cronbach's
Alpha Based on
Standardized
Items N of Items
.960 .960 4
Inter-Item Correlation Matrix
BLFS1 BLFS2 BLFS3 BLFS4
BLFS1 1.000 .856 .879 .847
BLFS2 .856 1.000 .832 .847
BLFS3 .879 .832 1.000 .881
BLFS4 .847 .847 .881 1.000
Summary Item Statistics
Mean Minimum Maximum Range
Maximum /
Minimum Variance N of Items
Item Means 5.486 5.400 5.550 .150 1.028 .004 4
Item Variances 2.529 2.324 2.681 .357 1.154 .023 4
Inter-Item Covariances 2.165 2.039 2.253 .214 1.105 .005 4
Inter-Item Correlations .857 .832 .881 .049 1.059 .000 4
Item-Total Statistics
Scale Mean if
Item Deleted
Scale Variance if
Item Deleted
Corrected Item-
Total Correlation
Squared Multiple
Correlation
Cronbach's
Alpha if Item
Deleted
BLFS1 16.3929 20.111 .906 .827 .945
BLFS2 16.5429 20.595 .885 .788 .952
BLFS3 16.4500 21.041 .911 .840 .944
BLFS4 16.4429 20.565 .902 .822 .946

273
Reliability scale for Budget Slack
Reliability Statistics
Cronbach's
Alpha
Cronbach's
Alpha Based on
Standardized
Items N of Items
.975 .975 6
Inter-Item Correlation Matrix
BS1 BS2 BS3 BS4 BS5 BS6
BS1 1.000 .855 .903 .833 .832 .882
BS2 .855 1.000 .882 .887 .906 .893
BS3 .903 .882 1.000 .872 .835 .864
BS4 .833 .887 .872 1.000 .856 .857
BS5 .832 .906 .835 .856 1.000 .878
BS6 .882 .893 .864 .857 .878 1.000
Summary Item Statistics
Mean Minimum Maximum Range
Maximum /
Minimum Variance N of Items
Item Means 3.533 3.450 3.650 .200 1.058 .008 6
Item Variances 1.373 1.215 1.483 .268 1.221 .008 6
Inter-Item Covariances 1.192 1.107 1.291 .184 1.166 .003 6
Inter-Item Correlations .869 .832 .906 .074 1.089 .001 6

274
Item-Total Statistics
Scale Mean if
Item Deleted
Scale Variance if
Item Deleted
Corrected Item-
Total Correlation
Squared Multiple
Correlation
Cronbach's
Alpha if Item
Deleted
BS1 17.5500 30.782 .908 .857 .971
BS2 17.7500 30.304 .938 .891 .968
BS3 17.5571 30.191 .921 .872 .970
BS4 17.7214 30.807 .909 .834 .971
BS5 17.6857 30.807 .909 .850 .971
BS6 17.7357 31.361 .926 .864 .970

275
APPENDIX E
REGRESSION ANALYSIS RESULTS
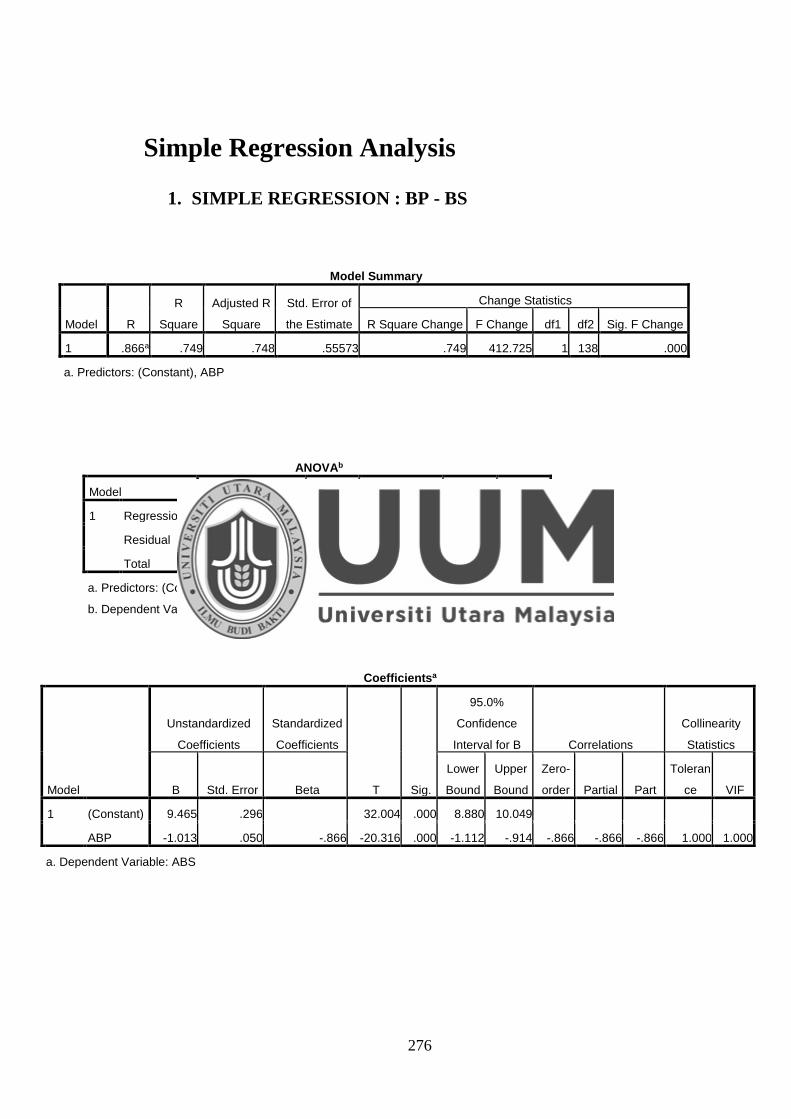
276
Simple Regression Analysis
1. SIMPLE REGRESSION : BP - BS
Model Summary
Model R
R
Square
Adjusted R
Square
Std. Error of
the Estimate
Change Statistics
R Square Change F Change df1 df2 Sig. F Change
1 .866a .749 .748 .55573 .749 412.725 1 138 .000
a. Predictors: (Constant), ABP
ANOVAb
Model Sum of Squares Df Mean Square F Sig.
1 Regression 127.462 1 127.462 412.725 .000a
Residual 42.619 138 .309
Total 170.081 139
a. Predictors: (Constant), ABP
b. Dependent Variable: ABS
Coefficientsa
Model
Unstandardized
Coefficients
Standardized
Coefficients
T Sig.
95.0%
Confidence
Interval for B Correlations
Collinearity
Statistics
B Std. Error Beta
Lower
Bound
Upper
Bound
Zero-
order Partial Part
Toleran
ce VIF
1 (Constant) 9.465 .296 32.004 .000 8.880 10.049
ABP -1.013 .050 -.866 -20.316 .000 -1.112 -.914 -.866 -.866 -.866 1.000 1.000
a. Dependent Variable: ABS

277
2. SIMPLE REGRESSION : ICS - BS
Model Summary
Model R R Square
Adjusted R
Square
Std. Error of
the Estimate
Change Statistics
R Square
Change F Change df1 df2 Sig. F Change
1 .929a .864 .863 .40950 .864 876.264 1 138 .000
a. Predictors: (Constant), AICS
ANOVAb
Model Sum of Squares Df Mean Square F Sig.
1 Regression 146.940 1 146.940 876.264 .000a
Residual 23.141 138 .168
Total 170.081 139
a. Predictors: (Constant), AICS
b. Dependent Variable: ABS
Coefficientsa
Model
Unstandardized
Coefficients
Standardized
Coefficients
t Sig.
95.0% Confidence
Interval for B Correlations
Collinearity
Statistics
B
Std.
Error Beta
Lower
Bound
Upper
Bound
Zero-
order Partial Part
Tolera
nce VIF
1 (Constant) 5.519 .076 73.100 .000 5.370 5.669
AICS -.599 .020 -.929 -29.602 .000 -.639 -.559 -.929 -.929 -.929 1.000 1.000
a. Dependent Variable: ABS

278
3. SIMPLE REGRESSION : DCS - BS
Model Summary
Model R
R
Square
Adjusted R
Square
Std. Error of
the Estimate
Change Statistics
R Square
Change F Change df1 df2 Sig. F Change
1 .867a .752 .750 .55312 .752 417.916 1 138 .000
a. Predictors: (Constant), ADCS
ANOVAb
Model Sum of Squares Df Mean Square F Sig.
1 Regression 127.860 1 127.860 417.916 .000a
Residual 42.221 138 .306
Total 170.081 139
a. Predictors: (Constant), ADCS
b. Dependent Variable: ABS
Coefficientsa
Model
Unstandardized
Coefficients
Standardized
Coefficients
t Sig.
95.0%
Confidence
Interval for B Correlations
Collinearity
Statistics
B
Std.
Error Beta
Lower
Bound
Upper
Bound
Zero-
order Partial Part
Toleran
ce VIF
1 (Constant) 9.381 .290 32.364 .000 8.807 9.954
ADCS -.998 .049 -.867 -20.443 .000 -1.095 -.902 -.867 -.867 -.867 1.000 1.000
a. Dependent Variable: ABS

279
4. SIMPLE REGRESSION : BCS - BS
Model Summary
Model R R Square
Adjusted R
Square
Std. Error of
the Estimate
Change Statistics
R Square
Change F Change df1 df2
Sig. F
Change
1 .579a .335 .330 .90512 .335 69.609 1 138 .000
a. Predictors: (Constant), ABCS
ANOVAb
Model Sum of Squares Df Mean Square F Sig.
1 Regression 57.026 1 57.026 69.609 .000a
Residual 113.055 138 .819
Total 170.081 139
a. Predictors: (Constant), ABCS
b. Dependent Variable: ABS
Coefficientsa
Model
Unstandardized
Coefficients
Standardized
Coefficients
T Sig.
95.0% Confidence
Interval for B Correlations
Collinearity
Statistics
B
Std.
Error Beta
Lower
Bound
Upper
Bound
Zero-
order Partial Part
Tolera
nce VIF
1 (Constant) 6.089 .316 19.284 .000 5.464 6.713
ABCS -.452 .054 -.579 -8.343 .000 -.559 -.345 -.579 -.579 -.579 1.000 1.000
a. Dependent Variable: ABS

280
5. SIMPLE REGRESSION : BLFCS – BS
Model Summary
Model R R Square
Adjusted R
Square
Std. Error of
the Estimate
Change Statistics
R Square Change F Change df1 df2
Sig. F
Change
1 .581a .338 .333 .90340 .338 70.398 1 138 .000
a. Predictors: (Constant), ABLFS
ANOVAb
Model Sum of Squares Df Mean Square F Sig.
1 Regression 57.454 1 57.454 70.398 .000a
Residual 112.626 138 .816
Total 170.081 139
a. Predictors: (Constant), ABLFS
b. Dependent Variable: ABS
Coefficientsa
Model
Unstandardized
Coefficients
Standardized
Coefficients
t Sig.
95.0% Confidence
Interval for B Correlations
Collinearity
Statistics
B
Std.
Error Beta
Lower
Bound
Upper
Bound
Zero-
order Partial Part
Toleranc
e VIF
1 (Constant) 5.881 .290 20.273 .000 5.307 6.454
ABLFS -.428 .051 -.581 -8.390 .000 -.529 -.327 -.581 -.581 -.581 1.000 1.000
a. Dependent Variable: ABS

281
Multiple Regression Analysis
Multiple Regressions for the Relationship between Budget Participation and Budget Slack
Model Summary
Model R R Square
Adjusted R
Square
Std. Error of the
Estimate
Change Statistics
R Square
Change F Change df1 df2
Sig. F
Change
1 .866a .750 .748 3.33024 .750 413.500 1 138 .000
a. Predictors: (Constant), NGBP
ANOVAb
Model Sum of Squares df Mean Square F Sig.
1 Regression 4585.915 1 4585.915 413.500 .000a
Residual 1530.485 138 11.090
Total 6116.400 139
a. Predictors: (Constant), NGBP
b. Dependent Variable: GBS
Coefficientsa
Model
Unstandardized
Coefficients
Standardized
Coefficients
t Sig.
95.0% Confidence
Interval for B
Correla
tions Collinearity Statistics
B
Std.
Error Beta
Lower
Bound
Upper
Bound
Zero-
order Partial Part Tolerance VIF
1 (Constant) 21.200 .281 75.323 .000 20.643 21.757
NGBP -1.013 .050 -.866 -20.335 .000 -1.111 -.914 -.866 -.866 -.866 1.000 1.000
a. Dependent Variable: GBS

282
Charts

283

284
Multiple Regressions for the Relationship between Budget Participation, Interactive Control System and Buget Slack
Model Summary
Model R R Square
Adjusted R
Square
Std. Error of the
Estimate
Change Statistics
R Square
Change F Change df1 df2
Sig. F
Change
1 .866a .750 .748 3.33024 .750 413.500 1 138 .000
2 .957b .916 .914 1.94077 .166 269.332 1 137 .000
3 .965c .931 .930 1.75905 .016 30.768 1 136 .000
a. Predictors: (Constant), NGBP
b. Predictors: (Constant), NGBP, NGICS
c. Predictors: (Constant), NGBP, NGICS, NGBPNGICS
ANOVAd
Model Sum of Squares df Mean Square F Sig.
1 Regression 4585.915 1 4585.915 413.500 .000a
Residual 1530.485 138 11.090
Total 6116.400 139
2 Regression 5600.378 2 2800.189 743.429 .000b
Residual 516.022 137 3.767
Total 6116.400 139
3 Regression 5695.581 3 1898.527 613.565 .000c
Residual 420.819 136 3.094
Total 6116.400 139
a. Predictors: (Constant), NGBP
b. Predictors: (Constant), NGBP, NGICS
c. Predictors: (Constant), NGBP, NGICS, NGBPNGICS
d. Dependent Variable: GBS

285
Coefficientsa
Model
Unstandardized
Coefficients
Standardized
Coefficients
t Sig.
Correlations Collinearity Statistics
B Std. Error Beta
Zero-
order Partial Part Tolerance VIF
1 (Constant) 21.200 .281 75.323 .000
NGBP -1.013 .050 -.866 -20.335 .000 -.866 -.866 -.866 1.000 1.000
2 (Constant) 21.200 .164 129.249 .000
NGBP -.425 .046 -.363 -9.216 .000 -.866 -.619 -.229 .396 2.523
NGICS -.417 .025 -.647 -16.411 .000 -.929 -.814 -.407 .396 2.523
3 (Constant) 22.817 .327 69.722 .000
NGBP -.926 .100 -.792 -9.303 .000 -.866 -.624 -.209 .070 14.315
NGICS -.190 .047 -.294 -4.039 .000 -.929 -.327 -.091 .095 10.505
NGBPNGICS -.036 .006 -.298 -5.547 .000 .094 -.430 -.125 .175 5.698
a. Dependent Variable: GBS
Charts

286

287
Multiple Regressions for the Relationship between Budget Participation, Diagnostic Control System and Budget Slack
Model Summary
Model R
R
Square
Adjusted R
Square
Std. Error of
the Estimate
Change Statistics
R Square
Change F Change df1 df2
Sig. F
Change
1 .866a .750 .748 3.33024 .750 413.500 1 138 .000
2 .880b .774 .771 3.17645 .024 14.685 1 137 .000
3 .911c .830 .827 2.76120 .056 45.305 1 136 .000
a. Predictors: (
Constant), NGBP
b. Predictors: (Constant), NGBP, NGDCS
c. Predictors: (Constant), NGBP, NGDCS, NGBPNGDCS
ANOVAd
Model Sum of Squares df Mean Square F Sig.
1 Regression 4585.915 1 4585.915 413.500 .000a
Residual 1530.485 138 11.090
Total 6116.400 139
2 Regression 4734.089 2 2367.044 234.596 .000b
Residual 1382.311 137 10.090
Total 6116.400 139
3 Regression 5079.503 3 1693.168 222.077 .000c
Residual 1036.897 136 7.624
Total 6116.400 139
a. Predictors: (Constant), NGBP
b. Predictors: (Constant), NGBP, NGDCS
c. Predictors: (Constant), NGBP, NGDCS, NGBPNGDCS
d. Dependent Variable: GBS

288
Coefficientsa
Model
Unstandardized
Coefficients
Standardized
Coefficients
t Sig.
Correlations Collinearity Statistics
B Std. Error Beta
Zero-
order Partial Part Tolerance VIF
1 (Constant) 21.200 .281 75.323 .000
NGBP -1.013 .050 -.866 -20.335 .000 -.866 -.866 -.866 1.000 1.000
2 (Constant) 21.200 .268 78.969 .000
NGBP -.514 .139 -.439 -3.703 .000 -.866 -.302 -.150 .117 8.520
NGDCS -.285 .074 -.454 -3.832 .000 -.867 -.311 -.156 .117 8.520
3 (Constant) 22.323 .287 77.821 .000
NGBP -.661 .123 -.565 -5.392 .000 -.866 -.420 -.190 .114 8.800
NGDCS -.366 .066 -.583 -5.562 .000 -.867 -.431 -.196 .113 8.814
NGBPNGDCS -.020 .003 -.345 -6.731 .000 .475 -.500 -.238 .474 2.111
a. Dependent Variable: GBS
Charts

289

290
Multiple Regressions for the Relationship between Budget Participation, Boundary Control System and Budget Slack
Model Summary
Model R
R
Square
Adjusted R
Square
Std. Error of
the
Estimate
Change Statistics
R Square
Change F Change df1 df2 Sig. F Change
1 .866a .750 .748 3.33024 .750 413.500 1 138 .000
2 .866b .751 .747 3.33664 .001 .470 1 137 .494
3 .882c .779 .774 3.15410 .028 17.317 1 136 .000
a. Predictors: (Constant), NGBP
b. Predictors: (Constant), NGBP, NGBCS
c. Predictors: (Constant), NGBP, NGBCS, NGBPNGBCS
ANOVAd
Model Sum of Squares df Mean Square F Sig.
1 Regression 4585.915 1 4585.915 413.500 .000a
Residual 1530.485 138 11.090
Total 6116.400 139
2 Regression 4591.152 2 2295.576 206.192 .000b
Residual 1525.248 137 11.133
Total 6116.400 139
3 Regression 4763.427 3 1587.809 159.606 .000c
Residual 1352.973 136 9.948
Total 6116.400 139
a. Predictors: (Constant), NGBP
b. Predictors: (Constant), NGBP, NGBCS
c. Predictors: (Constant), NGBP, NGBCS, NGBPNGBCS
d. Dependent Variable: GBS

291
Coefficientsa
Model
Unstandardized
Coefficients
Standardized
Coefficients
t Sig.
Correlations
Collinearity
Statistics
B Std. Error Beta
Zero-
order Partial Part Tolerance VIF
1 (Constant) 21.200 .281 75.323 .000
NGBP -1.013 .050 -.866 -20.335 .000 -.866 -.866 -.866 1.000 1.000
2 (Constant) 21.200 .282 75.178 .000
NGBP -1.046 .069 -.894 -15.099 .000 -.866 -.790 -.644 .519 1.926
NGBCS .048 .069 .041 .686 .494 -.579 .058 .029 .519 1.926
3 (Constant) 21.871 .312 70.202 .000
NGBP -1.203 .076 -1.028 -15.919 .000 -.866 -.807 -.642 .390 2.565
NGBCS -.006 .067 -.005 -.094 .925 -.579 -.008 -.004 .500 2.001
NGBPNGB
CS
-.030 .007 -.238 -4.161 .000 .481 -.336 -.168 .496 2.017
a. Dependent Variable: GBS
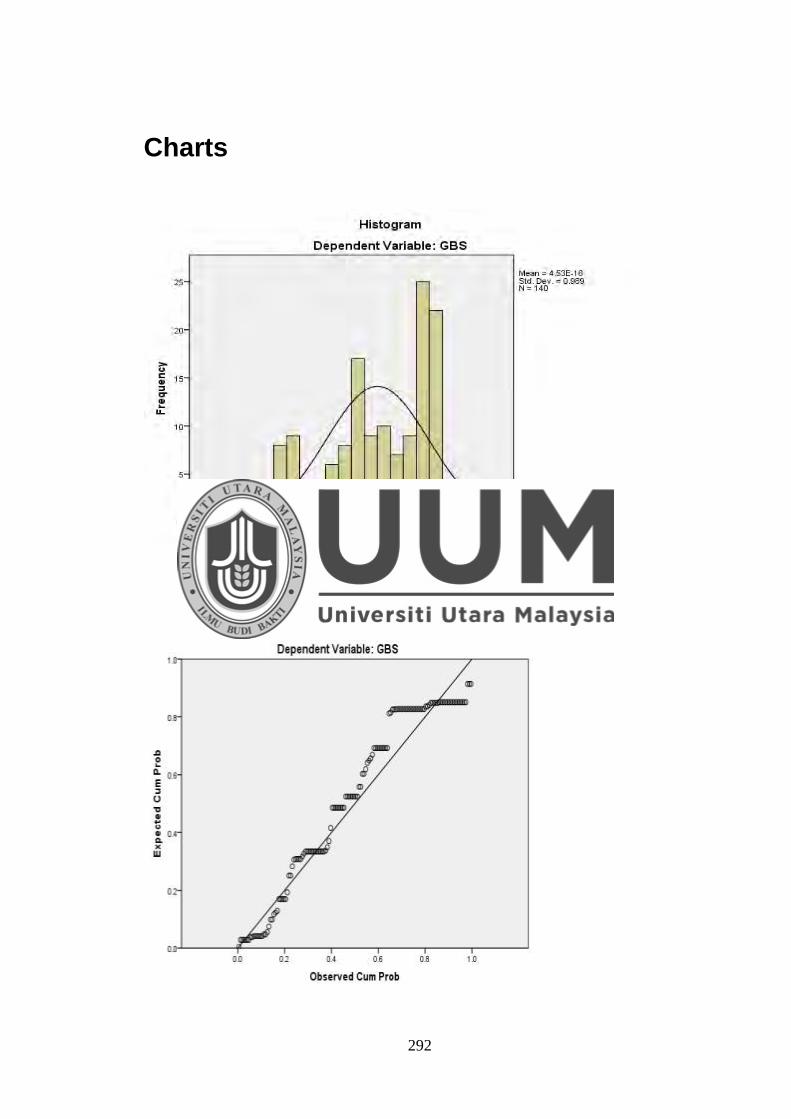
292
Charts
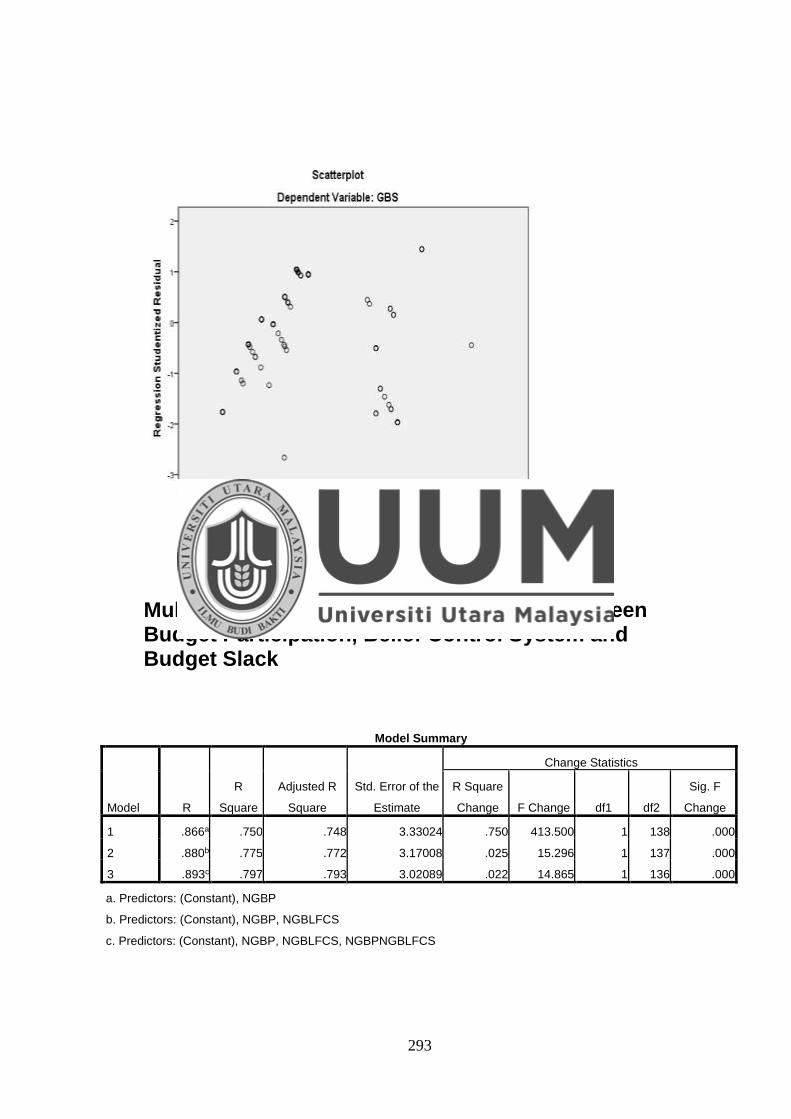
293
Multiple Regressions for the relationship between Budget Participation, Belief Control System and Budget Slack
Model Summary
Model R
R
Square
Adjusted R
Square
Std. Error of the
Estimate
Change Statistics
R Square
Change F Change df1 df2
Sig. F
Change
1 .866a .750 .748 3.33024 .750 413.500 1 138 .000
2 .880b .775 .772 3.17008 .025 15.296 1 137 .000
3 .893c .797 .793 3.02089 .022 14.865 1 136 .000
a. Predictors: (Constant), NGBP
b. Predictors: (Constant), NGBP, NGBLFCS
c. Predictors: (Constant), NGBP, NGBLFCS, NGBPNGBLFCS

294
ANOVAd
Model Sum of Squares df Mean Square F Sig.
1 Regression 4585.915 1 4585.915 413.500 .000a
Residual 1530.485 138 11.090
Total 6116.400 139
2 Regression 4739.634 2 2369.817 235.817 .000b
Residual 1376.766 137 10.049
Total 6116.400 139
3 Regression 4875.292 3 1625.097 178.077 .000c
Residual 1241.108 136 9.126
Total 6116.400 139
a. Predictors: (Constant), NGBP
b. Predictors: (Constant), NGBP, NGBLFCS
c. Predictors: (Constant), NGBP, NGBLFCS, NGBPNGBLFCS
d. Dependent Variable: GBS
Coefficientsa
Model
Unstandardized
Coefficients
Standardized
Coefficients
t Sig.
Correlations
Collinearity
Statistics
B Std. Error Beta
Zero-
order Partial Part Tolerance VIF
1 (Constant) 21.200 .281 75.323 .000
NGBP -1.013 .050 -.866 -20.335 .000 -.866 -.866 -.866 1.000 1.000
2 (Constant) 21.200 .268 79.128 .000
NGBP -.902 .055 -.771 -16.304 .000 -.866 -.812 -.661 .735 1.360
NGBLFCS -.204 .052 -.185 -3.911 .000 -.582 -.317 -.159 .735 1.360
3 (Constant) 21.646 .280 77.238 .000
NGBP -1.011 .060 -.864 -16.891 .000 -.866 -.823 -.652 .570 1.755
NGBLFCS -.219 .050 -.198 -4.389 .000 -.582 -.352 -.170 .731 1.368
NGBPNGBLFCS -.026 .007 -.180 -3.856 .000 .370 -.314 -.149 .684 1.461
a. Dependent Variable: GBS

295
Charts

296
Multiple Regressions for the relationship between Budget Participation, MCS and Budget Slack
Model Summary
Model R R Square
Adjusted R
Square
Std. Error of
the Estimate
Change Statistics
R Square
Change F Change df1 df2
Sig. F
Change
1 .866a .750 .748 3.33024 .750 413.500 1 138 .000
2 .936b .877 .875 2.34338 .127 141.705 1 137 .000
3 .949c .901 .899 2.11297 .024 32.507 1 136 .000
a. Predictors: (Constant), NGBP
b. Predictors: (Constant), NGBP, NGMCS
c. Predictors: (Constant), NGBP, NGMCS, NGBPNGMCS

297
ANOVAd
Model Sum of Squares df Mean Square F Sig.
1 Regression 4585.915 1 4585.915 413.500 .000a
Residual 1530.485 138 11.090
Total 6116.400 139
2 Regression 5364.075 2 2682.037 488.405 .000b
Residual 752.325 137 5.491
Total 6116.400 139
3 Regression 5509.207 3 1836.402 411.320 .000c
Residual 607.193 136 4.465
Total 6116.400 139
a. Predictors: (Constant), NGBP
b. Predictors: (Constant), NGBP, NGMCS
c. Predictors: (Constant), NGBP, NGMCS, NGBPNGMCS
d. Dependent Variable: GBS
Coefficientsa
Model
Unstandardized
Coefficients
Standardized
Coefficients
t Sig.
Correlations
Collinearity
Statistics
B Std. Error Beta
Zero-
order Partial Part Tolerance VIF
1 (Constant) 21.200 .281 75.323 .000
NGBP -1.013 .050 -.866 -20.335 .000 -.866 -.866 -.866 1.000 1.000
2 (Constant) 21.200 .198 107.043 .000
NGBP -.061 .087 -.052 -.697 .487 -.866 -.059 -.021 .161 6.206
NGMCS -.216 .018 -.889 -11.904 .000 -.936 -.713 -.357 .161 6.206
3 (Constant) 22.001 .227 96.845 .000
NGBP -.363 .095 -.310 -3.823 .000 -.866 -.311 -.103 .111 9.010
NGMCS -.187 .017 -.769 -10.900 .000 -.936 -.683 -.294 .147 6.812
NGBPNGMCS -.006 .001 -.219 -5.701 .000 .399 -.439 -.154 .495 2.022
a. Dependent Variable: GBS

298
Charts

299

300
APPENDIX F
LIST OF PUBLICATIONS

301
INTERNATIONAL CONFERENCE PROCEEDINGS PUBLISHED
1. The Effect of Budget Participation, Locus of Control, Job Relevant Information,
Cultual Dimention on Job Performance and job Satisfaction. A paper presented
at The 2nd International Conference on Arab-Malaysia Islamic Global Business
and Enterpreneurship at Yarmouk University Jordan and Damascus University
Syria, 20-24 March 2010.
2. The Relationship of Budgetary Process in Management Accounting Techniques
and Job Performance. A paper presented at 1st International Conference on
Public Policy and Social Sciences at Universiti MARA Kedah Darul Aman,
Malaysia. 26-27 May 2010.
3. The Effect of Interactive Control System and Boundary Control System in the
Relationship between Budget Participation and Budget Slack. A paper
presented at The 14th Asian Academic Accounting Association Annual
Conference at Penang, Malaysia. 27-30 October 2013.
4. The Effect of Diagnostic Control System and Belief Control System in the
Relationship between Budget Participation and Budget Slack. A paper
presented at The International Congress on Interdisciplinary Behavior and
Social Sciences 2013 (ICIBSoS 2013) at Swiss Bell Ciputra Hotel, Jakarta,
Indonesia. 04-05 November 2013.

302
5. The Moderating Effect of Interactive Control System and Diagnostic Control
System in the Relationship between Budget Participation and Budget Slack. A
paper presented at The International Conference on Social Transforming
towards Sustainable Society, EDC – Universiti Utara Malaysia, Kedah Darul
Aman, Malaysia. 16 December 2013.