
The Copigmentation of Anthocyanins and Its Role in the ... · Am. J. Enol. Vitic. 52:2 (2001)...
21
Am. J. Enol. Vitic. 52:2 (2001) The phenomenon of copigmentation is due to molecular as- sociations between pigments and other (usually noncolored) organic molecules in solution. These associations cause the pig- ments to exhibit far greater color than would be expected from their concentration. The phenomenon has long been recognized in flowers and fruits. Willstatter and Zollinger [122,123] noted the intensification of color on the addition of tannin to acidic oenin (malvidin 3-glucoside) solutions, the major pigment that they had isolated from Alicante grapes. They also observed that the effect was not found in similar cyanin (cyanidin 3,5- diglucoside) solutions. Copigmentation was studied more exten- sively by Robinson and Robinson [94], who ranked almost 30 different cofactors by their ability to provide a blue shift to acidic oenin (malvidin 3-glucoside) solutions. They noted, “it is evi- dently the result of the formation of weak additive complexes, The Copigmentation of Anthocyanins and Its Role in the Color of Red Wine: A Critical Review Roger Boulton* Copigmentation is a solution phenomenon in which pigments and other noncolored organic components form molecular associations or complexes. It generally results in an enhancement in the absorbance and in some cases, a shift in the wavelength of the maximum absorbance of the pigment. Copigmentation has not previ- ously been taken into account in traditional wine color measures, in the relationship between color and pig- ment analysis, or in spectrophotometric assays for anthocyanin content. It is now apparent that copigmentation can account for between 30 and 50% of the color in young wines and that it is primarily influenced by the levels of several specific, noncolored phenolic components or cofactors. Copigmentation is of critical importance in understanding the relationship between grape composition and wine color, the variation in color and pigment concentration between wines, and in all reactions involving the anthocyanins during wine aging. This review focuses on the importance of the individual pigments and cofactors, the strength of their interactions, and their relative abundance in grapes and wines. A simple mathematical analysis of the solution equilibrium is devel- oped to explain the nonlinear deviation from Beer’s law. When solved for typical wines, this function provides estimates of the apparent association constant, K, and the apparent molar extinction of the copigmented form, Ec, in natural mixtures. These measures allow the fraction of the anthocyanins which is in the copigmented form to be estimated. The significance of this phenomenon on pigment extraction and color retention during fermentations, on the rate of subsequent pigment polymerization, on the possible protection of anthocyanins from oxidation, and in the possible involvement on perceived mouthfeel and astringency of wines are sug- gested. Aspects of the copigmentation phenomenon that are poorly understood are identified and some re- search directions are suggested. Key words: Copigmentation, anthocyanins, red wine color, pigment complexes, cofactors which are dissociated at elevated temperature or by the action of solvents.” In an early spectrophotometric study of color in red wines, Boutaric et al. [22] noted that the color exhibited devia- tions from Beer’s law when it was diluted. They suggested that this was due to “a state of micelle complexes, between the col- oring materials and a number of other mineral and organic con- stituents in wine.” This association between the pigments and their copigmentation cofactors (also referred to as “copigments” by some authors) involves the anthocyanin glucosides, and certain phenolic acids, flavonoids, and, in particular, derivatives of the flavonol and flavone subgroups. It accounts for almost half of the observed color of young red wines [79]. As well as resulting in higher absorbance values (a hyperchromic shift), certain co- factors lead to a bathochromic shift in the wavelength at which the maximum absorbance is observed, typically 5 to 20 nm higher, providing a blue-purple tone in an otherwise red solu- tion. The extent of the spectral shift is not directly related to the enhancement in color and vice versa. Some combinations, such as quercetin and oenin [94], show primarily a wavelength shift, while other pairs, such as protocatechuic acid and cyanidin 3,5- *Professor, Department of Viticulture and Enology, University of California, One Shields Avenue, Davis, CA 95616-8749 [Fax: 530-752-0382; email: [email protected]] Acknowledgments: The author gratefully acknowledges the thoughts and discussions provided by Professors Vernon Singleton and Ted Molinski and graduate students Ranuccio Neri, Joanne Levengood, and Micha Vaadia during the formative stages of this review. The author also appre- ciates the cooperation of Professor Molinski in obtaining the circular dichroism spectra of the red wine presented in Figure 1. Manuscript submitted March 2000; revised April 2001 Copyright © 2001 by the American Society for Enology and Viticulture. All rights reserved. 67
-
Upload
trinhkhuong -
Category
Documents
-
view
223 -
download
0
Transcript of The Copigmentation of Anthocyanins and Its Role in the ... · Am. J. Enol. Vitic. 52:2 (2001)...

Am. J. Enol. Vitic. 52:2 (2001)
Copigmentation of Anthocyanins — 67
The phenomenon of copigmentation is due to molecular as-sociations between pigments and other (usually noncolored)organic molecules in solution. These associations cause the pig-ments to exhibit far greater color than would be expected fromtheir concentration. The phenomenon has long been recognizedin flowers and fruits. Willstatter and Zollinger [122,123] notedthe intensification of color on the addition of tannin to acidicoenin (malvidin 3-glucoside) solutions, the major pigment thatthey had isolated from Alicante grapes. They also observed thatthe effect was not found in similar cyanin (cyanidin 3,5-diglucoside) solutions. Copigmentation was studied more exten-sively by Robinson and Robinson [94], who ranked almost 30different cofactors by their ability to provide a blue shift to acidicoenin (malvidin 3-glucoside) solutions. They noted, “it is evi-dently the result of the formation of weak additive complexes,
The Copigmentation of Anthocyanins andIts Role in the Color of Red Wine:
A Critical Review
Roger Boulton*
Copigmentation is a solution phenomenon in which pigments and other noncolored organic components formmolecular associations or complexes. It generally results in an enhancement in the absorbance and in somecases, a shift in the wavelength of the maximum absorbance of the pigment. Copigmentation has not previ-ously been taken into account in traditional wine color measures, in the relationship between color and pig-ment analysis, or in spectrophotometric assays for anthocyanin content. It is now apparent that copigmentationcan account for between 30 and 50% of the color in young wines and that it is primarily influenced by the levelsof several specific, noncolored phenolic components or cofactors. Copigmentation is of critical importance inunderstanding the relationship between grape composition and wine color, the variation in color and pigmentconcentration between wines, and in all reactions involving the anthocyanins during wine aging. This reviewfocuses on the importance of the individual pigments and cofactors, the strength of their interactions, and theirrelative abundance in grapes and wines. A simple mathematical analysis of the solution equilibrium is devel-oped to explain the nonlinear deviation from Beer’s law. When solved for typical wines, this function providesestimates of the apparent association constant, K, and the apparent molar extinction of the copigmented form,Ec, in natural mixtures. These measures allow the fraction of the anthocyanins which is in the copigmentedform to be estimated. The significance of this phenomenon on pigment extraction and color retention duringfermentations, on the rate of subsequent pigment polymerization, on the possible protection of anthocyaninsfrom oxidation, and in the possible involvement on perceived mouthfeel and astringency of wines are sug-gested. Aspects of the copigmentation phenomenon that are poorly understood are identified and some re-search directions are suggested.
Key words: Copigmentation, anthocyanins, red wine color, pigment complexes, cofactors
which are dissociated at elevated temperature or by the action ofsolvents.” In an early spectrophotometric study of color in redwines, Boutaric et al. [22] noted that the color exhibited devia-tions from Beer’s law when it was diluted. They suggested thatthis was due to “a state of micelle complexes, between the col-oring materials and a number of other mineral and organic con-stituents in wine.”
This association between the pigments and theircopigmentation cofactors (also referred to as “copigments” bysome authors) involves the anthocyanin glucosides, and certainphenolic acids, flavonoids, and, in particular, derivatives of theflavonol and flavone subgroups. It accounts for almost half ofthe observed color of young red wines [79]. As well as resultingin higher absorbance values (a hyperchromic shift), certain co-factors lead to a bathochromic shift in the wavelength at whichthe maximum absorbance is observed, typically 5 to 20 nmhigher, providing a blue-purple tone in an otherwise red solu-tion.
The extent of the spectral shift is not directly related to theenhancement in color and vice versa. Some combinations, suchas quercetin and oenin [94], show primarily a wavelength shift,while other pairs, such as protocatechuic acid and cyanidin 3,5-
*Professor, Department of Viticulture and Enology, University of California, One Shields Avenue,Davis, CA 95616-8749 [Fax: 530-752-0382; email: [email protected]]
Acknowledgments: The author gratefully acknowledges the thoughts and discussions providedby Professors Vernon Singleton and Ted Molinski and graduate students Ranuccio Neri, JoanneLevengood, and Micha Vaadia during the formative stages of this review. The author also appre-ciates the cooperation of Professor Molinski in obtaining the circular dichroism spectra of the redwine presented in Figure 1.
Manuscript submitted March 2000; revised April 2001Copyright © 2001 by the American Society for Enology and Viticulture. All rights reserved.
67

Am. J. Enol. Vitic. 52:2 (2001)
68 — Boulton
diglucoside, show primarily a color enhancement [5]. In general,most combinations display both of these features to some extent[5,11-14,72], and there is presently no known relationship forthe prediction of these effects. The earlier reviews ofcopigmentation by Osawa [83] and Mazza and Brouillard [72]provide additional examples.
The potential color enhancement is fixed for a given pigment-cofactor pair and the observed color in solution depends on theconcentration of pigment, the molar ratio of cofactor to pigment,pH, the extent of nonaqueous conditions, and the anions in solu-tion. In most natural mixtures such as juices and wines, it is ex-pected that there will be competition between the various cofac-tors and pigments with some kind of preference or order for theseassociations.
There appears to be a minimum concentration of anthocyanin(approximately 35 µM) before significant copigmentation is de-tectable [4, 68]. This corresponds to 18.5 mg/L as malvidin 3-glu-coside, so most red wines (300 to 500 mg/L) are expected to be inthe concentration range of significant copigmentation while mostblush and rose wines (5 to 50 mg/L) are not. That is why the blueand purple tones are absent in these wine types, yet the red winesmade from the corresponding grapes can often display this trait.
The color exhibited by the anthocyanins when they are in thesecopigmentation complexes can be severalfold that of the freeform, and the actual enhancement depends primarily on the na-ture of the pigment, the cofactor, the ratio of cofactor to pigment,and the pH. The equilibrium nature of this complex formationleads to a nonlinear relationship between color and concentra-tion when diluted, leading several authors [22,105,107,110] tonote that red wines do not obey Beer’s law. The copigmentationcomplex is easily disrupted by dilution with a model wine buffer,with the components of the complex returning to their free pig-ment and cofactor forms in order to satisfy a new equilibriumposition. This feature can be used to distinguish the color due tocopigmentation from that due to the monomeric and polymericpigments and has now been introduced into a more comprehen-sive assay for the color of solutions such as wine [19] that ex-hibit copigmentation. Somers and Verette [109] have referred tothis loss in color due to dilution as the “color synergism factor,”but there has been no attempt to include it into the earlier assay[107], even though it significantly affects the estimates of theanthocyanin content.
In young red wines made from Vitis vinifera grapes,copigmentation seems to result in both a higher pigment concen-tration and an enhancement in the color of those pigments. Thecolor enhancement has been found to be between two and tentimes that expected from the pigment alone, with typical valuesbeing four and six times (Boulton, unpublished data). Both ef-fects seem to be pronounced in the juices and wines of theTeinturier cultivars (for example, Gamay Teinturier, AlicanteBouschet, Rubired, Salvador, Centurion, and some of the redOberlin crosses) and some non-vinifera grapes (such as Nobleand Concord). The colors of most berry juices and jams (for ex-ample, cranberries, raspberries, blackberries, and blueberries)owe much of their intensity, purpleness, and blueness to the com-bined effects of mildly acidic pH and copigmentation. Unfortu-
nately, there are few published studies of the levels and natureof the cofactors in these juices. The effect of added chlorogenicacid on the color of strawberries and chokeberries has been dem-onstrated and the effect of pH on the color due to copigmentationinvestigated [124]. They found similar responses to those ob-served in Cabernet Sauvignon wines [70], that is, a local maxi-mum in copigmented color at a pH of 3.3.
Although most of the solution studies have been with mono-meric phenols and anthocyanins, other components that havebeen suggested to have copigmentation effects are C-glycosylxanthones, pectin, and tannin preparations [89]. Otherstudies [97] have shown that Concord grape seed extract, sug-ars, protein and iron, tin, or zinc ions had no significant effectson the color of malvidin 3,5-diglucoside solutions at pH of 3.20.It is not clear if the effects attributed to some materials are dueto the impurities of monomeric components such as catechin orgalacturonic acid that might be present in the natural prepara-tions employed in some of these studies. Some winemakers andresearchers believe that it is the tannins in red wine that are re-sponsible for the complexing of anthocyanins and deeper color.However, there has yet to be a clear experimental demonstra-tion of this belief.
The Self-Association of Anthocyanins
A subset of the interactions involving anthocyanins is the caseof self-association of molecules in relatively concentrated (>1mM) solutions [5,58,60-62,63,75,83,111,120]. That might beexpected due the effectiveness of the most flavonoids ascopigmentation cofactors and the features of aromatic hydroxy,carbonyl, and sugar groups at certain key positions that they havein common with many of the anthocyanins.
Asen et al. [5] reported that by self-association, cyanidin 3,5-diglucoside solutions at 5 mM displayed twice the expected color(200 times that of the 50 µM solution) at pH values of 3.16, 4.12,and 5.10. This can be compared to the copigmentation effect inequimolar solutions (5 mM) of cyanidin 3,5-diglucoside andquercitrin, which gave three times the expected color (300 timesthat of the 50 µM solution) under the same pH conditions. Un-like copigmentation, self-association is characterized by a hyp-sochromic shift in the wavelength of the absorbance maximum,that is, toward shorter values [49,60,62].
Hoshino et al. [59,60,62] in studies of various glycosides ofmalvidin concluded that malvidin 3-glucoside showed less ef-fect of concentration on its circular dichroism (CD) pattern andwas therefore less capable of self-aggregation than the 3,5-diglucoside at a pH of 7. That is significant when comparingmuch of the work that has been performed using the 3,5-diglucoside in both self-association and copigmentation studies.The CD patterns of this self-association display a split into twobroad peaks, one positive, the other negative, and both in thecolored region of the spectrum. This pattern occurs at pH of 7[60] and pH of 1.0 [57] with several anthocyanins. These CDspectra have been interpreted as evidence of molecular stackingalong either a left- (or a right-) handed helical axis [60-62].
The relationship between anthocyanin concentration and so-lution color in the case of self-association differs from that of
Am. J. Enol. Vitic. 52:2 (2001)
Copigmentation of Anthocyanins — 69
copigmentation. It is expected that the equilibrium and colorresponse in self-association would be second order in nature,while for copigmentation it would be first order with respect tothe anthocyanin concentration. Timberlake [111] has shown simi-lar self-association in an aqueous solution of malvidin 3-gluco-side at pH=3.5, displayed a second order increase in color overa tenfold concentration range, estimated to be from 85 to 850mg/L. This data can be fitted by a second order association be-tween pigment molecules with an association constant of approxi-mately 1000 M-1. Similar measurements in 12% ethanol solu-tions, or with acylated forms of this pigment, do not appear tohave been conducted. The effect of ethanol on the self-associa-tion equilibrium is unknown, and there is no report of abathochromic shift in these self-association studies.
The ability of some anthocyanins to act as cofactors for otheranthocyanins, better described as copigmentation rather than self-association, has been demonstrated by Nakayama and Powers[78] and Miniati et al. [75]. The later study reported the colorenhancement of a mixture of the 3,5-diglucosides ofpelargonidin, cyanidin, and malvidin, each at 75 µM, in waterand 10% v/v ethanol solutions. At pH=3.5, the enhancement inabsorbance was only 5% in water, but in the ethanol solution, itwas found to be 18%. This higher response in ethanol solutionscould be due to more extensive association or a larger extinctioncoefficient of the copigmented forms, or both.
Somers and Evans [108] considered self-association to beresponsible for much of the non-Beer’s law behavior and pro-posed dimers linked through the 4 and 8 positions of adjacentanthocyanins to explain the purple color found in many red wines.However, neither self-association nor dimer formation can ex-plain the absence of purpleness in some red wines with mediumand high anthocyanin concentrations. These hypotheses are nowdiscounted by the strong instrumental evidence forcopigmentation stacking and positive bathochromic shifts dueto the cofactors in copigmentation equilibria.
Pigment-Metal ComplexesCopigmentation is also different from the formation of col-
ored complexes between some anthocyanins and certain metalcations such as Al, Fe, Sn, and Cu at levels of 10 mg/L [50,94,100, 118] and borate [100]. The ability to form such complexesis related to an ortho-dihydroxyl arrangement on the B ring, sothat while the glycosides of cyanidin, delphinidin, and petunidincan form, those of malvidin, pelargonidin and peonidin cannot[46,100]. The work of Dangles et al. [32] and Elhabiri et al. [37]has shown that pigment complexes involving aluminum have acolor maximum at pH of 4.5, and this can distinguish it from thepH response of either anthocyanins alone or those in copigmentedassociations. Since malvidin 3-glucoside is the major anthocya-nin in most vinifera grapes, it is unlikely that pigment-metalcomplexes play any significant role in the color of their wines.
The blue color of blueberries (vaccinium sp.) is associated withaluminum complexes of otherwise red anthocyanins [83]. Theblueness and color intensity of juice and wine from some hybridgrapes such as Concord have been attributed to such metal com-plexes [67], as cyanidin 3,5-diglucoside, and the diglucosides ingeneral, are less ionized (and therefore, less colorful) than the
monoglucosides at wine pH. However, it is quite possible thatthe difference in color noted by these authors could be due tocopigmentation as well as metal-pigment complexes. There ispresently no evidence that the levels of these metal cations inwine are at all correlated with the levels of copigmentation orthe dilution-sensitive aspect of red color [74], and this will notbe considered further in this review.
The Nature of the Copigment ComplexWhile there is only limited understanding of the physical
nature of the association in solution, the concept of hydropho-bic and π-π interactions causing planar stacks [60-62] is pres-ently favored, while earlier researchers had considered hydro-gen bonding to be significant [5,113]. The role of functionalgroups seems to be due to their π-cloud interactions and sterichindrance of stack formation. Much of this picture has been elu-cidated by the application of circular dichroism (CD) and pro-ton nuclear magnetic resonance (1H-NMR) methodologies thatprovide instrumental evidence of π-π interactions, similar to thosefound in nucleoside stacking [96].
Circular dichroism is measured by noting the difference inabsorbance when two beams of circularly polarized light arepassed through a solution [47,96]. One beam has a right-handedrotation while the other has a left-handed rotation at each wave-length. It has proven to be useful in detecting modifications inchiral properties due to molecular interactions such as cluster-ing and stacking. The application of CD has been able to estab-lish evidence of stacking, and the interpretation of left- or right-handed spiral stacks can be made from the sign of the first andsecond Cotton effects [60]. At a pH of 7.0, these authors pro-posed right-handed spirals for the self-association stacks ofpelagonin and cyanin and left-handed spirals for malvin, peonin,and delphin [60,62]. This pattern is altered under acidic condi-tions (pH=1.0), and all of the 3,5-diglucosides show negative firstCotton effects and, hence, left-handed spiral patterns [57] for self-association. These authors also showed that the addition of a fla-vone (flavocommelin) to commelin solutions altered the CDspectrum and suggested a one-to-one stacking under thesecopigmentation conditions [45].
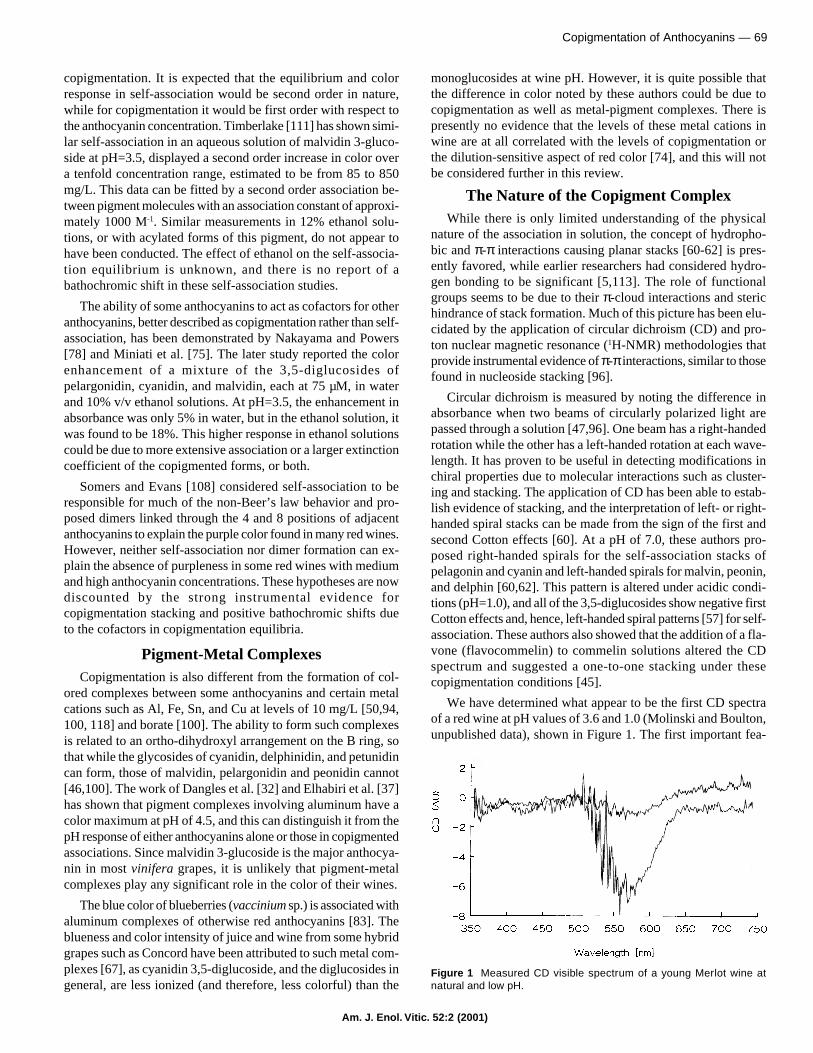
We have determined what appear to be the first CD spectraof a red wine at pH values of 3.6 and 1.0 (Molinski and Boulton,unpublished data), shown in Figure 1. The first important fea-
Figure 1 Measured CD visible spectrum of a young Merlot wine atnatural and low pH.
Am. J. Enol. Vitic. 52:2 (2001)
70 — Boulton
ture is the presence of only one negative peak with a minimumat 550 nm in contrast to the two split (opposite) peaks, whichcharacterize self-association. The larger negative difference atpH =1.0 indicates that copigmentation stacking exists and it isfar more extensive than under wine conditions. (The presenceof copigmentation at this pH would not be expected based on anumber of studies, discussed in more detail below). The nega-tive values in the region 500 to 600 nm indicate negative firstCotton effects and, therefore, left-handed spiral copigmentationstacks would be expected. The jagged curve in the 500 to 520nm regions may be due to the mixture of pigments and cofactorsin the stacks (or mixtures of stacks) within this wine. The spec-tra are different from those observed for the self-association inmodel solutions [57,60,62], where both positive and negativedeviations in the CD spectrum are observed. This is the stron-gest instrumental evidence yet that copigmentation rather thanself-association is responsible for the enhanced, nonlinear colorcontributions in red wine.
The application of proton NMR has provided further insightsinto the forms of the anthocyanin equilibria that are involved insuch stacks and the shifts that have enabled the association con-stants of the dimer stack to be estimated. For the case of malvidin3,5-diglucoside [56,57], the forms involved in the stacking areneutral and ionized quinoidal bases at neutral pH and the asso-ciation constants were estimated to be 1800 and 400 M-1, respec-tively. A recent study [63], applying the same techniques withmalvidin 3-glucoside at acidic pH values, has further developedthe picture by distinguishing two chalcone entities, the E (cis)and Z (trans) chalcones. The authors concluded that the flavyliumcation and the Z-chalcone are the stacking forms with a self-as-sociation constant of 3700 M-1 for the cations and 3080 M-1 forthe cation-chalcone copigmentation. This study also estimatedthe inter-conversion constant for the E and Z chalcone forms andfound that the association constants, especially that of theflavylium cation ionization, were concentration dependent. Theapparent pKh values ranged from 3.0 (at 0.14 mM) to 3.4 at (0.68mM) compared to that reported of 2.6 [23,24]. At wine condi-tions of 200 to 800 mg/L of anthocyanin, these values would beeven higher, causing much more of the flavylium cation to bepresent at wine pH. This finding has an important effect on theuse of methods for estimating anthocyanin content, which arebased on color measurements, and the need for the pH and ion-ization functions to be included in them. The corresponding pro-ton NMR studies have yet to be performed on model solutionscontaining anthocyanins and copigmentation cofactors, such ascatechin, myricetin, and quercetin derivatives.
Techniques for the measurements of the size distribution ofthese copigmentation stacks or aggregates do not appear to ex-ist. The associations will be referred to hereafter as stacks sinceplanar stacking was previously suggested for copigmentation [45]and for the self-association of malvidin 3,5-diglucoside [56,61].Based on NMR measurements, Hoshino proposed that discretespiral stacks containing 10 molecules each could be formed,given an angle estimate of 20 degrees. The possibility of per-fectly superimposed stacking has been eliminated based on theobserved CD patterns which require some angle between adja-cent molecules [56].
While the stoichiometry of many copigmentation aggregatesseems to be approximately 1:1 between the anthocyanin and thecofactor, a distribution of stacks ranging from 2 to 10 sheets eachmight be expected. With few exceptions (arginine and histidine,CH-π interactions), all of the significant cofactors have at leastone benzene ring in their structure (π-π interactions). The stron-ger cofactors are typically flavonoid derivatives that contain 3to 6 hydroxyl groups, with the strongest of them being the 4position flavones [5,31], based on studies with 3,5-diglucosideanthocyanins. The strongest known cofactors have electron with-drawing groups in the rings, which would favor the face-to-facestacking arrangement.
In an alternative view, Asen et al. [5] considered hydrogenbonding and Williams and Hrazdina [121 have proposed inter-actions that are end-to-end in nature, typically between thequinoidal oxygen of the anthocyanin and the vicinal dihydroxyof the cofactor. There are, however, no convincing instrumentalmeasurements to support these arrangements, and the changesin the energy states of the molecules would have to be some-what localized and inductive in nature. The end-to-end configu-ration is more akin to the carbonyl and oxy anion complexes withmetal chelation of Al [32] or with CH-π interactions [82] but notthe planar vertical stacking, based on π-π interactions. As thestrongest known cofactors are the flavones (myricetin,kaempferol, and quercetin and their derivatives) and the 6 C- and8 C-glucosyl apigenins (the vitexins and orientins), it is difficultto see how these substitutions into the benzene ring can be com-patible with induction effects that would enhance the end-to-endconfigurations.
At present, there are no quantitative relationships betweenmolecular structure, chiral properties, and either thebathochromic shift in maximum wavelength or the enhancedextinction coefficients that are observed in these solutions. Re-cent advances in molecular modeling, even for spatial arrange-ments in vacuum, would appear to be promising in terms of theprediction of likely molecular orientations as the cofactor andpigment approach each other, and the resultant excitation ofenergy states that might be related to the extinction and wave-length changes. Research into the role of solvent molecules onsuch structures and interactions has also significantly advancedin the past decade and adds to the interest in considering suchapproaches in the future. These methodologies would provide afar more convenient way of screening a wide array of compo-nents as potential cofactors as well as beginning to build modelsof mixture interactions and the effects of nonaqueous solvents.The obvious approach, using model solutions, has been limitedfor many years by the expense or unavailability of many naturalcofactors and the difficulty of isolating rare and trace compo-nents from natural mixture such as grape juice or wine.
In recent studies of copigmentation [79], it was noted that theUV absorbance (280 nm) of the total phenolics in wine alsoundergoes a change with dilution and time, suggesting that theremight be similar but more general associations between the phe-nolic components that influence their spectral properties. Thiseffect, while much smaller than that observed with the antho-cyanins and of no visual impact, usually leads to about a 20%loss in the absorbance at 280 nm over a three-hour period. This
Am. J. Enol. Vitic. 52:2 (2001)
Copigmentation of Anthocyanins — 71
finding supports the view of a more general phenomenon ofaggregation or stacking between cyclic molecules (such assugars, phenols, terpenes, benzyl derivatives, and pyrazines) insolutions (and in wines). Such a phenomenon might influenceother physical and chemical properties such as the headspace con-centrations (due to the solution activity and volatility) of certainmolecules, the activity of these components in oxidation andpolymerization reactions, and the binding of components or com-plexes to taste receptors and, therefore, the perception of astrin-gency, bitterness, and a range of flavor components.
The Nature of the CofactorEarly studies of copigmentation with grape pigments noted
that “tannin” additions modified the color of oenin (malvidin 3-glucoside) solutions, shifting it toward a blue rather than the moreusual red appearance [122,123]. Robinson and Robinson [94]reported ethyl gallate, aesculin, and “tannin” had a strong effecton the bluing of oenin from grapes. Gentisic and protocatechuicacids, vanillin, and quercetin had a moderate effect, and tyrosine,arbutin, salicylic and p-hydroxybenzoic acids, and catechin hadonly a slight bluing effect. Gallic acid was reported to act simi-larly [68], but the addition of quercetin, chlorogenic acid, ormethyl gallate had no significant effect on the spectra of cyani-din 3-glucoside. These findings, while somewhat confusing, sim-ply illustrate the importance of the anthocyanin concentrationand the particular pigment-cofactor pair in observing these ef-fects. Further, chlorogenic acid and quercitrin are known to begood cofactors with cyanidin 3,5-diglucoside at pH of 3.25 [5],and this suggested a poorer response of the cyanidin 3-gluco-side to copigmentation under certain conditions. Rutin (querce-tin 3-rhamno-glucoside) at 12 mM was shown to be a good co-factor for malvidin 3,5-diglucoside at pH of 3.20, providing abouta fivefold increase in color to 1 mM pigment solutions [97]. Thisstudy also found that grape seed extract and sugars provided in-significant copigmentation effects under juice and wine condi-tions. A summary of the more significant studies that will bediscussed in further detail below can be found in Table 1.
The most comprehensive investigation of the enhanced colorresponse due to the presence of individual cofactors is that byAsen et al. [5]. They determined the color enhancement (at 520nm) and shift in wavelength of the absorbance maximum (from520 nm) in aqueous solutions containing a 3:1 molar ratio ofcofactor to cyanidin 3,5-diglucoside, at pH 3.25. They found thatthe cinnamic acids (caffeic, coumaric, chlorogenic, sinapic, andferulic) provided enhancements of approximately 60 to 70% withlittle shift in the wavelength of the maximum absorbance. Bycomparison, the quercetin glycosides (rhamnose and glucose)caused shifts of 15 to 20 nm and enhancements of 150 to 200%in absorbance. Some of the most potent of the cofactors studiedwere the 6 or 8 carbon glucosides of tri-hydroxy and tetra-hy-droxy apigenin, respectively known as vitexin (and iso-vitexin)and orientin (and iso-orientin). These cofactors gave absorbanceincreases of 300 and 400% with shifts in wavelength maximumof 15 to 20 nm, like the flavones, when in solution with a 3:1excess of the cofactor. (It is interesting to note that these com-ponents were first isolated from grape leaves several years ear-lier and were thought to be phytoalexins [119].) A related report
of the flavone and flavonol levels in the leaves of several vin-ifera cultivars is that by Hmamouchi et al. [55]. Similar com-parisons of many cofactors have been reported by Haslam [48],Chen and Hrazdina [31], and more recently by Cai et al. [30],Mistry et al. [76], and Liao et al. [71]. Dramatic enhancementsin absorbance are found as the ratio of cofactor to pigment (cya-nidin 3,5-diglucoside) is increased, but these are quite specificto the cofactor.
Some of the literature involving the color in red wines hasnoted “tannin” binding with pigments, and it has become an es-sential feature of some descriptions of color equilibria [41-43,86,102]. While the term tannin was used by Willstatter[122,123] and Robinson and Robinson [94] to describe tests forpigment responses, it may have been a crude extract that con-tained significant levels of monomeric cofactors and dimers,which may be responsible for the effects observed. Ribereau-Gayon [89] reported increases in the color intensity when an-thocyanin solution was added to one containing “tannins” frompine bark, considered to mirror the situation in wines. The in-crease in color intensity is due solely to the carryover into ab-sorbance at 520 nm due to the brownness of the tannin prepara-tions used, and there is no evidence of color enhancement in thesesolutions. Scheffeldt and Hrazdina [97], however, found a verypoor color response when a grape seed extract was added to 200µM malvidin 3,5-diglucoside at a pH of 3.2. This extract wouldundoubtedly contain significant levels of grape seed tannin andbe classified as “tannin” in most tests. It is important to note thatvirtually all studies of copigmentation phenomena have focusedon the monomeric components as cofactors and that there doesnot appear to be any evidence in model solutions of polymericphenols (tannins) being copigmentation cofactors.
There has been some suggestion that components from newoak barrels can lead to color enhancement, but it is not clear ifthis is simply due to adsorption of free sulfur dioxide onto freshlycharred surfaces or to some extraction of components that areacting as copigmentation cofactors and complimentary to thosealready present in the wine. There is evidence that significantamounts of anthocyanins can be adsorbed onto the surface of newoak casks [89] and that any copigmentation effect would haveto overcome this effect to show a net increase in color. Part ofthe confusion may have arisen from the use of the sum of theabsorbances at 420 nm and 520 nm [110], as a measure of colorintensity. With this measure, any compound that contributes toan increase in “brownness” would be considered in some defi-nitions to increase the “color.” Measurements of copigmentation(rather than color density) after the addition of tannin fractionsand extracts, from both grape seed and oak wood sources, eitherin model solution mixtures or directly in young wines should beconducted to clarify this situation.
Perhaps the strongest case against the role of polymericphenols being involved in the copigmentation of red wines comesfrom a recent study of almost 100 wines, using partial leastsquares methodologies, in which more than 95% of the varia-tion in the copigmented color could be accounted for by consid-ering only monomeric phenols as cofactors [36]. This resultimplies that the variation in copigmentation that can be accounted

Am. J. Enol. Vitic. 52:2 (2001)
72 — Boulton
Table 1 Summary of pigments, cofactor, and conditions of major copigmentation studies of relevance to wine.
Author(s) and date Anthocyanin and cofactor [Anthocyanin] Buffer system Commentsand
cofactor/ pigmentEnhancement,
ratio(A-A0)/A0 (%)
Asen et al. 1972 [5] Cyanidin 3,5-diglucoside and 6 mM Citrate-phosphate Enhancement of 20% arginine, proline,30 cofactors (amino, benzoic Ratio of 3.0 pH = 3.32 benzoic acids, 60 to 80% caffeic acid,and cinnamic acids, flavan- catechin, 220 to 240% quercetin and3-ols, flavonols, flavones) kaempferol glucosides, 467% swertisin.
Wavelength shift (0 to 33 nm).
Asen et al. 1972 [5] Delphinidin 3-glucoside, 3,5- 2 mM Citrate-phosphate Wavelength shift (15 to 30 nm).diglucosides of pelargonidin, Ratio of 3.0 pH = 3.32 Enhancement of 200% to 560% for thecyanidin, peonidin, petunidin, diglucosides, 10% for the monoglucoside.and malvidin with quercitrin
Asen et al. 1972 [5] Cyanidin 3,5-diglucoside and 50 µM, 500 µM, Citrate-phosphate Self-association effect 10% at 500 µM andquercitrin and 5 mM pH = 2.12, 3.16, 200% at 5 mM. Wavelength shift
Ratio of 1.0 4.15, and 5.10 independent of pH. No copigmentationeffect at pH 2.12 and 5 mM.
Asen et al. 1972 [5] Cyanidin 3,5-diglucoside and 5 mM, 7.5 mM, and Citrate-phosphate Enhancement proportional to cofactor toquercitrin 10 mM pH = 4.38 pigment ratio and increases more
Ratios of 0.1, 0.5, 1.0, than expected with pigment concentration.2.0, 3.0, 4.0, and 6.0
Scheffeldt & Hrazdina Malvidin 3,5-diglucoside, 200 µM Tartrate-malate Enhancements of 1000% for 3,5-1978 [97] malvidin 3-glucoside and their Ratios of 0 to 12 pH = 3.2 diglucoside,150% for 3-glucoside at
acylated forms with rutin ratio of 12. Shifts of 45 nm at ratio of 12.
Williams & Hrazdina 3,5-diglucosides of cyanidin 250 µM Citrate-HCl for Enhancements of 500% at pH 1.0 and1979 [121] and malvidin, some acylated Ratio of 12 pH 1.0 to 4.0 ratio of 12. pH effects from 1.0 to 7.0.
forms with rutin Little acylation effect.
Chen and Hrazdina Malvidin 3,5-diglucoside with 1 mM Phosphate-citrate Enhancements of 200% myricetin, 172%1981 [31] 23 flavonoid and phloroglucinol Ratio of 4 pH = 3.2 fitesin, 167% quercetin, 149% quercitrin,
derivatives 129% apigenin 7-glucoside, 35% cat-echin. Shifts from 6 nm catechin to 34 nmmyricetin.
Brouillard et al. Malvidin 3,5-diglucoside with 773 µM Phosphate-acetate Effect of temperature 10 to 60°C. Ion1989 [25] chlorogenic acid Ratios of 0, 1, 5, 10, pH = 3.65 strength effect. No shift observed. Keq
and 20 values. Concentration product analysisgiven.
Cai et al. 1990 [30] Malvidin 3,5-diglucoside with 100 mM Acetate Enhancements of 15% B2, 18% methylchlorogenic acid Ratio of 2 pH = 3.65 gallate and epicatechin, 44% epigalloca-
techin 3 gallate, 121% pentagalloylglu-cose, 173% quercetin 3-galactoside.Shifts from 1 nm to 19 nm (quercetin7-galactoside).
Mazza and Brouillard 3,5-diglucosides and 3-gluco- 85.8, 258 and 773 µM Phosphate-acetate Enhancements of 610% cyanidin 3,5-1990 [73] side of cyanidin and malvidin Ratios of 0, 1, 10, 20, pH = 2.74, 3.64, diglucoside, 1165% malvidin 3,5-gluco-
40, 80, 150, and 200 4.72, and 5.74 side and at pH = 3.6 and R =150, 90% cya-nidin 3-glucoside, 144% malvidin 3-gluco-side at R = 40. Effect of temperature.
Brouillard et al. Malvidin 3,5-diglucoside with 30, 60 µM Citrate-phosphate Enhancements of 14 to 68% for pyrimidine1991 [26] chlorogenic acid, caffeine, Ratios of 10, 20, 40, HCl for pH <2.5 derivatives, 50% catechin, 71%
adenosine, catechin, epica- 80, 120, and 200 pH = 0.65 to 8.0 epicatechin, 8% gallic acid, 65%techin, and gallic acid (chlorogenic acid) pentagalloylglucose at pH 3.6 and ratio of
10. Solvent effects and some Keq also.
Mistry et al. Malvidin 3,5-diglucoside with 100 µM Acetate Enhancement of 550% and shift of 30 nm1991 [76] quercetin 3-galactoside Ratios of 5, 10, 15, pH = 3.65 at R = 30.
20, 25, and 30

Am. J. Enol. Vitic. 52:2 (2001)
Copigmentation of Anthocyanins — 73
Table 1 Continued
Author(s) and date Anthocyanin and cofactor [Anthocyanin] Buffer system Commentsand
cofactor/ pigmentEnhancement,
ratio(A-A
0)/A
0 (%)
Liao et al. 1992 [71] Malvidin 3,5-diglucoside with 1,2 mM None Enhancements of 68% Phloroglucinol atepicatechin, catechin, catechin- Ratios of 8, 11, 14, pH=3.32 R = 32, 151% epicatechin at R = 14, and3-O-gallate, catechol, and 21, 22, 32, and 33 221% catechin 3 gallate at R =8. Shifts ofphloroglucinol 6 nm to 19nm. Unbuffered water and 10%
v/v ethanol solutions.
Miniati et al. 3,5-diglucosides of pelargonidin, 75 µM Phosphate-acetate Aqueous and 10% v/v ethanol.1992 [75] cyanidin, and malvidin with gallic Ratios of 0, 3, 30, pH =2.5, 3.5, and Pool of the 3 pigments. Self-association
acid, catechin, and quercetin and 0, 1, 10 4.5 and copigmentation.
Yoshitama et al. Malvidin 3-rhamonoside, 5- 2.5 mM Citrate-phosphate Enhancement of 600%. Shift of 50 nm.1992 [129] glucoside with quercitrin and Ratio of 3.2 of both pH = 3.6 and 5.8
myricitrin cofactors
Davies and Mazza Pelargonidin 3-glucoside, 258 µM and 5.16 mM Phosphate-acetate Keq values estimated. Stack proportions1993 [35] malvidin 3,5-diglucoside and its Ratio of 5, 10, 20, pH = 2.7 to 5.7 of pigment to caffeic acid 3:2 and rutin,
acylated form monardaein with 40, and 80 3:1, at pH 3.7.caffeic, chlorogenic acid, andrutin
Baranac et al. Malvidin 3,5-diglucoside 386 µM Phosphate-acetate Enhancement of 300% at R = 2.1996a [11] with rutin Ratio of 0.5, 1, and 2 pH = 3.65 Shift of 24 nm. Keq of 3300. Temperature
effect from 10 to 70°C.
Baranac et al. Malvidin 3,5-diglucoside 300 µM Phosphate-acetate Enhancement of 80% at R = 1.1996b [12} with quercetin Ratio of 0.5, 0.7, and 1 pH = 2.30, 3.20, Shift of 12 nm. Keq of 650 estimated.
and 3.65 Temperature effect from 25–60°C.
Baranac et al. Malvidin 3,5-diglucoside with 300 µM Phosphate-acetate Enhancement of 100% at R = 2.1996c [13] morin (3,5,7,2',4' pentahydroxy Ratio of 1, 2, and 3 pH = 3.65 Shift of 7 nm. Keq of 2300. Temperature
flavone) effect from 10–70°C.
Baranac et al. Malvidin 3,5-diglucoside with 386 µM Phosphate-acetate Enhancement of 250% at R = 3.1996d [14] apigenin 7-glucoside Ratio of 1, 2, and 3 pH = 3.65 Shift of 27 nm. Keq 137. Temperature
effect from 20–70°C.
Wilska-Jeszka & Strawberry and chokeberry juice 100 µM Britton buffer Enhancements of 68% chokeberry juice,Korzuchowska and pigments from strawberry Ratios of 0, 1, pH = 2.6, 3.2, 3.4, 49% strawberry juice, at pH = 3.4 and1996 [124] (pelargonidin 3-glucoside) and 10, 25, and 50 (w/w) 3.6, 4.1, 4.5, and R = 50, 38% chokeberry pigments and
chokeberry (cyanidin 3-glyco- 6.0 23% strawberry pigments at R = 25.sides) with chlorogenic acid Shifts of 6 and 8 nm. 20% loss in 10%
v/v ethanol solution.
for by dimmers and tannins (and metals, pectins and all otherpossible factors) is less than 5% of the variation observed in thecopigmented color. It also suggests that wood tannins and seedtannins are not major contributors to the copigmentation phe-nomenon of young red wines.
It is interesting to note that the levels of flavones, such asquercetin, in young red wines can be in the range 20 to 50 mg/L,while it is difficult to get more than 5 mg/L dissolved into modelwine solutions. Due to their strong copigmentation interactions,they appear to be held in wines at multiples of normal solubility,which has implications for their role as superoxide and hydroxyradical scavengers. While (+) catechin and (-) epicatechin are1.5 times faster than quercetin in the reaction with hydroxy radi-
cals, quercetin is almost three times faster in the reaction withsuperoxide radicals and more than six times faster with otherradicals [49]. This is important to in vitro and in vivo studiesusing anthocyanins obtained from wines (or other fruit products).They are likely to contain impurities of these very reactive co-factors due to copigmentation, and these may contribute signifi-cantly to the results.
The Nature of the AnthocyaninThe anthocyanins of most commercially-important
winegrapes have been identified in several studies [1,3,7,8,10,28,39,51,64,65,67,69,77,84,85,87,95,99,109]. The levelsin which they are found in grapes and wines have also been ex-
Am. J. Enol. Vitic. 52:2 (2001)
74 — Boulton
tensively studied [6,9,10,21,28,41,64,77,81,89,91,92,95,99,104,106,107,109,128].
The majority of copigmentation studies have used thediglucosides of malvidin and cyanidin as the anthocyanin ofchoice, due to their commercial availability. In the followingcomparisons, it is important to understand that the color enhance-ments noted are the combination of two effects, the strength ofthe association and the extinction of the copigmented form, andthat at present it is not possible to distinguish between them.
Asen et al. [5] compared the shifts and responses for thediglucosides of pelargonidin, cyanidin, delphinidin, peonidin,petunidin, and malvidin, and delphinidin 3-glucoside, each at 2mM, in aqueous solutions of 6 mM quercitrin. While the enhance-ment ranged from 1.1 to 1.69 AU for the diglucosides, withmalvidin 3,5-diglucoside displaying the greatest change, it wasonly 0.47 for delphinidin 3-glucoside. The shifts ranged from20 nm for the monoglucoside to between 19 and 30 nm for thediglucosides, with malvidin 3,5-diglucoside displaying the great-est shift. Williams and Hrazdina [121] found the pH response ofthe 3,5-diglucosides of cyanidin and malvidin to be similar withrutin (at 12 times excess) in the pH range 1 to 4. The acylated 3-glucosides of these pigments also displayed similar responsecurves but, typically, they were displaced about pH unit higher,as might be expected from their pKh values.
Mazza and Brouillard [73] found that the 3,5 diglucosides ofcyanidin and malvidin displayed enhancements of 196 and 327%,respectively, at a pH of 3.62 with chlorogenic acid at a ratio of40:1. The corresponding monoglucosides displayed only 90 and144% enhancements under identical conditions. However Daviesand Mazza [35] found very similar association constants formalvidin 3,5-diglucoside, pelargonidin 3-glucoside, andmonardaein (an acylated malvidin 3,5-diglucoside) with chlo-rogenic acid. The values were 263, 247, and 257 M-1, respec-tively, indicating that most of the color enhancement was due todifferences in the extinction of the copigmented forms. Thesestudies also show that the effects of acylation to be positive butslight, at least for the diglucoside case. The role of acylation maybecome important in wine copigmentation, as some cultivars, forexample Pinot noir and Sangiovese, which are low in the levelof copigmentation, are also known to lack acylated pigments.
The Influence of pHStudies of self-association of pigments have been performed
at near-neutral pH [60] as well as at mildly acidic pHs of 3.5[5,63,111]. The neutral conditions have investigated the inter-action of uncharged forms, including the blue quinoidal species.In contrast, under acidic conditions typically seen in wines, thepresence of the red flavylium cation would have to be neutral-ized with either anionic forms of the cofactor or of anthocyaninor of the buffer system.
Asen et al. [5] observed equimolar solutions of cyanidin 3,5-diglucoside and quercitrin at pHs of 2.12, 3.16, and 4.15. Thecolor enhancement was only apparent in the 500 µM and 5 mMsolutions and then only at 3.16 and 4.15. In pH 3.16 solutions,the enhancement was about 8% at the 500 µM and 45% at 5 mM
concentration, while at pH 4.15, the enhancement was 33% at500 µM and 270% at 5 mM concentration
It is not clear if all forms of the anthocyanin are involved inthe stacks of copigmentation, or only the flavylium and quinoidalbase, or the flavylium cations alone. The contribution from bothflavylium and quinoidal base would result in a bimodal pH func-tion with one part for the blue quinoidal form and the other forthe flavylium form at low pH. This has been observed by Will-iams and Hrazdina [121], with the flavylium function at pH lessthan 4 and the quinoidal base from pH 4 to 7.
An alternative view is that the flavylium cations have to bebalanced by the anionic anthocyanin forms within a stack in or-der to maintain a balance in net charge. Under this description,the ionization within the stack would differ from that of the freeanthocyanin in solution and show a different pH function alto-gether.
A third view is that all forms are involved at all pHs, and it issimply the color displayed by the flavylium ions in the stack andthe stability of the stack that result in the observed pH variation.The abundance of intact stacks might then be dependent on thepH function of other entities such as the cofactors or even of themajor counter ion in the buffer system. The pH function of colorin this last case would be the product of the ion fractions of theanthocyanin and the counter ion (such as bitartrate, di-hydrogenphosphate, or chloride), which would display a bell-shaped lo-cal maximum, like many enzyme systems.
This function is especially important in understanding thevarious reports in which the choice of buffer system seems tohave influenced the results obtained. Davies and Mazza [35] stud-ied the influence of pH on the color displayed by aqueous solu-tions of three pigments (pelargonidin 3-glucoside, malvidin 3,5-diglucoside and monardaein, pelargonidin 3,5-diglucosideacylated with malonic acid and coumaric acid) and three cofac-tors (chlorogenic acid, caffeic acid, and rutin). Solutions of 516µM to 1.55 mM showed pH maxima generally between 3 and 4for the phenolic acids, slighter higher for rutin, and with similarresults for all pigments. For malvidin-chlorogenic acid points itranged between 2 to 2.5 at pH 3 and 4 with a maximum of 3.3 atpH 3.6. All solutions showed a similar pH response between 2.0and 3.0, which may be due to their choice of a phosphate-ac-etate buffer system. The role of the buffer anion will be consid-ered in more detail in the next section.
The Role of the Buffer AnionThe fact that copigmentation with uncharged cofactors (such
as rutin or catechin) shows a similar pH response to the partiallyionized phenolic acids (such as chlorogenic and caffeic) suggestsone of two possibilities. The first is that the carboxylate of thecofactor plays little if any role, and it is the aromatic ring func-tion that has the most effect. The second is that only the un-ion-ized forms are involved, and in this case there is a need for ananion to counteract the charge of the flavylium under acidic con-ditions. The pH function of copigmentation has been found tobe bell-shaped in nature [35], with a local maximum near 3.5for a number of copigment pairs. One explanation of this pH
Am. J. Enol. Vitic. 52:2 (2001)
Copigmentation of Anthocyanins — 75
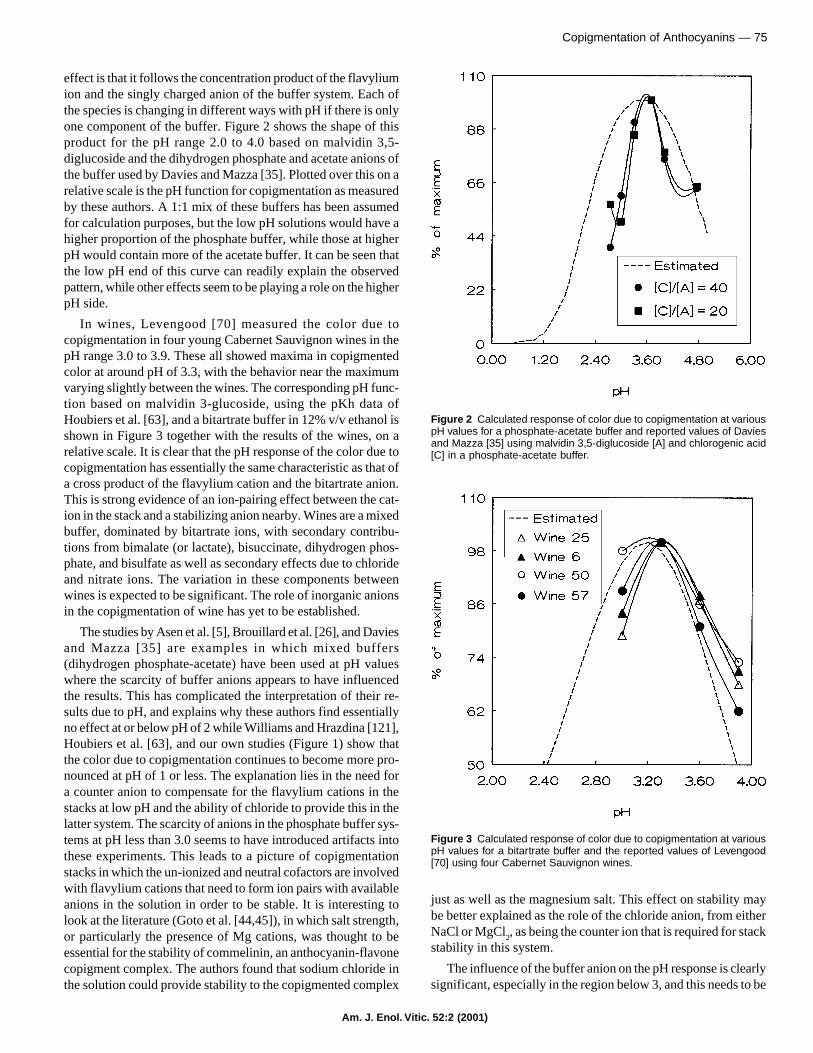
effect is that it follows the concentration product of the flavyliumion and the singly charged anion of the buffer system. Each ofthe species is changing in different ways with pH if there is onlyone component of the buffer. Figure 2 shows the shape of thisproduct for the pH range 2.0 to 4.0 based on malvidin 3,5-diglucoside and the dihydrogen phosphate and acetate anions ofthe buffer used by Davies and Mazza [35]. Plotted over this on arelative scale is the pH function for copigmentation as measuredby these authors. A 1:1 mix of these buffers has been assumedfor calculation purposes, but the low pH solutions would have ahigher proportion of the phosphate buffer, while those at higherpH would contain more of the acetate buffer. It can be seen thatthe low pH end of this curve can readily explain the observedpattern, while other effects seem to be playing a role on the higherpH side.
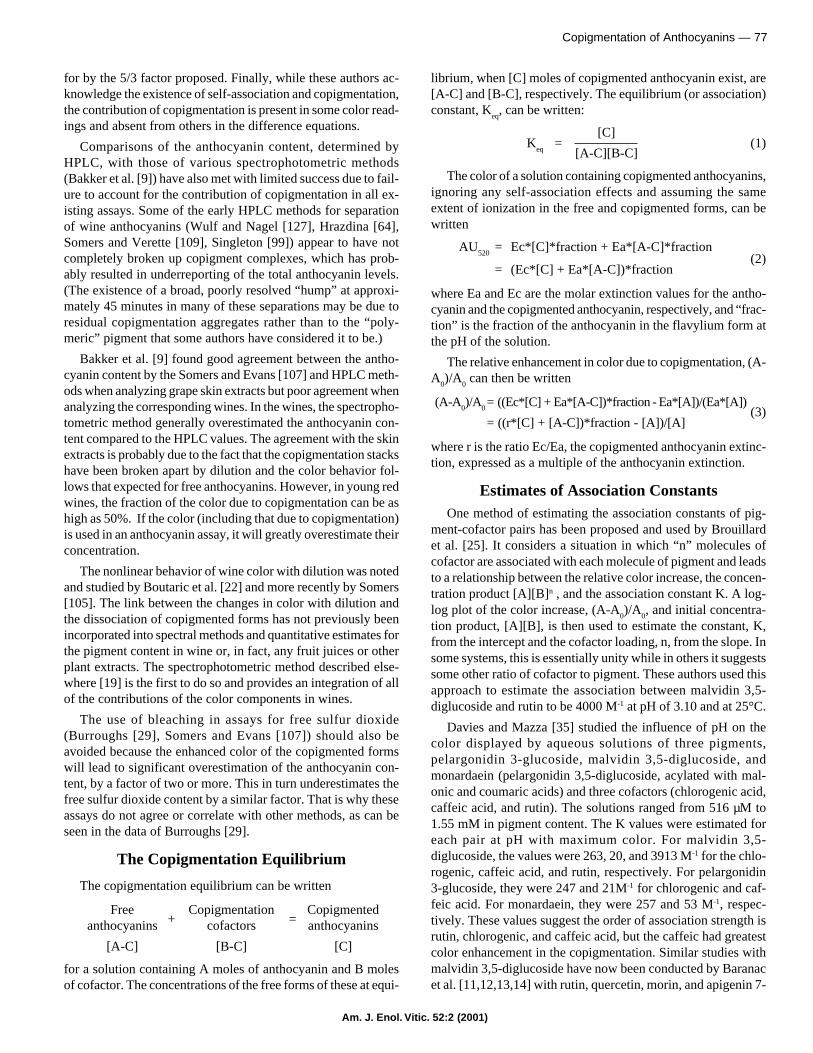
In wines, Levengood [70] measured the color due tocopigmentation in four young Cabernet Sauvignon wines in thepH range 3.0 to 3.9. These all showed maxima in copigmentedcolor at around pH of 3.3, with the behavior near the maximumvarying slightly between the wines. The corresponding pH func-tion based on malvidin 3-glucoside, using the pKh data ofHoubiers et al. [63], and a bitartrate buffer in 12% v/v ethanol isshown in Figure 3 together with the results of the wines, on arelative scale. It is clear that the pH response of the color due tocopigmentation has essentially the same characteristic as that ofa cross product of the flavylium cation and the bitartrate anion.This is strong evidence of an ion-pairing effect between the cat-ion in the stack and a stabilizing anion nearby. Wines are a mixedbuffer, dominated by bitartrate ions, with secondary contribu-tions from bimalate (or lactate), bisuccinate, dihydrogen phos-phate, and bisulfate as well as secondary effects due to chlorideand nitrate ions. The variation in these components betweenwines is expected to be significant. The role of inorganic anionsin the copigmentation of wine has yet to be established.
The studies by Asen et al. [5], Brouillard et al. [26], and Daviesand Mazza [35] are examples in which mixed buffers(dihydrogen phosphate-acetate) have been used at pH valueswhere the scarcity of buffer anions appears to have influencedthe results. This has complicated the interpretation of their re-sults due to pH, and explains why these authors find essentiallyno effect at or below pH of 2 while Williams and Hrazdina [121],Houbiers et al. [63], and our own studies (Figure 1) show thatthe color due to copigmentation continues to become more pro-nounced at pH of 1 or less. The explanation lies in the need fora counter anion to compensate for the flavylium cations in thestacks at low pH and the ability of chloride to provide this in thelatter system. The scarcity of anions in the phosphate buffer sys-tems at pH less than 3.0 seems to have introduced artifacts intothese experiments. This leads to a picture of copigmentationstacks in which the un-ionized and neutral cofactors are involvedwith flavylium cations that need to form ion pairs with availableanions in the solution in order to be stable. It is interesting tolook at the literature (Goto et al. [44,45]), in which salt strength,or particularly the presence of Mg cations, was thought to beessential for the stability of commelinin, an anthocyanin-flavonecopigment complex. The authors found that sodium chloride inthe solution could provide stability to the copigmented complex
just as well as the magnesium salt. This effect on stability maybe better explained as the role of the chloride anion, from eitherNaCl or MgCl
2, as being the counter ion that is required for stack
stability in this system.
The influence of the buffer anion on the pH response is clearlysignificant, especially in the region below 3, and this needs to be
Figure 2 Calculated response of color due to copigmentation at variouspH values for a phosphate-acetate buffer and reported values of Daviesand Mazza [35] using malvidin 3,5-diglucoside [A] and chlorogenic acid[C] in a phosphate-acetate buffer.
Figure 3 Calculated response of color due to copigmentation at variouspH values for a bitartrate buffer and the reported values of Levengood[70] using four Cabernet Sauvignon wines.

Am. J. Enol. Vitic. 52:2 (2001)
76 — Boulton
taken into account in future studies and in the interpretation ofpublished reports.
The Influence of EthanolThe role of organic solvents is to disrupt the physical asso-
ciations such as those found in copigmentation (as suggested byRobinson and Robinson [94], Boutaric et al. [22], and Somersand Evans [108]) and to modify the wavelength of the absor-bance maximum. Boutaric et al. [22] showed that the non-Beer’slaw phenomenon (that is, copigmentation) disappeared when50% ethanol was used as the diluting solution. Harborne [46]found that most anthocyanins display a bathochromic shift of themaximum wavelength by up to 25 nm in acidified ethanol, whencompared to acidified water. The anthocyanin spectra and ex-tinction values obtained in acidified methanol seem to be clos-est to those under wine conditions. In a study with rose wines,Aubert [6] found significantly lower color (15 to 35% lower) forwines diluted one to ten, with aqueous HCl than those dilutedwith an acidified ethanol (98%) solution. The dilution would havegreatly reduced the color contribution due to copigmentation, butit is not clear if this ethanol effect applies to the free anthocya-nins, the polymeric pigment, or both. Based on the absorbanceat 520 and 550 nm, the dilution with acidified ethanol providedthe most similar color pattern to those of the original wines.
Although copigmentation is present to a significant extent inred wines containing 12 and 14% ethanol, the purple appearancein young fortified red wines such as Port (18 to 21% v/v etha-nol) may be due to a combination of copigmentation and etha-nol effects. In contrast, the higher initial levels of copigmentationin cold-soaked or heated juices seem to be partly broken downby the ethanol produced during fermentation. The higher solu-bility of the flavones at higher ethanol levels in fortified winesmay have a countering effect that enables them to retain signifi-cant copigmentation levels under these conditions.
Somers and Evans [108] showed that a significant loss of coloroccurred when other nonaqueous solvents were added to wineseven though the concentration of anthocyanins was essentiallyunchanged. This can be explained by the disruption ofcopigmentation stacks due to the weakening of hydrophobicinteractions by the organic solvents used. Brouillard et al. [26]also investigated the effect of several solvents on the color en-hancement of model solutions of malvidin 3,5-diglucoside-chlo-rogenic acid at pH of 5.0 and at a cofactor to pigment ratio of12. They found that at the level of ethanol in table wines, theloss in copigmented color was about 15%, while for fortifiedwines the reduction appears to be closer to 20% for these condi-tions. Miniati et al. [75] studied the influence of ethanol (10% v/v) in solutions of the diglucosides of malvidin, pelargonidin, andcyanidin and mixtures of them. They found between 7 and 20%lower absorbances of several anthocyanin when alone, but notso when they were mixed. The pigment concentrations were 75µM, with the cofactors gallic acid, catechin, and quercetin withratios of cofactor to pigment between 1 and 30. They found littleeffect of ethanol on the color enhancement at a pH of 3.5 formalvidin 3,5-diglucoside with catechin or quercetin.
In the range of concentrations found in wines, the influenceof ethanol appears to be minor and of limited importance in the
copigmentation phenomenon. It is important, however, whencomparing wines to results obtained in aqueous media and es-pecially so for analytical methods for anthocyanins andcopigmentation involving buffered dilutions.
The Importance of Copigmentation inColor Measurements
Several methods for the assessment of color in red wines havegenerally recognized the ionizable and bleachable nature of theanthocyanins and have distinguished these from the polymericforms that are generally less sensitive to pH and less bleachedby bisulfite. Methods that follow this pattern are those presentedby Berg and Akiyoshi [17], Berg [15], Ribereau-Gayon andStonestreet [92], Ribereau-Gayon [88], Somers and Evans[106,107], and Timberlake and Bridle [113].
It is now clear that the contribution of color due tocopigmentation is also bleached with SO
2 [70]. It can now be
seen why estimation methods for the determination of anthocya-nin content using a pH shift (Ribereau-Gayon and Stonestreet[92], Ribereau-Gayon and Nedeltchev [91]) will generally un-derestimate the true value, even when performed on dilutedsamples. The common dilution factor of 10 to 1, while adequatefor older wines, is usually not sufficient to completely eliminatethe effects of copigmentation in most young wines; further, thepH function of the copigmented form does not follow that of thefree anthocyanin.
The opposite situation exists for the SO2 bleaching methods,
as they will attribute all of the color loss to free anthocyanins,when as much as half of it will be from copigmented forms inyoung wines, and these forms have extinction values severaltimes those of the free anthocyanins. The modification of isolat-ing the monomeric pigment pool on a PVPP column (Bourzeixet al. [21]) should provide more accurate estimates of total an-thocyanin content, as the copigmentation stacks are expected tobe broken up under the solvent conditions of elution and dilu-tion. This should provide the total anthocyanin pool in the ab-sence of copigmentation.
The incorporation of measurements of the SO2 bleaching of
anthocyanins, the acetaldehyde addition to eliminate bleachingdue to free SO
2, and a shift to low pH enabled Somers and Evans
[107] to propose a set of equations for the estimation total an-thocyanin content, the degree of ionization of the anthocyaninsat wine pH, and two ratios between monomeric and polymericfractions, which were referred to as chemical age indices. Theseequations, like the earlier approaches, are of limited use now, asthey try to explain wine color in terms of only monomeric an-thocyanins and polymeric pigments. The use of a diluting solu-tion that does not contain ethanol for the pH=1 reading and theassignment of the color changes due to SO
2 bleaching only to
monomeric anthocyanins are the main reasons why the antho-cyanin contents estimated by this method have been found to beunreliable and generally higher than by other methods. The de-gree of ionization calculated from these equations, when appliedto wines of different pH values, does not follow that known foranthocyanin dissociation, and there are secondary effects of pHon the extinction of the polymers that are not easily accounted
Am. J. Enol. Vitic. 52:2 (2001)
Copigmentation of Anthocyanins — 77
for by the 5/3 factor proposed. Finally, while these authors ac-knowledge the existence of self-association and copigmentation,the contribution of copigmentation is present in some color read-ings and absent from others in the difference equations.
Comparisons of the anthocyanin content, determined byHPLC, with those of various spectrophotometric methods(Bakker et al. [9]) have also met with limited success due to fail-ure to account for the contribution of copigmentation in all ex-isting assays. Some of the early HPLC methods for separationof wine anthocyanins (Wulf and Nagel [127], Hrazdina [64],Somers and Verette [109], Singleton [99]) appear to have notcompletely broken up copigment complexes, which has prob-ably resulted in underreporting of the total anthocyanin levels.(The existence of a broad, poorly resolved “hump” at approxi-mately 45 minutes in many of these separations may be due toresidual copigmentation aggregates rather than to the “poly-meric” pigment that some authors have considered it to be.)
Bakker et al. [9] found good agreement between the antho-cyanin content by the Somers and Evans [107] and HPLC meth-ods when analyzing grape skin extracts but poor agreement whenanalyzing the corresponding wines. In the wines, the spectropho-tometric method generally overestimated the anthocyanin con-tent compared to the HPLC values. The agreement with the skinextracts is probably due to the fact that the copigmentation stackshave been broken apart by dilution and the color behavior fol-lows that expected for free anthocyanins. However, in young redwines, the fraction of the color due to copigmentation can be ashigh as 50%. If the color (including that due to copigmentation)is used in an anthocyanin assay, it will greatly overestimate theirconcentration.
The nonlinear behavior of wine color with dilution was notedand studied by Boutaric et al. [22] and more recently by Somers[105]. The link between the changes in color with dilution andthe dissociation of copigmented forms has not previously beenincorporated into spectral methods and quantitative estimates forthe pigment content in wine or, in fact, any fruit juices or otherplant extracts. The spectrophotometric method described else-where [19] is the first to do so and provides an integration of allof the contributions of the color components in wines.
The use of bleaching in assays for free sulfur dioxide(Burroughs [29], Somers and Evans [107]) should also beavoided because the enhanced color of the copigmented formswill lead to significant overestimation of the anthocyanin con-tent, by a factor of two or more. This in turn underestimates thefree sulfur dioxide content by a similar factor. That is why theseassays do not agree or correlate with other methods, as can beseen in the data of Burroughs [29].
The Copigmentation Equilibrium
The copigmentation equilibrium can be written
Free+
Copigmentation=
Copigmentedanthocyanins cofactors anthocyanins
[A-C] [B-C] [C]
for a solution containing A moles of anthocyanin and B molesof cofactor. The concentrations of the free forms of these at equi-
librium, when [C] moles of copigmented anthocyanin exist, are[A-C] and [B-C], respectively. The equilibrium (or association)constant, K
eq, can be written:
Keq
=[C]
(1)[A-C][B-C]
The color of a solution containing copigmented anthocyanins,ignoring any self-association effects and assuming the sameextent of ionization in the free and copigmented forms, can bewritten
AU520
= Ec*[C]*fraction + Ea*[A-C]*fraction
= (Ec*[C] + Ea*[A-C])*fraction(2)
where Ea and Ec are the molar extinction values for the antho-cyanin and the copigmented anthocyanin, respectively, and “frac-tion” is the fraction of the anthocyanin in the flavylium form atthe pH of the solution.
The relative enhancement in color due to copigmentation, (A-A
0)/A
0 can then be written
(A-A0)/A
0= ((Ec*[C] + Ea*[A-C])*fraction - Ea*[A])/(Ea*[A])
= ((r*[C] + [A-C])*fraction - [A])/[A](3)
where r is the ratio Ec/Ea, the copigmented anthocyanin extinc-tion, expressed as a multiple of the anthocyanin extinction.
Estimates of Association ConstantsOne method of estimating the association constants of pig-
ment-cofactor pairs has been proposed and used by Brouillardet al. [25]. It considers a situation in which “n” molecules ofcofactor are associated with each molecule of pigment and leadsto a relationship between the relative color increase, the concen-tration product [A][B]n , and the association constant K. A log-log plot of the color increase, (A-A
0)/A
0, and initial concentra-
tion product, [A][B], is then used to estimate the constant, K,from the intercept and the cofactor loading, n, from the slope. Insome systems, this is essentially unity while in others it suggestssome other ratio of cofactor to pigment. These authors used thisapproach to estimate the association between malvidin 3,5-diglucoside and rutin to be 4000 M-1 at pH of 3.10 and at 25°C.
Davies and Mazza [35] studied the influence of pH on thecolor displayed by aqueous solutions of three pigments,pelargonidin 3-glucoside, malvidin 3,5-diglucoside, andmonardaein (pelargonidin 3,5-diglucoside, acylated with mal-onic and coumaric acids) and three cofactors (chlorogenic acid,caffeic acid, and rutin). The solutions ranged from 516 µM to1.55 mM in pigment content. The K values were estimated foreach pair at pH with maximum color. For malvidin 3,5-diglucoside, the values were 263, 20, and 3913 M-1 for the chlo-rogenic, caffeic acid, and rutin, respectively. For pelargonidin3-glucoside, they were 247 and 21M-1 for chlorogenic and caf-feic acid. For monardaein, they were 257 and 53 M-1, respec-tively. These values suggest the order of association strength isrutin, chlorogenic, and caffeic acid, but the caffeic had greatestcolor enhancement in the copigmentation. Similar studies withmalvidin 3,5-diglucoside have now been conducted by Baranacet al. [11,12,13,14] with rutin, quercetin, morin, and apigenin 7-

Am. J. Enol. Vitic. 52:2 (2001)
78 — Boulton
glucoside; the K values reported were 3300, 650, 2300, and 137M-1, respectively.
The reported values of K obtained using this method are infact a product of the true equilibrium constant, K
eq, and the ex-
tinction of the copigmented anthocyanin, Ec, as this is imbed-ded in the (A-A
0)/A
0 variable. This issue will be considered in a
later section in more detail.
A Simple Analysis of the NonlinearBehavior of Wine Color
The copigmented anthocyanins can be considered to be in adissociable equilibrium with free anthocyanins and free cofac-tor compounds. The dilution of a sample at constant pH and ionstrength leads to the progressive dissociation of the copigmentedforms. At high dilutions, typically 19:1 or 24:1, virtually all ofthe copigmented anthocyanins have returned to the ionizationequilibrium involving the flavylium cation, the pseudobase, andthe chalcone forms. This loss in color with dilution can be usedin calculations of the fraction of color that is due tocopigmentation.
The equilibrium relationship (eq. 1) can be rearranged to give
([C]2 - ([A]+[B])[C] + [A][B])Keq
= [C] (4)
which can be solved for [C], the concentration of copigmentedanthocyanin, for a given value of K
eq and any concentrations of
A and B. The amount of copigmented anthocyanins formed, [C],can be found as the positive root of the quadratic equation. Forthe general case in which [A] does not equal [B]
[C] = ([A]+[B]+1/K
eq) - √[([A]+[B]+1/K
eq)2 - 4[A][B]]
(4a)2
and for the special case in which equal concentrations of pig-ment and cofactor exist, [A] = [B]
[C] = (2[A]+1/K
eq) - √[(2[A]+1/K
eq)2 - 4[A]2]
(4b)2
This provides the relationship between the concentration ofcopigmented anthocyanin [C], the total anthocyanin content [A],and the equilibrium constant K
eq. This expression can be applied
at other concentrations that have been developed by a series ofdilutions to estimate the extent of copigmentation in variouswines or other anthocyanin solutions.
For diluted solutions, the concentrations of all componentscan be written more generally as [ ]/(m+1) for a (m+1)-fold di-lution. The expression for the copigmented anthocyanin concen-tration at any dilution is then
[C]m+1 = (2[A]/(m+1)+1/Keq) - √[(2[A]/(m+1)+1/Keq)2 - 4[[A]/(m+1)]2]
2 (4c)
The response of the color due to copigmentation at variousdilutions can be calculated using eqs. 3 and 4c, which can beadded to the diluted contributions from the free anthocyanins andthe polymeric pigment to provide a general relationship for winecolor at any dilution. Such an equation can be used with the ab-sorbance readings at several dilutions to estimate the total an-
thocyanin content, [A], the apparent association constant, Keq
,and the extinction of copigmented anthocyanin. This has beendone for many wines from the 1995 harvest in California andcompared to estimates from an improved spectrophotometricmethod for copigmented color and anthocyanin content [19].Equation 4c also provides the mathematical expression for thenon-Beer’s law behavior in wines, noted by Boutaric et al. [22]and Somers [105] and illustrated in Figure 4.
The Influence of the Cofactor/Pigment RatioThe amount of copigmented anthocyanin [C] in the equilib-
rium described in eq. 1 can be increased by increasing either theconcentration of total anthocyanin or of cofactor or both. It ap-pears that the extent of copigmentation in wine is determined bythe quantity of available cofactors, which can be limited by ei-ther their concentrations in the grape or, in some cases, theirsolubility in the juice or wine. In wines, the total anthocyanincontent varies from 150 mg/L (350 µM) in some Pinot noir winesto 800 mg/L (1.85 mM) in some Merlot wines. The concentra-tions of some of the weaker cofactors, such as catechin, can be150 mg/L (750 µM) and for stronger ones such as myricetin,kaempferol, and quercetin can be 30 mg/L (200 µM). As a re-sult, the cofactor to anthocyanin ratios are likely to be in the range0.05 to 2, which can have a dramatic influence on the color dis-played by a given concentration of anthocyanins.
For any chosen anthocyanin-cofactor pair, the response incolor to an increasing ratio of cofactor to anthocyanin follows asigmoidal rise from the color of the free anthocyanin solution toan upper limit when virtually all of the anthocyanins are in thecopigmented form. Typical situations are shown in Figure 5, fordifferent association constants and a given anthocyanin-cofac-tor pair. It is clear that in most wines the lack of cofactors causesthe anthocyanins to display only a small fraction of their poten-tial color (at high cofactor to pigment ratios).
Figure 4 The buffered-dilution curve of color at 520 nm for a Shiraz wine[109] and the best-fit form of eqs. 3 and 4c.

Am. J. Enol. Vitic. 52:2 (2001)
Copigmentation of Anthocyanins — 79
While the overall relationship is sigmoidal, there are sectionsof it that appear to be quite linear over small intervals of cofac-tor-anthocyanin ratio, and this has been observed in a number ofstudies. Asen et al. [5] studied quercitrin/cyanidin 3,5-diglucosidewith ratios of 0.1 to 6 at pH=4.38 and pigment concentrations of5, 7.5, and 10 mM. At low cofactor to pigment ratios, the extentof color enhancement is small and limited by the availability ofcofactor. At intermediate ratios, there is moderate copigment for-mation and strong response due to the concentration of cofac-tor. At high ratios, the concentration of copigmentation is largeand the system is limited by the availability of free anthocyaninand is weakly responsive to increases in cofactor. All of thesesolutions exhibited linear responses in color with increasingcofactor-anthocyanin ratio, and the color increase is more thanexpected from the pigment self-association.
The most comprehensive tabulation of response of variouscofactors when present in a 3:1 excess at a pH of 3.32 is that ofAsen et al. [5] and another using cofactors of interest to wineconditions is that of Brouillard et al. [26]. Several other cofac-tor-anthocyanin pairs have been studied and a number of themhave used large excesses of cofactor to pigment, a condition thatdoes not appear to occur in wines: Williams and Hrazdina [121],Chen and Hrazdina [31], Cai et al. [30], Davies and Mazza [35],Liao et al. [71], Mazza and Brouillard [73], Miniati et al. [75,Mistry et al. [76], and more recently Baranac et al. [11,12,13,14].Most of the dramatic effects are observed at very large cofactorto pigment ratios, and the upper levels of these experiments areoften limited by solubility of the cofactor. An alternative ap-proach can be found in the studies of Scheffeldt and Hrazdina[97], in which the pigment concentration is increased for a givencofactor level. As would be expected, at high pigment to cofac-tor ratios, the color due to copigmentation rapidly decreasesto that of the pigment alone. The cofactor to pigment ratio andthe conditions employed in these studies are summarized inmore detail in Table 1.
It is interesting to contrast the curves for the ratio approach,in Figure 5c, with those of the concentration product approachof Brouillard et al. [25], in Figure 6, for the color increases as a
function of increasing cofactor levels. For any of the curves, theslope changes dramatically even though it is essentially linearover several small intervals of the ratio. It is also true that eachcurve has a region in which the slope may be unity, but otherregions where it is not. The slope of this curve, unlike Brouillard’sconcentration product approach, cannot be interpreted to provideinformation about the ratio of pigment to cofactor in the stacks,as it is generated from a fixed proportion, that of one to one. In-spection of Figure 6 reveals that while at low concentration prod-uct values where the cofactor is in excess, the slope is constant,while a region of pigment excess, where the slope decreases tozero, appears at high concentration product values. These con-ditions do not appear to have been explored in Brouillard’s analy-sis or commented on by previous authors using this approach.
A B C
Figure 5 The estimated color response for an aqueous solution of malvidin 3-glucoside (10 mM, pH=3.6) as a function of the molar ratio of cofactor [B],to pigment [A], for 3 values of the association constant, K (linear-linear axes, A; log-linear axes, B; and log-log axes, C).
Figure 6 The estimated color response for an aqueous solution of malvidin3-glucoside (10 mM, pH=3.6) as a function of the molar product of co-factor [B] and pigment [A] for 4 values of the association constant, K.
Am. J. Enol. Vitic. 52:2 (2001)
80 — Boulton
As a result, there are regions in curves of this type that will be(and have been) interpreted to mean that the ratio of cofactor tocopigment is something other than one. Some studies, for ex-ample Davies and Mazza [35], in which ratios between 0.38 and0.86 are reported for malvidin 3,5-diglucoside and caffeic acid,may be examples of this situation.
The ratio approach indicated in Figure 5 also provides (bynonlinear fitting) an estimate of the extinction value of thecopigmented anthocyanin, as well as the association constant,based on the one-to-one stacking. (It can be easily modified forother ratios if evidence supports them). In contrast, the concen-tration product approach, as presented, cannot estimate the ex-tinction value because it is lumped with the association constantin the “apparent K” derived by this method. The K values de-rived from Figure 6 would be 400 while the true K
eq would be
100 and the copigmented enhancement, (Ec-Ea)/Ea, is 4.0 in thisexample (where Ec = 5*Ea). The concentration product approachuses the intercept to provide K
eq when in fact it is providing (Ec-
Ea)/Ea*Keq
values. As a result, combinations of pigment andcofactor that have higher Ec values will be (and have been) mis-interpreted to have high binding constants (Brouillard et al. [25],Mazza and Brouillard [73], Brouillard et al. [26], Davies andMazza [35], and Baranac et al. [11,12,13,14]). Care should betaken with this approach in future interpretations ofcopigmentation studies. A wider range of the concentration prod-ucts should be employed, so as to include the saturation region.The value of (A-A
0)/A
0 at saturation then provides the ultimate
color of the copigmented form, (Ec-Ea)/Ea, and this, while valu-able in itself, would enable the true K
eq value to be estimated.
This estimation has yet to be done in any of the reports that havebeen published to date.
Copigmentation Effects in Wines
The copigmentation of anthocyanins in wines will be a com-petitive equilibrium involving several anthocyanins and manycofactors, with some of the concentrations being determined byinitial levels in the grapes and others by limited solubility. It isnot clear how dependent the equilibrium is to changes in cofac-tor concentration, and it will be continually re-adjusting as freepigment is converted into colored polymer, especially during thefirst year of wine aging and as cofactors are oxidized or hydro-lyzed. The role of cofactors and copigmentation during skincontact and fermentation of wines can be seen as twofold. First,the binding of free anthocyanins into copigmented forms enablesmore pigment to be retained, resulting in higher total anthocya-nin content in the wine. Second, the copigmented anthocyaninsprovide much more color than they would have if they were inthe free form. Wines made from grapes low in cofactors will notbe able to form much copigmentation and will have low pigmentcontents. This seems to be the case for Pinot noir and Sangioveseand is why sometimes poorly colored wines result from darklycolored berries. Such wines are generally cherry-red when youngand show no sign of purpleness. Other wines, from grapes richerin cofactors, will form more copigmentation, capture more pig-ment, and have deeper color with the blue and purple tones char-acteristic of significant copigmentation.
The acylated forms of the non-malvidin pigments seem to beinvolved in strong copigmentation, which means that wines pre-dominantly malvidin in their anthocyanin makeup may havepoorer color. This is partly the reason for poorer copigmentationin Pinot noir (and Sangiovese), which lack the acylated pigments[59,87]. There is a critical need to assess the pigment patterns ofall major wine grapes to understand their potential forcopigmentation based on anthocyanins, as well as comprehen-sive surveys of their cofactor pools.
While it would not be expected that the solubility of antho-cyanin is limiting the color of red wines, it does appear that theability to form significant copigmentation stacks parallels thepigment content of wines from Pinot noir, Nebbiolo, Sangiovese,Zinfandel, Cabernet Sauvignon, Cabernet Franc, Merlot, Durif,and Petite Verdot [79,116]. The concentrations of pigment re-tained in wines after fermentation will be due to a combinationof effects, including partitioning of pigments (and cofactors)between the skins and the wine, copigment formation, and ad-sorption of soluble pigments (and cofactors) onto grape pulp,seeds, and yeast. The formation of copigmentation will enhancethe apparent solubility and perhaps reduce the extent of adsorp-tion from solution, with a net result of increased anthocyaninlevels in wines with more ability to form copigmented antho-cyanins.
Influence of Copigmentation on ColorExtraction
The copigmentation phenomenon and its behavior as a dy-namic equilibrium is of central importance to the understandingof the limitations to color potential, anthocyanin capturing, andpigment retention in wines. The extraction of pigments fromgrape skins either prior to, during, or following fermentation isfar from complete (typically only 30 to 40%; Singleton and Esau[100] and Van Balen [117]). The evidence suggests that an equi-librium based on adsorption-desorption is established betweenthe concentrations in the wine and the cellular concentration inthe skin tissue, with significant reductions as the ethanol con-tent increases. The role of copigmentation is to shift pigmentsout of the free anthocyanin pool of the adsorption equilibrium,causing more pigment to move from the skins into the wine. Theextent to which this can occur now seems to be limited by theconcentrations of certain cofactors in the skins at harvest and theirsolubility under wine conditions.
A widespread misconception is that color is simply extractedwith time of contacting or improved mixing and this has led toconsiderable confusion regarding what determines the pigment,monomeric phenol, and tannin content of a young wine. As aresult, a range of alternate contacting and mixing practices existwithin almost every wine region, each with its advocates, butwithout consensus. Many studies have shown that additionalcontact time between skins and wine cannot provide additionalanthocyanin content or color [2,15,16,38,53,54,77,80,89,90,110,108,117]. It is noteworthy that three of these studies[16,54,89] reported increased tannin levels under extended con-tact, and that this additional tannin content did not lead to fur-ther capturing of the pigments.

Am. J. Enol. Vitic. 52:2 (2001)
Copigmentation of Anthocyanins — 81
The existence of an extraction equilibrium (and therefore lim-its to pigment extraction) is easily demonstrated by taking skinstaken from red wine after the maximum pigment concentrationhas been attained and putting them into a white juice. While thepigments are not able to move into the wine from which theywere taken, where an equilibrium concentration had beenreached, they will readily move from the skin tissue into the newjuice until a new equilibrium is established.
The extent of this equilibrium, and hence the color of a youngwine, would then be controlled by the concentrations of pigmentsand cofactors in the berries and the juice volume in which theyare in contact. Other than the initial rate of movement into thewine, the contacting and mixing practices would have little in-fluence on the final equilibrium concentration of the pigments,which is what is actually observed in virtually all red wines. Therole of higher temperature has dual and competing contributions.It enhances the solubility of most species, but especially thosecofactors that have limited solubility, enhancing the pool ofcopigmented pigments. Thermodynamically, however, it favorsthe dissociation of copigmented forms and may actually cause aloss in the color due to copigmentation. On cooling, and often inthe weeks and months following fermentation, precipitation canoccur of the excess cofactors, usually resulting in some pigmentprecipitation and significant color loss.
The influence of the juice volume is to establish the concen-tration of free anthocyanin that results from the amount of an-thocyanins that move from the skins into the juice. This move-ment will continue until the free anthocyanin equilibrium hasbeen established and the effects on copigmentation are due tothe second-order contributions from both the pigment and thecofactor concentrations. That is why berry size seems to be im-portant in the color of some red wines and why there can be ef-fects due to increasing the proportion of skins to juice, either bythe addition of other skins or the removal of some juice in thepractice of “bleeding.” However, these results are not generallytrue and often no enhancement in color is observed. The effecton final color will be limited if saturation has been reached forthe major cofactors [98].
Physical limitations to the establishment of the color equilib-rium can result from mass transfer due to the mixing of skinsand juice, and while enhanced rates of extraction can be achievedin some methods, the same pigment equilibrium is expected tobe established. While some investigators and winemakers do nothold this view, well-controlled studies testing the influence ofextraction methods on all of the components involved in the colorequilibrium have yet to be reported. There are several studiesthat have shown the attainment of pigment and color maximaduring the first half of traditional fermentations (punched-downor pumped-over) and that further skin contact has no effect inincreasing pigment concentration or retention [15,16,38,53,54,77,80,89,90,108,117]. The use of alternative contacting regimeshas yet to demonstrate any ability to modify this equilibrium otherthan by temperature effects, most of which seem to be short-term.These regimes include the use of complete, or fractional, draw-ing of the juice from the skins prior to its return (de l’ estage),soaking of skins prior to the onset of fermentation (“presoak”),keeping of juice and skins together for a period of weeks after
the end of fermentation (“extended maceration”) or continuous(or periodic) pump-overs, a submerged skin cap, punching-downof the skin cap or rotary fermentors. While all of these treatmentshave the potential to modify the true extraction of most otherphenols and tannin levels, particularly the tannins from seeds,there is no evidence that they can enhance the copigmentationequilibrium or wine color to any significant degree in the long-term. The same seems to be true of various enzyme preparationsthat have been tested for color enhancement.
The view that this equilibrium is predetermined by the com-position of the grapes would suggest that the enhancement ofcolor is not possible, even with enhanced extraction by cell wallbreakdown. While they may provide short-term results of highercolor, such methods do not seem to provide enhancements thatremain after the exposure to barrel surfaces and months of ag-ing at cellar temperatures. It appears to be generally true that thefactors controlling the solubility and retention of pigments inyoung wines are more important than contacting methods indetermining wine color. That is one explanation for why a widerange of alternative contacting and extraction practices continueto be used, with no single method being significantly better thanothers in terms of color retention.
Further evidence that the initial composition is the major in-fluence on final wine color can be found in experiments in whichthe grape composition has been modified by the addition of col-orless cofactors. These additions, of natural grape constituentssuch as caffeic acid and catechin, to juices prior to fermentationhave resulted in significantly enhanced pigment retention in thecultivars Listan negro [33,34] and Pinot noir [27]. These colorenhancements are stable (retained for more than a year) andgreater than any effects due to temperature, enzyme treatments,or skins-juice contacting methods that have ever been reported.
It is now of great importance to renew the search for relation-ships between the pigment and phenol composition of grapes andtheir corresponding wine. Until recently, the color of wine dueto the anthocyanins could not be calculated from a chromato-graphic analysis and the anthocyanin content could not be accu-rately determined by spectrophotometric methods, both becauseof the influence of copigmentation. Further, there has been anoverdue emphasis on the anthocyanin content of skins. It is nowclear that the levels of copigmentation cofactors are at least asimportant, and in many cases more important. In light of this, itis necessary to reassess many of the conclusions from previousstudies and to rethink many of the ideas that have been devel-oped concerning the influence of viticultural conditions andwinemaking practices on the color of young and aged red wines.
Cofermentation of Red Grapes fromDifferent Cultivars
The possibility exists in which red grapes that are deficient incertain cofactors might benefit from being fermented in the pres-ence of others that might have an excess of them, especially ifthey are cofactors, such as the flavones, with limited solubility.The ability to form additional copigmentation during fermenta-tion would give rise to more deeply colored wines than wouldoccur simply by blending the individual wines that had been

Am. J. Enol. Vitic. 52:2 (2001)
82 — Boulton
fermented separately. The grape mixture may be of different lotsof the same cultivar or it may be of different cultivars. Enhancedcolor will not be seen in all cases since the extent of the effectwill depend on the ability of some of the grapes to benefit fromadditional cofactors and the ability of other grapes in the mix-ture to provide those cofactors.
Cofermentation of White and Red GrapesThe extension of this reasoning of grape mixtures includes
the possibility that certain white cultivars might be rich in co-factors and that when cofermented with red grapes deficient incofactors, more copigmentation and capturing of the anthocya-nins could occur, giving more color in the resultant wine. Be-cause white juices are not usually fermented on their skins, thelevels of certain cofactors, especially the slightly soluble flavonespresent in the skins, will not usually be reflected in the phenolicanalysis of these wines. The traditional use of some white grapes,such as Trebbiano or Malvasia, with Sangiovese and other redgrapes in certain regions of Italy, are good examples of this.Others examples exist in certain wine regions of France, Spain,and Argentina. The increase in color of a port wine when a whiteskin extract was introduced was noted by Timberlake [112], andit is an example of color enhancement due to copigmentation,resulting from the cofactors from the white skins.
Gogliotti et al. [40] has shown, based on the wines from sixseasons, that the best color enhancement of one-year-oldSangiovese wines occurred when Trebbiano and Malvasia com-prised between 5 and 15% of the grape mix and a further 10%was from Canaiolo. The addition of too high a percentage ofwhite grapes will lead to progressive pigment adsorption to theskins and pulp, beyond any color enhancement effects, result-ing in a net loss in color. Any concern regarding dilution (orextension of the red wine volume) can be overcome when onlythe pressed skins are used. However, there will be no advantagein this approach if the red grapes already have sufficient amountsof the cofactors or if the white grapes have insufficient amountsof cofactors to give. It is clear that not all white cultivars will besuitable or acceptable and there are many possible combinationsthat need to be investigated. Seasonal effects on the outcome ofsuch a practice are to be expected.
Color Loss in the Months after FermentationThe formation of maximum color by midfermentation and
then a loss of some of it in the days and weeks following the endof fermentation is a pattern that has long been known and widelyreported [15,38,52-54,77,80,89,90,108,110,117]. This has gen-erally been attributed to a fall in anthocyanin content, althoughthe loss in color is a larger percentage than that observed in theanthocyanin content [90]. This larger loss in color than can beaccounted for by the loss in anthocyanins may be due to a breakupof the copigmentation stacks formed earlier in fermentation.
The shape of the anthocyanin concentration curve during fer-mentation has been described mathematically in terms of anexponential approach to a limiting value, followed by a later,slower depletion to a lower value [18]. This has been postulatedto be due to diffusion-controlled extraction phase, which reachesan extraction equilibrium, followed by secondary adsorption
phase (to grape pulp, seeds, and yeast) as the ethanol concentra-tion increases toward the end of the fermentation. The additionalcolor loss by adsorption onto stems when they are present hasbeen well documented, and this appears to be an extension ofthe more general adsorption onto pulp and yeast. Hilgard [53,54]noted the fall in color after fermentation and showed it to begreater in fermentations at 32 and 20°C than at 25°C. It rangedfrom almost nothing in a Teinturier sample to typically 30% inCabernet Sauvignon, Zinfandel, and Barbera wines [52].
If the adsorption involves primarily the free anthocyaninforms and not the copigmented forms, wines low incopigmentation would be more easily depleted of their antho-cyanins by this action. As the solubility of anthocyanins inwinelike solutions is much greater than that found in most wines,it appears that concentrations beyond that of the natural distri-bution between the skin and the wine levels must be due to theresult of copigmentation.
Further loss in color due to adsorption of either free pigmentsor cofactors onto the surfaces of new barrels is expected (andhas been shown in one case [89]). The extent of this would bewine-specific, and it will alter the equilibrium that is in effectduring the polymerization reactions that will occur in the subse-quent aging of the wine.
The Color Contribution of Wines to BlendsA common challenge for winemakers is to understand the
color exhibited by different wines and that displayed when theyare blended. This especially true when these are young wines inwhich most of their color is accounted for by the free andcopigmented anthocyanins. The nonlinear loss of copigmentedcolor with dilution applies to each wine in a blend, and the colorof the blend will not always be in relation to the volume and colorof the wines used. While a small amount of deeply colored youngwine might be chosen to add color to older aged red wines, atsmall additions it will be extensively diluted. The implicationbased on copigmentation is that it can only give the non-copigmented fraction of its color to the blend, which would typi-cally be 70%, or as little as 50%, of its initial color. Boutaric etal. [22] and Winkler and Amerine [125,126] have both shownthe nonlinear nature of the color of red wine blends, when at leastone wine is young enough to have significant copigmentation.When there is insignificant copigmentation in either wine, usu-ally in wines that have been aged for a year or more, the color ofthe blend then follows the expected linear relationship with thevolume of the fractions used.
Behavior of Copigmentation toward Finingand Cold-Holding Treatments
The presence of copigmented forms of the anthocyanins callsfor a fresh look at the effects of various other winemaking treat-ments such as fining and cold-stabilization on the color of youngred wines. Because the copigmented form is so much more col-orful than the free form, any treatments that cause some disso-ciation of the copigmentation stack can have more effect on colorthan that due to anthocyanin depletion.
The importance of the cofactors in the extent ofcopigmentation has already been emphasized and the limited

Am. J. Enol. Vitic. 52:2 (2001)
Copigmentation of Anthocyanins — 83
solubility of some of the more potent ones has been mentioned.The effect of the temperature conditions used during stabiliza-tion would be capable of causing a loss in copigmentation andcolor, with relatively little change in the anthocyanin content.The use of moderate temperatures more like those expected inthe marketplace, 10 to 15°C, have been suggested [20] for “tar-trate stabilization” of red wines, even though much more severeconditions are generally used in both the domestic and interna-tional trade.
A secondary effect appears to be the possible role of the bi-tartrate anion in the stability of the copigmentation stack at winepH. The reduction of the bitartrate concentration in wines alreadylow in tartrate levels may cause significant loss in copigmentedcolor due to a shortage of available anions and less stability ofthe copigmentation stack.
Role of Copigmentation in Oxidationand Aging Reactions
The rates of certain important chemical reactions in wine,namely the oxidation of flavonoids and the polymerization ofpigments and flavonoids into larger polymers, are poorly under-stood and currently cannot be estimated from wine composition.Part of the reason for this is that the understanding of the kinet-ics of these reactions is limited even for single components, letalone for mixtures. However, a more significant factor may bethat the rates are likely to be related to the free concentrations ofthe phenolic substrates, not their total concentrations. Since manyof the flavonoids are moderately strong cofactors, a significantfraction (perhaps 30%) of their total pool is likely to be in thecopigmentation stack at any time, thereby establishing a smallerreaction pool than might be expected and, subsequently, a slowerreaction rate. The immediate implication is that the rates of po-lymerization would be slower than an equivalent pool withoutany copigmentation, and if both an anthocyanin and a flavonoidare involved in the reaction, then it could be second-order innature, leading to an even more dramatic effect on the rate. Berg[15] suggested that the susceptibility of wine to oxidation wasrelated to the degree of association of its pigments, although thereare little data to demonstrate this. A later report of the rates ofred polymer formation found that the polymeric pigments in amodel solution, prepared by skin extraction, formed at almosttwice the rate of those in the corresponding wine [103], a resultthat would be expected based on the above arguments. This sug-gests that the level of copigmentation may influence the rates ofpolymer formation and oxidation, and wines that are higher incopigmentation would react more slowly than those lower incopigmentation, under the same conditions. While there is someanecdotal evidence that this might be true in deeply colored redwines, there are several conflicting factors such as total phenoliccontent, tannin content, and pH that limit any conclusions at thistime. Controlled experiments in which the rates of pigment con-sumption and polymer formation need to be performed in manydifferent wines to see if the rates are at all influenced by the ex-tent of copigmentation.
The above discussion is based on the premise that the freeform of pigments and flavonoids are involved in these reactions.An alternative view is that the stacked form may be a more reac-
tive or preferred arrangement for the limiting step in the antho-cyanin polymerization reactions. In this case, the rate of antho-cyanin loss during aging would be related to the fraction of pig-ment in the copigment stack rather than that in the free form,and wines higher in copigmentation would display faster ratesof polymer formation.
The rates of oxidation reactions can be expected to be relatedto the free monomeric concentrations of the correspondingphenols. The effect of copigmentation would be to provide lowerfree concentrations and slower rates of oxidation, especially forthe anthocyanins and the major cofactors. This would partly pro-tect them from oxidation and favor their incorporation into redpolymers rather than into brown polymers, a matter of consider-able importance in the aging of red wines.
The distinction needs to be made between wines with highlevels of copigmentation (due to higher levels of the critical co-factors) and wines high in total phenol or tannin content. Winesthat have been overextracted, in terms of tannin or total pheno-lics, are not usually higher in copigmentation. This is becausethe movement of the cofactors from the skins into the wine seemsto be controlled by an equilibrium, while that of most phenols(and tannins) is more completely extracted. There is essentiallyno relationship between these measures in the hundreds of winesthat we have studied to date, and it is clear that further extrac-tion does not lead to higher levels of cofactors.
Role of Copigmentation in Sensory AnalysisLike the rates of polymerization and oxygen uptake reactions,
the astringency and bitterness of red wines cannot be predictedfrom their component composition. There is considerable con-fusion as to the relative roles of monomeric and polymericphenols in both astringency and bitterness, and there is growingevidence that the role of monomeric forms is much greater thanhas previously been considered. This is especially true of theinfluence of pH on these attributes and the behavior of the phe-nolic acids as a group compared to the flavonoids and polymers.Many of the flavonoids appear to be present at levels close totheir flavor threshold concentration (Singleton and Noble [101]),and the rates of binding to receptor and saliva proteins would beexpected to be related to their free concentrations rather than totheir total concentrations. The influence of copigmentation willagain be to lower the free pool of such components and therebylower the rates and extent of these sensory interactions. Again,there is some anecdotal evidence that wines richer in color, es-pecially purpleness, receive higher sensory rating. Such a rela-tionship was proposed many years ago by Somers and Evans[106], based on the panel scores awarded to young Shiraz andCabernet Sauvignon wines in one region of Australia. Timberlakeet al. [114] studied various color measures and “flavor” and“overall quality” in two vintages of Beaujolais wines. They alsore-analyzed the data of Somers and Evans [106] and the onlymeasure that was significant in all cases was the “anthocyanincolor,” that is the color loss due to bisulfite bleaching. As themajority of this measure is due to copigmentation, it adds sup-port to the view that copigmentation is positively correlated withsome “quality,” but more importantly, “flavor,” measures in redwines. Tromp and van Wyk [115] have reinforced this view by
Am. J. Enol. Vitic. 52:2 (2001)
84 — Boulton
showing that panelists could guess the quality rating of winesbased on their color, but they were less successful estimating thecolor, having tasted the (masked) wine first. It is clear that theanthocyanins themselves provide no significant flavor contribu-tion, and the connection was generally dismissed as being a cor-related marker of other, more significant, impact flavor compo-nents. However, in terms of the possible softness that might beimparted by the inclusion of some astringent monomeric com-ponents into copigmentation stacks, the relationship between theextent of copigmentation (and therefore darker red wine color)and taster preference deserves renewed attention.
As mentioned previously, the 20% loss in the absorbance ofwines at 280 nm, observed when they undergo a 20-fold dilu-tion, may be due to the breakup of the copigmented forms, asmeasured at that wavelength. Alternatively, it may be evidenceof a more general but limited association between essentially allof the phenolics components in red wines. This latter scenariowould have several ramifications on a range of sensory attributesby acting as a delayed release mechanism for possibly all het-erocyclic aroma constituents and of their mouth-feel and flavor.These ideas need to be further investigated.
Some Possible Research Directions
The fundamental studies of copigmentation with malvidin 3-glucoside-cofactor pairs in model solutions using both CD andNMR techniques have yet to be performed. These two methodseach have their advantages, and there is considerable informa-tion about the association constants and molecular forms in-volved that needs to elucidated, both in aqueous and winelike(pH 3.3 to 3.6 and 12% v/v ethanol) solutions.
The role of ionic strength, more specifically anion type andconcentration, on the stability of copigmentation stacks needsto be further investigated, particularly with respect to the differ-ences between wines and the effects of cold stabilization treat-ments. The influence of wine pH on the color due tocopigmentation also deserves further study so that its contribu-tion in the various assays for anthocyanin content can be furtherunderstood.
The present picture of copigmented and free anthocyaninsshould now be applied to study the rates of polymeric pigmentformation and the factors influencing it. These would include pHand oxidation effects, which in the past have been confused withthe formation of brown polymers and their contribution to colordensity.
Our knowledge of this phenomenon in wines is still undevel-oped and yet its role in the natural color of red wines can only bedescribed as dramatic. It is now clear why the color of youngred wine is not related to the anthocyanin content of the grapesfrom which it was made. The critical importance of the natureand concentrations of the copigmentation cofactors is now ap-parent, but there is little understanding of the factors influenc-ing their formation and retention during the maturation of anyred wine grapes. Almost all of the studies that have been con-ducted with an aim of understanding wine color need to be re-peated, but with the focus on cofactors and their concentrations,rather than on the anthocyanins. This is as true for grapes as it is
for wines. Hopefully, the limited value of experiments that mea-sure the pigments content of berries, without following theirmovement into the corresponding wine, is now apparent.
There are quite specific patterns of the cofactors and theirconcentrations in wines that have been made from different cul-tivars [116]. This will lead to improved grouping of young winesbased on their copigmentation components rather than by theirpigments alone. There is also considerable variation in the con-centration of copigmentation observed within wines of the samecultivar, growing district, and season. The causes of this varia-tion are not yet understood. One study of more than 69 CabernetSauvignon wines found that the variation in copigmentation lev-els of wines made at any of 12 wineries was similar to the varia-tion in the wines from the other wineries, and little different fromthe overall variation in all of the wines [70]. This suggests thatmost of the variance in copigmentation is due to the vineyardsite and cultural practices rather than to the winemaking prac-tices within a winery. It also supports the notion that the colorobtained in a wine is preset at harvest and that there is little ef-fect due to the contacting practices of the winery.
Apart from this study of Cabernet Sauvignon wines from oneharvest in one district, there are apparently no similar compre-hensive studies with any other cultivars. The effects due to root-stock and clone on copigmentation have not been studied in detailfor any cultivar to date and, unfortunately, the same is true forthe entire spectrum of cultural practices. The crop level (reportednot measured) in the Cabernet Sauvignon study was not signifi-cantly correlated with copigmentation in the wines, although thisdeserves further study in other sites and conditions. Controlledinvestigations of the effects of light, both intensity and wave-length, on the formation and retention of cofactors in berries havestarted only recently. The role of root conditions, rootstock, soilmoisture, and particularly root temperature would seem to beimportant in the initiation and control of berry size and the fla-vonoid synthesis, and may be preset long before veraison, al-though little attention has historically been given to this aspectin viticulture.
Literature Cited1. Albach, R.F., R.E. Kepner, and A.D. Webb. Comparison of anthocya-nin pigments of red vinifera grapes. II. Am. J. Enol. 10:164-172 (1959).
2. Amrani Jouet, K., and Y. Glories. Etude en conditions models del’extractibilite des composes phenoliques des pellicules et des pepinsde raisins rouges. J. Int. Sci. Vigne Vin 28:303-317 (1994).
3. Anderson, D.W., E.A. Julian, R.E. Kepner, and A.D. Webb. Chromato-graphic investigation of anthocyanin pigments in Vitis vinifera. Phytochem-istry 9:1569-1578 (1970).
4. Asen, S., and L. Jurd. The constitution of a crystalline blue cornflowerpigment. Phytochemistry 6:577-584 (1967).
5. Asen, S., R.N. Stewart, and K.H. Norris. Co-pigmentation of anthocya-nins in plant tissues and its effect on color. Phytochemistry 11:1139-1145(1972).
6. Aubert, S. Methodes usuelles d’eveluation des anthocyanes et tannindans les vins. Ann. Fals. Exp. Chim. 63:107-117 (1970).
7. Bakker, J., and C.F. Timberlake. The distribution of anthocyanins ingrape skin extracts of Port wine cultivars as determined by high per-formance liquid chromatography. J. Sci. Food Agric. 36:1315-1324(1985).
Am. J. Enol. Vitic. 52:2 (2001)
Copigmentation of Anthocyanins — 85
8. Bakker, J., and C.F. Timberlake. The distribution and content of antho-cyanins in young Port wines as determined by high performance liquidchromatography. J. Sci. Food Agric. 36:1325-1333 (1985).
9. Bakker, J., N. W. Preston, and C.F. Timberlake. The determination ofanthocyanins in aging red wines: Comparison of HPLC and spectralmethods. Am. J. Enol. Vitic. 37:121-126 (1986).
10. Baldi, A., A. Romani, N. Mulinacci, F.F. Vincieri, and B. Casetta. HPLC/MS application to anthocyanins of V. vinifera. L. J. Agric. Food Chem.43:2104-2109 (1995).
11. Baranac, J.M., N.A. Petranovic, and J.M. Dimitric-Markovic. Spectro-photometric study of anthocyan copigmentation reactions. J. Agric. FoodChem. 44:1333-1336 (1996a).
12. Baranac, J.M., N.A. Petranovic, and J.M. Dimitric-Markovic. Spectro-photometric study of anthocyan copigmentation reactions. J. Agric. FoodChem. 45:1694-1697 (1996b).
13. Baranac, J.M., N.A. Petranovic, and J.M. Dimitric-Markovic. Spec-trophotometric study of anthocyan copigmentation reactions. J. Agric.Food Chem. 45:1698-1700 (1996c).
14. Baranac, J.M., N.A. Petranovic, and J.M. Dimitric-Markovic. Spec-trophotometric study of anthocyan copigmentation reactions. J. Agric.Food Chem. 45:1701-1703 (1996d).
15. Berg, H.W. Stabilisation des anthocyanes. Comportement de lacouleur dans les vins rouges. Ann. Technol. Agric. 12, Supp. 1:247-259(1965).
16. Berg, H.W., and M.A. Akiyoshi. The effect of contact time of juice withpomace on the color and tannin content of red wines. Am. J. Enol. 7:84-90 (1956).
17. Berg, H.W., and M.A. Akiyoshi. On the nature of reactions respon-sible for color behavior in red wines: A hypothesis. Am. J. Enol. Vitic.26:134-143 (1975).
18. Boulton, R.B. Red Wines. In Fermented Beverages. J. Piggot and A.H.Lea (Eds.). Chapman and Hall, Glasgow, UK (1995).
19. Boulton, R.B. A method for the assessment of copigmentation in redwines. Presented at the Forty-seventh Annual Meeting of the AmericanSociety for Enology and Viticulture, Reno, NV (June 1996).
20. Boulton, R.B., V.L. Singleton, L.F. Bisson, and R.E. Kunkee. Principlesand Practices of Winemaking. Aspen, New York (1996).
21. Bourzeix, M., N. Heredia, and M-I. Estrella Pedrola. Le dosage desanthocyanes des vins. Sci. Aliments 2:71-82 (1982).
22. Boutaric, A., L. Ferre, and M. Roy. Reserches spectrophotometriquessur la couleur des vins. J. Annal. Falsific. 30:196-209 (1937).
23. Brouillard, R. Chemical structure of anthocyanins. In Anthocyaninsas Food Colors. P. Markakis (Ed.), pp. 1-40. Academic Press, New York(1982).
24. Brouillard, R., and B. Delarporte. Chemistry of anthocyanin pigments.2. Kinetic and thermodynamic study of proton transfer, hydration andtautomeric reactions of malvidin 4-glucoside. J. Am. Chem. Soc. 99:8461-8468 (1977).
25. Brouillard, R., G. Mazza, Z. Saad, A.M. Albrecht-Gary, and A.Cheminat. The copigmentation reaction of anthocyanins: A microprobefor the structural study of aqueous solutions. J. Am. Chem. Soc. 111:2604-2610 (1989).
26. Brouillard, R., M-C. Wigand, O. Dangles, and A. Cheminat. pH andsolvent effects on the copigmentation of malvin with polyphenols, purineand pyrimidine derivatives. J. Chem. Soc., Perkin Trans. 2:1235-1241(1991).
27. Bruchfeld, S.E., E.S. Bordeu, and R.B. Boulton. Effect of color andformed copigmentation complexes due to the addition of different cofac-tors to Pinot noir musts and wines. Presented at the Forty-ninth AnnualMeeting of the American Society for Enology and Viticulture, Sacramento,CA (June 1998).
28. Bucelli, P., V. Faviere, F. Giannetti, and A. Gigliotti. Caratteristicheanalitiche e valutazione dell’attitudine del “Colorino” a migliorare laqualita del vino Chianti. Vignevini. 17:57-62 (1991).
29. Burroughs, L.F. Determining free sulfur dioxide in red wine. Am. J.Enol. Vitic. 26:25-29 (1975).
30. Cai, Y., T.H. Lilley, and E. Haslam. Polyphenol-anthocyanincopigmentation. J. Chem Soc., Chem. Commun. 5:380-383 (1990).
31. Chen, L.J., and G. Hrazdina. Structural properties of anthocyanin-flavonoid complex formation and its role in plant color. Phytochemistry20:297-302 (1981).
32. Dangles, O., M. Elhabiri, and R. Brouillard. Kinetic and thermodynamicinvestigation of the aluminium-anthocyanin complexation in aqueoussolution. J. Chem. Soc., Perkin Trans. 2:2587-2596 (1994).
33. Darius-Martin, J., E. Diaz, V. Gutierrez, and R.B. Boulton. The en-hancement of red wine color by pre-fermentation addition of copigmentprecursors. Presented at the Forty-eighth Annual Meeting of the Ameri-can Society for Enology and Viticulture, San Diego (June 1997).
34. Darius-Martin, J., M. Carrillo, E. Diaz and R.B. Boulton. Enhancementof red wine color by pre-fermentation additions of copigments. Food Chem.73:217-220 (2001).
35. Davies, A.J., and G. Mazza. Copigmentation of simple and acylatedanthocyanins with colorless phenolic compounds. J. Agric. Food Chem.41:716-720 (1993).
36. Doymaz, F., R. Boulton, and A. Palazoglu. The application of partialleast squares methodology to copigmentation in red wines. Presented atthe Forty-ninth Annual Meeting of the American Society for Enology andViticulture, Sacramento (June 1998).
37. Elhabiri, M., P. Figueiredo, K. Toki, N. Saito, and R. Brouillard. Antho-cyanin-aluminum and -gallium complexes in aqueous solution. J. Chem.Soc., Perkin Trans. 2:355-362 (1997).
38. Ferre, L. Traite d’Oenologie Bourguignonne. 110. Institut NationalAppelation d’Origin du Vin et Eaux-de-Vie, Paris, France (1958).
39. Fong, R.A., R.E. Kepner, and A.D. Webb. Acetic-acid-acylated antho-cyanin pigments in the grape skins of a number of varieties of Vitis vin-ifera. Am. J. Enol. Vitic. 22:150-155 (1971).
40. Gigliotti, A., P.L. Bucelli, and V. Faviere. Influenza delle uve biancheTrebbiano e Malvasia sul colore del vino Chianti. Vignevini 11:39-46(1985).
41. Glories, Y. Reserches sur la mat’erie colorant des vins rouges. D.Sc.Thesis, Univ. de Bordeaux II (1978).
42. Glories, Y. La couleur des vins rouge. 1. Les equilibres desanthocyanes et des tanins. Conn. Vigne Vin 18:195-217 (1984).
43. Glories, Y. La couleur des vins rouge. 2. Mesure, origine et interpre-tation. Conn. Vigne Vin 18:253-271 (1984).
44. Goto, T., T. Hoshino, and M. Ohba. Stabilization effect of neutral saltson anthocyanins: Flavylium salts, anhydrobases and genuine anthocya-nins. Agric. Biol. Chem. 40:1593-1596 (1976).
45. Goto, T., T. Hoshino, and S. Takase. A proposed structure of commelin,a sky blue anthocyanin complex obtained from the flower petals ofcommelina. Tetrahedron Lett. 31:2905-2908 (1979).
46. Harborne, J. B. Spectral methods of characterizing anthocyanins.Biochem. J. 70:22-28 (1958).
47. Harada, N., and K. Nakanishi. Circular Dichroic Spectroscopy–Exci-ton Coupling in Organic Stereochemistry. University Science Books, MillValley, CA (1983).
48. Haslam, E. In vino veritas: Oligomeric procyanidins and the aging ofred wines. Phytochemistry 19:2577-2582 (1980).
49. Haslam, E. Practical Polyphenolics: From Structure to MolecularRecognition and Physiological Action, pp. 262-285. Cambridge Univer-sity Press, Cambridge, UK (1998).
Am. J. Enol. Vitic. 52:2 (2001)
86 — Boulton
50. Hayashi, K. The anthocyanins. In The Chemistry of Flavonoid Com-pounds. T.A. Geissman (Ed.), pp. 248-285. Macmillan, New York (1962).
51. Hebrero, E., C. Santos-Buelga, and J.C. Rivas-Gonzalo. High perfor-mance liquid chromatography-diode array spectroscopy identification ofanthocyanins of Vitis vinifera variety Tempranillo. Am. J. Enol. Vitic. 39:227-233 (1988).
52. Hilgard, E.W. Colorimetric measurement of wines. Univ. Calif. Agric.Expt. Stn. Bull. 60 (1886).
53. Hilgard, E.W. Experiments on methods of fermentation. Univ. Calif.Agric. Expt. Stn. Bull. 63 (1887).
54. Hilgard, E.W. The extraction of color and tannin during red-wine fer-mentations. Univ. Calif. Agric. Expt. Stn. Bull. 77 (1887).
55. Hmamouchi, M., N. Es-Safi, M. Lahrichi, A. Fruchier, and E.M. Essassi.Flavones and flavonols in leaves of some Moroccan Vitis vinifera culti-vars. Am. J. Enol. Vitic. 47:186-192 (1996).
56. Hoshino, T. An approximate estimate of self-association constantsand self-stacking conformation of malvin quinoidal bases studied by 1HNMR. Phytochemistry 30:2049-2055 (1991).
57. Hoshino, T. Self-association of flavylium cations of anthocyanidin 3,5-diglucosides studies by circular dichroism and 1H NMR. Phytochemistry31:647-653 (1992).
58. Hoshino, T., and U. Matsumoto. Evidences of the self-association ofanthocyanins. I. Circular dichroism of cyanin anhydrobase. TetrahedronLett. 21:1751-1754 (1980).
59. Hoshino, T., U. Matsumoto, and T. Goto. The stabilizing effect of theacyl group on the co-pigmentation of acylated anthocyanins with C-glu-cosides. Phytochemistry 19:633-667 (1980).
60. Hoshino, T., U. Matsumoto, and T. Goto. Self-association of someanthocyanins in neutral aqueous solution. Phytochemistry 20:1971-1976(1981).
61. Hoshino, T., U. Matsumoto, T. Goto and N. Harada. Evidence of theself-association of anthocyanins IV. PMR spectroscopic evidence for thevertical stacking of anthocyanin molecules. Tetrahedron Lett. 23:433-436(1982).
62. Hoshino, T., U. Matsumoto, N. Harada, and T. Goto. Chiral excitoncoupled stacking of anthocyanins: Interpretation of the origin of anoma-lous CD induced by anthocyanin association. Tetrahedron Lett. 22:3621-3624 (1981).
63. Houbiers, C., J.C. Lima, A.L. Macanita, and H. Santos. Color stabili-zation of malvidin 3-glucoside: Self-aggregation of the flavylium cationand copigmentation with the Z-chalcone form. J. Phys. Chem. B. 102:3578-3585 (1998).
64. Hrazdina, G. Anthocyanin composition of Concord grapes. Lebensm.-Wiss. Technol. 8:111-113 (1975).
65. Hrazdina, G., and A.J. Franzese. Structure and properties of theacylated anthocyanins from Vitis species. Phytochemistry 13:225-229(1974).
66. Hrazdina, G., and A.H. Moskowitz. Subcellular status of anthocya-nins in grape skins. Proceedings of the University of California, Davis,Centennial Symposium, pp. 245-253 (1981).
67. Ingalsbe, D.W., A.M. Neubert, and G.H. Carter. Concord grape pig-ments. J. Agric. Food Chem. 11:263-268 (1963).
68. Jurd, L., and S. Asen. The formation of metal and “co-pigment” com-plexes of cyanidin 3-glucoside. Phytochemistry 5: 1263-1271 (1966).
69. Lay, H., and U. Draeger. Profiles of the pigments of different red wines.Vitic. Enol. Sci. 46:48-57 (1991).
70. Levengood, J. A survey of copigmentation in Cabernet Sauvignonwines. M.S. Thesis, University of California, Davis (1996).
71. Liao, H., Y. Cai, and E. Haslam. Polyphenol interactions. Anthocya-nins: Co-pigmentation and colour changes in red wines. J. Sci. Food Agric.59:299-305 (1992).
72. Mazza, G., and R. Brouillard. Recent developments in the stabiliza-tion of anthocyanins in food products. Food Chem. 25:207-225 (1987).
73. Mazza, G., and R. Brouillard. The mechanism of copigmentation ofanthocyanins in aqueous solution. Phytochemistry 29:1097-1102 (1990).
74. Meyer, R. The relationship between metal cations and copigmentationin wines. M.S. Report, University of California, Davis (1999).
75. Miniati, E., P. Damiani, and G. Mazza. Copigmentation and self-as-sociation of anthocyanins in food model systems. Ital. J. Food Sci. 4:109-116 (1992).
76. Mistry, T.V., Y. Cai, T.H. Lilley, and E. Haslam. Polyphenol interactions.Part 5. Anthocyanin co-pigmentation. J. Chem. Soc., Perkin Trans. 2:1287-1296 (1991).
77. Nagel, C.W., and L.W. Wulf. Changes in the anthocyanins, flavonoidsand hydroxycinnamic acid esters during fermentation and aging of Merlotand Cabernet Sauvignon wines. Am. J. Enol. Vitic. 30:111-116 (1979).
78. Nakayama, T.O.M., and J.J. Powers. Absorption spectra of anthocya-nins in vivo. In Chemistry of Plant Pigments. C.O. Chichester (Ed.), pp.193-199. Academic Press, New York (1972).
79. Neri, R., and R.B. Boulton. The assessment of copigmentation in redwines from the 1995 harvest. Presented at the Forty-seventh AnnualMeeting of the American Society for Enology and Viticulture, Reno (June1996).
80. Nessler, J. Die Bereitung, Plege und Untersuchung des Weines, p.277. Eugen Ulmer, Stuttgart, Germany (1933).
81. Niketic-Aleksic, G.K., and G. Hrazdina. Quantitative analysis of theanthocyanin content in grape juices and wines. Lebensm. -Wiss. Technol.5:163-165 (1972).
82. Nishio, M., M. Hirota, and Y. Umezawa. The CH/π Interaction. Evi-dence, Nature and Consequences. Methods in Stereochemical Analy-sis. A.P. Marchand (Ed.). Wiley-VCH, New York (1998).
83. Osawa, Y. Copigmentation of anthocyanins. In Anthocyanins as FoodColors. P. Markakis (Ed.), pp. 41-67. Academic Press, New York (1982).
84. Piergiovanni, L., and G. Volonterio. Tecniche cromatografiche nellostudio della frazione antocianica della uve. Riv. Vitic. Enol. 33:289-308(1980).
85. Piergiovanni, L., and G. Volonterio. Studio della frazione antocianicadella uve. Vignevini. 8:49-53 (1981).
86. Pontallier, P. Recherches sur les conditions d’elevage des vins rouges.Role des phenomenes oxydatifs. D. Ing. Thesis, Univ. de Bordeaux II(1981).
87. Rankine, B.C., R.E. Kepner, and A D. Webb. Comparison of anthocyaninpigments of vinifera grapes. Am. J. Enol. 9:105-110 (1958).
88. Ribereau-Gayon, P. Interpretation chimique de la couleur des vinsrouges. Vitis 12:119-142 (1973).
89. Ribereau-Gayon, P. The chemistry of red wine color. In The Chemis-try of Winemaking. A.D. Webb (Ed.). Am. Chem. Soc. Adv. Chem. Ser.137: 50-87 (1974).
90. Ribereau-Gayon, P. The anthocyanins of grapes and wines. In An-thocyanins as Food Colors. P. Markakis (Ed.), pp. 209-244. AcademicPress, New York (1982).
91. Ribereau-Gayon, P., and N. Nedeltchev. Discussion et application desmethodes modernes de dosage anthocyanes et des tanins dans les vins.Ann. Technol. Agric. 14:321-330 (1965).
92. Ribereau-Gayon, P., and E. Stonestreet. Le dosage des anthocyanesdans le vin rouge. Bull. Soc. Chim. France 47:2649-2652 (1968).
93. Ribereau-Gayon, P., P. Pontallier, and Y. Glories. Some interpretationsof color changes in young red wines during their conservation. J. Sci.Food Agric. 34:505-516 (1983).

Am. J. Enol. Vitic. 52:2 (2001)
Copigmentation of Anthocyanins — 87
94. Robinson, G.M., and R. Robinson. A survey of anthocyanins. I.Biochem. J. 25:1687-1705 (1931).
95. Roggero, J.P., B. Ragonnet, and S. Coen. Analyse fine desanthocyanes des vins et pellicules de raisin par la technique HPLC. Vigneset Vins 327:38-42 (1984).
96. Rodger, A., and B. Norden. Circular Dichroism and Linear Dichroism.Oxford University Press, Oxford, UK (1997).
97. Scheffeldt, P., and G. Hrazdina. Co-pigmentation of anthocyanins un-der physiological conditions. J. Food Sci. 43:517-520 (1978).
98. Singleton, V.L. Effects on red wine quality of removing juice beforefermentation to simulate variation in berry size. Am. J. Enol. Vitic. 23:106-113 (1972).
99. Singleton, V.L. Wine phenolics. In Modern Methods of Plant Analy-sis, New Series. Vol. 6, Wine Analysis. H.F. Linskens, and J.F. Jackson(Eds.), pp. 180-218. Springer-Verlag, Berlin (1988).
100. Singleton, V.L., and P. Esau. Phenolic Substances in Grapes and Winesand Their Significance. Academic Press, New York (1969).
101. Singleton, V.L., and A.C. Noble. Wine flavor and phenolic substances.In Am. Chem. Soc. Symposium Ser. No. 26. Phenolic, Sulfur and Nitro-gen Compounds in Food Flavors. G. Charalambous and I. Katz (Eds.). Am.Chem. Soc., Washington, DC (1976).
102. Singleton, V.L., and E.K. Trousdale. Anthocyanin-tannin interactionsexplaining differences in polymeric phenols between white and red wines.Am. J. Enol. Vitic. 43:63-70 (1992).
103. Somers, T.C. The polymeric nature of wine pigments. Phytochemis-try 10:2175-2186 (1971).
104. Somers, T.C. Pigment development during ripening of the grape. Vitis14:269-277 (1976).
105. Somers, T.C. Assessment of phenolic components in viticulture andoenology. Proceedings of the Sixth Australian Wine Ind. Tech. Conf.Adelaide, pp. 257-260 (1986).
106. Somers, T.C., and M.E. Evans. Wine quality: Correlations with colourdensity and anthocyanin equilibria in a group of young red wines. J. Sci.Food Agric. 25:1369-1379 (1974).
107. Somers, T.C., and M.E. Evans. Spectral evaluation of young redwines: Anthocyanin equilibria, total phenols, free and molecular SO2 andchemical age. J. Sci. Food Agric. 28:279-287 (1977).
108. Somers, T.C., and M.E. Evans. Grape pigment phenomena: Inter-pretation of major colour losses during vinification. J. Sci. Food Agric.30:623-633 (1979).
109. Somers, T.C., and E. Verette. Phenolic composition of natural winetypes. In Modern Methods of Plant Analysis, New Series. Vol. 6, WineAnalysis. H. F. Linskens and J.F. Jackson (Eds.),pp. 219-257. Springer-Verlag, Berlin (1988).
110. Sudraud, P. Interpretation des courbes d’absorption du vins rouges.Ann. Technol. Agric. 7:203-208 (1958).
111. Timberlake, C.F. Anthocyanins–Occurrence, extraction and chem-istry. Food Chem. 5:69-80 (1980).
112. Timberlake, C.F. Factors affecting red wine color: The use of a ‘col-oration’ constant in evaluating red wine color. Proceedings of the Univer-sity of California, Davis, Centennial Symposium, pp. 240-254 (1981).
113. Timberlake, C.F., and P. Bridle. Interactions between anthocyanins,phenolic compounds, and acetaldehyde and their significance in redwines. Am. J. Enol. Vitic. 27:97-105 (1976).
114. Timberlake, C.F., P. Bridle, G.M. Jackson, and L. Vallis. Correlationsbetween quality and pigment parameters in young Beaujolais red wines.Ann. Nutr. Aliment. 32:1095-1101.
115. Tromp, A., and C.J. van Wyk. The influence of color on the assess-ment of red wine quality. Proceedings of the South African Society forEnology and Viticulture, pp. 107-118 (1977).
116. Vaadia, M. Copigmentation in varietal wines from the Napa Valley.M.S. Thesis, University of California, Davis (1997).
117. Van Balen, J. Recovery of anthocyanins and other phenols fromconverting grapes into wine. M.S. Thesis, University of California, Davis(1984).
118. Veselinovic, D.S., J.M. Baranac, Z.D. Zujovic, and D.S. Djordjevic.Spectroabsorptiometric investigations of complexing reactions ofpolyhydroxylic flavylium compounds. J. Agric. Food Chem. 40:2337-2340(1992).
119. Wagner, H., J. Patel, L. Horhammer, F. Yap, and A. Reichardt. Flavon-C-Glykoside in Blattern van Vitis cinerea Darwin. Z. Natur. B22:988-989(1967).
120. Wenzel, K. Rotweinfarbstoffe–eine Ubersicht. Wein Wissen. 41:51-64 (1986).
121. Williams, M., and G. Hrazdina. Anthocyanins as food colorants: Ef-fects of pH on the formation of anthocyanin-rutin complexes. J. Food Sci.44:66-68 (1979).
122. Willstatter, R., and E.H. Zollinger. VI. Uber die Farbstoffe der Weintraubeund der Heidelbeere. Ann. Chem. Liebigs. 408:83-109 (1915).
123. Willstatter, R., and E.H. Zollinger. XI. Uber die Farbstoffe der Weintraubeund der Heidelbeere, II. Ann. Chem. Liebigs. 412:195-216 (1916).
124. Wilska-Jeszka, J., and A. Korzuchowska. Anthocyanins and chloro-genic acid copigmentation - influence on the colour of strawberry andchokeberry juices. Z. Lebensm. -Unters. -Forsch. 203:38-42 (1996).
125. Winkler, A.J., and M.A. Amerine. Color in California wines I. Meth-ods of measurement of color. Food Res. 3:429-438 (1938).
126. Winkler, A.J., and M.A. Amerine. Color in California wines II. Pre-liminary comparisons of certain factors influencing color. Food Res. 3:439-447 (1938).
127. Wulf, L.W., and C.W.Nagel. High-pressure liquid chromatographicseparation of anthocyanins in Vitis vinifera. Am. J. Enol. Vitic. 29:42-49(1978).
128. Wrolstad, R.E. Color and pigment analyses in fruit products. OregonState Univ. Expt. Stn., Bull. 624. Corvallis, OR (1993).
129. Yoshitama, K., N. Ishikura, T. Fuleki, and S. Nakamura. Effect ofanthocyanin, flavonol co-pigmentation and pH on the color of the berriesof Ampelopsis brevipedunculata. Plant Physiol. 139:513-518 (1992).


