The Convergence between For-Profit and Nonprofit Hospitals in
74
The Convergence between For-Profit and Nonprofit Hospitals in the United States Guy David University of Chicago September 2003 Abstract This paper provides evidence of the growing similarity in capacity of for-profit and nonprofit hospitals. In 1960, nonprofit hospitals maintained on average more than three times as many beds per hospital as their for-profit counterparts; following a monotonic decline in relative size, by 2000, the average nonprofit hospital was only 32% larger than the typical for-profit hospital. Hospital level data for the United States indicate that the convergence was driven primarily by industry-wide effects such as entry, exit and ownership switches, rather than expansions or downsizing of existing hospitals. These findings suggest that hospitals may in fact strategically choose their ownership type (nonprofit vs. for-profit status) and hence, their regulatory environment. Accordingly, I develop a model in which firms have identical objectives but differ in their ability to benefit from a given ownership form. In contrast to the existing literature, this approach relies neither on different ownership type-specific objectives nor on market failure to generate an equilibrium in which both ownership types are chosen by a strictly positive fraction of hospitals. Changes in the economic environment alter firms’ incentives to maintain a given ownership type. This in turn induces firms to modify their capacity and encourages some firms to switch their ownership type. Crowding-out of government hospitals, population growth and increasing involvement of the government in the healthcare market may account for the convergence in size. Policymakers and legislators often exert pressure on nonprofit hospitals by tying tax-exemptions to hospital-level measures of community benefits such as free care for the indigent. I argue that by omitting industry-wide effects of a hospital’s tax-exempt status on price and industry output, such pressure may both lead to convergence in size and be welfare decreasing. Analysis at the state and Metropolitan Statistical Area (MSA) level as well as at the hospital level corroborate the principal theoretical predictions. JEL classifications: L11, L13, L25, L31, L44, I11 and I18. I would like to thank my committee chairman, Kevin Murphy, and the members of my committee, Gary Becker, Dennis Carlton and Jonathan Guryan for their guidance and support. I would also like to thank Mark Duggan, Kobi Glazer, Michael Greenstone, Ali Hortacsu, William Lynk, Sarit Markovich, David Meltzer, Tomas Philipson, Luis Rayo, Yossi Shpigel, Chad Syverson, Manuel Trajtenberg and Yoram Weiss for helpful discussions. I have also benefited from comments made by Lorens Helmchen, Anup Malani, Joel Shalowitz and participants in the Applied Economic workshop at the University of Chicago and the IO workshop at Tel-Aviv University. Research support from the National Bureau of Economic Research and the Oscar Mayer Foundation is gratefully acknowledged; any opinions expressed herein are the author’s. Author: Guy David, Graduate School of Business, University of Chicago, 1101 East 58 th St., Chicago IL 60637, [email protected]
Transcript of The Convergence between For-Profit and Nonprofit Hospitals in

The Convergence between For-Profit and Nonprofit Hospitals in the United States
Guy David
University of Chicago
September 2003
Abstract
This paper provides evidence of the growing similarity in capacity of for-profit and nonprofit hospitals. In 1960, nonprofit hospitals maintained on average more than three times as many beds per hospital as their for-profit counterparts; following a monotonic decline in relative size, by 2000, the average nonprofit hospital was only 32% larger than the typical for-profit hospital. Hospital level data for the United States indicate that the convergence was driven primarily by industry-wide effects such as entry, exit and ownership switches, rather than expansions or downsizing of existing hospitals. These findings suggest that hospitals may in fact strategically choose their ownership type (nonprofit vs. for-profit status) and hence, their regulatory environment. Accordingly, I develop a model in which firms have identical objectives but differ in their ability to benefit from a given ownership form. In contrast to the existing literature, this approach relies neither on different ownership type-specific objectives nor on market failure to generate an equilibrium in which both ownership types are chosen by a strictly positive fraction of hospitals. Changes in the economic environment alter firms’ incentives to maintain a given ownership type. This in turn induces firms to modify their capacity and encourages some firms to switch their ownership type. Crowding-out of government hospitals, population growth and increasing involvement of the government in the healthcare market may account for the convergence in size. Policymakers and legislators often exert pressure on nonprofit hospitals by tying tax-exemptions to hospital-level measures of community benefits such as free care for the indigent. I argue that by omitting industry-wide effects of a hospital’s tax-exempt status on price and industry output, such pressure may both lead to convergence in size and be welfare decreasing. Analysis at the state and Metropolitan Statistical Area (MSA) level as well as at the hospital level corroborate the principal theoretical predictions. JEL classifications: L11, L13, L25, L31, L44, I11 and I18.
I would like to thank my committee chairman, Kevin Murphy, and the members of my committee, Gary Becker, Dennis Carlton and Jonathan Guryan for their guidance and support. I would also like to thank Mark Duggan, Kobi Glazer, Michael Greenstone, Ali Hortacsu, William Lynk, Sarit Markovich, David Meltzer, Tomas Philipson, Luis Rayo, Yossi Shpigel, Chad Syverson, Manuel Trajtenberg and Yoram Weiss for helpful discussions. I have also benefited from comments made by Lorens Helmchen, Anup Malani, Joel Shalowitz and participants in the Applied Economic workshop at the University of Chicago and the IO workshop at Tel-Aviv University. Research support from the National Bureau of Economic Research and the Oscar Mayer Foundation is gratefully acknowledged; any opinions expressed herein are the author’s.
Author: Guy David, Graduate School of Business, University of Chicago, 1101 East 58th St., Chicago IL 60637, [email protected]

1
“The adoption of the nonprofit form does not change human nature”† Richard Posner
1. Introduction Private hospitals in the US can organize as either nonprofit or for-profit institutions, but
nonprofit hospitals have been dominating the hospital industry with a persistently large
share of beds (about 70%) over the period from 1960 to 2000. Nonprofit and for-profit
hospitals are also subject to different regulatory rules, in particular the tax code.
Specifically, nonprofit hospitals are eligible for exemptions from property, sales, and
income taxes. However, despite these legal and regulatory distinctions, there has been
growing similarity in capacity between nonprofit and for-profit hospitals during these
four decades1.
According to aggregate US data, collected and published by the American Hospital
Association (AHA), in 1960 nonprofit hospitals maintained on average more than three
times as many beds per hospital as their for-profit counterparts. Following a monotonic
decline in relative size, by 2000, the average nonprofit hospital was only about thirty
percent larger than the typical for-profit hospital. I find that eighty percent of the
convergence in size is attributable to a convergence in the number of admissions (i.e.
volume) and the remaining twenty percent is accounted for by a convergence in lengths
of stay (i.e. duration). Moreover, using hospital level data for the US, I find that the
convergence in size was driven primarily by industry-wide effects such as entry, exit and
ownership switches, rather than expansions or downsizing of existing hospitals.
In light of these findings one might ask which factors may have contributed to this
convergence between nonprofit and for-profit hospitals. How would these factors affect
the provision of services to indigent patients, access to care and welfare? And does the
documented convergence of for-profit and nonprofit hospitals provide grounds for
changes in tax policy? One objective of this paper is to take another step towards
answering such questions by developing a theoretical framework that explains the † Opinion, Hospital Corp. of America v. FTC, 870 F.2d 1381 (7th Cir. 1986) 1 The trend of growing similarity in capacity or convergence in size, is documented and described in section 2 of this paper.

2
convergence between for-profit and nonprofit hospitals in the United States over the
period from 1960 to 2000.
Authors who find similarities between the two ownership types often question whether
and to what extent today’s nonprofit hospitals really differ from their for-profit
counterparts.2 These empirical studies and others, however, pay little attention to the
process by which for-profit and nonprofit hospitals grew similar. Theoretical models that
are constructed to explain the behavior of nonprofit firms in general and nonprofit
hospitals in particular, promote the idea that when a firm is not organized with the
explicit goal of maximizing profits, applying conventional neoclassical models of firms is
not appropriate. Yet, similar to the empirical literature, the effort to explain the difference
in behavior, efficiency, objectives, and quality of care between nonprofit and for-profit
hospitals almost entirely omit dynamic considerations.
The evidence on convergence presented here, as well as the large body of research on
switching across ownership types, highlights the importance of the economic and
regulatory environments, in which hospitals of different ownership types operate. In fact,
hospitals may choose their ownership type (nonprofit vs. for-profit status) strategically
and hence select their regulatory environment. From this perspective, it is the differential
ability to benefit from a given ownership status, and not some underlying difference in
objectives, that accounts for discrepancies in behavior across hospitals. To develop and
explain this interpretation more formally, I present a model in which firms have identical
objectives yet heterogeneous technical capabilities that encourage them to choose
different ownership forms in order to attain their organizational goals. In contrast to the
existing literature, this approach relies neither on different ownership type-specific
objectives nor on market failure to generate an equilibrium in which both ownership
types are chosen by a strictly positive fraction of hospitals.
Changes in the economic environment alter firms’ incentives to maintain a given
ownership type. This in turn induces firms to modify their capacity and encourages some
firms to switch their ownership type. This approach suggests that positive demand
2 For example: Duggan (2000), Frank and Salkever (2000), Malani et. al. (2003), McClellan and Staiger (1999), Sloan (2000a) and Sloan et al. (2000b).

3
shocks, negative supply shocks and the increasing involvement of the government in the
healthcare market may account for the growing convergence in size. I test these
predictions in two ways: first, I construct measures for the model’s parameters and
analyze the convergence trend using state and Metropolitan Statistical Area (MSA) level
data. Secondly, I exploit detailed hospital-level data on expenditures to test the model’s
equilibrium predictions with respect to the intensity of hospitals’ perks-related behavior.
As the nature of local competition is central for assessing the true contribution of
nonprofit hospitals to their communities, omitting such industry-wide effects may lead
policymakers and legislators to support interventions that may decrease welfare. In
particular, tying tax-exemptions to hospital-level measures of community benefits such as
free care for the indigent might represent excessive pressure. In turn, requiring nonprofit
hospitals to appropriate a fraction of their surplus towards activities labeled as
community benefits stimulates the convergence in size.
The paper is organized as follows: Section 2 describes the emergence of the convergence
process between nonprofit and for-profit hospitals observed over the past forty years in
the United States. The third section introduces a taxonomy of economic models of
nonprofit hospitals that encompasses existing models and shows how my model relates to
the literature. Section 4 considers a general model that aims to provide a rationale for the
coexistence of for-profit and nonprofit firms in the same market. In addition, this model
explains the original differences in capacity as well as the subsequent convergence
between the two ownership types. Using hospital level data from the US from the AHA
and IRS, and regional demographic data from the US census and other sources, the fifth
section provides a closer look at the convergence process across different locations in
attempt to validate the theoretical predictions. The sixth section provides a discussion of
the general views presented in this paper and their policy implications. Section 7
concludes the paper.

4
2. The Dynamics of the US Hospital Market The dominance of nonprofit hospitals, and their persistently large share of beds (about
70%) over the period from 1960 to 2000, led most researchers to promote the idea that
permanent discrepancies in objectives distinguished nonprofit and for-profit providers.
As a result, the US hospital market is often portrayed as stagnant with respect to its
ownership composition. A notable exception is found in Gray (1991), who lists four
major dimensions in which nonprofit hospitals grew similar to for-profit hospitals: the
growing reliance of nonprofit hospitals on revenues from the sale of services, their
dependence on economic performance for gaining access to capital, the decline in local
control resulting from the rise of the multi-institutional systems and the growing
involvement of nonprofit hospitals in types of hybrid arrangements, such as management
and departmental contracts, restructuring, joint ventures and alliances3. However, an
important dimension was overlooked - the growing similarity in capacity of for-profit and
nonprofit hospitals. According to Hansmann et al. (2002) little empirical work has
focused on the impact of ownership form on hospitals’ capacity choice. This section
provides evidence for the growing similarity in capacity and studies its nature,
determinants and the channels, through which it was routed.
Figure 2.1 presents the ratio of nonprofit to for-profit hospitals based on the average
number of beds per hospital, from 1928 to 2000. For more than three decades, between
1928 and the early 1960s nonprofit hospitals maintained on average more than three
times as many beds per hospital as their for-profit counterparts, by 2000 the average
nonprofit hospital was only 32% larger than the typical for-profit hospital.4
3 “Business terminology and business thinking have pervaded the nonprofit hospital world.”, and “reliance on the sale of services for economic survival has important consequences ..... nonprofit status can become more of a convenience than a necessity or an expression of philosophy.” Gray (1991). Moreover, since nonprofit hospitals generate most of their revenue from sales of services they fit into Hansmann’s (1980) definition of “commercial nonprofits”. 4 This convergence in capacity, from the 1960’s on, is mirrored by the convergence in utilization, though at a slower rate: While in 1960, a nonprofit hospital admitted on average 2.8 times more patients per hospital than a for-profit hospital, by 2000 that figure had fallen to 1.47 (See subsection 2.2 for detailed discussion).

5
Figure 2.1
1
1.25
1.5
1.75
2
2.25
2.5
2.75
3
3.25
3.5
1925 1930 1935 1940 1945 1950 1955 1960 1965 1970 1975 1980 1985 1990 1995 2000
Year
Non
prof
it-to
-For
-Pro
fit R
atio
While the downward sloping part of the nonprofit-to-for-profit ratio curve begins in the
mid-1950s, there was no dramatic change, taking place at that time that might have
triggered the subsequent convergence trend. However, it might be more sensible to think
that the introduction of the Medicare and Medicaid programs in 1965 prompted the trend,
setting the stage for the growing similarity among hospitals of different ownership type.
This assertion is not rejected by the data since the downward sloping segment between
the mid-1950s and the mid-1960s can be attributed to cyclical fluctuations, which seems
to characterize the early part of the series quite well.
In order to study changes in the size distribution of for-profit and nonprofit hospitals, I
use hospital-level data for the years 1970, 1982 and 1998. Figure 2.2 presents a
percentile-percentile graph that illustrates the dissimilarity between the size-distribution
of for-profit and nonprofit hospitals in a given year as well as demonstrates the
convergence of these size-distributions over time. Percentiles for the for-profit hospitals
appear on the x-axis while percentiles for the nonprofit hospitals appear on the y-axis.
Convergence in the average number of beds per hospital, between nonprofit and for-profit hospitals.
Sources: 1928, 1935 and 1940: White, D. William "The American Hospital Industry Since 1900: A Short History" Advances in Health Economics and Health Services Research, Vol. 3, (1982) p 143-170. 1946-2000: American Hospital Association, Hospital Statistics (Various Years).

6
The 45o line represents a situation in which the size distribution of nonprofit and for-
profit hospital is identical.
0.0
0.1
0.2
0.3
0.4
0.5
0.6
0.7
0.8
0.9
1.0
0.0 0.1 0.2 0.3 0.4 0.5 0.6 0.7 0.8 0.9 1.0
Perc
entil
e N
FP
19701998 1982
I illustrate the change over time in the relative size of nonprofit and for-profit providers
by using three curves: for 1970, 1982 and 1998. A point on any of these contours
corresponds to a pair of percentile points for an identical hospital’s capacity. For
example, the pair (0.5, 0.2) on the 1970 curve means that a hospital in the 50th percentile
of the for-profit size-distribution had the same number of beds as a hospital in the 20th
percentile of the nonprofit size-distribution. By 1998, the median for-profit hospital
utilized the same number of beds as a hospital in the 43rd percentile of the nonprofit size-
distribution. It is clear from Figure 2.2 that for-profit hospitals moved trough the size-
distribution of the nonprofit hospitals. As a matter of fact, in 1998 for-profit hospitals in
the 25th percentile and below were larger than their nonprofit counterparts.
Figure 2.2 Percentile Nonprofit – Percentile For-Profit graph for capacity in 1970, 1982 and 1998.
Percentile FP

7
The current section is divided into three subsections: the first provides a historical outline
description of the era before and after the introduction of the Medicare and Medicaid
programs. The roots that hospitals have as charitable institutions still have overwhelming
impact on policy interventions as well as for the formulation of theories. Understanding
the historical evolution of the hospital sector is important for recognizing the effects that
different regulatory, economic, technological and demographic changes had on the
relative share and size of nonprofit and for-profit hospitals. The second subsection
discusses the determinants of hospitals’ capacity choice, namely, number of admissions,
lengths of stay and occupancy rates. Using aggregate hospital data for the U.S. between
1960 and 2000, I show that although most of the convergence in capacity is replicated by
the convergence in the number of admissions, medical practice, represented by average
length of stay, contributed to the growing similarity between nonprofit and for-profit
hospitals. Finally, using hospital-level data for the U.S. between 1970 and 1998, I present
a decomposition analysis of the principal components of the convergence process.
2.1 The History of the US hospital market
2.1.1 The pre-Medicare era
In 1752, Pennsylvania Hospital was the first hospital to be established in the U.S. It was
a hospital, intended to serve all of the sick poor who suffered from a curable, non-
contagious illness. At that time, paying patients accounted for 22% of admissions (Raffel
and Raffel, 1989).5 Following Philadelphia, similar voluntary hospitals were built in New
York and Boston. All these hospitals relied for their operation on paying patients beside
donations and support from the state.6 The U.S. Bureau of Education recorded the
existence of 178 hospitals, of all types, in 1873. “Hospitals existed in the nineteenth
century to fulfill a social function, rather than a medical one” (White, 1982) as it was
only the poorest members of society that used the hospital. Hospitals were also used for
teaching and research purposes; hence one might view the indigent patients as paying for
5 “Paying patients were usually servants or slaves whose masters paid the bills or mentally ill from middle-and-upper-class families” (Raffel and Raffel, 1989). 6 “Paying patients were often charged more than the cost of care, and the excess money helped to support the free patients” (Raffel and Raffel, 1989).

8
medical services by allowing the use of their bodies for medical training purposes (Raffel
and Raffel, 1989).
Major medical developments have altered the original role of hospitals; from the last
resort for the sick and poor to the superior organizational form, in both diagnosis and
treatment, for all members of society. The number of hospitals reached 4,041 in 1925,
more than 20 times the number of hospitals in 1873. The hospital of the twentieth
century, regardless of its ownership status, was a business that focuses on delivering high
quality medical care to all patients. As a result of this orientation, the nonprofit hospital
attracts patients who are willing and able to pay for its services, utilizes the most
advanced technologies and employs leading physicians and other highly skilled workers.
Yet, the roots that so many nonprofit hospitals have as charitable institutions may tilt our
reasoning for their current existence towards somewhat anachronistic and outdated
arguments. Such arguments often rely on the notion that nonprofit providers are altruistic
in nature while for-profit providers engage in profit-seeking and even compassionless
behavior.
In 1928, the share of for-profit hospitals was 43.6%, similar to the share of nonprofit
hospitals in that year (43.9%) and the reminder was accounted for by government
hospitals. White (1982) suggested that for-profit hospitals played an important role in the
early growth of the industry. These hospitals were small proprietary institutions, owned
by doctors who wanted to provide facilities for themselves and for the community (Gray,
1991). This type of hospital gradually disappeared throughout the century; by 1965 its
share has declined to 15%. For-profit hospitals in small communities and rural areas were
often replaced by nonprofit hospitals, or even changed their ownership status to the
nonprofit form directly.
Why was nonprofit status preferred to for-profit status at a time when demand for
medical care was increasing and third-party insurance was becoming well established?
Following the years of the Great Depression and World War II, the government held the
view that there was shortage of hospital beds. Beginning in 1946, the government
encouraged hospital construction through the Hill-Burton Act. For-Profit hospitals were

9
not allowed to obtain such funds. Nonprofit hospitals receiving nearly 60 percent of all
funds (Wu, 1992) placed for-profit hospitals at great disadvantage.7 Between the first
Hill-Burton award in 1947 and the early 1970s, more than 344 thousand inpatient beds
were added to public and nonprofit general hospitals. Hill-Burton funds exceed 3.7
billion dollars.8 Dranove (2000) describes how “many communities took over their local
for-profit hospital, converted them to nonprofit status, and infused much needed cash into
aging facilities”. The Hill-Burton Act of 1946 was the first major entry of the federal
government into supporting the general medical care system. The Medicare and Medicaid
programs of 1965 can be viewed as a significant expansion of this involvement. Yet,
while Medicare and Medicaid were primarily aimed to improve access to medical care
for the aged and the poor, these programs also marked the beginning of a more symmetric
treatment of for-profit and nonprofit hospitals on the part of the government. The two
programs reimbursed for-profit as well as nonprofit hospitals. This has reduced the
financial risk of running for-profit hospitals and for the first time since the early 1950s
the number of beds in for profit hospital began to increase (White, 1982).
2.1.2 The post-1965 era
The need to provide medical care by public and nonprofit hospitals, in the form of free or
subsidized services was overwhelmingly lessened as the government began subsidizing
purchases of medical care directly through programs like Medicare and Medicaid (White,
1979). Medicare paid hospitals on a cost-plus basis, a method that did not encourage
hospitals to operate efficiently. Most private insurance plans paid whatever charges
hospitals billed. As a result, the cost of Medicare continued to rise rapidly and the
government had to step in. Legal limitations, requiring hospitals to have government
approval (in advance) for the purchase of major equipment, the expansion of existing
medical facilities and the construction of new ones through certificate of need (CON)
7 White (1982) mentions a study suggesting that the Hill-Burton Act may have contributed to the decline of for-profit hospitals over the 1950s and 1960s. 8 “The Hill-Burton program assisted in the construction of nearly 40 percent of beds in the nation’s short-term general hospitals and was the single greatest factor in the increase in the nation’s bed supply during the 1950s and 1960s” (Haglund and Dowling, 1993).

10
rules.9 In 1983, a fundamental change to the hospitals’ environment took place - the
introduction of the Medicare Prospective Payment System (PPS). Prior to the PPS,
government programs reimbursed hospitals on a cost basis, whereby hospitals were paid
retrospectively based on their reported costs. Under the new system, hospitals were
reimbursed on the basis of a fixed payment per patient. This payment was independent of
the actual cost incurred and depended on the diagnosis of the patient at the time of
admission.10 Gray (1991) calls this period the end of the golden era as the
“reimbursement environment from the late 1960s until the early 1980s made it difficult
not to make money operating hospitals, so long as they were located away from
concentrations of low-income populations and in states that did not regulate hospital
income.” In the late 1960s, while the decline in the number of proprietary hospitals
continued, a new type of for-profit hospital has emerged - the Investor-Owned Hospital
Company. In 1984, close to 60 percent of all investor-owned hospitals were owned by
only six hospital chains.11
Hospitals reacted to the PPS by limiting services – curtailing lengths of stay, reducing
inpatient testing, and laying off staff. The new system has been successful in containing
hospital costs, and for the first time in the history of Medicare, the number of Medicare
admissions declined (Raffel and Raffel, 1989). Although hospitals changed their behavior
rather radically, the convergence trend, presented in Figure 2.1, was not disrupted by the
introduction of the PPS. However, the reasons for the continued convergence process
changed. Table 2.1 illustrates the change in the underling causes of the convergence process. Prior
to the introduction of the PPS in the early 1980s, both for-profit and nonprofit hospitals
9 Phelps (1997) argues that, based on the empirical studies of CON laws, such regulations were generally inefficient in controlling hospital cost and possibly had perverse effects on overall cost, as hospitals substituted away from beds to other costly inputs such as equipment and personnel. 10 Payments under PPS were made at a predetermined, specific rate for each discharge according to its classification in one of 467 diagnostic related groups (DRGs). 11 Gray (1991) provides the following information regarding those six hospitals: Hospital Corporation of America (200 hospitals), American Medical International (115 hospitals), Humana (87 hospitals), national Medical Enterprises (47 hospitals), Charter Medical Corporation (41 hospitals), and Republic Health Corporation (24 hospitals).

11
grew in scale. For-profit hospitals grew at a rate of more than 5 percent per year, whereas
nonprofit hospitals grew at about 2.3 percent per year, leading to convergence in size.
Table 2.1: Growth rate of the average number of beds per hospital, by ownership type: 1955 – 2000. (percent)
Year Nonprofit For-Profit Government 1955-1960 7.9 19.2 -2.3 1960-1965 10.9 26.9 -0.5 1965-1970 16.3 25.7 -2.8 1970-1975 12.7 36.7 -0.3 1975-1980 5.7 26.5 -0.9 1980-1985 1.3 8.4 1.4 1985-1990 -2.5 4.4 -2.3 1990-1995 -4.2 4.5 -0.1 1995-2000 -1.6 4.2 -3.2
Source: American Hospital Association, Hospital Statistics (Various Years), author’s calculations.
After the introduction of PPS, for-profit hospitals continued to grow, albeit at a markedly
lower rate. Nonprofit hospitals, on the other hand, contracted. Government hospitals,
throughout most of the period, experienced a modest decline in average size. The decline
in size is mainly attributable to the changing role of government, as subsidizing medical
care gradually supplanted the production of hospital services. Government hospitals were
not sensitive to changes in federal or state programs.12
By and large, changes in the economic environment induced the convergence in size
between for-profit and nonprofit hospitals. Some changes, such as aging, population
growth, crowding out of government hospitals and symmetric reimbursement on the part
of public programs have led both ownership types to experience growth in their efficient
scale, potentially at different rates. At the same time, changes such as a decline in federal
subsidies (which favored nonprofit hospitals), increasing consolidation and challenges by
local government and communities to the tax-exemptions received by nonprofit hospitals
have led to a simultaneous decrease in the size of nonprofit hospitals and increase in the
12 Duggan (2000) finds evidence to support the claim that public hospitals differ substantially from all private hospitals (for-profit or nonprofit) because of their soft budget constraint.
12
size of for-profit hospitals. In the next subsection I study the underling determinants of
the changes in relative size of for-profit and nonprofit hospitals.
2.2 The Determinants of Capacity
A hospital’s capacity expresses the choice of its potential to accommodate patients. Yet,
maintaining unutilized capacity is costly and therefore, hospitals that experience a decline
in occupancy rates have an incentive to reduce their space. Consider the following
identity:
(2.1) ALSAdmOccBed ⋅≡⋅
Where Bed is the number of beds per hospital; Occ is the hospital’s occupancy rate; Adm
is its average number of admissions per day and ALS is its average length of stay (in
days). The right hand side of (2.1) highlights the fact that hospital beds can be either
vacant or occupied while the left hand side illustrates that a bed cannot concurrently
accommodate a new admission (patient admitted that day) and one admitted during
previous days. In other words, hospitals face a tradeoff between admissions volume and
hospitalization duration. For example, doubling the number of admissions, while cutting
lengths of stay in half, will not affect overall utilization. Note that, volume and duration
are perfect substitutes in terms of utilized capacity or patient days; however, they are
imperfect substitutes in terms of economic or medical performance13.
The identity in (2.1) holds for each individual hospital and subsequently holds for any
aggregation across hospitals. Equations (2.2) and (2.3) present these identities for the
average nonprofit and for-profit hospitals respectively.
(2.2) NNNN ALSAdmOccBed ⋅≡⋅
(2.3) FFFF ALSAdmOccBed ⋅≡⋅
Divide equation (2.2) by equation (2.3) and rearrange terms, to get:
(2.4) 1−
⋅⋅=≡ F
N
F
N
F
N
F
N
OccOcc
ALSALS
AdmAdm
BedBed
RatioSize
13 For example, under the prospective payment system hospitals have an economic incentive to increase the number of admissions and cut the length of stay per admission. On the other hand, shortening the lengths of stay might not be medically desired, and can damage the hospital’s reputation.

13
The nonprofit-to-for-profit size ratio, presented in equation (2.4), is the product of three
ratios: the admissions ratio, the ALS (average length of stay) ratio and the inverse
vacancy ratio. To identify the individual contribution of each component, define FNFN iii // = where, ],,,[ ALSAdmOccBedi ∈ and apply a log transformation to both
sides of (2.4):
(2.5) FNFNFNFN OccALSAdmBed //// lnlnlnln −+=
Totally differentiating (2.5) and dividing both sides by dlnBed, we get:
(2.6) FN
FN
FN
FN
FN
FN
BeddOccd
BeddALSd
BeddAdmd
/
/
/
/
/
/
lnln
lnln
lnln1 −+=
Applying equation (2.6), using aggregate data for the US between 1960 and 2000, I find
that 82.2% of the convergence in size is attributed to a convergence in the number of
admissions while 17.1% is accounted for by a convergence in lengths of stay. The
contribution of the inverse vacancy ratio to the overall convergence is very small (less
than 1%).
An alternative approach to identify the apparatus of the convergence in capacity directly
utilizes equation (2.4). The method, presented in Figure 2.3, shows three trend lines, all
begin with the size ratio in 1960. The bottom contour illustrates the convergence in size,
and hence combines all three effects: admissions, ALS and vacancy. In the middle
contour the average length of stay ratio is normalized to one, allowing the dynamics in
the admissions ratio and inverse vacancy ratio to exclusively determine the size ratio. The
upper trend line depicts a hypothetical movement of the size ratio allowing it to be
determined solely by changes in the inverse vacancy ratio.
The area between the upper and the middle contours represent the contribution of the
admissions ratio to the convergence in capacity, whereas the area between the middle and
the bottom contours represent the contribution of the average length of stay ratio to the
convergence in capacity.
The convergence in capacity is mirrored by the convergence in utilization, though at a
slower rate: While in 1960, a nonprofit hospital admitted on average 2.8 times more
patients per hospital than a for-profit hospital, by 2000 that figure had fallen to 1.47.

14
1
1.5
2
2.5
3
3.5
4
1960 1962 1964 1966 1968 1970 1972 1974 1976 1978 1980 1982 1984 1986 1988 1990 1992 1994 1996 1998 2000
Non
prof
it-to
-For
-Pro
fit R
atio
Effect of changes in the relative occupancy rate (holding the change in number of admissions and the change in average length of stay fixed.
The contribution of changes in the number of admissions to the overall convergence in capacity.
The contribution of the change in relative ALS (average length of stay) to the overall convergence in capacity.
OccALSAdmBeds ⋅
≡
Occ1
OccAdm
To understand why nonprofit and for-profit hospitals converged faster in terms of
capacity, measured here by the average number of beds, than in terms of utilization, as
indicated by the annual number of admissions, recall the relationship between a hospital’s
number of admissions and its number of beds, presented in equation 2.1: two factors may
account for the differential speed of convergence in hospital size and admissions volume.
First, both types of hospitals experienced a decline in occupancy rates from about 75% in
the 1960s to about 60% in 2000. However, by 2000, unutilized capacity across ownership
Figure 2.3 The relative contribution of admissions, ALS and vacancy rates to the change in
the nonprofit-for-profit size ratio, 1960 – 2000.
15
types had a modest contribution to the overall convergence in size.14 Second, while the
average length of stay in both types of hospitals has generally declined due to
technological progress, which allowed for more effective interventions and thus resulted
in shorter hospital stays, the average length of stay in for-profit hospitals declined at a
slower rate than in nonprofit hospitals. One plausible explanation is the growing
similarity in patient mix, due to the growing share of Medicare and Medicaid patients in
for-profit institutions. These patients typically stay longer in the hospital. This trend
partially offset the decline in ALS caused by technological improvements.
2.3 Decomposition of the change in ratios
The convergence in size between for-profit and nonprofit hospitals may arise from many
different sources, including entry of new facilities, closures, mergers, expansion or
downsizing of existing facilities, and changes in ownership15. These channels, through
which the convergence took place, are in turn affected by laws and frequently regulated
by government agencies.16 This subsection aims to uncover the principal sources
responsible for the convergence trend and hope to serve as a guide for constructing a
realistic model that can replicate the observed dynamics.
In particular, to identify whether the change in ownership-specific average hospital size
can be accounted for primarily by a change in the size of the staying hospitals (intensive
margin) or by entry, exit, acquisitions and divestitures (extensive margin) hospital-level
panel data for 1970-1998 are divided into seven time intervals; 1970-1974, 1974-1978,
1978-1982, 1982-1986, 1986-1990, 1990-1994 and 1994-1998. The four-year interval
14 The over all change is less than 1%; however, the inverse vacancy ratio fluctuated during this 50-years period, this can be seen in Figure 2.3. 15 Mitchell et al. (2001) find that AHA hospital data are often incomplete and inaccurate with regard to mergers and affiliations. Affiliations are not introduced as a separate channel in my analysis. In addition, in most cases, the individual hospital facilities involved in mergers continue to report separately to the AHA (Barro, 2000). 16 For instance, the Department of Justice and the Federal Trade Commission monitor and sanction mergers and other forms of strategic behavior among hospitals; the states’ attorneys general oversee conversions and acquisitions of nonprofit hospitals; certificate-of-need laws limit entry of new hospitals and expansions of existing ones; state legislators frequently evaluate the cost of tax exempting nonprofit hospitals; and states and the federal government introduce programs to improve accessibility, insure certain groups and finance research activities.
16
data rather than year-to-year data are used to allow potential and actual hospitals to adjust
their capacity (measured by number of beds). In order to identify the principal
components of the ratio of average size of for-profit and nonprofit hospitals, it is useful to
partition the hospital sample into the following five mutually exclusive categories: (1)
constant-status hospitals: general hospitals (including small/rural and teaching hospitals)
that maintained their ownership type throughout a given time interval. (2) exitors:
hospitals that exited the market prior to the end of a given time interval. (3) entrants:
hospitals that entered the market after the beginning of a given time interval. (4) switched
into: hospitals that switched from government or nonprofit status to for-profit status after
the beginning of a given time interval. (5) switched from: hospitals that no longer
maintained for-profit status by the end of a given time interval.
A given time interval is indexed by a pair of years (j,i), where j represent the first year
and i the last year of a given time interval. For any given pair (j,i), each hospital will
belong to one of the five, mutually exclusive, categories, k, listed above. Denote the share
of hospitals with ownership type [ ]FNo ,∈ , group k in year i as Oiks , and the average size
of hospitals of ownership type [ ]FNo ,∈ , group k and year i as Oikx . The staying hospital
category is marked k=1. The average size (measured by number of beds) of hospital type
o in year i, is: ∑k
Oik
Oik xs . Define the nonprofit to for-profit size ratio, in year i, as
∑∑=k
Fik
Fik
k
Nik
Niki xsxsR . Furthermore, denote the growth rate, within a given time
interval, for ownership type o, as: ∑∑=k
Ojk
Ojk
k
Oik
Oik
Oji xsxsG .
Using growth rate for nonprofit hospitals, the change in this ratio as we move from year j
to year i, is given by:
(2.7) ∑
∑∑ −=
−=∆
k
Fik
Fik
k
Fik
Fik
k
Fjk
Fjk
Nji
j
jiji xs
xsxsG
RRR
.

17
By rearranging this expression around the staying hospitals category, we get: 17
(2.8)
−−−+
−=∆
∑∑∑
∑k
Fik
Fik
k
Fi
Fik
Fik
Fj
k
Fjk
Fjk
Nji
k
Fik
Fik
Fi
Fj
Nji
ji xs
xxsxxsG
xsxxG )()( 11
11
The “within” component The “between” component
The staying for-profit hospitals category serves as a cross-sectional reference group
whereas all nonprofit hospitals serve as a reference group for the time dimension. It is
important to realize that such decomposition considers for-profit and nonprofit hospitals
simultaneously; yet, the resulting decomposition of effects is not unique.18 The “within”
component, represents intensive margin changes, and focuses on the staying hospitals
group (k=1). The sign of the “within” component is determined by the sign of Fi
Fj
Nji xxG 11 − .19 If the staying for-profit hospitals were to grew at the same rate as all
nonprofit hospitals, the within component would equal zero. Intuitively, similar growth
rates in size for both for-profits and nonprofits hospital, even of large magnitude, will
have little or no effect on the ratio of sizes.20
Table 2.2 presents the results from the decomposition given by equation (2.8) for the
seven time periods. The bottom row – Total - lists the percentage decline in the nonprofit-
to-for-profit size ratio for each time segment and is the sum of the effects of each of the
17 See appendix 2.A for the derivation. 18 For example, by using the staying nonprofit hospital as cross sectional reference group and for-profit hospitals as reference group for the time dimension a different decomposition would emerge. When decomposing differences, it is common to take an average of such two polar decompositions (viewed as lower and upper bounds). This is not the case when decomposing ratios, as it treats both for-profit and nonprofit hospitals simultaneously. Therefore it can be viewed as the choice of an angle trough which one studies a phenomenon, rather than the choice of upper or lower bounds. 19 The average size of a staying for-profit hospital in year i is subtracted from average size of a staying for-profit hospital in year j, multiplied by the growth rate of all nonprofit hospitals. 20 Note that the nonprofit hospitals growth rate is used as multiplier in the case of exitors, and hospitals switching from for-profit status, as these hospitals appear only in the starting period, j, but are absent in the end period, i.
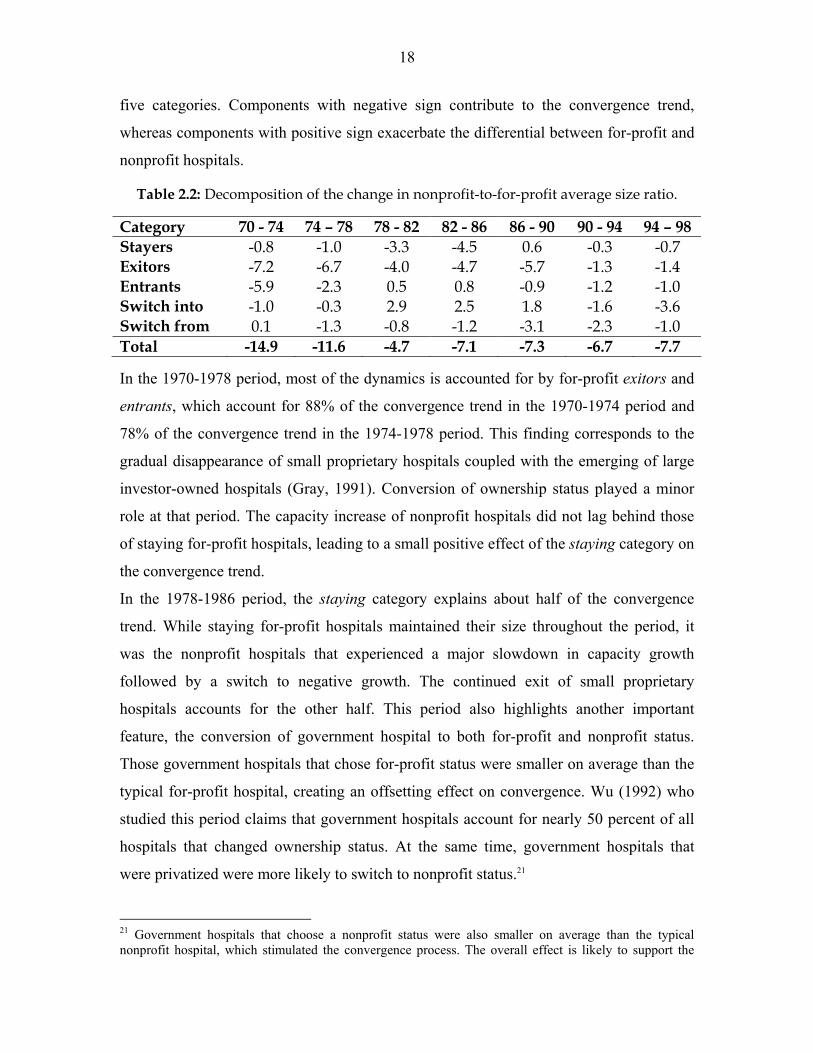
18
five categories. Components with negative sign contribute to the convergence trend,
whereas components with positive sign exacerbate the differential between for-profit and
nonprofit hospitals.
Table 2.2: Decomposition of the change in nonprofit-to-for-profit average size ratio.
Category 70 - 74 74 – 78 78 - 82 82 - 86 86 - 90 90 - 94 94 – 98 Stayers -0.8 -1.0 -3.3 -4.5 0.6 -0.3 -0.7 Exitors -7.2 -6.7 -4.0 -4.7 -5.7 -1.3 -1.4 Entrants -5.9 -2.3 0.5 0.8 -0.9 -1.2 -1.0 Switch into -1.0 -0.3 2.9 2.5 1.8 -1.6 -3.6 Switch from 0.1 -1.3 -0.8 -1.2 -3.1 -2.3 -1.0 Total -14.9 -11.6 -4.7 -7.1 -7.3 -6.7 -7.7 In the 1970-1978 period, most of the dynamics is accounted for by for-profit exitors and
entrants, which account for 88% of the convergence trend in the 1970-1974 period and
78% of the convergence trend in the 1974-1978 period. This finding corresponds to the
gradual disappearance of small proprietary hospitals coupled with the emerging of large
investor-owned hospitals (Gray, 1991). Conversion of ownership status played a minor
role at that period. The capacity increase of nonprofit hospitals did not lag behind those
of staying for-profit hospitals, leading to a small positive effect of the staying category on
the convergence trend.
In the 1978-1986 period, the staying category explains about half of the convergence
trend. While staying for-profit hospitals maintained their size throughout the period, it
was the nonprofit hospitals that experienced a major slowdown in capacity growth
followed by a switch to negative growth. The continued exit of small proprietary
hospitals accounts for the other half. This period also highlights another important
feature, the conversion of government hospital to both for-profit and nonprofit status.
Those government hospitals that chose for-profit status were smaller on average than the
typical for-profit hospital, creating an offsetting effect on convergence. Wu (1992) who
studied this period claims that government hospitals account for nearly 50 percent of all
hospitals that changed ownership status. At the same time, government hospitals that
were privatized were more likely to switch to nonprofit status.21
21 Government hospitals that choose a nonprofit status were also smaller on average than the typical nonprofit hospital, which stimulated the convergence process. The overall effect is likely to support the

19
In the 1986-1998 period, the capacity of both staying for-profit hospitals and nonprofit
hospitals decreased. As both moved in the same direction with similar proportions the
effect of the staying category on the convergence trend was small. In fact, the staying for-
profit category for the 1986-1990 period was slightly offsetting the convergence trend, as
existing for-profit hospital lowered their capacity faster than nonprofit hospitals. This
finding corresponds to new empirical research by Hansmann et al. (2002) who suggest
that “nonprofit firms have a tendency to act as capital traps, in which capital remains
inefficiently embedded over long periods”. By studying the 1985-1994 period, the
authors find that for-profit hospitals are the most responsive to reductions in demand. In
the 1990s, all categories positively contributed to the convergence trend, yet, switches in
ownership types through mergers, acquisitions and divestitures accounted for 58% of the
trend in the 1990-1994 period, and 60% in the 1994-1998 period. The reminder is
explained by entry, exit and intensive margins changes, all operating in the same
direction.
1.2
1.4
1.6
1.8
2
2.2
2.4
2.6
1970 1974 1978 1982 1986 1990 1994 1998
Year
NFP
-to-F
P R
atio
convergence process as government-to-nonprofit switches were more pronounced than government-to-for-profit switches.
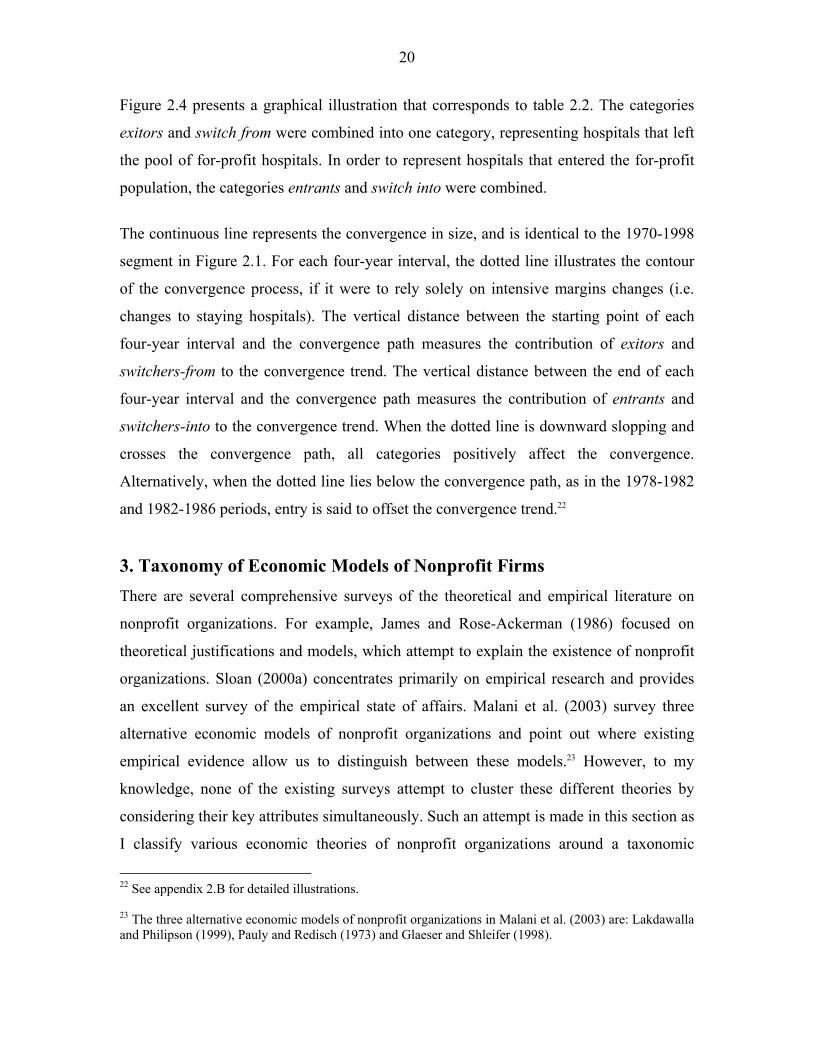
Figure 2.4 Decomposition of the change in nonprofit-to-for-profit average size ratio
Overall trend
Stayers
20
Figure 2.4 presents a graphical illustration that corresponds to table 2.2. The categories
exitors and switch from were combined into one category, representing hospitals that left
the pool of for-profit hospitals. In order to represent hospitals that entered the for-profit
population, the categories entrants and switch into were combined.
The continuous line represents the convergence in size, and is identical to the 1970-1998
segment in Figure 2.1. For each four-year interval, the dotted line illustrates the contour
of the convergence process, if it were to rely solely on intensive margins changes (i.e.
changes to staying hospitals). The vertical distance between the starting point of each
four-year interval and the convergence path measures the contribution of exitors and
switchers-from to the convergence trend. The vertical distance between the end of each
four-year interval and the convergence path measures the contribution of entrants and
switchers-into to the convergence trend. When the dotted line is downward slopping and
crosses the convergence path, all categories positively affect the convergence.
Alternatively, when the dotted line lies below the convergence path, as in the 1978-1982
and 1982-1986 periods, entry is said to offset the convergence trend.22
3. Taxonomy of Economic Models of Nonprofit Firms There are several comprehensive surveys of the theoretical and empirical literature on
nonprofit organizations. For example, James and Rose-Ackerman (1986) focused on
theoretical justifications and models, which attempt to explain the existence of nonprofit
organizations. Sloan (2000a) concentrates primarily on empirical research and provides
an excellent survey of the empirical state of affairs. Malani et al. (2003) survey three
alternative economic models of nonprofit organizations and point out where existing
empirical evidence allow us to distinguish between these models.23 However, to my
knowledge, none of the existing surveys attempt to cluster these different theories by
considering their key attributes simultaneously. Such an attempt is made in this section as
I classify various economic theories of nonprofit organizations around a taxonomic
22 See appendix 2.B for detailed illustrations. 23 The three alternative economic models of nonprofit organizations in Malani et al. (2003) are: Lakdawalla and Philipson (1999), Pauly and Redisch (1973) and Glaeser and Shleifer (1998).

21
system. This taxonomy identifies the conceptual building blocks of these models,
highlights their importance for the study of nonprofit organizations and offers a practical
way to organize the various models. In addition, such classification will enable me to
show how my theoretical approach relates to the literature.
In order to obtain the suggested taxonomy I have combined two conceptually
independent dimensions: an objective-choice dimension and a complete information-
incomplete information dimension. My choice of organizing dimensions is not unique, in
fact, proposing different organizing dimensions can lead to a different taxonomy.24
Nevertheless, I find the dimensions identified in this present taxonomy are very useful for
organizing a wide range of theories of nonprofit organizations.
The objective –choice dimension
Ownership status, whether for-profit or nonprofit, represents a choice. For some, this
choice can be traced back to intrinsic differences in objectives across individuals. For
example, the altruist will choose to organize as a nonprofit while the opportunist will
choose to organize as a for-profit. For others, the choice of ownership status need not rely
on a-priori differences in objectives; it results from simply balancing the benefits and
drawbacks of each status under a set of market conditions. In the present taxonomy, the
objective – choice dimension corresponds to these two polar viewpoints: a theory is
classified as “objective” if it contains the assumption that nonprofit and for-profit firms
differ in their objectives. Conversely, theories that rely on uniform objectives for both
nonprofit and for-profit firms are classified as “choice”.25
The complete information – incomplete information dimension
In a landmark paper, Arrow (1963) emphasizes the role of uncertainty and incomplete
markets for risk as candidate explanation for nonprofits’ dominance of the healthcare
sector. The idea is that the hospital care purchaser is often not well informed about the
24 Alternative dimensions which might be included are: binding vs. non-binding non-distribution constraint, reduced-form vs. specific “residual claimant” for the nonprofit organization and so on. 25 In many cases, scholars have put forward the idea that the nonprofit objectives mirror the objectives of a certain group within the organization (e.g. trustees, administrators, physicians) or outside the organization (e.g. consumers, government). For the purpose of this taxonomy, unless the resulting objectives for the nonprofit entities match the for-profit ones, I will classify this theory as “objective”.

22
quality of the service being purchased and is frequently less informed than the supplier.
Consequently, some scholars claim that the solution for this asymmetric information
problem surface due to the availability of the nonprofit legal status. In this taxonomy, any
theory that relies on incomplete information will be classified as such.
Combining the two independent dimensions (i.e. the objective-choice dimension and the
complete information-incomplete information dimension) yields four distinct classes of
conceptualizations. Table 3.1 presents the taxonomy and organizes these approaches and
identifies several well-established theories of nonprofit organizations. It is important to
note that no attempt has been made to be exhaustive. Instead the theories identified and
described are those that are frequently cited in other surveys. In what follows I will
discuss each class of models separately.
Table 3.1: Taxonomy of economic theories of nonprofit organizations with corresponding leading examples
Complete Information – Incomplete Information Dimension Objective– Choice Dimension Complete information Incomplete information
Choice
Trust Signal
Non Contactable Quality
Mechanism for Consumer Control
Objective
Quality-Quantity Maximization
Profit Deviators (or Altruists)
Physicians’ Cooperative
Demand for Collective Goods
“For-Profits in Disguise”
Government Favoritism
The first class of models, shown at the lower left-hand side panel of table 3.1, present
nonprofit organizations as maximizing objectives, such as patient volume, quality,
physicians’ income or charity care. These models promoted the idea that when a firm is
not organized with the explicit goal of maximizing profits, applying conventional
neoclassical models of firms is not appropriate. Newhouse (1970) and Feldstein (1971)
argue that nonprofit hospitals seek to maximize some combination of quantity and quality
of services provided, subject to the constraint of maintaining fiscal viability (i.e. Quality-

23
Quantity Maximization). Their models suggest that nonprofit hospitals have a bias against
low-quality services. Lakdawalla and Philipson (1999) have generalized Newhouse’s
model by including profits in the firm’s objective function. In their formulation, nonprofit
firms are assumed to have non-pecuniary motives and enjoy a competitive advantage
over profit-maximizing firms. The authors use the term Profit Deviators to describe the
willingness of nonprofit firms to lower profits in order to provide more services. Lastly,
Pauly and Redisch’s (1973) Physicians’ Cooperative model serves as an example for
attributing the objectives of the nonprofit hospital to a certain group within the
organization. In their model, the members of the physicians’ staff cooperatively manage
the nonprofit hospital. Basing their modeling approach on the Labor-Managed-Firm
(LMF) literature, Pauly and Redisch assume that the physicians’ staff maximizes their
income per member.26 In other words, the group of attending physicians enjoys de facto
control over the hospital by collectively controlling the utilization of inputs and the
medical output.27
The second class of models, shown at the upper right-hand side panel of table 3.1, traces
the justification for nonprofit organizations to their alleged “trustworthiness” (Hansmann,
1980). The nonprofit status is said to provide weaker incentive to shirk on quality when
faced with asymmetric information, favoring the suppliers of care.28 This idea that
nonprofit hospitals are more trustworthy has spurred a large body of theoretical literature
(Hansmann, 1980, 1996; Easley and O’Hara, 1983; Hirth 1999; Glaeser and Shleifer,
1998; Glaeser, 2003). These models stress the idea that consumers cannot contract on
product quality (Malani et al, 2003); this quality is for the most part unobservable.29 By
26 Bonin et al. (1993) wrote a comprehensive review of the theoretical and empirical LMF literature. Also see Ward (1958), Vanec (1970) and Meade (1972). 27 From an historical viewpoint, true physicians’ cooperatives never developed in the United States (White, 1982). Moreover, the LMF theory implies that nonprofit hospitals should be smaller than for-profit hospitals and an increase in the demand for hospital services may decrease the production of services through reducing the size of its medical staffs. Both these predictions are not applicable to the US hospital market. 28 The idea is that the consumer often cannot experience the quality of the good. In other words, hospital care is credence good (Emons 1997). The consumer may never know for sure what would have happened if the service had not been performed or if it had been purchased from another seller. 29 A profit-seeking hospital may provide high quality on easily monitored dimensions (e.g. amenities, meals, privacy), but cut corners on hard-to-monitor quality measures.

24
choosing a nonprofit status the organization commits itself to the provision of higher
quality. It is the choice of nonprofit form that signals quality, thus referred to as a Trust
Signal. Similarly, Ben-Ner and Gui (1993) rely on information asymmetries to rationalize
the rise of nonprofit organizations as a mechanism for consumer control.
All models in this category essentially predict that nonprofit organizations provide
services of higher quality relative to their for-profit counterparts. However, rigorous and
extensive empirical work has failed to detect such differences in quality (Frank and
Salkever, 1994) and data is said to be inconclusive (Malani et al., 2003).30 In recent
research, David and Malani (2003) examine nonprofit hospitals’ signaling behavior by
tracking a sample of nonprofit hospitals’ Internet websites nationwide. They find that
nonprofit hospitals’ websites (and in particular homepages) highlight many quality
dimensions.31 However, about 87 percent of nonprofit hospitals did not mention their
ownership status on their website’s homepage and about 58 percent did not mention it
anywhere on their website. The authors claim that if the nonprofit status were indeed an
important Trust Signal it would be costless to add this detail along with all the other
quality-related superlatives.
The third class of models, shown at the lower right-hand side panel of table 3.1, combines
the notions of incomplete information and intrinsically different objectives across
ownership types. James (1983) and Weisbrod (1975; 1988) loosely fit into this category.
James (1983) relies on information asymmetries and variation in objectives to emphasize
the role of government in channeling grants and subsidies to nonprofits rather than to
public agencies or for-profit firms. Weisbrod (1975) assumes that the provision of
collective and individual goods through the public sector will result in unsatisfied
demand by some consumers. The greater this unsatisfied demand is and the greater the 30 Herzlinger and Krasker (1987) find no differences in structural measures; Keeler et al. (1992) finds no differences in excess mortality and explicit process; Shortell and Hughes (1988) finds no differences in mortality; Sloan et al. (1998, 2000b) and Sloan and Taylor (1999) finds no differences in survival as well as functional and cognitive status; Geweke et al. (2001) found no difference in mortality from pneumonia among elderly population in south California. 31 These webpages often include pictures of surgeons, babies and joyful patients coupled with words such as “state-of-the-art equipment”, “dedicated physicians”, “professionalism”, “commitment to high quality”, “teamwork”, “experience”, “integrity”, “consumer satisfaction” and so on.

25
heterogeneity in demand is, the larger the non-government sector would be. This
emerging private sector will provide collective-consumption goods through the nonprofit
sector and private goods through the for-profit sector. Finally, Weisbrod (1988) suggests
that some nonprofit are in fact “For-Profits in Disguise”. Like wolves in sheep’s
clothing, such firms enjoy the preferential treatment granted to nonprofits, yet ignore all
community responsibilities. These profit-seeking entities choose to organize as nonprofit
firms and for this reason, their objectives cannot be inferred from their choice of
ownership status. Note that under this conceptualization, both differential objectives and
incomplete information combine to explain the noteworthy number of ownership
switches from nonprofit to for-profit status and vice-versa.
In my view, the role that incomplete information has in crafting and preserving the
nonprofit form is overstated. Asymmetric information, favoring suppliers is not a
distinctive feature of the hospital industry while the dominance of private nonprofit
hospitals is a rather unique phenomenon. Moreover, models that emphasize “objective”
over “choice” tend to provide little insight for understanding the driving forces behind the
growing similarity in managerial and medical practices. In the next section I develop a
model in which firms have identical objectives but might differ in their ability to benefit
from a given ownership form. In contrast to the existing literature, this approach relies on
neither different ownership type-specific objectives nor incomplete information to
generate an equilibrium in which both ownership types are chosen by a strictly positive
fraction of hospitals. As a result, my theoretical approach belongs at the upper left-hand
side panel and fills a conceptual void in this particular taxonomy.
4. Theoretical Analysis The theoretical model in this section is intended to explore potential reasons for the large
difference in size between nonprofit and for-profit hospitals, by emphasizing the role that
a choice of regulatory status has on the choice of capacity. In addition, the model aims to
elucidate candidate explanations for the subsequent convergence in hospitals’ size, by
focusing on the role of demographic trends, subsidies, local pressure and government
behavior.

26
In this model, all hospitals are assumed to produce a homogeneous service. Patients and
physicians do not favor one ownership type over the other; hence, service prices and
wages are equal across ownership types.32 Formally, I use a reduced form analysis, in
which all decisions; in both for-profit and nonprofit firms are made in accord with the
wishes of the person or group in control of the organization, which I shall refer to as the
owner.33 The owner has access to a common production technology and maximizes utility
from monetary and non-monetary gains by choosing an ownership type (nonprofit status
or for-profit status). Switching from one ownership type to another is assumed to be
costless. In addition, if the owner chooses a nonprofit status, she will benefit from cost
advantages and will be subject to a non-distribution constraint.
Cost advantages: nonprofit hospitals benefit from tax-exemptions, government grants and
access to tax-exempt capital financing.34 Hansmann (1987) finds that “tax exemption
offers nonprofit firms a significant advantage in establishing market share vis-à-vis for-
profit firms offering similar services.” Debt has always been the most important source of
capital for private hospitals (Institute of Medicine, 1986). Federal and state laws permit
private nonprofit hospitals to issue tax-exempt bonds through local and state
governments. This allows these hospitals to borrow money at substantially lower rates
than offered by lending institutions, because bondholders need not pay taxes on the bond
interest income.35 Formally, I model all the economic advantages of nonprofit firms
trough access to lower capital prices.
32 Sloan and Steinwald (1980) find no difference in wage rates paid by hospitals of different ownership type, holding other factors constant. 33 The use of a single “owner” is similar to the representative member of the physician staff in Pauly and Redisch (1973), the “manager” in Eckel and Steinberg (1993), the unified concept of investor/donor in Lakdawalla and Philipson (1998), the entrepreneur in Glaeser and Shleifer (1998), or the owner/patron in Malani, Philipson and David (2003). 34 Arrow (1963) argues that “Departure from the profit motive is strikingly manifested by the overwhelming predominance of nonprofit over proprietary hospitals ….. The simplest explanation is that public and private subsidies decrease the cost to the patient in nonprofit hospitals.” 35 Wu (1992) discusses the common perception that nonprofit firms have significant cost advantages over for-profit firms due to their ability to raise capital through the sale of tax-exempt bonds.
27
Non-distribution constraint: cash income for nonprofit firms is constrained to be zero.
The owner can, however, draw non-cash income in the form of perquisites such as a
luxurious office and a company car. In other words, nonprofit firms can modify the form
in which they pay out profits, by converting monetary income into perks, or “dividends-
in-kind” (Pauly, 1987). Eckel and Steinberg (1993) point out that although the alleged
purpose of the non-distribution constraint is to prevent excessive perks, it is difficult to
enforce proscriptions against excessive non-cash benefits paid to managers. Ortmann and
Schlesinger (2002) claim that there is little in the nonprofit regulatory status to reduce the
treat of fraud.36 A key assumption made in this analysis is that the utility from cash is at
least as high as the utility from perks.37 Define π as profit and δ as a parameter, bounded
between zero and one. δπ represents the income that would provide the same level of
utility as π dollars spent on perks. The owner of a for-profit firm derives utility from the
firm’s profits, UFP = πFP. On the other hand, the utility for the nonprofit firm can be
written as UNFP = δπNFP,
Firms can take on one of three ownership types; private for-profit, private nonprofit or
public/government. There are G government firms and N private firms, out of which n are
for-profit firms and the remaining N-n, are nonprofit firms. All N+G firms in the
economy are assumed to compete in quantities (Cournot competition). However, I treat
the number of government firms and their quantity choices as given.
Localized competition with relatively high barriers to entry, due to regulation, licensing
and high setup costs is usually studied using models of imperfect competition, such as the
Cournot model.38 Moreover, Health insurance, third-party payment (Wu, 1992) and
physicians’ induced demand (Roemer, 1961; Fuchs, 1978) may lower patients’ sensitivity 36 The authors suggests that resources meant for a particular purpose might be misappropriate towards other purposes, typically self-serving ones. 37 Here I assume that all perks can be purchased with cash. Note that once the firm has access to lower prices for certain goods or services than the individual employee has (e.g. the firm can often bargain for better insurance premium rates) we might have higher utility from perks relative to cash. Nevertheless, for-profit firms can modify the form in which they pay out all or some of their profits. This allows for-profits to mimic the behavior of nonprofit firms whenever perks are superior to cash. 38 Gaynor and Haas-Wilson (1999) argue that nonprofit hospitals will exercise market power if they can. Simpson and Shin (1998) argue that nonprofit hospitals may still exercise market power even if their primary objective is not to maximize managers’ profit.

28
to price. For example, Dranove and White (1999) argue that patients’ decisions about
which hospital to use were based on convenience of access rather than price.39 Likewise,
there is no conclusive empirical evidence indicating that nonprofit providers enjoy a price
premium, that is, despite the attention that has been devoted to competition in quality in
the literature (Philipson, 2000).40
The symmetric properties of the Cournot model will entail that all firms with common
ownership type choose the same output level. Define total industry output, Y, as;
(4.1) GNFPFP
n
i
N
njGNFPjFPi GyynNnyGyyyY +−+=++≡ ∑ ∑
= +=
)(1 1
,,
Where, ky is the individual firm’s production level, ],,[ GNFPFPk ∈ .41 The inverse
demand function is assumed to be linear and take the form YYp βα −=)( , where α and β
are demand shifters and p is output price. A private firm Ni ∈ of ownership type k will
maximize its profits by choosing kiy , .42
),,()( ,,,
kikkiyyrwcyYpMax
ki
−
Denote the marginal cost for ownership type k as, '),,(k
k
kk Cy
yrwc≡
∂∂
In the optimum two sets of first-order conditions are satisfied. As marginal cost varies by
ownership type, we have n first-order conditions of the type: ', 0i FP FPY y Cα β β− − − =
and, (N–n) first-order conditions of the type: ', 0i NFP NFPY y Cα β β− − − = . Summing the
first-order conditions over all N private firms, imposing symmetry within ownership type
and using the industry output definition in (4.1) we can rewrite the industry output as;43
39 “insured patients had little incentive to shop around for the best prices, enabling providers to set prices in excess of marginal costs.” (Dranove and White, 1999) 40 Young and Desai (1999) examined 43 hospitals in Texas, Florida and California that switched from nonprofit to for-profit type between 1981 and 1995. They find virtually no effect on prices, uncompensated care or unprofitable services. 41 FP = For-Profit, NFP = Nonprofit and G = Government. 42 Note that both for-profit and nonprofit share a common objective function, as long as the utility function monotonically increases with profits. 43 This is assuming an interior solution, that is, the difference in marginal costs across ownership types supports participation in production of all N firms.

29
(4.2) )1(
)()( '''
++−−−
=N
GyCCnCNY GNFPFPNFP
ββα
Plugging (4.2) back into the first order conditions we get the output choice of for-profit
and nonprofit firms.
(4.3) )1(
))(()( '''
+−−−−−
=N
GyCCnNCy GNFPFPFP
FP ββα
(4.4) )1(
)()( '''
+−−+−
=N
GyCCnCy GNFPFPNFP
NFP ββα
In what follows I will assume, for simplicity, that the production function for the
individual firm exhibits constant returns to scale.44 Nonprofit firms are assumed to have
access to lower capital prices, NFPFP rr > .45 With constant returns to scale the difference in
marginal costs across ownership-types, )( ''NFPFP CC − will be positive for any level of
output and its magnitude will depend on both the difference in capital prices and the form
of the production function (e.g. the capital intensity).46
Since the output choice of for-profit firms is negatively related to the number of nonprofit
firms while the output choice of nonprofit firms is positively related to the number of for-
profit firms, conversion from nonprofit status to for-profit status will lead to higher
output levels for both types. However, from (4.2) we see that the total industry output is
negatively related to the share of for-profit firms.47
44 The model’s predictions hold for increasing marginal costs under additional conditions regarding the share of for-profit firms and the ownership type-related supply elasticity (See appendix 4.A). 45 This is also true for property tax exemptions. The lower capital price will affect efficiency by encouraging a shift in the input mix of nonprofit firms towards capital. 46 For example, with Cobb-Douglas production function, aa LKy −= 1 , where K and L are the levels of capital and labor inputs. )(1'' a
NFPa
FPa
NFPFP rrAwCC −=− − , where A is a constant, w is the wage rate and rk is the capital price for ownership type k. The cost advantage of choosing a nonprofit status increases in a. 47 Although both all firms increase their scale (individual-firm effect) the mix of nonprofit and for-profit firms is changed (composition effect). Industry output falls with switching from nonprofit to for-profit status as the composition effects dominate the individual-firm effect.

30
Lemma 1: Regardless of the number of private firms in the economy, N, the production
level in the government sector, GyG, or the presence of a non-distribution constraint, a
nonprofit firm will produce more than a for-profit firm when tax exemptions/subsidies
are non-zero.48
The rationale is fairly simple; the nonprofit firm enjoys a competitive advantage in that it
has lower production costs. It exploits this cost advantage by increasing production. As
quantities are strategic substitutes, the choice of output by nonprofit firms in turn induces
a reduction in output by for-profit firms.49 Subsidies and tax-exemptions for nonprofit
firms increase their minimum efficient scale, and affect their choice of inputs mix. Since
utility maximization corresponds to profit maximization, the non-distribution constraint
does not play a role in the choice of capacity.50
Figure 2.1 in section 2 documents the convergence in size between nonprofit and for-
profit hospitals by featuring the behavior over time of the nonprofit-to-for-profit size
ratio. In this model, all firms with identical ownership-type choose the same level of
output/capacity, so this ratio is simply;
FP
NFP
yy
Ry ≡
In order to study the determinants of the convergence process, a definition of market
equilibrium is needed. Changes to relative size affect the relative profitability and hence
alter the incentives for choosing ownership type. Equations (4.5) and (4.6) below
describe the profits of for-profit and nonprofit firms respectively.
(4.5) 2' ' '
2( ) ( )( )1 12 ( 1) 2
FP FP NFP GFP FP
C N n C C Gy yN
α βπβ
− − − − −= = +
48 For proof see Appendix 4.B. 49 Another way to obtain the same result is by rearranging the first order condition, such that
kk C
sYp =
+
ε1)( where sk is the share of industry output produced by firm of ownership type k and ε is the
demand elasticity. The nonprofit firms having lower marginal costs are expected to have higher share of industry output. 50 In some models the non-distribution constraint is assumed to induce nonprofit firms to channel their surplus into additional output.
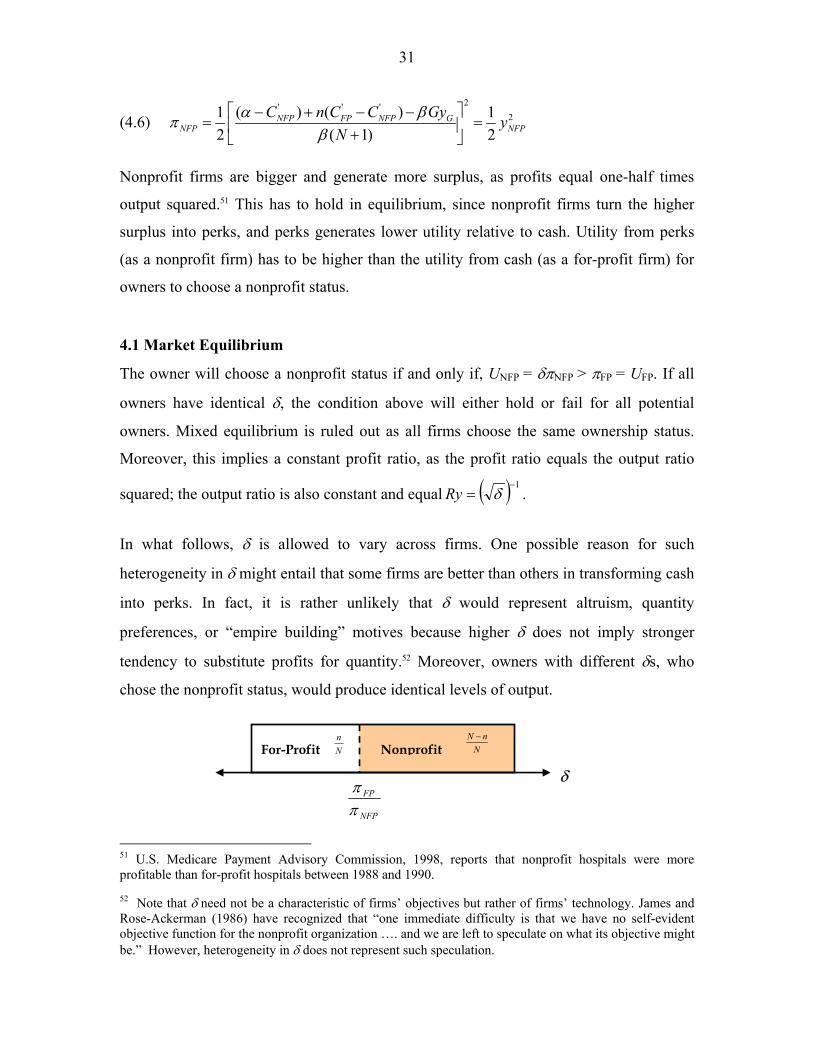
31
(4.6) 2' ' '
2( ) ( )1 12 ( 1) 2
NFP FP NFP GNFP NFP
C n C C Gy yN
α βπβ
− + − −= = +
Nonprofit firms are bigger and generate more surplus, as profits equal one-half times
output squared.51 This has to hold in equilibrium, since nonprofit firms turn the higher
surplus into perks, and perks generates lower utility relative to cash. Utility from perks
(as a nonprofit firm) has to be higher than the utility from cash (as a for-profit firm) for
owners to choose a nonprofit status.
4.1 Market Equilibrium
The owner will choose a nonprofit status if and only if, UNFP = δπNFP > πFP = UFP. If all
owners have identical δ, the condition above will either hold or fail for all potential
owners. Mixed equilibrium is ruled out as all firms choose the same ownership status.
Moreover, this implies a constant profit ratio, as the profit ratio equals the output ratio
squared; the output ratio is also constant and equal ( ) 1−= δRy .
In what follows, δ is allowed to vary across firms. One possible reason for such
heterogeneity in δ might entail that some firms are better than others in transforming cash
into perks. In fact, it is rather unlikely that δ would represent altruism, quantity
preferences, or “empire building” motives because higher δ does not imply stronger
tendency to substitute profits for quantity.52 Moreover, owners with different δs, who
chose the nonprofit status, would produce identical levels of output.
51 U.S. Medicare Payment Advisory Commission, 1998, reports that nonprofit hospitals were more profitable than for-profit hospitals between 1988 and 1990. 52 Note that δ need not be a characteristic of firms’ objectives but rather of firms’ technology. James and Rose-Ackerman (1986) have recognized that “one immediate difficulty is that we have no self-evident objective function for the nonprofit organization …. and we are left to speculate on what its objective might be.” However, heterogeneity in δ does not represent such speculation.
For-Profit Nonprofit
NFP
FP
ππ
NnN −
Nn
δ

32
Assuming δ is distributed uniformly between 0 and 1, the share of for-profit firms will be
given by:
(4.7) ( ) ( )Pr( ) ( )( ) ( )
FP FP
NFP NFP
n nn Rp nN n n
π πδπ π
= ≤ = =
The for-profit-to-nonprofit profit ratio, Rp(n), has to equal to the for-profit share, n/N,
(out of all private hospitals). n/N is compact and convex, and Rp: n/N n/N a continuous
function. Therefore Rp has a fixed point. The fixed point, E1 in Figure 4.1 represents the
mixed ownership equilibrium, as it lies both on the 45o degree line (the cumulative
distribution function of a uniform (0, 1)) and on the for-profit-to-nonprofit profit ratio
function.
NFP
FP
ππ
45o
1
1
E1Rp(n) Rp(N)
Rp(0)
Figure 4.1
Nn
Also note that since 2 3
2 3
( ) ( ) ( )0, 0, 0Rp n Rp n Rp nn n n
∂ ∂ ∂> < =
∂ ∂ ∂and 0 (0) ( ) 1Rp Rp N< < <
E1 is a unique equilibrium.

33
4.2 Comparative-Static Analysis
The purpose of this section is to compare different equilibrium states that are associated
with different values of exogenous variables. More specifically, in this section I study
how conversion from nonprofit to for-profit status, demographic changes, changes in
government subsidies and crowding out of government beds affect the convergence
process. In order to study the convergence process, denote demand and supply shifters by
s. The ratio of average sizes corresponds to the share of for-profit hospital in the
following way:
(4.8) 1
( ) ( , )NFP
FP
y nRy n s ny N
−
= =
A shock that increases the profit-ratio, Rp(n) decreases the size-ratio, Ry(n) and would
lead to a disequilibrium, as the incentive to become a for-profit firm increases. As a
result, the share of for-profit firms, which is determined endogenously, increases until a
new equilibrium level is attained.
FP
NFP
yy
1
1
Figure 4.2
E1
F1 E2 Ry(s1,n)
Ry(s2,n)
Ry(s3,n)
R
R
Nn
To illustrate this, we begin at point E1 in Figure 4.2, The initial shock is represented by a
downward shift in Ry to point F1, followed by a shift along the new Ry(s2,n) function
from F1 to E2, the new equilibrium level.

34
Since this is a comparative-static analysis, there is no additional insight with regard to the
process of adjustment, as this is merely a comparison of two equilibrium states. The
thicker line RR connects the different equilibrium points. In addition, the Ry(s,n) curves
become flatter as they shift downwards.
Net conversion from nonprofit to for-profit type plays an important role in clearing the
ownership-market. The direction of the effect of switches form nonprofit to for-profit
status on the growing similarity between the two types of firms is fully captured by the
sign of the partial derivative of Ry with respect to the number of for-profit firms, n.53
Lemma 2: Regardless of the number of private firms in the economy, N, the production
level in the government sector, GyG, and the presence of a non-distribution constraint,
conversion from nonprofit to for-profit status leads to convergence in size, when tax
exemptions / subsidies are non-zero.54
Following lemma 1, where I asserted that Ry>1, lemma 2 claims that ownership switches
is one possible driving force behind the convergence in size. Furthermore, the second
derivative of Ry with respect to n is positive, indicating that the convergence process
slows as the share of for-profit firms increases.
Note that even if the share of for-profit firms approaches 1, conversion cannot lead to full
convergence, as 1)(
))(1(1lim '
''
>−−−+
+=→
GFP
NFPFP
Nn GyCCCN
Ryβα
.
In this formulation there are two potential demand shifters, α and β, the intercept and
slope of the linear inverse demand function respectively.55 When α increases, demand
shifts out and in turn induces higher levels of production in both for-profit and nonprofit
firms. All firms have equal absolute change in capacity, yet for-profit firms will
experience a higher percentage change, due to their relatively smaller scale. 53 The partial derivative of Ry with respect to the number of for-profit firms, n, holds, by definition, the number of private firms, N, constant. Therefore it represents switching of ownership type from nonprofit to for-profit on the margin. 54 For proof see Appendix 4.C. 55 If we think of a representative consumer, i with a demand function iy pα= − , and a resulting aggregate inverse demand function, p Yα β= − , α can represent the maximum willingness to pay of a typical individual and β would be one over total population.

35
In addition, when β decreases demand pivots upwards. If government hospitals are absent
from the market (i.e. GyG=0) the effect of a change in β induces a proportional change in
scale across ownership types and the size-ratio, Ry is unaffected. However, when
government hospitals are present in the market, and are less sensitive to shocks relative to
their private counterparts, a decrease in β does lead to convergence in capacity.56
Moreover, a negative supply shock represented by a decrease in the total number of
public beds, GyG, will have similar effects on convergence as an increase in α. It will lead
to equal absolute increase in the number of beds for both types and will result in
convergence (Ry would shift down, as in Figure 4.2).57 A negative supply shock to the
government providers would have similar properties as a positive demand shock.
0)(
,0,0,0,0 '' >−∂
∂>
∂∂
>∂∂
>∂∂
<∂∂
NFPFPG CCRy
NRy
GyRyRyRy
βα
Likewise, when the number of private firms, N, increases the profit-ratio, Rp, shifts
downwards, subsequently, the share of for-profit firms falls and the size-ratio expands. In
other words, exit stimulates the growing similarity in size. Markets with fewer hospitals
would tend to have a lower share of nonprofit hospitals. In such markets, differences in
capacity across ownership types are minimal. This result coincides with Lakdawalla and
Philipson’s (1999) model, in which “the share of nonprofit firms rises with the number of
firms in the industry.” In both formulations, entry reduces the relative attractiveness of
the for-profit status.
Finally, when cost advantages of nonprofit firms decrease, due to lower availability of
government funds and subsidies, for-profit firms and non-profit firms experience
converge in size. However, for this particular shifter, the effects on the scale of for-profit
firms will be positive whereas the effect on the scale of nonprofit firms would be
negative. Going back to table 2.1, it might be the case that different shifters played
different roles before and after the introduction of the Prospective Payment System.
56 For empirical discussion of this feature see Section 5.2.2 and Appendix 5.D. 57 It is worth noting that the effect on Ry comes from public beds per capita, βGyG, pointing out that it is the relevant component for the econometric evaluation of this model.

36
The model presented in this section stresses the cost advantages of nonprofit firms, and
the constraints these firms face in term of paying out profits, as the key trade-off
determining the mixed-ownership equilibrium. This simple model appears to be flexible
enough to account for the static differences between for-profits and nonprofits, as well as
the dynamics of the convergence in capacity. The model allows different potential
shifters to shape the convergence trend, in ways that correspond to both the period prior
to the introduction of the PPS and successive periods. In what follows, I turn to a
discussion of yet another potential driving force behind the growing similarity in capacity
- the pressure on nonprofit hospitals to provide community benefits. This pressure will be
excessive when industry-wide effects due to ownership composition are ignored.
4.3 Modeling quid-pro-quo pressure on nonprofit hospitals
Originally, tax exemptions for nonprofit hospitals were justified by a “bargain” that was
“struck between the hospital and the community: a hospital would treat patients who
were unable to pay, and the government would grant a tax exemption to the hospital”
(Pellegrini, 1989). The exemption for charitable organizations is a derivative of the
concept that they perform functions, which, in the organizations' absence, government
would have to perform; therefore, government is willing to forego the otherwise tax
revenues in return for the public services rendered. However, faced with a growing trend
of organizational similarity scholars have asked whether nonprofit ownership matters for
a community’s interests and whether that justifies preferential treatment by policy
makers.58, 59 Likewise, the Federal Trade Commission and the Department of Justice have
challenged, since the early eighties, a large number of nonprofit and for-profit hospitals
mergers, treating the nonprofit status as having similar propensity to exercise market
power (Vaughn, 1999).60 Furthermore, a perception that nonprofit hospitals have replaced
58 See, Gray (1997), Keeler et al. (1999), Nicholson et al. (2000), Reinhardt (2000), Wilkicki (2001) and Young et al. (2000). 59 A hospital losing its tax exempt status would be subject to corporate income tax; its contributions would be nondeductible for the donor; the basis of the hospital’s assets would be reduced for depreciation that would have been claimed had the hospital been a taxable corporation; and the hospital would lose access to new tax-exempt financing. Currently, the only sanction available to the IRS is complete revocation of a hospital’s tax-exempt status – a drastic step the IRS seldom takes. (Kuchler, 1992) 60 “Confidence in the benevolence of nonprofits is likely to backfire, leaving communities across the country with a large profitable hospital that acts contrary to the best interest of consumers” (Vaughn, 1999)
37
their community service orientation with a commercial one has fueled the debate over the
tax-exempt status that these hospitals enjoy.61 In particular, local, state, and federal
governments eager to increase tax revenues and lobby groups representing the investor-
owned healthcare industry have put pressure on nonprofit hospitals to justify their tax
exemptions (Gray, 1992).62, 63
The nature of local competition is crucial, in my view, for assessing the true contribution
of nonprofit hospitals to their communities.64 David and Helmchen (2003) claim that the
focus on the individual hospital is misleading and, in some cases, may lead policymakers
to support interventions that may decrease welfare. The view taken in this paper is of
mixed-ownership equilibrium where low cost (nonprofit) hospitals coexist with high cost
(for-profit) hospitals. Conversion from nonprofit to for-profit status (replacing a low cost
hospital by a high cost one) leads to lower consumer surplus, viewed here as the primary
component of community benefits. By requiring nonprofit hospitals to appropriate a
fraction of their surplus towards activities labeled as community benefits local
governments implicitly impose a tax on these hospitals.65
Now assume that communities and local governments can tie tax-exemptions to measures
of community benefits (e.g. charity care, losses from serving public program enrollees,
losses from subsidizing necessary community services, net cost of research and
education, and the like) by creating, what I call, quid-pro-quo pressure (QPQP) on
61 According to Eckels and Trocchio (1992), a growing number of community members, legislators, and policymakers are questioning whether hospitals are driven more by financial concerns and competitive forces than by a mission to respond to community needs. 62 According to Kuchler (1992), State and local governments, often prompted by revenue shortfalls, have repeatedly raised challenges to hospitals’ exemption from property and other taxes. This, no doubt, creates pressure on nonprofit firms to allocate part of their surplus to these activities, labeled as community benefits, in order to maintain their tax status. 63 In 1988, Judge Robert Young required St. Luke’s hospital and all other Lehigh County (Pennsylvania) hospitals to provide uncompensated care equal to at least 75 percent of their preceding year’s profits. Later on St. Luke’s property tax-exempt status was revoked, suggesting that payments in lieu of taxes were passed on to patients. 64 The revocation of a tax exemption will not only alters the tax payments and provision of community benefits by the hospital under study, but may also prompt its competitors to modify their own behavior. 65 Kuchler (1992) argues that such requirements increases the attractiveness of the for-profit status and in turn leads to more such conversions.
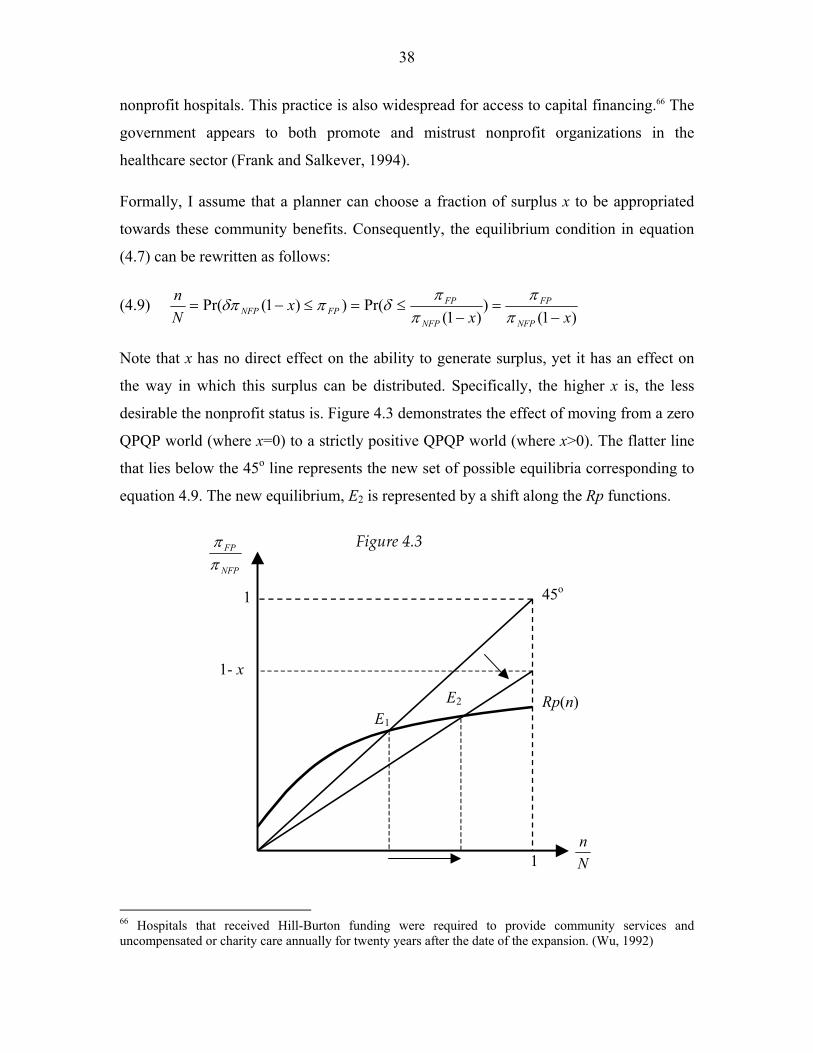
38
nonprofit hospitals. This practice is also widespread for access to capital financing.66 The
government appears to both promote and mistrust nonprofit organizations in the
healthcare sector (Frank and Salkever, 1994).
Formally, I assume that a planner can choose a fraction of surplus x to be appropriated
towards these community benefits. Consequently, the equilibrium condition in equation
(4.7) can be rewritten as follows:
(4.9) )1(
))1(
Pr())1(Pr(xx
xNn
NFP
FP
NFP
FPFPNFP −
=−
≤=≤−=π
ππ
πδπδπ
Note that x has no direct effect on the ability to generate surplus, yet it has an effect on
the way in which this surplus can be distributed. Specifically, the higher x is, the less
desirable the nonprofit status is. Figure 4.3 demonstrates the effect of moving from a zero
QPQP world (where x=0) to a strictly positive QPQP world (where x>0). The flatter line
that lies below the 45o line represents the new set of possible equilibria corresponding to
equation 4.9. The new equilibrium, E2 is represented by a shift along the Rp functions.
Figure 4.3
NFP
FP
ππ
1
1- x
1 45o
Rp(n) E1
E2
Nn
66 Hospitals that received Hill-Burton funding were required to provide community services and uncompensated or charity care annually for twenty years after the date of the expansion. (Wu, 1992)

39
The bigger the QPQP is the larger the number of nonprofit firms that switch their status
to a for-profit one. Policy makers are said to adopt a don’t throw out the baby with the
bath water approach, that is, push nonprofits to provide the maximum amount of
community benefit while maintaining the incentives to preserve their nonprofit status.
What is the optimal amount of pressure that should be exerted on nonprofit providers? To
answer this question, we need a measure of welfare. Such a measure would include three
elements; net community benefits, consumer surplus and producer surplus.
The first element to be maximized is the sum of community benefits produced by all
nonprofit firms, ( ( )) NFPN n x xπ− , minus forgo tax revenues and government spending on
subsidies, ( ( )) NFPN n x sub y− ⋅ ⋅ .67 I have labeled this element as, net community benefit
(NCB):68
(4.10) ( , ( )) ( ( ))( )NFP NFPNCB x n x N n x x sub yπ= − ⋅ − ⋅ .
The second element is the consumer surplus, ( ( ))CS n x which is decreasing in the share of
for-profit firms. For-profit firms are the ‘high cost’ firms and as their share in production
increases, industry output decreases and price increases, all leading to a loss in consumer
surplus.69
(4.11) 2' ' '( ) ( )1( ( ))
2 ( 1)NFP FP NFP GN C n C C GyCS n x
Nα β
β − − − +
= +
The third element is the producer surplus, ( , ( ))PS x n x which is the total utility of all
private firms: NFPFP UnNUnPS ⋅−+⋅= )( . The aggregate utility of for-profit firms
equals to the number of for-profit firms, )(xn , multiplied by the firm’s profit, ))(( xnFPπ .
The aggregate utility of nonprofit firms is a product of four components; the number of
nonprofit firms, ( ( ))N n x− ; the percentage of surplus, which remains in the firm after the
67 The term sub in (4.10) refers to the social cost per unit of production, which includes: subsidies, government grants and forgo tax revenue. 68 I assume that those net community benefits are measured correctly. Nevertheless, welfare loss may occur from simply basing such pressure on faulty measurements. See David and Helmchen (2003) for a discussion of such measurement problems. 69 Note that nonprofit firms are low cost firm due to government subsidies. These subsidies represent a cost to society. However, the net community benefits component already includes these welfare costs.

40
QPQP appropriation, (1 )x− ; the surplus generated by each firm, ( ( ))NFP n xπ and the
average nonprofit δ. In equilibrium, nonprofit hospitals will have a δ between n/N and 1,
with an average δ of NxnN 2/))(( + . Hence, the producer surplus is given by:
(4.12) ))((2
)1)()(())(()())(,(22
xnN
xxnNxnxnxnxPS NFPFP ππ ⋅−−
+⋅=
Pressure (an increase in x) lowers the nonprofit hospitals’ utility and induces switches
from nonprofit to for-profit status. In turn, these switches increase the surplus of both
nonprofit and for-profit hospitals. The effect of an increase in x on the collective utility of
firms/owners is ambiguous.70
A social planner would therefore maximize the sum of (4.10), (4.11) and (4.12):
(4.13) { }( , ( )) ( ( )) ( , ( ))x
MaxW NCB x n x CS n x PS x n x≡ + +
Existing welfare analysis is focused on the development of a measurement of community
benefits. In what follows, I will focus on the consequences of omitting the consumer
surplus component, which has unambiguous effect on welfare, and leave out the producer
surplus.
x x
CSCS
W
W
NCB NCB
1 1x0 x0 x1
$ $
x1 is the optimal level of QPQP, x0 represents over-pressure.
x=0 is the optimal level of QPQP, x0 represents over-pressure.
Figure 4.4
70 For full discussion on the effects of quid-pro-quo pressure on producer surplus see appendix 4.D.

41
More specifically, I claim that by omitting the potential influence that nonprofit firms
have on industry output and prices, local authorities focused, for example, primarily on
charity care, would put too much pressure on nonprofit hospitals (see LHS panel of
Figure 4.4). When x equals zero and the share of nonprofit firms is non-zero, the net
community benefits are negative, however, that does not necessarily mean that welfare is
negative. The consumer surplus is at its peak when x=0, as the mixed-equilibrium share
of nonprofit firms is in its upper limit. The increase in consumer surplus might offset the
cost to society of granting subsidies and tax-exemptions. Moreover, under certain
conditions, x=0 might be the optimal policy (see RHS panel of Figure 4.4).71
5. Empirical Analysis The object of this section is to test the model presented in the previous section. To
accomplish this I divide the section in two: In the first part I test the extent to which
measures of the model’s parameters explain the convergence in capacity. I do this by
exploiting variation across geographical areas. In the second part I use hospital-level data
to test the model’s equilibrium prediction by highlighting systematic differences between
states with high and low shares of for-profit hospitals.
5.1 Analysis of the Convergence Trend
In this subsection I test to what extent measures of the model’s parameters explain the
convergence in capacity. I employ both hospital-level and demographic data; hospital-
level data are collected by the American Hospital Association (AHA). For the purpose of
this analysis, the sample is limited to community hospitals that provide short-term
general care.72 Community hospitals are facilities whose services are available to the
general public. Short-term general hospitals are facilities whose primary function is to
71 This is true when 0CS NCB
x x∂ ∂
+ <∂ ∂
, that is, the effect of a decline in consumer surplus is stronger than the
added value of additional community benefits. 72 Included in this category are all university medical centers, and both teaching and non-teaching hospitals. Excluded are all “specialty” hospitals (e.g. psychiatric hospitals, children’s hospitals, respiratory disease hospital, long-term facilities etc.)

42
provide patient services for a variety of medical conditions. Hospitals are divided into
three categories: nonprofit hospitals, for-profit hospitals and government hospitals.73
I consider two geographical partitions: states and metropolitan statistical areas (MSA).
The Office of Management and Budget defines metropolitan areas for purposes of
collecting, tabulating, and publishing federal data. The general concept of a metropolitan
area is that of a large population nucleus, together with adjacent communities having a
high degree of social and economic integration with that core.74 The concept of
Metropolitan Statistical Area (MSA) has remained essentially the same throughout the
sample years.75
The panel data sets at the state (including Washington, D.C.) and MSA levels cover the
years 1970, 1974, 1978, 1982, 1986, 1990, 1994 and 1998. The four-year interval data
rather than year-to-year data are used to allow potential and actual hospitals time to adjust
their capacity (capital base). Descriptive statistics for the main variables are displayed in
Appendix 5.B. For the state-level analysis, all 408 state-year pairs include public
(government) hospitals and private nonprofit hospitals. Private for-profit hospitals appear
in 82% of state-years (335/408).76 For the remaining (18%) state-years that have no for-
73 Hospitals in the nonprofit category are non-governmental entities that are controlled by nonprofit organizations. These facilities include mostly hospitals operated by or affiliated with religious organizations, community hospitals, cooperative hospitals and hospitals operated by fraternal societies. Hospitals in the for-profit category are non-governmental entities that are administered on a for-profit basis, most of which are organized legally as corporations. Federal agencies, states, counties, cities and other local governments operate hospitals in the government category. 74 Metropolitan areas comprise one or more entire counties, except in New England, where cities and towns are the basic geographic units. Each metropolitan area must contain either a place with a minimum population of 50,000 or a Census Bureau-defined urbanized area and a total metropolitan area population of at least 100,000. A metropolitan area comprises one or more counties. A metropolitan area may also include one or more outlying counties that have close economic and social relationships with the central county. Metropolitan statistical areas (MSAs) are relatively freestanding metropolitan areas and are not closely associated with other metropolitan areas. 75 There are two basic comparability issues: first, most metropolitan areas encompassed less territory during earlier years than they did in later ones, as the census reconsidered and adjusted the boundaries of each metropolitan area to account for growth during each ten-year period. Second, as population grows and people migrate to urban areas, new metropolitan areas regularly emerge, so the number of them has steadily increased since the concept was first invented. 76 The states Connecticut, Delaware, Rhode Island, and Vermont have no for-profit hospitals throughout the sample period. In the states Alaska, Maine, Minnesota, Montana, New Hampshire, New Jersey, New Mexico and Wyoming for-profit hospitals appear in several periods but not in all. In 33 states all three-ownership types appear in all years.

43
profit hospitals, the ratio of average sizes is not defined. For the MSA-level analysis, I
examine 2,344 MSA-years, which nest single, double and triple ownership-type markets.
960 MSA-year pairs (approximately 41%) include both for-profit and nonprofit hospitals.
5.1.1 Empirical Framework
The model developed in the previous section requires the estimation of the following
vector of structural parameters:
(5.1) ),)(,,,()(
'')(
−+++−
−=NnCCGyf
yy
NFPFPGFP
NFP βα
The nonprofit-to-for-profit size-ratio is a function of demand shifters, α and β; the
number of government beds in the market, GyG; the cost advantage of nonprofit firms, ' '( )FP NFPC C− ; and the share of for-profit firms in the market, n/N. I calculate the size ratio
as the average number of beds in nonprofit hospitals divided by the average number of
beds in for-profit hospitals for each geographical area. The for-profit share corresponds to
the share of for-profit facilities out of all private (for-profit and nonprofit) facilities in a
given geographical area. I use income per capita and population size as the two demand
shifters, α and β respectively. Note that an increase in income per capita and population
size are expected to decrease the size ratio and lead to convergence.77 A decrease in the
number of government beds, GyG is expected to decrease the size ratio as well. Finally, I
now turn to the more challenging task of calculating the cost advantage for nonprofit
hospitals.
A direct test of the theory requires data on the cost advantage for nonprofit hospitals.
Unfortunately, such data is difficult to obtain. However, by imposing the model’s
equilibrium condition I have constructed a measure of ' '( )FP NFPC C− for both state and
MSA level data (see equation 5.3 below).
The theoretical literature provides several justifications for higher average costs in
nonprofit hospitals.78 However, empirical cost studies present mixed evidence regarding
77 Note that β equals 1/pop, hence when population increases β falls and we get convergence. 78 In the quantity-quality model (Newhouse, 1970) average costs will be higher for nonprofits since they supply higher quantity and/or quality of care. This argument carries trough for the non-contractible quality

44
cost disparity across hospitals with different ownership types (Malani et. al. 2003).
Moreover, when properly controlling for scale, input prices, taxes, case-mix severity and
teaching status, these studies fail to detect systematic difference in efficiency between
for-profit and nonprofit hospitals (Sloan, 2000a). Becker and Sloan (1985) found that for-
profit hospitals have higher costs per patient day, but lower costs per adjusted
admission.79
QQFP QNFP
P
B
A
C
NFPC
D
Figure 5.1
FPC
FPCNFPC
NFPC
PCNFP =ˆ
NFPC 'FPC '
In the model presented in the previous section, I assume that nonprofit hospitals enjoy
cost advantages over their for-profit counterparts, such that the average cost of producing
healthcare in nonprofits is lower. Nevertheless, the observed costs for nonprofit firms
include both the cost of producing medical services and the cost of producing perks.80
Analogous to the model presented in the previous section, Figure 5.1 illustrates this models (e.g. Glaeser and Shleifer, 1998), as nonprofit firms will exert less cost-cutting effort. The physician cooperative model (Pauly and Redisch, 1973) yields similar predictions, however in this case, it is the choice of input-mix that leads to higher average costs for nonprofit hospitals. 79 One reason for this is the shorter lengths of stay in for-profit hospitals; which raise the cost per day, as the intensity of treatment per day is higher. However, since costs spread out over more admissions the cost per admission might be lower. 80 Williamson (1964) argues that managers use their authority to divert funds away from profit to serve their own self-interests, that is, enhance their own utility. The excess profits are absorbed as discretionary expenditure or income. Williamson suggests that managers consciously drive up the cost of production in an attempt to further their own self-interests.

45
problem.81 The darker rectangle FPPDCC represents the profits for the for-profit firm and
the lighter rectangle NFPPABC represents the nonprofit firm’s true surplus. However,
since the nonprofit firm cannot draw cash, the entire surplus rectangle will appear on the
cost side, much like a fixed cost, where the distance AB measures both the profit margin
and the average “fixed cost” for the nonprofit firm.
In order to measure the cost advantages for nonprofits, I elicit point B by imposing the
equilibrium condition in equation (4.7): πFP = δπNFP where δ = n/N (for the uniform
distribution case), which can be rewritten as:
(5.2) ' '( ) ( )FP FP FP NFP NFP NFPn np C y p C yN N
π π= − = − =
Define, NFPC as the observed average costs for nonprofit hospitals, FPC as the average
costs for for-profit hospitals, and σFP as the for-profit share (n/N). If the production
function exhibits constant return to scale, the cost advantage for nonprofit hospitals is:82
(5.3) )ˆ(
)(
''FPNFP
NFPFP
NFPFPFPNFPFP CC
yyy
CC −
−=−
+444 3444 21
σσ
From equation (5.3) we learn that cost advantages for nonprofit hospitals are consistent
with higher observed average costs. Corresponding to equation (5.1), Equation (5.4)
specifies the reduced form relationship between the size ratio and its determinants:
(5.4) ittititFP
NFP XSyy
εδγµ +++=
lnln
The log of the size ratio for state or MSA i in year t is regressed on the vector ln Sit, which
includes: log income per capita, log population size, log number of beds per capita in
government hospitals and log cost difference, ' '( )FP NFPC C− . Xt is a set of year dummies,
and εit is an independently and identically distributed error term.
81 The graphical illustration uses U-shaped average cost functions, yet in order to obtain equation (5.3) I assume constant return to scale as I did in the model. 82 See appendix 5.A for derivation of equation 5.3.

46
5.1.2 Results
Table 5.1 presents reduced-form estimates of equation 5.4, which attempts to explain the
convergence in size between nonprofit and for-profit hospitals. In columns 1 and 3, the
dependent variable is the log size ratio between nonprofit and for-profit hospitals. In
columns 2 and 4, the dependant variable is the log share of for-profit hospitals.
Table 5.1 - State and MSA Level Analysis –Reduced-Form Convergence Regressions
State-Level Analysis MSA-Level Analysis Dependent Variable ln Size-Ratio
ln FP Share ln Size-Ratio ln FP Share
(1) (2) (3) (4)
Variable ln Income per capita
-0.361 (0.72)
1.158 (2.60)***
-0.235 (1.04)
0.284 (1.44)
ln Population
0.365 (1.54)
0.161 (0.77)
0.266 (2.42)**
0.273 (2.85)***
ln Gov. beds per capita
0.211 (2.12)**
-0.041 (0.47)
0.024 (2.66)**
-0.002 (0.16)
ln Cost dif (+)
0.066 (3.18)***
-0.047 (2.58)***
0.009 (2.33)**
-0.005 (1.28)
ln Cost dif (-)
-0.017 (0.89)
0.014 (0.78)
-0.011 (3.02)***
0.014 (4.39)***
Constant
-7.248 (1.27)
8.876 (1.76)*
-0.335 (0.12)
-7.512 (3.08)***
R2
0.675 0.899 0.815 0.841
Obs. 333 333 960 960
The parameter estimates for the state, MSA and time dummies are not reported. Absolute value of t-statistics in parentheses (* significant at 10%; ** significant at 5%; *** significant at 1%)
All regressions are estimated using ordinary least squares with robust (Huber/White)
estimates of standard errors; regressions (1) and (2) include state-fixed effects,
regressions (3) and (4) include MSA-fixed effects, which allow for levels of the key
variables to systematically differ across states/MSAs.
Note that the cost variable is divided in two; ln Cost Dif (+), the log difference in average
cost for areas, in which nonprofit hospitals have cost advantages over for-profit hospitals,
according to equation 5.3, zero otherwise. ln Cost Dif (-) is the log difference in average
cost for areas, in which for-profit hospitals enjoy cost advantages over nonprofit
hospitals, zero otherwise.
47
The model predicts that an increase in income per capita, crowding out of government
hospitals and a decline in the cost advantage of nonprofit hospitals will all have a
negative effect on the size ratio and a positive effect on the for-profit share. These
predictions are confirmed by all coefficients in table 5.1. Moreover, half of these
coefficients are statistically significant. The regressor that yields contradictory coefficient
estimates is population size, which is expected to have a negative effect on the size
ratio.83 Nevertheless, the model’s prediction that population size will have a positive
effect on the for-profit share is confirmed.
In the model, the share of for-profit hospitals and the size ratio are determined
simultaneously. This simultaneity makes it difficult to isolate the causal effect of changes
in ownership mix on the size ratio. To deal with this difficulty I rely on the concept that
areas might differ in their favoritism towards either non-profit or for-profit healthcare
providers. For example, the share of for-profit institutions in different parts of the US
may be linked to area specific historical factors. Subsequently, the for-profit market share
in other healthcare industries may serve as a plausible instrument for the market share of
for-profit hospitals. (e.g. areas with a higher market share of for-profit hospitals are
expected to also have a larger for-profit nursing home share). The share of for-profit
nursing homes in a given area would be correlated with the share of for-profit hospitals in
that area but presumably uncorrelated with other factors influencing the hospital size-
ratio. If the share of for-profit nursing homes provides an exogenous source of variation
in the share of for-profit hospitals, changes in the size-ratio of hospitals should not be
driven by changes in the share of for-profit nursing homes.
Table 5.2 presents estimates of the size ratio (equation 5.3) using the same data sets and
covariates used in Table 5.1. In columns (1) and (4), OLS coefficients, which do not
control for the endogeneity of for-profit share, are presented. In the other columns the
83 In the model, population growth leads to convergence only in markets where government providers are present. This prediction is confirmed in Appendix 5.D.

48
share of for-profit nursing homes is used as an instrument for the share of for-profit
hospitals.84 Columns (3) and (6) also include random effects.85
Table 5.2 - State and MSA Level Analysis –Structural-Form Convergence Regressions
State-Level Analysis MSA-Level Analysis Dependent Variable: ln Size-Ratio OLS
(1)
IV
(2)
IV
(3)
OLS
(4)
IV
(5)
IV
(6) Variable ln For-Profit Share
-0.206 (6.67)***
-0.254 (4.03)***
-0.253 (2.99)***
-0.257 (5.10)***
-0.521 (4.29)***
-0.581 (2.08)**
ln Income per capita
-0.835 (3.98)***
-0.936 (3.90)***
-0.698 (2.27)**
-0.429 (1.56)
-0.155 (0.50)
-0.506 (1.21)
ln Population
0.141 (4.32)***
0.144 (4.37)***
0.135 (3.11)***
0.134 (2.75)***
0.045 (0.72)
0.006 (0.06)
ln Gov. beds per capita
0.059 (1.28)
0.083 (1.54)
0.113 (1.77)*
0.076 (4.62)***
0.071 (4.05)***
0.033 (1.40)
ln Cost dif (+)
0.092 (4.38)***
0.093 (4.39)***
0.074 (3.60)***
0.028 (4.03)***
0.031 (4.16)***
0.006 (0.81)
ln Cost dif (-)
-0.025 (1.24)
-0.026 (1.30)
-0.020 (0.99)
-0.011 (1.84)*
-0.016 (2.42)**
-0.025 (2.68)***
Constant
7.159 (3.52)***
7.982 (3.56)***
5.449 (1.88)*
3.202 (1.30)
1.307 (0.49)
5.281 (1.37)
Year controls Yes Yes Yes Yes Yes Yes Random Effects No No Yes No No Yes Instrument No Yes Yes No Yes Yes R2 0.4010 0.3962 0.3906 0.3210 0.2626 0.1999
Absolute value of t-statistics in parentheses (* significant at 10%; ** significant at 5%; *** significant at 1%).
When the share of for-profit hospitals is treated as exogenous in columns (1) and (4), the
estimated elasticity of the size ratio with respect to the for-profit share is –0.206 for the
state-level analysis and –0.257 for the MSA-level analysis. In other words, if the share of
for-profit hospitals in the MSA doubles, the size-ratio declines by 25.7%.
84 The share of for-profit nursing homes is computed using the 2002-03 Nursing Home Compare survey, which includes 16,385 nursing homes nationwide. The Center of Medicare & Medicaid Services (CMS) collects and publishes the data. 85 Fixed effects cannot be obtained, as the share of for-profit nursing homes is measured at a point in time and therefore does not vary over time.

49
Instrumenting for the for-profit share has a pronounced effect on the estimated elasticity.
At the MSA level, the estimated elasticity for size ratio is -0.521, which is twice as big as
the elasticity without instrumenting. At the state level, the estimated elasticity for size
ratio is -0.254, 23% bigger then the elasticity without instrumenting (-0.206).86
In the theory presented in the previous section I implicitly assume that private hospitals
are more responsive than government hospitals to market changes and policy
interventions.87 More specifically, in markets where government hospitals are absent,
changes in population proportionally affect the capacity choice of nonprofit and for-profit
hospitals, such that the size-ratio is unaffected. On the other hand, in markets where
government hospitals operate alongside for-profit and nonprofit hospitals, larger
population is associated with smaller size-ratio. Fortunately, the MSA-level data allows
for testing this feature; as it nests both MSA-year pairs that include hospitals of all three
ownership-types and MSA-year pairs that include only for-profit and nonprofit
hospitals.88 To test this effect I add an interaction term between population size and
government beds to the OLS and IV structural regressions for the MSA-level. The
coefficient for the resulting interaction term is negative and significant whereas the
coefficient for population losses its statistical significance.89
All coefficient estimates in table 5.2 have the expected sign accept for population size,
which has a positive and sometime significant coefficient; however, that might result
from omitting the interaction between population and the number of government beds.
The share of for-profit hospitals and the measure of cost advantages for nonprofit
hospitals are generally significant for both the state and the MSA-level regressions.
Income per-capita is significant only at the state level, while government beds per-capita
86 When performing a Durbin-Wu-Hausman endogeneity test at the MSA level the critical value of chi-squared with 1 degree of freedom at the 5 percent level is 3.84. Hence, I reject the null hypothesis and conclude that OLS estimators are inconsistent. The reason for these inconsistent estimates is due to the endogeneity of the for-profit share. However, when the same test is performed at the state level I cannot reject the null hypothesis. 87 Duggan (2000) finds evidence for low responsiveness of government hospitals relative to private ones. 88 Out of the 960 MSA-year pairs that include both for-profit and nonprofit hospitals, 816 (85%) also include government providers, whereas 144 (15%) include only for-profit and nonprofit hospitals. 89 See Appendix 5.D for the explicit test and results.

50
is significant only at the MSA-level. These results highlight the importance of industry
wide effects in explaining the convergence trend.
5.2. Analysis of the Equilibrium Properties
In this subsection I test the model’s equilibrium prediction by highlighting systematic
differences across states with high vs. low share of for-profit hospitals. More precisely,
the model asserts that an increase in the share of for-profit hospitals, holding output and
the number of competitors constant, would increase the nonprofit hospital’s surplus.
Moreover, when holding the distribution of δ across locations constant, high for-profit
share corresponds to higher average δ for those hospitals that choose to maintain their
nonprofit status. In other words, the higher the for-profit market share, the higher the
utility of nonprofit hospitals in equilibrium.90 That is, nonprofit hospitals are better off,
ceteris paribus, when competing against for-profit hospitals rather then other nonprofit
hospitals.
But, how can we measure if a hospital is better off? One approach is to look at their
reported surplus. However, the effect of an increase in the market share of for-profit
competitors has an ambiguous effect on reported surplus. On the one hand, reported
surplus increase with surplus, yet on the other hand hospitals that remain nonprofit are
better on average in turning cash into perks and hence smaller fractions of the true
surplus are reported. Therefore, looking at reported surplus would not serve as a good
candidate for testing the theory.91 Another way would be to directly identify perks,
however this is no doubt a challenging task, as perks may take many shapes and forms.
For example, one can detect potential perks-related expenditure items, such as, extensive
managerial compensation or large travel or meetings expenditures.92 In what follows I
propose a third approach.
90 The utility of the nonprofit hospital is U = δπ, since both δ and π increase with the share of for-profit hospitals so is the nonprofit hospital’s utility. 91 I find it important to control for reported surplus since there is a trade off between the amount of reports surplus and expenditure such as travel or meetings. 92 Similar to Frumkin and Keating (2001), Ballou and Weisbrid (2003), Erus and Weisbrod (2003) and Brickley and Van Horn (2003) I study nonprofits’ CEO compensations.

51
As discussed in the previous subsection, observed expenditures can be thought of as a
combination of two types of expenditure: those relating directly to the provision of
medical services and expenditures, which correspond to the production of perks. Holding
output constant (e.g. the size of the hospital) the larger the perks-related activity, the
smaller is the share of expenditure devoted to the provision of medical services. For
simplicity, I assume that the labor and capital shares are fixed.93 Controlling for the
number of hospitals in the market, the number of beds and reported surplus, the labor
share is expected to be negatively correlated with the size of perks’ production. A testable
hypothesis can be formulated as follows:
Hypothesis: states with relatively high market share of for-profit hospitals would have
relatively low labor-shares (out of total expenditure), due to strong perks-related activity.
To test this hypothesis I use information on exempt organizations from the Internal
Revenue Service's Business Master File (BMF) collected from hospitals’ Form 990.94
And matching the IRS file with data from the American Hospital Association (AHA)
Guide for 2002-2003. This data set includes hospital-level cross-section from seven
states. Three states have high share of for-profit hospitals: Florida (52%), Louisiana
(58%) and Nevada (56%) whereas the remaining four states have low shares of for-profit
hospitals: Connecticut (0%), Illinois (9%), Massachusetts (7%) and Michigan (1%). This
data has an advantage over the one used in the previous subsection as it includes detailed
expenditure data, which contains managers’ compensation.95
Figure 5.2 presents a scatter plot of the labor share and the ruling year (The year that the
IRS granted an organization 501(c)(3) status) for 325 nonprofit hospitals. In both these
dimensions I find systematic differences across states with high vs. low for-profit market
93 There may be reasons to suspect that nonprofit hospitals, which operate in areas with high share of for-profit hospitals, would have different capital intensity relative to nonprofit hospitals, which operate in areas with low share of for-profit hospitals. 94 Form 990, entitled “Return of Organization Exempt from Income Tax,” is a report that must be filed each year with the IRS by organizations exempt from Federal income taxes under section 501 of the Internal Revenue Code, and whose annual receipts are normally more than $25,000 a year. 95 In some cases there is a discrepancy between the reporting unit in Form 990 and the one in the AHA survey, I use only those units that appear in both data sources. For Summary statistics see Appendix 5.B.

52
share. The dark circles represent 260 hospitals in states with high for-profit market share
while the light circles represent 65 hospitals in states with low for-profit market share.
Note that 15% of all hospitals entered or converted to nonprofit status in 1946, the year in
which the Hill Burton Act was introduced.96 Finally, the overall labor share levels are
lower in states with high for-profit shares. The mean labor share in states with high for-
profit share is 0.403 while the mean labor share in states with low for-profit share is
0.46.97
0.25
0.3
0.35
0.4
0.45
0.5
0.55
0.6
0.65
1914 1922 1930 1938 1946 1954 1962 1970 1978 1986 1994 2002
Ruling Year
Lab
or S
hare
Low Share of For-Profit Hospitals High Share of For-Profit Hospitals
To test the hypothesis I run the following regression:
(5.5) iiii XDY εγβα +++= lnln
96 In states with low for-profit share 28.8% of hospitals existed before 1946, while only 7.7% of hospitals existed before 1946 in states with high market share of for-profit hospitals. However, since this is a 2001-2002 data, these numbers might reflect different history or different duration (e.g. different exit or switching rates). 97 The null hypothesis that the difference between the two means is zero is rejected at the 1% confidence level.
Figure 5.2: Scatter plot of labor-share and ruling-year for states with high and low for-profit hospitals’ market share.

53
Where, ln Yi is either log labor-share, log CEO’s compensation, log travel expenditure or
log meeting expenditure in hospital i. Di is a dummy variable (0 if hospital i operates in a
state with low for-profit market share and 1 if hospital i operates in a state with high for-
profit market share), ln Xi is a vector of hospital-level characteristics which include:
ruling year, log number of beds, Herfindahl-Hirschman index, log Medicare case mix
index, teaching hospital dummies (major, minor and non-teaching), religious affiliation
dummy, log average length of stay and log reported surplus.98 εi is an independently and
identically distributed error term.
Table 5.3 – The impact of for-profit share on hospitals’ labor share, travel expenditures, meeting expenditures and CEO compensation.
Dependent Variable:
ln Labor Share
ln CEO compensation
OLS (1)
WLS (2)
OLS (3)
WLS (4)
High vs. Low For-Profit Share State Dummy
-0.125 (5.04)***
-0.128 (5.70)***
-0.316 (1.26)
-0.135 (0.92)
R2
0.185
0.204
0.258
0.324 Obs.
325 325 236 236 Dependent Variable:
ln Travel Expenditure
ln Meeting Expenditure
OLS (5)
WLS (6)
OLS (7)
WLS (8)
High vs. Low For-Profit Share State Dummy
-0.250 (0.18)
-0.423 (0.34)
-1.169 (0.74)
-1.116 (0.72)
R2
0.091
0.116
0.145
0.155 Obs.
325 325 325 325
Absolute value of t-statistics in parentheses (* significant at 10%; ** significant at 5%; *** significant at 1%). Explanatory variables include: 501(c)(3) ruling year, log number of beds, log surplus, Herfindahl index, log Medicare case mix, teaching hospital dummies (major, minor and non-teaching), religious affiliation dummy, log average length of stay.
Table 5.3 presents the results from the estimation of equation (5.5). In the first two
columns the dependent variable is log labor share, in columns (3) and (4) the dependent
variable is log CEO’s compensation, in columns (5) and (6) the dependent variable is log 98 Since surplus also represent deficit this variable is divided into: ln Surplus (+), the log surplus when the hospital indeed runs a surplus, zero otherwise and ln Surplus (-), the log surplus when the hospital has a deficit, zero otherwise.

54
travel expenditures and in columns (7) and (8) the dependent variable is log meeting
expenditures. Using a Cook-Weisberg (1983) test, I find heteroskedasticity in all OLS
regressions. Even-numbered columns represent an attempt to correct for this
heteroskedasticity using weighted least squares approach, in which the weights are
obtained from a Breusch-Pagan (1979) regression.99
As predicted from the theory, the coefficient of the share of for-profit hospitals’ dummy
is negative and highly significant in the log labor share regression. However, the share of
for-profit hospitals dummy does not seem to explain hospital CEO’s compensation, travel
expenditures or meeting expenditures.100
6. Discussion While private hospitals in the US can organize as either nonprofit or for-profit
institutions, nonprofit hospitals dominate the hospital industry with a persistently large
share of beds (about 70%) over the period from 1960 to 2000. Moreover, nonprofit and
for-profit hospitals are subject to different regulatory rules, in particular the tax code.
More specifically, nonprofit hospitals are eligible for exemptions from property, sales,
and income taxes, while for-profit hospitals are required to pay these taxes. Despite these
legal and regulatory distinctions, there has been growing similarity in capacity between
nonprofit and for-profit hospitals during these four decades.101 One of the driving forces
behind this growing similarity (i.e. convergence) is the noteworthy number of ownership
switches from nonprofit to for-profit status and vice-versa.
Interestingly, failing to appreciate the dynamics of this convergence contributes to the
perception that the hospital industry is somewhat stagnant with respect to ownership
composition. Due to this perception, scholars often fuse hospitals’ ownership status and 99 From the OLS regressions (column 1, 3, 5 and 7) I obtain the studentized-residuals. I run a second regression, in which the estimated residuals squared is regressed on the same right-hand side variables as in the OLS regression. Columns 2, 4, 6 and 8 represent weighted least squares regressions in which the inverse predicted values from the second regression are used as analytical weights in the first one. 100 The hospital CEO’s compensation seems to be explained primarily by the size of the organization and by the size of the hospital’s surplus. 101 This trend of growing similarity, which I refer to also as convergence in size, is documented and described in section 2 of this paper.
55
hospitals’ objectives. Therefore, it is not surprising that for some, for-profit hospitals
symbolize profit seeking, compassionless, and opportunistic motives, whereas, nonprofit
hospitals are often viewed as community oriented charitable institutions. Moreover, this
belief is often used to justify preferential treatment for nonprofit hospitals. However, such
belief fails to account for the convergence in capacity and is based on a faulty rationale.
More specifically, when firms essentially choose between two distinct regulatory
systems, observed discrepancy in behavior does not necessarily correspond to variation in
objectives. In that sense a simple revealed-preferences argument need not work in the
case of nonprofit organizations. Clearly, the quest for identifying the objectives of
nonprofit hospitals is important for shaping courts’ decisions, government policies, and
antitrust interventions. Yet, if policymakers and legislators rely on nonfactual arguments
they might be led to promote dangerous and irresponsible policy interventions. In my
view, to the extent that nonprofit and for-profit hospitals exhibit systematic differences in
behavior, the nonprofit hospital’s behavior might be a consequence of the hospital’s
regulatory environment and not the product of unusual objectives.102
There is evidence to support the notion that the regulatory environment enables and
induces community-oriented behavior on the part of nonprofit hospitals. For-example,
Wu (1992) points out that nonprofit hospitals that received Hill-Burton funding were
required to provide community services and uncompensated or charity care annually for
twenty years after the date of the hospital’s expansion. Likewise, in several legal cases
courts required nonprofit hospitals to provide uncompensated care and threatened to
revoke their tax-exempt status if they failed to do so. Finally, Fournier and Campbell
(1997) find that nonprofit hospitals are indirectly compensated for the provision of
indigent care with legal protections against competition under certificate-of-need
regulation. What is clear from these examples is that nonprofits’ finer community
oriented behavior, to the extent that it exists, need not be altruistic or unselfish. The
regulatory environment provides enough sticks and carrots to produce variation in
behavior between for-profit and nonprofit hospitals. 102 Note that it is not evident that there are systematic differences between nonprofit and for-profit hospitals. For example, Sloan and Vraciu (1983) found that for-profit and nonprofit hospitals in Florida were virtually identical in terms of profit margins, dollar value of charity care, percentage of Medicare and Medicaid patient days, and net operating funds per admission and patient days.

56
Moreover, if nonprofit hospitals indeed shared strong intrinsic attributes, which separate
them from for-profit hospitals, then evidence for that is more likely to originate at the
organization level rather than at the industry level. For example, if nonprofit hospitals
selflessly seek to provide benefits to the communities in which they operate one would
find evidence for hospital-level mechanisms that encourages and enforces such altruistic
behavior. Still, Milstead (1999) finds that despite the growing focus on community
benefits, most compensation plans for executives of nonprofit health care organizations
do not include goals or provisions for providing such benefits. Likewise, Brickley and
Van Horn (2003) find no evidence that nonprofit hospitals provide explicit incentives for
their CEOs to focus on altruistic activities. Both articles essentially claim that the
behavior of nonprofit hospitals does not seem to be induced by hospital-level built-in
incentive mechanisms.
The same can be said of for-profit hospitals. They do not have organizationally defined
incentives to avoid providing benefits to the community, and yet, they pick a regulatory
environment that compels them to provide a community benefit by paying taxes. Thus,
both types of hospitals are forced to pay a tax of some sort for the benefit of the
community. Clearly, hospitals that choose the for-profit form do so despite the fact that
they will have to pay out taxes. Surely no one believes that such behavior can be traced
back to their objectives in the sense that these hospitals take pleasure in paying out taxes.
Tax liability is no doubt a feature of the for-profit hospitals’ regulatory environment.
Applying this logic to the nonprofit sector, I argue that those hospitals that organize as
nonprofit entities might do so despite the fact that they will be more likely to face outside
pressure to provide free or unprofitable services. The cost of free care is simply a “tax”
paid out by nonprofit hospitals to the communities in which they operate. CEOs of
nonprofit hospitals are not induced to focus on altruistic activities in the very same way
that CEOs of for-profit hospitals do not receive a fat bonus for paying out corporate
taxes.
Hospitals’ behavior not only reflects their objectives but also corresponds to their
economic, legal and political environment. The evidence shown above highlights the role
of the different hospitals’ environments in explaining variation in behavior between
57
nonprofit and for-profit hospitals, whereas differences in objectives across ownership
forms seem to play a minor role. Yet, there are scholars who subscribe to the supposition
that for-profit and nonprofit hospitals have different a-priori objectives and that these
objectives justify preferential treatment for the latter. They dismiss as skeptics those
scholars who suggest that it is the preferential treatment that induces such variation in
behavior, as if those scholars possess a general incredulity towards the idea that some
people are kindhearted while others are not. Nevertheless, the notion of skepticism would
have been in place if it meant that one views the knowledge in this particular area as
incomplete, and have doubt about theories that ignore equally feasible eventualities.
One of these eventualities is the growing similarity in capacity between nonprofit and
for-profit hospitals, which is the main focus of this paper. This growing similarity raises a
conceptual obstacle for the assertion that nonprofit and for-profit hospitals have
intrinsically different objectives. This is especially true when, currently, for-profit and
nonprofit hospitals treat a rather similar mix of patients in addition to offering and
delivering comparable services. I claim that the growing similarity between for-profits
and nonprofit hospitals is the result of changing market conditions. For instance, these
changes include: crowding out of government owned hospitals, growing population size
and changes in policy dynamics (e.g. tax code, antitrust involvement, federal and state
programs).103 If different behavior is merely the product of different objectives, then
growing similarity in behavior must correspond to growing similarity in objectives. Some
scholars subscribe to such a statement and claim that nonprofit hospitals simply “lost
their way”.104 However, according to Stigler and Becker (1977) the treatment of
individual preferences as constant is more valuable and credible for finding an economic
reason for observed market changes.105
103 The effects of such market changes on the convergence in capacity are discussed in length in section 4. 104 “If voluntary [nonprofit] hospital trustees and managers are indeed at risk of loosing sight of the historical mission and social raison d'être of their institutions, it is incumbent upon them to stop and take stock of what it means to be a voluntary institution,….” (Seay and Vladeck, 1988) or “...in pursuing the business mission, they [nonprofit hospitals] will lose their identity, their soul, and perhaps their tax-exempt status.” (Jones and Du Val, 1988) 105 “...we are proposing the hypothesis that widespread and/or persistent human behavior can be explained by a generalized calculus of utility-maximizing behavior, without introducing the qualification “tastes

58
In this growing similarity between nonprofit and for-profit hospitals, a significant role is
attributed to ownership-type switches. This is especially true for the period after the
introduction of the prospective payment system, when relatively large nonprofit hospitals
converted into for-profit status and hence made the typical for-profit and nonprofit
hospital more comparable106. But why switch? Did the entrepreneur become benevolent
or did the altruist become self-centered? Or maybe, those that switched to nonprofit were
simply “for-profits in disguise”, finally revealing their true face107. It is particularly tough
to explain switching behavior when relying on the assertion that nonprofit and for-profit
hospitals exhibit strong systematic differences in objectives. I claim that a set of initial
market conditions dictates the initial mix of for-profit and nonprofit hospitals. A change
in those conditions can, subsequently, alter the initial mix through switching.
When one syntactically splits the objectives of nonprofit and for-profit hospitals into
altruistic and opportunistic ones respectively, the notion of mix equilibrium becomes
rather trivial. Under this view of the world, the demand for nonprofit hospitals’ services
would be fairly detached from the demand for for-profit hospitals’ services, as these
services are differentiated. This notion of mix equilibrium is flawless in a stagnant world;
however, the dynamics of convergence and conversions raise serious doubts regarding
the validity such arguments. To avoid such limitation, the model presented in section 4
considers the uniform goal of surplus maximization for both for-profit and nonprofit
hospitals. The healthcare industry is viewed as offering private firms a choice between
two alternative ownership statuses; a firm’s selection of ownership type is viewed as a
vehicle to reach its objectives rather than a reflection of those objectives.
As an illustration, instead of a firm that chooses between nonprofit and for-profit status,
consider a driver who chooses between two alternative routes, both leading to the same
destination. The driver’s choice might depend on various factors, such as road condition,
remaining the same.” It is a thesis that does not permit of direct proof because it is an assertion about the world, not a proposition in logic.“ (Stigler and Becker, 1977) 106 See the discussion in section 2: The Dynamics of the US Hospital Market. 107 See the discussion in section 3: The Taxonomy of Economic Models of Nonprofit Firms.

59
distance, speed limit, tolls, number of stoplights, as well as the choice of other
commuters. A representative driver, who wishes to minimize traveling time, is
indifferent between the two alternative routes whenever traveling time is equal across the
two alternatives. I claim that hospitals’ choice of ownership status is, to some extent,
analogous to the commuter’s choice between alternative roads, as it reflects a means and
not an end. Moreover, by weighing up the costs and benefits of operating each road, city
officials might advocate closing one road on efficiency grounds. That is, when the costs
of operating the road exceed the benefits. Similarly, mixed-ownership equilibrium is not
necessarily optimal. Under certain conditions, actions such as revoking the nonprofit
status or prohibiting the operation of for-profit hospitals might represent a more desirable
market setting.
The analogy between the commuter’s problem and the hospital’s problem emphasizes the
distinction between means and ends; however, in other aspects these problems are not
analogous. For example, these models result in opposite feedback effects, as switching
from one road to the other makes the former more desirable. In the hospitals’ case
switching from nonprofit to for-profit status makes the nonprofit status less attractive,
therefore, a stable equilibrium notion hinges on some built-in heterogeneity among
hospitals or among consumers. Such heterogeneity is not necessary to sustain a stable
equilibrium in the commuter’s problem. In my formulation, this heterogeneity is
represented by variation in the ability to benefit from a given ownership type rather than
a variation in the propensity to trade off hospital-level profits for the promotion of
community interests.
Guarding such community interests, policymakers and legislators need a clear view of
what for-profit and nonprofit hospitals represent in order to effectively promote goals
such as: access to care, quality of services and fair competition. In my view, relying on
the idea that nonprofit and for-profit hospitals differ in their objectives produces a rather
weak justification for favoring nonprofit providers, by granting them special tax
treatment. Oddly enough, preferential treatment favoring nonprofit hospitals would be
more valuable for society if nonprofit hospitals’ community-oriented behavior was
induced by their unique regulatory status rather than by their unique objectives. For

60
example, if different tax treatment induces different behavior and such taxation
dissimilarities were eliminated one would expect to see a dramatic change in the behavior
of nonprofit hospitals. On the other hand, one would expect a relatively mild change in
behavior if originally; this behavior was induced by nonprofit hospitals’ mission to
benefit society.
Policymakers and legislators should also realize that hospitals do not operate in a
vacuum. Rather, the growing number of conversions, consolidations and alliances should
highlight the importance of strategic behavior among hospitals.108 By affiliating with
neighboring hospitals or systems the hospital enjoys both greater bargaining power with
payers and scale economies (Hollis, 1997). The lack of stabilizing feedback effects in my
model provides yet another rationale for consolidations among nonprofit providers.
Affiliations and alliances between nonprofit hospitals serve as a commitment device and
stabilize the market’s ownership mix. Binding contracts that unify the control over two or
more nonprofit hospitals, removes the potential externality imposed by an individual
switcher on other nonprofit hospitals. Similar to the prisoner’s dilemma, a local hospital
market can collapse into for-profit ownership, as switching from nonprofit to for-profit
might be the dominant strategy facing each individual hospital in a non-cooperative
equilibrium. Hospitals would be trapped in an inefficient solution, which can be
improved upon by consolidation.
In conclusion, the regulatory environment appears to play a key role in explaining
differences in behavior between for-profit and nonprofit hospitals. The fact that nonprofit
and for-profit providers compete in the same markets yet are subject to different
regulatory rules cast serious doubt on the idea that observed differences in behavior
between the two hospitals could be used to elicit their objectives.109
108 See David and Helmchen (2003) 109 For example, Jones and Du Val (1988) pose the question “What would be lost to our society if voluntary [nonprofit] hospitals were to de-emphasize or abandon their community services missions and pursue primarily or solely their business mission?” this faulty assertion views the organization’s ownership status and objectives as one. Another example is found in Schramm (1988) who posses the following questions with respect to nonprofit and for-profit hospitals “Are we dominated by the profit motive? Is there no place in our society for pure altruism? Will economics prevail over compassion? Is nothing sacred?”.
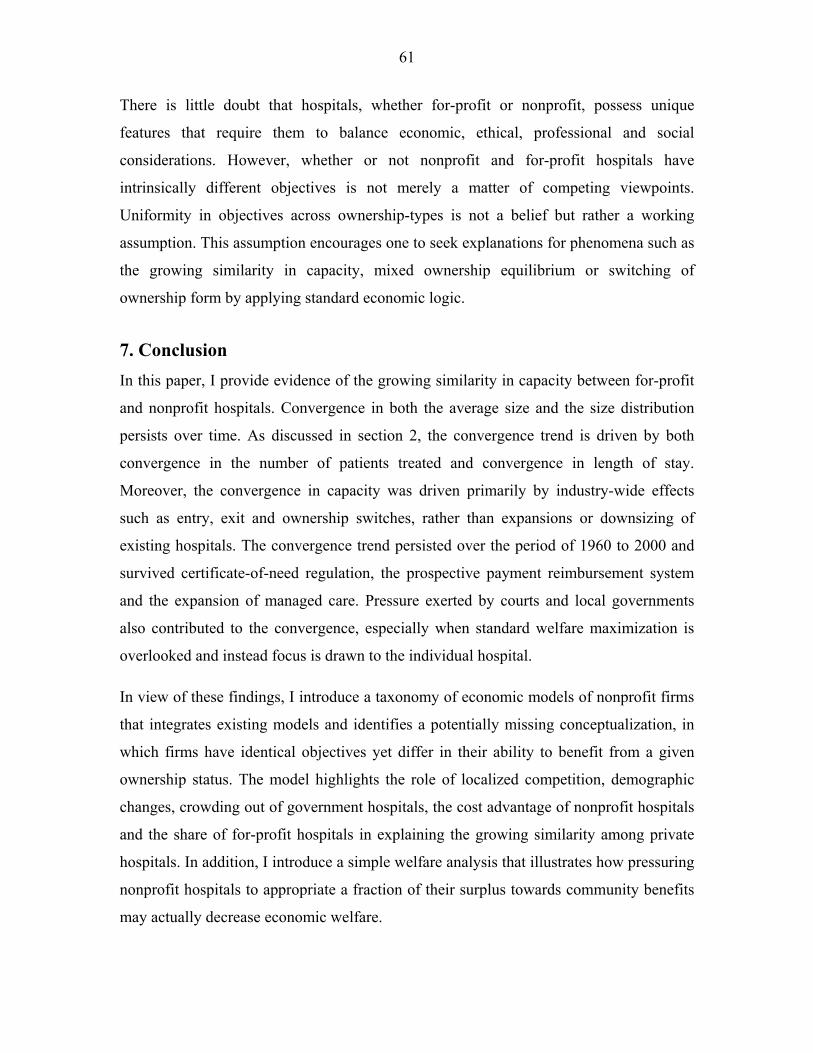
61
There is little doubt that hospitals, whether for-profit or nonprofit, possess unique
features that require them to balance economic, ethical, professional and social
considerations. However, whether or not nonprofit and for-profit hospitals have
intrinsically different objectives is not merely a matter of competing viewpoints.
Uniformity in objectives across ownership-types is not a belief but rather a working
assumption. This assumption encourages one to seek explanations for phenomena such as
the growing similarity in capacity, mixed ownership equilibrium or switching of
ownership form by applying standard economic logic.
7. Conclusion In this paper, I provide evidence of the growing similarity in capacity between for-profit
and nonprofit hospitals. Convergence in both the average size and the size distribution
persists over time. As discussed in section 2, the convergence trend is driven by both
convergence in the number of patients treated and convergence in length of stay.
Moreover, the convergence in capacity was driven primarily by industry-wide effects
such as entry, exit and ownership switches, rather than expansions or downsizing of
existing hospitals. The convergence trend persisted over the period of 1960 to 2000 and
survived certificate-of-need regulation, the prospective payment reimbursement system
and the expansion of managed care. Pressure exerted by courts and local governments
also contributed to the convergence, especially when standard welfare maximization is
overlooked and instead focus is drawn to the individual hospital.
In view of these findings, I introduce a taxonomy of economic models of nonprofit firms
that integrates existing models and identifies a potentially missing conceptualization, in
which firms have identical objectives yet differ in their ability to benefit from a given
ownership status. The model highlights the role of localized competition, demographic
changes, crowding out of government hospitals, the cost advantage of nonprofit hospitals
and the share of for-profit hospitals in explaining the growing similarity among private
hospitals. In addition, I introduce a simple welfare analysis that illustrates how pressuring
nonprofit hospitals to appropriate a fraction of their surplus towards community benefits
may actually decrease economic welfare.

62
The empirical analysis in section 5 examines the growing similarity in size over the 1970
– 1998 period. Tables 5.1 and 5.2 report results from estimating the theoretical model at
the state and metropolitan statistical area levels. Results in this section indicate that
variations in demand, government provision of hospital services, share of for-profit
hospitals and cost advantages for nonprofit hospitals explain much of the convergence in
size between for-profit and nonprofit hospitals. For the most part, the directions of these
effects are consistent with the theory I lay out in section 4. In order to further substantiate
some of the more fundamental equilibrium predictions, I test the effect of the market
share of for-profit hospitals on both the nonprofit hospital’s labor share and its CEO’s
compensation. For the case of labor shares, I find a strong negative correlation,
suggesting that a nonprofit hospital is more likely to exhibit strong perk related behavior
when it operates in a high for-profit share state. However, this is not the case for CEOs
compensation, which are similar across states with high and low shares of for-profit
hospitals. Overall, the evidence presented in both subsections 5.1 and 5.2 is more
suggestive than definitive. More specifically, the empirical analysis does not refute
alternative conceptualizations, such as the altruism model. Nevertheless, it generally does
supports the implications of the model, presented in section 4.
There is little doubt that hospitals, whether for-profit or nonprofit, possess unique
features that require them to balance economic, ethical, professional and public
considerations. Yet, whether or not nonprofit and for-profit hospitals have intrinsically
different objectives remains an open question. In fact, there is no conceptual need to rely
on differences in objectives in order to explain the growing similarity in capacity, which I
have documented in this paper, or the coexistence of for-profit and nonprofit hospitals. In
particular, this paper produces similar predictions using standard economic logic by
relying on uniformity in objectives across ownership type.

63
REFERENCES
Arrow, Kenneth J. “Uncertainty and the Welfare Economics of Medical Care.” American Economic Review, 1963, 941-973.
Ballou P. Jeffrey and Burton A. Weisbrod. “Inferring behavior of nonprofit and governmental organizations from managerial rewards: An application to the hospital industry.” Journal of Public Economics, forthcoming 2003.
Barro R. Jason. “Efficiency and Monopoly as Explanations for Hospital Mergers” Harvard Business School, July 2000.
Becker, Edmund R. and Frank .A. Sloan (1985), “Hospital Ownership and Preference,” Economic Inquiry, 23(1): 21-36.
Ben-Ner Avner and Benedetto Gui, editors. The Nonprofit Sector in The Mixed Economy, The University of Michigan Press, November 1993
Bonin, John, Jones Derek and Putterman, Louis. “Theoretical and Empirical Studies of Producer Cooperatives; Will Ever the Twain Meet?” Journal of Economic Literature, Sep 1993, pp 1290-1320.
Breusch T. S. and A. R. Pagan, “A Simple Test for Heteroscedasticity and Random Coefficient Variation” Econometrica, Vol. 47, pp. 1287-1294, Sep. 1979.
Brickley A. James and Lawrence R. Van Horn, “Incentives in Nonprofit organizations: Evidence from Hospitals” Journal of law and Economics, forthcoming 2003
Cook R. Dennis and Sanford Weisberg, “Diagnostics for Heteroscedasticity in Regression” Biometrika, Vol. 70, 1-10, April 1983.
David, Guy and Lorens A. Helmchen, “Recognizing Provider Competition and Taxation in the Evaluation of Not-for-Profit Hospitals” Mimeo, University of Chicago, May 2003.
David, Guy and Anup Malani, “Does Nonprofit Status Signal Quality? Direct Evidence from Hospital Advertisements”, Work in progress, 2003.
Dranove, David. The Economic Evaluation of American Health Care, Princeton Univ. Press, 2000.
Dranove, David and William D. White How Hospitals Survived: Competition and the American Hospital , The AEI Press, Washington D.C. 1999.
Duggan, Mark, “Hospital Ownership and Public Medical Spending” The Quarterly Journal of Economics Vol. 115, Issue 4 , Nov 2000.
Easley, David and Maureen O’Hara (1983), “The economic role of the nonprofit firm,” Bell Journal of Economics, 14(2): 531-538.
Eckels, Timothy and Julie Trocchio. “Model Refines Quantification of Community Service”, Healthcare Financial Management, February 1992.
Eckel C. Catherine and Richard Steinberg “Competition, Performance and Public Policy Toward Nonprofits” in Young R. Dennis and David C. Hammack, Editors. Nonprofit Organizations in a Market Economy, Jossey-Bass Publishers, San Francisco, 1993.
Emons, W., “Credence Goods and Fraudulent Experts.” Rand Journal of Economics. 1997, pp 107-119.
Erus, Burcay and Burton A. Weisbrod. “Compensation Structures Across Institutional Forms: Responses to Exogenous Revenue Constraints in the Hospital Industry, 1992-1997” in Edward L. Glaeser Editor. The Governance of Not-for-Profit Organizations, The University of Chicago Press, 2003.

64
Feldstein Martin S. (1971), “Hospital Cost Inflation: A Study of Nonprofit Price Dynamics,” American Economic Review, 61(5): 853-872.
Fournier M. Gary and Ellen S. Campbell, “Indigent Care as Quid Pro Quo in Hospital Regulation” The Review of Economics and Statistics, Vol. 79, Nov 1997.
Frank, Richard and David Salkever. “Non profit Organizations in the Health Sector”, Journal of Economic Perspectives, Vol 8, 1994, pp129-144.
Frank, Richard and David Salkever. “Market Forces, Diversification, and Not-for-Profit Hospitals.” in Cutler, David. Editor, The changing hospitals Industry, NBER conference Report, 2000
Frumkin, Peter and Elizabeth K. Keating. “The Price of Doing Good: Executive Compensation in Nonprofit Organizations” working paper, October 2001.
Fuchs, R. Victor, “The Supply of Surgeons and the Demand for Operations” The Journal of Human Resources, Vol. 13, (1978), pp. 35-56.
Gaynor Martin and Debora Haas-Wilson “Change, Consolidation and Competition in Health Care Markets”. Journal of Economic Perspectives 141 1999.
Geweke, John, Gautam Gowrisakaran, and Robert J. Town, “Bayesian Inference for Hospital Quality in a Selection Model,” NBER Working Paper No.W8497, Oct 2001.
Glaeser, Edward L. and Andrei Shleifer (1998), “Not-For-Profit Entrepreneurs,” NBER Working Paper No. W6810.
Glaeser L. Edward “The Governance of Not-For-Profit Firms” in Edward L. Glaeser Editor. The Governance of Not-for-Profit Organizations, The University of Chicago Press, Forthcoming 2003.
Gray, Bradford H. “Conversion of HMOs And Hospitals: What’s at Stake?” Health Affairs, March/April 1997.
Gray, Bradford H. “Why Nonprofits? Hospitals and the Future of American Health Care.” Frontier of Health Services Management, Summer 1992, Vol 8: 3 – 32.
Gray, Bradford H., “The Profit Motive and Patient Care”, A Twentieth Century Fund Report, Harvard University Press, 1991.
Haglund C.L and Dowling W.L, The Hospital, in S.J. Williams and P.R. Torres, Editors. Introduction to Health Services (4th ed.) 137-176, New-York: Delmar Publishers, 1993.
Hansmann, Henry B. (1980), “The Role of Nonprofit Enterprise,” Yale Law Review, 89: 835-901.
Hansmann, Henry (1987), “The effect of Tax Exemption and Other Factors on the Market Share of Nonprofit versus For-Profit Firms,” National Tax Journal 40: 71-82.
Hansmann, Henry B. (1996), The Ownership of Enterprise, Cambridge, MA: Harvard University Press.
Hansmann Henry, Daniel Kessler and Mark McClellan “Ownership Form and Trapped Capital in the Hospital Industry” in Edward L. Glaeser Editor. The Governance of Not-for-Profit Organizations, The University of Chicago Press, 2003.
Hausman, J. A. “Specification Tests in Econometrics”, Econometrica 46, pp 1251-71, 1978.
Herzlinger, R.E. and W.S. Krasker (1987), “Who Profits from Nonprofits?” Harvard Business Review, January/February: 93-106.
Hirth, Richard A., “Consumer Information and Competition Between Nonprofit and For-profit Nursing Homes,” Journal of Health Economics, 1999 18: 219-240.
65
Hollis R. Steven “Strategies and Economic Factors in the Hospital Conversion Process” Health Affairs, vol. 16, March 1997.
Institute of Medicine. For-Profit Enterprise in Health Care, Edited by Bradford H. Gray, National Academy Press. Washington, DC, 1986.
James, Estelle, “How Nonprofits Grow: A Model,” Journal of Policy Analysis and Management, 350-365, Spring 1983.
James, Estelle, and Susan Rose-Ackerman, The Nonprofit Enterprise in Market Economics, New York, NY: Harwood Academic Publishers, 1986.
Jones B. Stanley and Merlin K. Du Val, “What Distinguishes the Voluntary Hospital in an Increasingly Commercial Health Care Environment?” in Seay J. David and Bruce C. Vladeck, editors. In Sickness and in Health: The Mission of Voluntary Health Care Institutions, McGraw-Hill, 1988.
Keeler, Emmett B., Lisa V. Rubinstein, Katherine L. Kahn, David Draper, Ellen R. Harrison, Michael J. McGinty, William H. Rogers, and Robert H. Brook (1992), “Hospital Characteristics and Quality of Care,” Journal of the American Medical Association, 268(13): 1709-1714
Keeler E. B, G Melnick and J Zwanziger. “The Changing Effects of Competition on Non-Profit and For-Profit Hospital Pricing Behavior,” Journal of Health Economics 18 (1999): 69-86.
Kuchler, Joseph. “Tax-Exempt Yardstick: Defining the Measurements,” Healthcare Finance Management, February 1992.
Lakdawalla, Darius, and Tomas Philipson. “The Nonprofit Sector and Industry Performance.” Working Paper, Department of Economics, University of Chicago, 1999.
Malani Anup, Tomas Philipson and Guy David “Theories of Firm Behavior in the Non-Profit Sector: A Synthesis and Empirical Evidence” in Edward L. Glaeser Editor. The Governance of Not-for-Profit Organizations, The University of Chicago Press, 2003.
McClellan, Mark and Douglas Staiger, ”Comparing Hospital Quality at For-Profit and Not-For-Profit Hospitals” NBER Working Paper 7324, 1999.
Meade, James E. “The Theory of Labor Managed Firm and of Profit Sharing.” The Economic Journal, Mar 1972, pp 402-428.
Milstead, Linda. “The Pressure Is On: Tying Executive Pay to Community Benefits” Health Forum Journal, March/April 1999.
Mitchell Shannon, Spetz Joanne and Jean Ann Seago, “Errors in Data on Hospital Ownership”, Inquiry, 38: 432-439, Winter 2001.
Newhouse, Joseph. “Towards a Theory of Non-Profit Institutions: An Economic Model of a Hospital,” American Economic Review, 60 (1970), 64-74.
Nicholson, Sean, Mark V. Pauly, Lawton R. Burns, Agnieshka Baumritter, and David A. Asch. “Measuring Community Benefits Provided By For-profit And Nonprofit Hospitals.” Health Affairs Vol 19 (6) Nov/Dec 2000.
Ortmann, Andreas and Mark Schlesinger, “Trust, Repute, and the Role of Nonprofit Enterprise” in Helmut K. Anheier and Avner ben-Ner editors, The Study of Nonprofit Enterprise: Theories and Approaches, Kluwer/Plenum, 2002.
Pauly, Mark V. and Michael Redisch “The Not-For-Profit Hospital as a Physicians’ Cooperative”, American Economic Review, 63 (1973) 87-100.
Pauly, Mark V. “Nonprofit Firms in Medical Markets.”, American Economic Review, 77 (1987), 257-262.

66
Pellegrini, Dan. “Hospital Tax exemption: A Municipal Perspective.” Frontier of Health Services Management, Spring 1989, Vol. 5: 44 – 46.
Phelps, Charles E. 1997, Health Economics, Addison-Wesley, 1997.
Philipson, Tomas (2000), “Asymmetric Information and the Not-for-Profit Sector: Does Its Output Sell at a Premium?” 325-345, in David M. Cutler, ed., The Changing Hospital Industry: Comparing Not-for-Profit and For-Profit Institutions, Chicago: University of Chicago Press.
Raffel, W. Marshall and Norma K. Raffel The U.S. Health System: Origins and Functions 3rd addition, Wiley Medical Publication, 1989.
Reinhardt E Uwe “The Economics of For-Profit and Not-For-Profit Hospitals”. Health Affairs, Vol. 19, Nov 2000.
Roemer, Milton. “Bed Supply and Hospital Utilization: A Natural Experiment” Hospitals 35 pp36-42, 1961.
Schramm, Carl J. “The Legal Identity of the Modern Hospital: A Story of Evolving Values” in Seay, David J. and Bruce C. Vladeck, editors. In Sickness and in Health: The Mission of Voluntary Health Care Institutions, McGraw-Hill, New York City, 1988.
Seay, David J. and Bruce C. Vladeck, “Mission Matters” in Seay, David J. and Bruce C. Vladeck, editors. In Sickness and in Health: The Mission of Voluntary Health Care Institutions, McGraw-Hill, New York City, 1988.
Shortell, S., and E.F.X Hughes (1988), “The effects of regulation, competition, and ownership on mortality rates among hospital inpatients”, New England Journal of Medicine 318(17): 1100-1107
Simpson, J and R. Shin. “Do Nonprofit Hospitals Exercise Market Power?” International Journal of Economics and Business. 1997, pp 141-157.
Sloan, Frank A., and B. Steinwald (1980), Hospital Labor Markets: Analysis of Wages and Work Force Composition. Lexington, MA: D.C. Heath-Lexington Books.
Sloan, Frank A., and Robert A. Vraciu “Investor-Owned and Not-for-Profit Hospitals: Addressing some Issues” Health Affairs (Spring 1983): 25-37.
Sloan, F.A., G. Picone, D.H. Taylor, and S.Y Chou (1998), “Does where you are admitted make a difference? An analysis of Medicare data”, in: A.M. Garber, ed., Frontiers in Health Policy Research (MIT Press, Cambridge, MA), forthcoming.
Sloan, F.A and D.H. Taylor (1999), “Does ownership affects the cost of Medicare?”, in: A.J Rettenmaier and T.R Saving, eds., Medicare Reform: Issues and Answers (University of Chicago Press, Chicago).
Sloan, Frank A. (2000a), “Not-for-Profit Ownership and Hospital Behavior,” 1141-1174, in Newhouse, J. and A. Culyer, eds., Handbook of Health Economics, New York, NY: Elsevier Science.
Sloan, F.A., G. Picone, D.H. Taylor, and S.Y Chou, “Hospital Ownership and Cost and Quality of Care: Is There a Dime’s Worth of Difference?” working paper, Department of Economics, Duke University, (2000b).
Stigler, George J. and Gary S. Becker, “De Gustibus Non Est Disputandum”, The American Economic Review, Vol. 67, March 1977, pp 76-90.
Vanec, Jaroslav, The General Theory of Labor Managed Market Economics Ithaca, NY and London: Cornell Univ. Press, 1970.
Vaughn, J. Amanda “The Use of the Nonprofit “Defense” Under Section 7 of the Clayton Act” Vanderbilt Law Review, Vol. 52 557-598, March 1999.

67
Ward, Benjamin. “The Firm in Illyria : Market Syndicalism.” American Economic Review, Sept 1958, pp 566-589.
Weisbrod, Burton A., “Toward a Theory of the Voluntary Non-Profit Sector in a Three-Sector Economy,” 171-195, in Edmund S. Phelps, ed., Altruism, Morality and Economic Theory, New York: Russell Sage Foundation, 1975.
Weisbrod, Burton A., The Nonprofit Economy, Cambridge: Harvard University Press, 1988.
White D. William “Regulating Competition in a Nonprofit Industry: The problem of For-Profit Hospitals” Inquiry 16: 50-61, Spring 1979.
White D. William “The American Hospital Industry Since 1900: A Short History” Advances in Health Economics and health Services Research, Vol. 3, pages 143-170. JAI Press 1982.
Wilkicki, Kathryn J. “The Effects of Not-for-Profit Hospital Reported Profits and Chritable Care on Perceptions of Tax-Exempt Status” The Journal of the American Taxation Association, 2001, Vol 23, pp 50-58.
Williamson, Oliver. The Economics of Discretionary Behavior: Managerial Objectives in a Theory of the Firm, Englewood Cliffs: Prentice-Hall, 1964.
Wu Y. Lawrence, “Ownership and Firm Dynamics: A Comparison of Exit and Growth of For-Profit and Not-For-Profit Hospitals”, PhD Dissertation, Univ. of Chicago, Dec 1992.
Young, J. Gary and Kamal R. Desai, “Nonprofit Hospital Conversions and Community Benefits: New Evidence from Three States” Health Affairs, Vol 18, 1999.
Young, G, Desai, K and F, Hellinge, “Community Control and Pricing Patterns of Nonprofit Hospitals: An Antitrust Analysis” Journal of Health Politics, Policy and Law, Dec 2000.
Appendix 2.A
The change in this ratio as we move from year j to year i, is given by:
∑∑∑
∑∑
∑∑
∑∑
∑∑
∑∑
∑∑
−=−⋅=
−
=∆
k
Fik
Fik
k
Fik
Fik
k
Fjk
Fjk
Nji
k
Fik
Fik
k
Fik
Fik
k
Fik
Fik
k
Fjk
Fjk
k
Njk
Njk
k
Nik
Nik
k
Fjk
Fjk
k
Njk
Njk
k
Fjk
Fjk
k
Njk
Njk
k
Fik
Fik
k
Nik
Nik
ji xs
xsxsG
xs
xs
xs
xs
xs
xs
xs
xs
xs
xs
xs
xs
By adding and subtracting common term we get:
∑∑ ∑∑∑∑∑ −−−+−
=∆
k
Fik
Fik
k k
Fi
Fik
k
Fi
Fik
k
Fj
Fjk
k
Fj
Fjk
Nji
Fik
Fik
k
Fjk
Fjk
Nji
ji xs
xsxsxsxsGxsxsG )()( 1111
By rearranging the expression above we get:
−−−+
−=∆
∑∑∑
∑k
Fik
Fik
k
Fi
Fik
Fik
Fj
k
Fjk
Fjk
Nji
k
Fik
Fik
Fi
Fj
Nji
ji xs
xxsxxsG
xsxxG )()( 11
11

68
Appendix 2.B
Graphical Decomposition of Ratios:
In this case all three groups positively contribute to the convergence process. The 70-74, 74-78, 86-90, 90-94 and 94-98 periods have this feature.
In this case the entrants negatively contribute to the convergence process (offset the effect of stayers and exitors). The 78-82 and 82-86 periods are an example for this case.
Exitors
Stayers
Entrants
Total Effect
Period
Time
∑∑
k
FPik
FPik
k
NFPik
NFPik
xs
xs
Entrants
Exitors
Stayers
TotalEffect
Period
Time
∑∑
k
FPik
FPik
k
NFPik
NFPik
xs
xs Overall convergence trend NFP/FP ratio for stayers
Appendix 4.A
When we don’t have constant marginal costs, output will appear on both sides of (2) - (4). The first order conditions for nonprofit and for-profit firms can be represented by the following two implicit functions: '
FPFPFP CyY −−−= ββαψ and, 'NFPNFPNFP CyY −−−= ββαψ .
For a given parameter or variable s, we can use the implicit function theorem to sign both
FPFP
FPFP
ys
dsdy
∂∂∂∂
−=ψψ and
NFPNFP
NFPNFP
ys
dsdy
∂∂∂∂
−=ψ
ψ
The effect of a change in s on the size ratio is given by:
−=
dsdy
yy
dsdy
ydsyy
dFP
FP
NFPNFP
FP
FP
NFP
1
Define '2
2
k
k
kk C
yyc
∂∂
≡ε as the elasticity of supply for firm with ownership type k.
The sign of this derivative depends on the sign of the expression in the square brackets.

69
0<
dsyy
dFP
NFP
iff FPFPNFPNFPNFPFP nNCnCCCN εε )1()1())(1( '''' +−>++−+
For a sufficiently high share of for-profit firms, a sufficient condition for the model’s predictions to hold when firms have increasing marginal costs is an equally or more elastic supply function for nonprofit firms. Nevertheless, the model’s prediction could be preserved even if supply is more elastic for the for-profit firm, as long as, it is sufficiently close to the nonprofit firm’s supply elasticity.
Appendix 4.B
Assuming nonprofits have cost advantage over for-profit firms, 0'' >− NFPFP CC
0))(1( '' >−+ NFPFP CCN )( ''''
NFPFPFPNFP CCNCC −−−>− Add GNFPFP GyCCn βα −−+ )( '' to both sides
GNFPFPFPGNFPFPNFP GyCCnNCGyCCnC βαβα −−−−−>−−+− ))(()()()( '''''' Divide both sides by )1( +Nβ
)1())(()(
)1()()( ''''''
+−−−−−
>+
−−+−N
GyCCnNCN
GyCCnC GNFPFPFPGNFPFPNFP
ββα
ββα
Using (4.3) and (4.4) we get, FPNFP yy >
Appendix 4.C
Here we are interested in the partial derivative of the nonprofit-to-for-profit size ratio with respect to the number of for-profit firms in the industry.
0)1(
))((2
''
<+
−−−=
∂
∂
FP
NFPFPFPNFPFP
NFP
yNCCyy
nyy
β
It is fairly easy to show that the second derivative is positive; hence the convergence process has a concave shape, which corresponds to the observed trends, Figure 2.1 and Figure 2.2.
Appendix 4.D
Why is the effect of quid-pro-quo pressure on nonprofit hospitals on overall producer surplus ambiguous? According to the figure below, in state 0, equilibrium is reached at n0/N. the blue segment represent the level of utility for each level of δ. To the left of n0/N all hospitals organize as for-profits while to the left of n0/N all hospitals organize as nonprofits. The red segment represent the effect of pressure, in the form of x>0. Equilibrium is reached at n1/N. pressure rotates the increasing segment downwards, while subsequent switching from nonprofit to for-profit status shifts the horizontal line up.
70
Loss to those firms that maintain their nonprofit status
Gain to firms that maintain their for-profit status
n*/N
Switchers
n0/N n1/N 1 δ
πFP0
πFP1
δ(1-x)πNFP1
δπNFP0
Utility
Pressure has a negative effect on total producer surplus, however it induces switching. In turn, switching has a positive effect on total producer surplus. Hence, the direction of change in overall producer surplus is ambiguous. It depends on the relative size of the areas to the right and to the left of n*/N. When such pressure is introduced, firms choosing to maintain their nonprofit status have lower utility. Conversely, firms that were for-profit originally gain from the pressure on nonprofits. This result is ambiguous for switchers (nonprofit to for-profit), as it depends on their initial value of δ. Switchers with relatively low δ will gain while switchers with relatively high δ will lose.
Appendix 5.A
Starting with equation (5.2):
(5.2) ' '( ) ( )FP FP FP NFP NFP NFPn np C y p C yN N
π π= − = − =
Using (4.5) and (4.6) the marginal cost of the nonprofit firm can be expressed as a function of the demand parameters, the marginal cost of the for-profit firm and the number of nonprofit and for-profit firms.
(5.2’) ' '
' ( )( 1) ( 1)( ( 1))
FP G FP FPNFP
FP
C Gy N CC
N n nα β σ
σ− − − + +
=− + +
Where, FPnN
σ =
The true difference in average costs between for-profit and nonprofit hospitals is:
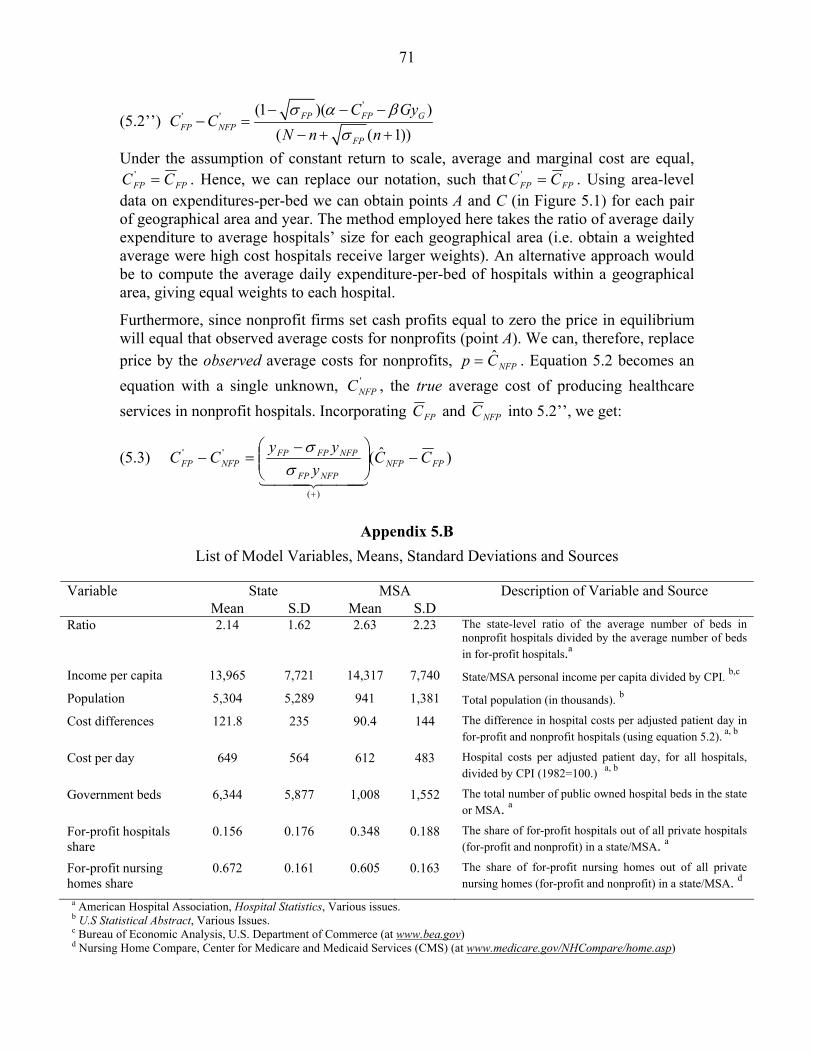
71
(5.2’’) '
' ' (1 )( )( ( 1))
FP FP GFP NFP
FP
C GyC C
N n nσ α β
σ− − −
− =− + +
Under the assumption of constant return to scale, average and marginal cost are equal, FPFP CC =' . Hence, we can replace our notation, such that FPFP CC =' . Using area-level
data on expenditures-per-bed we can obtain points A and C (in Figure 5.1) for each pair of geographical area and year. The method employed here takes the ratio of average daily expenditure to average hospitals’ size for each geographical area (i.e. obtain a weighted average were high cost hospitals receive larger weights). An alternative approach would be to compute the average daily expenditure-per-bed of hospitals within a geographical area, giving equal weights to each hospital.
Furthermore, since nonprofit firms set cash profits equal to zero the price in equilibrium will equal that observed average costs for nonprofits (point A). We can, therefore, replace price by the observed average costs for nonprofits, NFPCp ˆ= . Equation 5.2 becomes an equation with a single unknown, '
NFPC , the true average cost of producing healthcare services in nonprofit hospitals. Incorporating FPC and NFPC into 5.2’’, we get:
(5.3) )ˆ(
)(
''FPNFP
NFPFP
NFPFPFPNFPFP CC
yyy
CC −
−=−
+444 3444 21
σσ
Appendix 5.B
List of Model Variables, Means, Standard Deviations and Sources
State MSA Variable Mean S.D Mean S.D
Description of Variable and Source
Ratio 2.14 1.62 2.63 2.23 The state-level ratio of the average number of beds in nonprofit hospitals divided by the average number of beds in for-profit hospitals.a
Income per capita 13,965 7,721 14,317 7,740 State/MSA personal income per capita divided by CPI. b,c
Population 5,304 5,289 941 1,381 Total population (in thousands). b
Cost differences 121.8 235 90.4 144 The difference in hospital costs per adjusted patient day in for-profit and nonprofit hospitals (using equation 5.2). a, b
Cost per day 649 564 612 483 Hospital costs per adjusted patient day, for all hospitals, divided by CPI (1982=100.) a, b
Government beds 6,344 5,877 1,008 1,552 The total number of public owned hospital beds in the state or MSA. a
For-profit hospitals share
0.156 0.176 0.348 0.188 The share of for-profit hospitals out of all private hospitals (for-profit and nonprofit) in a state/MSA. a
For-profit nursing homes share
0.672 0.161 0.605 0.163 The share of for-profit nursing homes out of all private nursing homes (for-profit and nonprofit) in a state/MSA. d
a American Hospital Association, Hospital Statistics, Various issues. b U.S Statistical Abstract, Various Issues. c Bureau of Economic Analysis, U.S. Department of Commerce (at www.bea.gov) d Nursing Home Compare, Center for Medicare and Medicaid Services (CMS) (at www.medicare.gov/NHCompare/home.asp)
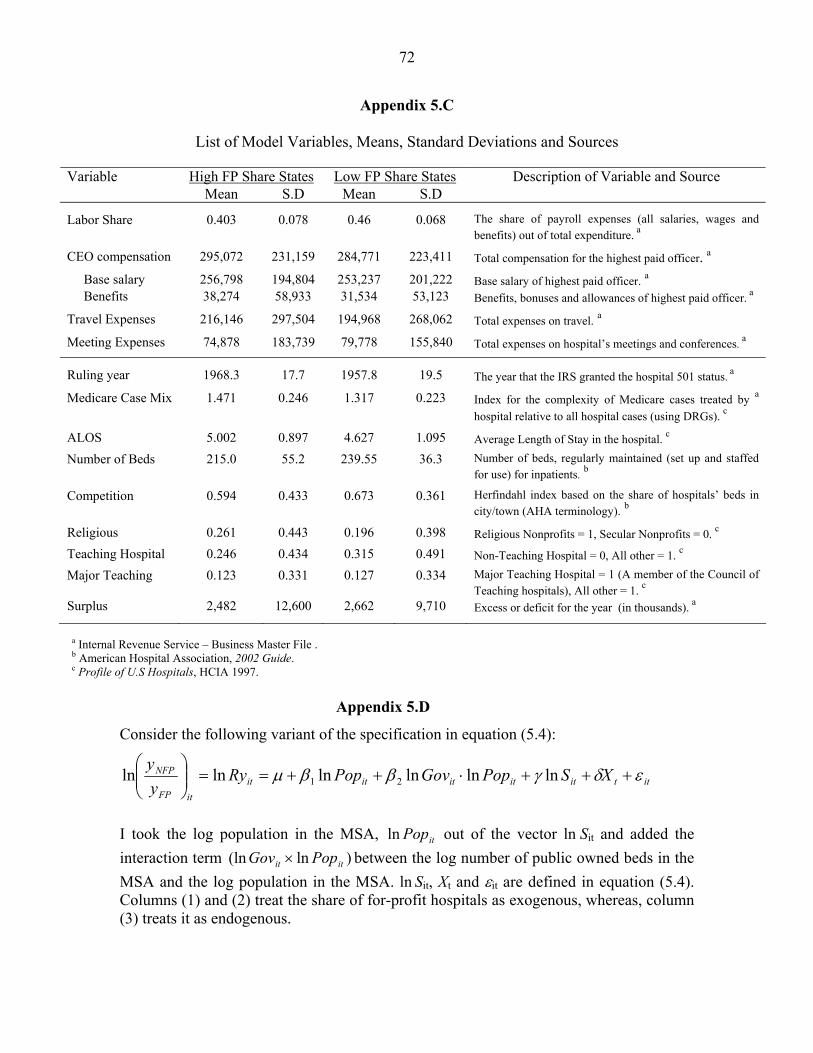
72
Appendix 5.C
List of Model Variables, Means, Standard Deviations and Sources
High FP Share States Low FP Share States Variable Mean S.D Mean S.D
Description of Variable and Source
Labor Share 0.403 0.078 0.46 0.068 The share of payroll expenses (all salaries, wages and benefits) out of total expenditure. a
CEO compensation 295,072 231,159 284,771 223,411 Total compensation for the highest paid officer. a
Base salary 256,798 194,804 253,237 201,222 Base salary of highest paid officer. a
Benefits 38,274 58,933 31,534 53,123 Benefits, bonuses and allowances of highest paid officer. a
Travel Expenses 216,146 297,504 194,968 268,062 Total expenses on travel. a
Meeting Expenses 74,878 183,739 79,778 155,840 Total expenses on hospital’s meetings and conferences. a
Ruling year 1968.3 17.7 1957.8 19.5 The year that the IRS granted the hospital 501 status. a
Medicare Case Mix
1.471 0.246 1.317 0.223 Index for the complexity of Medicare cases treated by a hospital relative to all hospital cases (using DRGs). c
ALOS
5.002 0.897 4.627 1.095 Average Length of Stay in the hospital. c
Number of Beds 215.0 55.2 239.55 36.3 Number of beds, regularly maintained (set up and staffed for use) for inpatients. b
Competition 0.594 0.433 0.673 0.361 Herfindahl index based on the share of hospitals’ beds in city/town (AHA terminology). b
Religious
0.261 0.443 0.196 0.398 Religious Nonprofits = 1, Secular Nonprofits = 0. c
Teaching Hospital
0.246 0.434 0.315 0.491 Non-Teaching Hospital = 0, All other = 1. c
Major Teaching
0.123 0.331 0.127 0.334 Major Teaching Hospital = 1 (A member of the Council of Teaching hospitals), All other = 1. c
Surplus 2,482 12,600 2,662 9,710 Excess or deficit for the year (in thousands). a
a Internal Revenue Service – Business Master File . b American Hospital Association, 2002 Guide. c Profile of U.S Hospitals, HCIA 1997.
Appendix 5.D
Consider the following variant of the specification in equation (5.4):
ittititititititFP
NFP XSPopGovPopRyyy
εδγββµ +++⋅++==
lnlnlnlnlnln 21
I took the log population in the MSA, itPopln out of the vector ln Sit and added the interaction term )ln(ln itit PopGov × between the log number of public owned beds in the MSA and the log population in the MSA. ln Sit, Xt and εit are defined in equation (5.4). Columns (1) and (2) treat the share of for-profit hospitals as exogenous, whereas, column (3) treats it as endogenous.
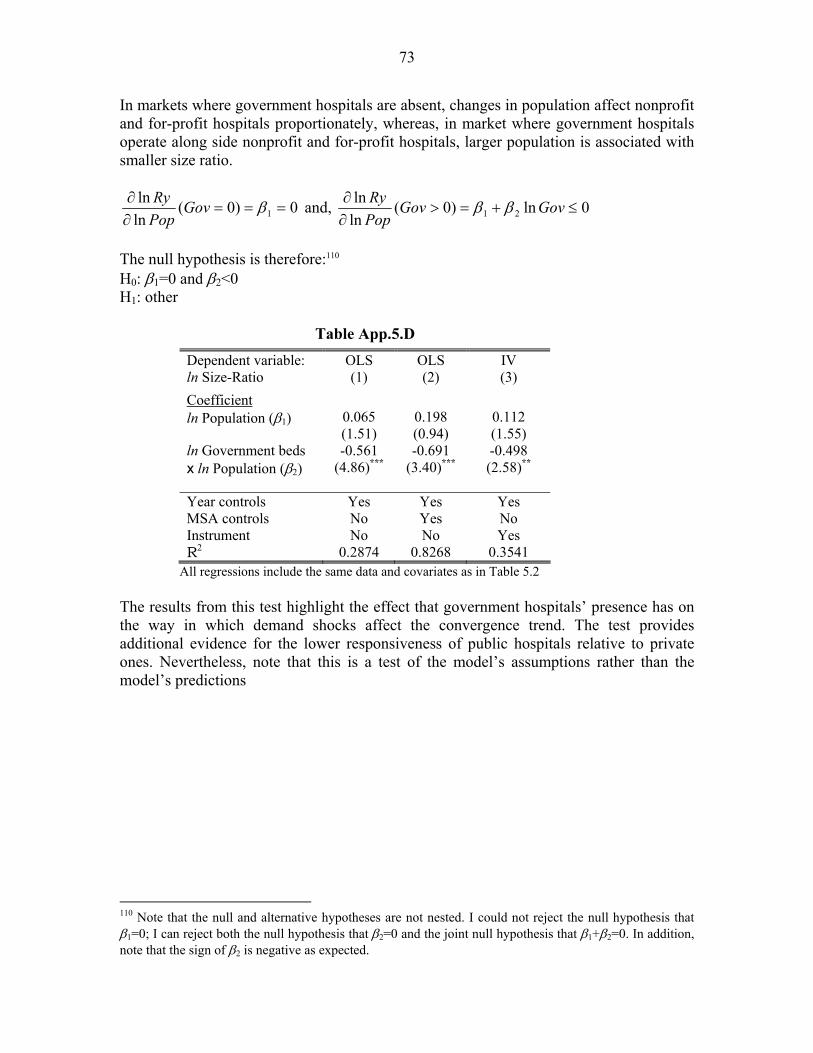
73
In markets where government hospitals are absent, changes in population affect nonprofit and for-profit hospitals proportionately, whereas, in market where government hospitals operate along side nonprofit and for-profit hospitals, larger population is associated with smaller size ratio.
0)0(lnln
1 ===∂∂ βGov
PopRy and, 0ln)0(
lnln
21 ≤+=>∂∂ GovGov
PopRy ββ
The null hypothesis is therefore:110 H0: β1=0 and β2<0 H1: other
Table App.5.D
Dependent variable: ln Size-Ratio
OLS (1)
OLS (2)
IV (3)
Coefficient ln Population (β1) 0.065
(1.51) 0.198 (0.94)
0.112 (1.55)
ln Government beds x ln Population (β2)
-0.561 (4.86)***
-0.691 (3.40)***
-0.498 (2.58)**
Year controls Yes Yes Yes MSA controls No Yes No Instrument No No Yes R2 0.2874 0.8268 0.3541
All regressions include the same data and covariates as in Table 5.2 The results from this test highlight the effect that government hospitals’ presence has on the way in which demand shocks affect the convergence trend. The test provides additional evidence for the lower responsiveness of public hospitals relative to private ones. Nevertheless, note that this is a test of the model’s assumptions rather than the model’s predictions
110 Note that the null and alternative hypotheses are not nested. I could not reject the null hypothesis that β1=0; I can reject both the null hypothesis that β2=0 and the joint null hypothesis that β1+β2=0. In addition, note that the sign of β2 is negative as expected.