The Consumer Tech Stack - Aventri
26
The Consumer Tech Stack Our 2018 US Benchmark Data Overview Reveals The Four Forces Of Adoption by James L. McQuivey and Gina Fleming April 5, 2018 NOT LICENSED FOR DISTRIBUTION FORRESTER.COM Key Takeaways Forrester Data Shows A Technology Shift Toward Conversations We are heading toward a world where data- driven machine intelligence powers conversations between brands and consumers — and consumers show signs of readiness for this. Four Basic Forces In Evolution Prepared Consumers For This Shift Winning technologies expand and exploit four human forces: mastery of tools, coordination, conversation, and emotion. This data-rich report examines key technology behaviors through the lens of these four basic forces to see how technology is exploiting 3.4 billion years of human evolution. Use Consumers’ Tech Stack To Enrich Customer Relationships Use the data you have about your customers today — how they feel, what conversations they want to have, how they want to get things done, and what tools they use — to deepen the relationships you have with them in the future. Why Read This Report Humans were born to embrace the technologies we track. Coming into 2018, Forrester surveyed 110,460 online adults in 20 countries to see how much people of every type embrace technology, why they use it, and what that will mean for your business. The data practically screams “Prepare for rich customer conversations!” Read this US- focused report not only to see the data but also to prepare to give your customers technology- enabled, emotion-rich conversations that help them get what they want, when they want it.
Transcript of The Consumer Tech Stack - Aventri

The Consumer Tech StackOur 2018 US Benchmark Data Overview Reveals The Four Forces Of Adoption
by James L. McQuivey and Gina FlemingApril 5, 2018
NOT LICENSED FOR DISTRIBUTION
FORReSTeR.COm
Key TakeawaysForrester Data Shows A Technology Shift Toward ConversationsWe are heading toward a world where data-driven machine intelligence powers conversations between brands and consumers — and consumers show signs of readiness for this.
Four Basic Forces In evolution Prepared Consumers For This ShiftWinning technologies expand and exploit four human forces: mastery of tools, coordination, conversation, and emotion. This data-rich report examines key technology behaviors through the lens of these four basic forces to see how technology is exploiting 3.4 billion years of human evolution.
Use Consumers’ Tech Stack To enrich Customer RelationshipsUse the data you have about your customers today — how they feel, what conversations they want to have, how they want to get things done, and what tools they use — to deepen the relationships you have with them in the future.
Why Read This ReportHumans were born to embrace the technologies we track. Coming into 2018, Forrester surveyed 110,460 online adults in 20 countries to see how much people of every type embrace technology, why they use it, and what that will mean for your business. The data practically screams “Prepare for rich customer conversations!” Read this US-focused report not only to see the data but also to prepare to give your customers technology-enabled, emotion-rich conversations that help them get what they want, when they want it.

2
5
20
22
© 2018 Forrester Research, Inc. Opinions reflect judgment at the time and are subject to change. Forrester®, Technographics®, Forrester Wave, TechRadar, and Total Economic Impact are trademarks of Forrester Research, Inc. All other trademarks are the property of their respective companies. Unauthorized copying or distributing is a violation of copyright law. [email protected] or +1 866-367-7378
Forrester Research, Inc., 60 Acorn Park Drive, Cambridge, MA 02140 USA+1 617-613-6000 | Fax: +1 617-613-5000 | forrester.com
Table Of Contents
The 2018 Consumer Technographics Benchmark Data Overview
Four Basic Forces In Evolution Prepared Consumers For The Shift
Prepare For Tomorrow’s Customer Conversations Today
Consumers Master Tools Like Smartphones And Wearables
People Coordinate More Tasks On More Tools More Often
Consumers Are Ready To Shift How They Converse And Connect
Emotions About Technology Still Run Strong
Forrester Data Delivers A Comprehensive View Of Consumers
Supplemental Material
FOR B2C MARKETING PROFESSIONALS
The Consumer Tech StackOur 2018 US Benchmark Data Overview Reveals The Four Forces Of Adoption
by James L. McQuivey and Gina Flemingwith Reineke Reitsma, Carrie Johnson, Xiaotong Duan, Cheryl Hart, Meredith McCreight, and Rachel Birrell
April 5, 2018

For B2C Marketing ProFessionals
The Consumer Tech Stackapril 5, 2018
© 2018 Forrester research, inc. Unauthorized copying or distributing is a violation of copyright law. [email protected] or +1 866-367-7378
2
Our 2018 US Benchmark Data Overview Reveals The Four Forces Of Adoption
The 2018 Consumer Technographics Benchmark Data Overview
More than 20 years ago, Forrester began its massive Consumer Technographics® research effort. Back then, 33% of US homes were online and just 0.06% were connected at high speed.1 This was such rare behavior that we called these people “early adopters.” But as we have collected more data about more technologies from more consumers in more countries than anybody else in the world, we have since learned that everybody is potentially an early adopter of something. In fact, humans seem born to embrace the technologies we track. Coming into 2018, Forrester surveyed 110,460 online adults in 20 countries to see just how much people of every type embrace technology, why they use it, and what that will mean for your business.
The Data Screams “Prepare For Rich Customer Conversations!”
Shift happens. And a big shift is happening right now, one so natural that consumers appear to have been born for it. But you can only see it if you know how to look at the data: Just knowing that 74% of US online adults shop online in 2018 won’t change your plan for 2019 and beyond.2 But if you look at that simple number and others like it through the right lens, you will see that a shift is about to occur in consumer experience and behavior, driven by real changes in the consumer tech stack. We believe that there will be a shift in how:
› Technology touches and talks with consumers. What’s the next big thing? Is it the voice-assistant smart speaker that 14% of US online adults already own? Will it be the smartwatch or fitness tracker that 32% wear?3 No, the next big thing is already here but it’s just not a thing: It’s data-driven machine intelligence paired with a millennia-old mode of interaction — conversation. Sitting in the cloud, this “thing” inhabits whatever sensors and tools people have, wear, or even put inside themselves, forever gathering data and delivering iteratively increasing value.
› Consumers feel about and through technology. How consumers feel shapes their attention, attitudes, and behaviors. And technology will soon allow them to pick experiences that conform to their preferred emotional states — deliberately at first, then eventually in an automated way. Those who feel most empowered by technology — the 25% of US online adults we call Progressive Pioneers — will do so most readily.4 And the smartest brands will learn to read those emotional needs via intelligent sensors, ultimately delivering the right experience via the right device to satisfy human emotions at the moment of greatest possible impact.
› Companies use tech to build customer relationships. The result of the data-driven machine intelligence revolution will be the creation of new ways to talk to the customer and serve their emotional needs. This will establish the two-way relationship street via which companies will change how they engage customers. We see this in the 81% of US online adults who say they are comfortable with retailers using information like purchase history or even in-store location to personalize their experience as well as in the 36% of US online adults who think retailers should do more to offer them more personalized experiences.5
For B2C Marketing ProFessionals
The Consumer Tech Stackapril 5, 2018
© 2018 Forrester research, inc. Unauthorized copying or distributing is a violation of copyright law. [email protected] or +1 866-367-7378
3
Our 2018 US Benchmark Data Overview Reveals The Four Forces Of Adoption
› Disruptors serve customers across traditional industry lines. As the best brands and companies expand to build more emotion-rich customer conversations and relationships, they will naturally cross the boundaries that once protected adjacent industries from poaching. Already, 28% of US online adults say they would trust Amazon to provide a mobile wallet service — that’s the same as would trust a bank to do so and more than would trust credit card brands like Visa or MasterCard.6 Outside companies will invade even healthcare and other financial services by using technology-enriched conversations to change what it means to be a customer of those legacy industries.
Four Basic Forces In evolution Prepared Consumers For The Shift
The coming shift is less mysterious than you might expect; this disruptive turning point in cutting-edge technology behavior is the logical extension of 3.4 billion years of evolutionary history. In fact, every technology of the digital revolution so far succeeded because it extended what human brains evolved to do. And the technologies that succeed next will do the same — only better and much more quickly — by exploiting and expanding on four basic forces enabled by our shared biology:7
› Tools. Many species use tools; some even build them. But only humans build tools so that they can build tools that are better still. Then they master them until they blur the boundary between the self and the external world. From the warrior’s sword to the farmer’s plow to the commuter’s car, people turn tools into iconic extensions of themselves. Today, the mobile phone represents the first tool in history that a majority of people carry with them everywhere, serving as a completely personalized and immediately responsive extension of their will.8
› Coordination. Humans are social animals: They take pride in earning the respect of friends; they are unsettled when they are not in harmony with their tribes, however defined. They use emotionally motivated conversation to coordinate mutually beneficial tasks, including bartering for exchange. Financial services, travel, retail — these modern industries exist because we continue developing more sophisticated mechanisms to satisfy our coordination needs. Current and emerging technology, from today’s internet of things to tomorrow’s cloud-based AI, will accelerate those industries, helping customers get even more value for less effort in these and other verticals.
› Conversation. The language instinct is the human doorway to influencing — and being influenced by — the outside world. In conversation, people exchange meaning, accumulate interpersonal capital, and influence the emotional landscape of others. Today’s technology takes conversation to a new level, letting consumers converse with chatbots, digital assistants, and technology-enhanced employees of the brands that they love.9 Ironically, this technology makes brand conversations more human and more satisfying than before.
› emotion. Emotion is the evolutionary adaptation that directs people’s attention, maintains their focus, and prioritizes their memories. Without it, people can’t make decisions. But this makes it feel like emotion happens to them as an independent force. So while the near-term wave of new technologies will help consumers identify what they are feeling, a more distant wave will actually guide them to take ownership of their emotional experience, shaping it and directing it rather than merely acceding to its direction.

For B2C Marketing ProFessionals
The Consumer Tech Stackapril 5, 2018
© 2018 Forrester research, inc. Unauthorized copying or distributing is a violation of copyright law. [email protected] or +1 866-367-7378
4
Our 2018 US Benchmark Data Overview Reveals The Four Forces Of Adoption
TOOLSHow we make ourworld more useful
EMOTIONHow we know what
to care about
CONVERSATIONHow we connectwith each other
COORDINATIONHow we getthings done
Four Basic Forces In Evolution Prepared Consumers For The Shift
Use empowerment, Journey, And Context Data To Anticipate The Shift
The most successful technologies of the past and those currently blossoming — the smartphone, Facebook, Amazon’s Alexa — succeeded because they exploited and expanded human abilities in all four basic forces. Think of Apple offering Facetime to let grandparents converse with grandchildren, Facebook organizing all personal and commercial tasks in a single social feed, and Amazon building the Echo tools in a way that will become emotionally personal to users over time. The next technologies, such as AI, automation, and everything else about to hit your business, must marshal these four forces in a way that is aware of and responsive to the behaviors your customers have already established in their digital lives. This includes each customer’s:
For B2C Marketing ProFessionals
The Consumer Tech Stackapril 5, 2018
© 2018 Forrester research, inc. Unauthorized copying or distributing is a violation of copyright law. [email protected] or +1 866-367-7378
5
Our 2018 US Benchmark Data Overview Reveals The Four Forces Of Adoption
› Level of empowerment. Forrester’s Empowered Customer Segmentation quantifies the critical changes in technology attitudes and behaviors that discriminate between your most empowered customers and those who are following behind them. Empowered customers are open to new experiences; can easily seek, evaluate, and share information; and are willing to take ownership of their decisions to ensure the best possible experience. In short, they’re ready for the technology-based, emotion-rich conversations we describe here. Use our segmentation to find out how many of them you have access to.10
› Journey through your customer experience. Your customers will use the tech that they have embraced in their journey, but they won’t always use it in the way you intended or in a way that favors you. Brands like United Airlines learned this the hard way when social media users turned this innovative conversation tool against them. You can respond to customers in their journey more effectively if you use methodologies like Forrester’s Customer Experience Index (CX Index™) to measure how your customers are using the tools at their disposal to coordinate tasks that they care about along their journey.11
› Complete context. You can document your customer journey, you can craft a flow that respects the average needs of the average customer, but technology is about to let you measure and respond to the customer’s complete context — their current situation, their preference history, and their internal attitudinal disposition. Serving consumers in full knowledge of this rich, complete context is impossible today. In five years, it will be common.
Prepare For Tomorrow’s Customer Conversations Today
We examine key technology behaviors through the lens of these four basic forces to see how technology is exploiting 3.4 billion years of human evolution. The data point that 37% of US online adults use chatbots is moderately interesting, but when viewed as the next logical step in the evolution of human conversation, you can see that number for the seismic shift it really is.12 The same is true of all our data, whether it’s people’s emotional understanding of digital privacy or their eagerness to populate their digital homes. It all portends a shift that will change how you serve each individual customer within a richly addressable context.
2018: The Consumer Tech Stack Powers The Shift To Conversations
Consumer technology behaviors are going exactly where the four forces of human evolutionary biology would predict — consumers are basically born for this. In the infographics that follow, we summarize just a sliver of the treasure trove of data available to Technographics clients to reveal consumers’:
For B2C Marketing ProFessionals
The Consumer Tech Stackapril 5, 2018
© 2018 Forrester research, inc. Unauthorized copying or distributing is a violation of copyright law. [email protected] or +1 866-367-7378
6
Our 2018 US Benchmark Data Overview Reveals The Four Forces Of Adoption
› Tools: Consumers have mastered smartphones and wearables. The average US online consumer lives in a multidevice ecosystem that she carries in her hands, wears on her body, and uses to outfit her homes. The smartphone is the pinnacle of this tool mastery: 88% of US online adults use one, enabling them to engage in conversation, coordinate tasks, and fulfill emotional expectations, wherever they are. Wearable devices have evolved to be part of this multitool experience, hitting critical mass in 2018: 32% of US online adults use at least one wearable device, including 43% of consumers in their 30s and 51% of Progressive Pioneers. The smart home is at a similar turning point: 36% of US online adults use a smart TV, 14% use a voice assistant speaker, and 16% use other smart home devices like internet-connected thermostats and audio systems.
› Coordination: People coordinate more tasks on more tools more often. Enabled by tools, people shop, manage their finances, communicate, and entertain themselves. Nearly three-quarters of US online adults shop online regularly. Computers are the go-to device for online shopping: 57% of multidevice shoppers prefer to buy on a computer. The same holds true for managing finances: Multidevice users prefer to use their computers to check financial accounts and pay their bills. But the smartphone is gradually taking over the role of Swiss Army knife for US consumers for more and more tasks. The average US smartphone user uses four categories of apps on a weekly basis, and 55% of US smartphone users agree that their smartphone is more convenient than other devices for getting things done.13
› Conversation: Consumers are ready to shift how they converse and connect. Humans have an innate ability to engage in conversation. Today’s technology helps them do it; tomorrow’s rising technology will do it for them. Today, 48% of US online adults use Facebook Messenger every week, and 40% of US 18- to 29-year-old Facebook users report being on the site “constantly throughout the day.” Technology shapes how people communicate not only with each other but also with companies: 37% of US online adults have used a virtual agent/chatbot for customer service in the past 12 months, and nearly three-quarters of these were satisfied with their experience.14
› emotion: Feelings about technology still run strong. How people feel about technology shapes how they use it. Believing that technology is important is an emotional disposition that nearly half of US online adults agreed with in 2002 and that even more agree with today. As the technologies have changed, the feelings they engender have changed, too. The more empowered consumers are, the more likely they are to feel that they can use tools to get what they want: 69% of US Progressive Pioneers agree that they are more confident about their in-store purchases when they use their smartphone to do research on the spot. Empowerment also has a dark emotional side, seen in the social media pile-ons that occur when technologies fail to fulfill the promises brands make through them.

For B2C Marketing ProFessionals
The Consumer Tech Stackapril 5, 2018
© 2018 Forrester research, inc. Unauthorized copying or distributing is a violation of copyright law. [email protected] or +1 866-367-7378
7
Our 2018 US Benchmark Data Overview Reveals The Four Forces Of Adoption
Base: 100,000 US and Canadian adults*Base: 83,152 US online adults (18+)Source: Forrester Data Technographics® Field Study Dec 1998 (North American Households)*Source: Forrester Data Consumer Technographics Global Online Benchmark Survey (Part 1), 2018
TOOLS
Humans use tools to get things done, employing tools to shape the world around them. Tools are so important that consumers integrate them into their emotional and conversational makeup, making them an important part of their lives. This importance drives people to consider new, improved tools whenever possible.
How we make our world more useful
Consumers have come a long way over the past 20 years. In 1998:
of North Americanhouseholds had a PC
of North Americanhouseholds were “online”
of North American householdshad a broadband connection
48% <1%33%
In 2018, US online adults use multiple connected devices:*
Personal technology:
8% VR headset88% smartphone 56% tablet 32% wearable
14% voice assistantspeaker
16% smart homedevice
90% laptop/desktop 36% smart TV
Home technology:
Consumers Master Tools Like Smartphones And Wearables

For B2C Marketing ProFessionals
The Consumer Tech Stackapril 5, 2018
© 2018 Forrester research, inc. Unauthorized copying or distributing is a violation of copyright law. [email protected] or +1 866-367-7378
8
Our 2018 US Benchmark Data Overview Reveals The Four Forces Of Adoption
†Base: 32,492 US Android smartphone users and 37,054 US iOS smartphone users§Base: 72,978 US smartphone users (18+)†§Source: Forrester Data Consumer Technographics® Global Online Benchmark Survey (Part 1), 2018
Top handset brands:§
8%LG
26%Samsung
51%Apple iPhone
4%Motorola
Top mobile service providers:§
12%T-Mobile
27%AT&T
31%Verizon Wireless
10%Sprint
Emerging technology behaviors by Android versus iOS users:†
Uses smarthome device
15%
20%
Video-chats onsmartphone weekly
21%
33%
39%Android
45%iOS(iPhone)
Useswearable
29%
41%
Uses VRheadset
11%
7%
Consumers Master Tools Like Smartphones And Wearables (Cont.)

For B2C Marketing ProFessionals
The Consumer Tech Stackapril 5, 2018
© 2018 Forrester research, inc. Unauthorized copying or distributing is a violation of copyright law. [email protected] or +1 866-367-7378
9
Our 2018 US Benchmark Data Overview Reveals The Four Forces Of Adoption
*Base: 83,152 US online adults (18+)**Base: 10,778 to 39,848 US online adults (18+) who do the activity mentioned on multiple devices* **Source: Forrester Data Consumer Technographics® Global Online Benchmark Survey (Part 1), 2018‡Source: Forrester Data ConsumerVoices Market Research Online Community, Q3 2014 (US
Connections at home
US online adults’ weekly activity on any device(smartphone, tablet, or computer):*
Stream video/TV shows
Control homemedia devices
Control/monitorhome utilities or
appliances
48% 15% 13%
Device preference:**
Smartphone Tablet Computer
Control/monitor home utilitiesor appliances 66% 13% 20%
Stream video/TV shows 37% 26% 37%
If the purpose of wearable technology is to isolate people and entertain them, I’m not in favor of it. If wearable technology improves a person’s quality of life, it’s a good idea.‡
Female, 55 to 64 years old
Consumers Master Tools Like Smartphones And Wearables (Cont.)
For B2C Marketing ProFessionals
The Consumer Tech Stackapril 5, 2018
© 2018 Forrester research, inc. Unauthorized copying or distributing is a violation of copyright law. [email protected] or +1 866-367-7378
10
Our 2018 US Benchmark Data Overview Reveals The Four Forces Of Adoption
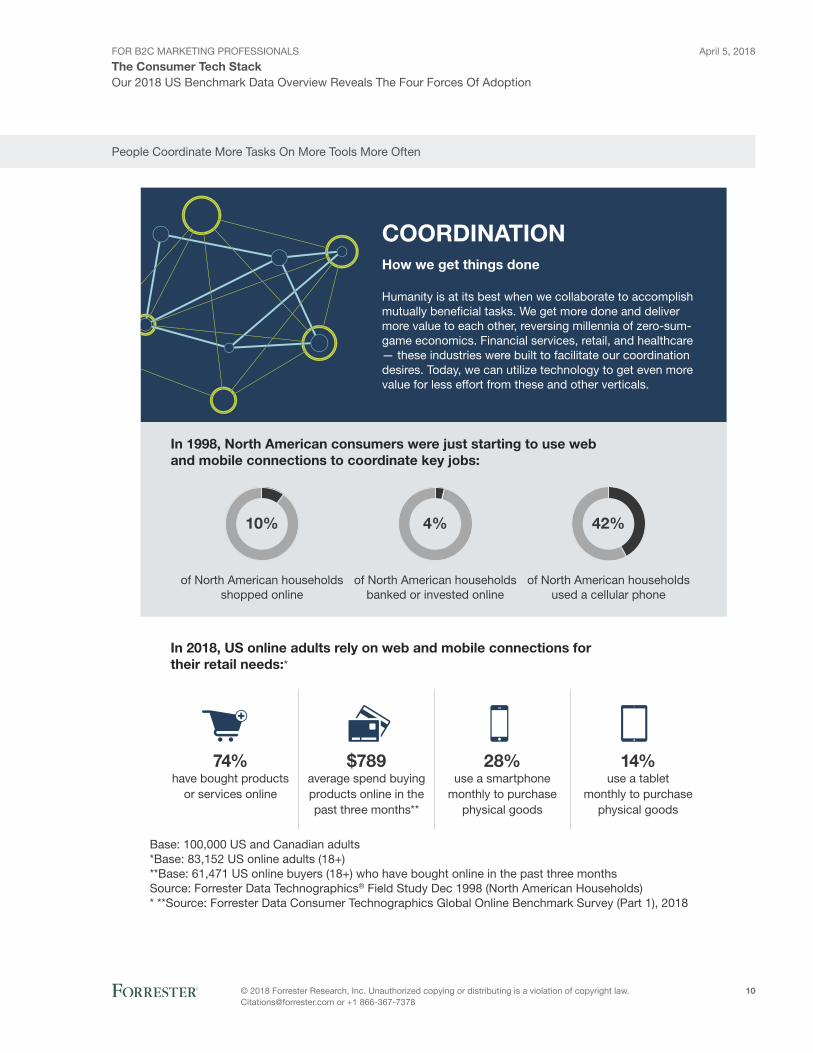
Base: 100,000 US and Canadian adults*Base: 83,152 US online adults (18+)**Base: 61,471 US online buyers (18+) who have bought online in the past three monthsSource: Forrester Data Technographics® Field Study Dec 1998 (North American Households)* **Source: Forrester Data Consumer Technographics Global Online Benchmark Survey (Part 1), 2018
In 2018, US online adults rely on web and mobile connections fortheir retail needs:*
28%use a smartphone
monthly to purchasephysical goods
14%use a tablet
monthly to purchase physical goods
$789average spend buyingproducts online in thepast three months**
74%have bought products
or services online
In 1998, North American consumers were just starting to use web and mobile connections to coordinate key jobs:
of North American householdsshopped online
of North American householdsbanked or invested online
of North American householdsused a cellular phone
10% 42%4%
COORDINATION
Humanity is at its best when we collaborate to accomplish mutually bene�cial tasks. We get more done and deliver more value to each other, reversing millennia of zero-sum- game economics. Financial services, retail, and healthcare — these industries were built to facilitate our coordination desires. Today, we can utilize technology to get even more value for less effort from these and other verticals.
How we get things done
People Coordinate More Tasks On More Tools More Often
For B2C Marketing ProFessionals
The Consumer Tech Stackapril 5, 2018
© 2018 Forrester research, inc. Unauthorized copying or distributing is a violation of copyright law. [email protected] or +1 866-367-7378
11
Our 2018 US Benchmark Data Overview Reveals The Four Forces Of Adoption
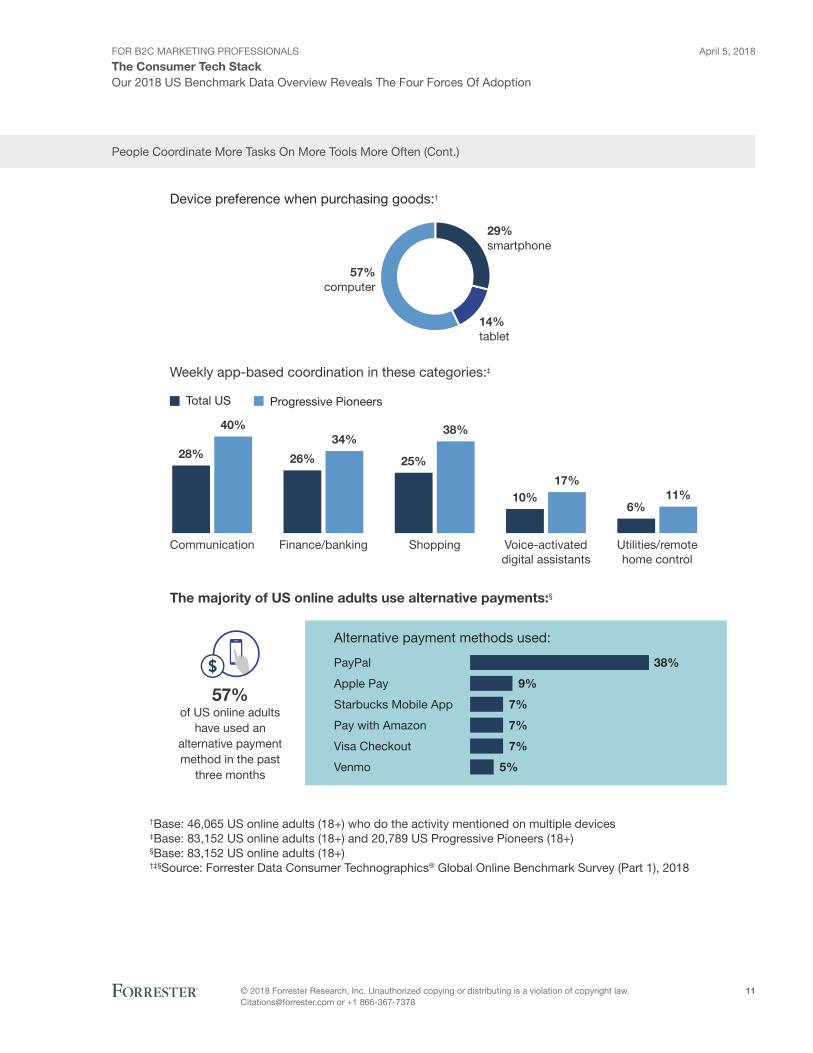
†Base: 46,065 US online adults (18+) who do the activity mentioned on multiple devices‡Base: 83,152 US online adults (18+) and 20,789 US Progressive Pioneers (18+)§Base: 83,152 US online adults (18+)†‡§Source: Forrester Data Consumer Technographics® Global Online Benchmark Survey (Part 1), 2018
Device preference when purchasing goods:†
29%smartphone
14%tablet
57%computer
Weekly app-based coordination in these categories:‡
Total US Progressive Pioneers
Voice-activateddigital assistants
ShoppingFinance/bankingCommunication Utilities/remotehome control
28%
40%
6%11%10%
17%
25%
38%
26%
34%
The majority of US online adults use alternative payments:§
57%of US online adults
have used analternative paymentmethod in the past
three months
Alternative payment methods used:
Venmo
Visa Checkout
Pay with Amazon
Starbucks Mobile App
Apple Pay
PayPal
5%
7%
7%
7%
9%
38%
People Coordinate More Tasks On More Tools More Often (Cont.)

For B2C Marketing ProFessionals
The Consumer Tech Stackapril 5, 2018
© 2018 Forrester research, inc. Unauthorized copying or distributing is a violation of copyright law. [email protected] or +1 866-367-7378
12
Our 2018 US Benchmark Data Overview Reveals The Four Forces Of Adoption
People Coordinate More Tasks On More Tools More Often (Cont.)
§Base: 83,152 US online adults (18+)††Base: 51,106 to 54,778 US online adults (18+) who use multiple devices to do the activity mentioned§††Source: Forrester Data Consumer Technographics® Global Online Benchmark Survey (Part 1), 2018‡‡Source: Forrester Data ConsumerVoices Market Research Online Community, Q3 2014 (US)
I often start activities on my smartphone because it is always right there — it is most easily accessible. When I think of something, I want to make a note of it, so I turn to that easy access point. If the task is longer, then I switch over to
my laptop for quick typing, better Wi-Fi, and a bigger screen.‡‡
Female, 18 to 24 years old
In 2018, US online adults rely on web and mobile connections for personal �nance:§
Check �nancial accounts/statements
Computer Smartphone Tablet
Pay bills
34%45% 13%
31%50% 13%
How multidevice users prefer to get things done:††
34%smartphone
9%tablet
57%computer
27%smartphone
9%tablet
63%computer
Check �nancialaccounts/statements Pay bills

For B2C Marketing ProFessionals
The Consumer Tech Stackapril 5, 2018
© 2018 Forrester research, inc. Unauthorized copying or distributing is a violation of copyright law. [email protected] or +1 866-367-7378
13
Our 2018 US Benchmark Data Overview Reveals The Four Forces Of Adoption
Consumers Are Ready To Shift How They Converse And Connect
US online adults rely heavily on messaging and social media for conversations:*
Facebook Messenger
48%
61%
Snapchat
24%
58%
11%
13%
Weekly engagement: Total US Ages 18 to 29
In 2000, US households were just starting to communicate online:
of US householdswere sending emails
used instantmessaging
participated inonline chat
43% 8%10%
CONVERSATION
The language instinct is the source of the continuing conversation we have in our heads, with the people close to us, and — thanks to technology — with coworkers and loved ones around the world. Our tech also opens new kinds of conversations to us, giving us social media to discuss with each other what matters most or new avenues to connect with brands. And in more and more cases, that connection is happening via chatbots and digital assistants.
How we connect with each other
Base: 81,670 US households*Base: 83,152 US online adults (18+) and 20,527 US online adults (18 to 29)Source: Forrester Data Consumer Technographics® Mail Benchmark Survey, 2000*Source: Forrester Data Consumer Technographics Global Online Benchmark Survey (Part 1), 2018

For B2C Marketing ProFessionals
The Consumer Tech Stackapril 5, 2018
© 2018 Forrester research, inc. Unauthorized copying or distributing is a violation of copyright law. [email protected] or +1 866-367-7378
14
Our 2018 US Benchmark Data Overview Reveals The Four Forces Of Adoption
Note: Data from the Forrester Data Consumer Technographics® Global Online Benchmark Survey (Part 2), 2018, is preliminary and may be subject to update.†Base: 6,865 to 29,816 US online adults (18+) who use the social network mentioned at least monthly‡Base: 1,386 to 21,906 US online adults ages 18 to 29 or 30+ who use the social network mentionedat least weekly†‡Source: Forrester Data Consumer Technographics Global Online Benchmark Survey (Part 2), 2018
28%
15%
14%
7%
8%
4%
38%
19%
40%
25%
36%
Snapchat
16%
18 to 29years old
30+years old
% who use social networks constantly throughout the day:‡
5%
11% 22% 62%
Twitter 19% 24% 25% 31%
Snapchat 29% 29% 23% 19%
Pinterest 9% 15% 26% 50%
Instagram 28% 32% 20% 21%
Facebook 29% 35% 20% 16%
Once a dayFew times a dayConstantly throughout the day Less than daily
Continuous communication via these key social networks:†
Consumers Are Ready To Shift How They Converse And Connect (Cont.)

For B2C Marketing ProFessionals
The Consumer Tech Stackapril 5, 2018
© 2018 Forrester research, inc. Unauthorized copying or distributing is a violation of copyright law. [email protected] or +1 866-367-7378
15
Our 2018 US Benchmark Data Overview Reveals The Four Forces Of Adoption
Note: Data from the Forrester Data Consumer Technographics® Global Online Benchmark Survey (Part 2), 2018, is preliminary and may be subject to update.Base: 81,670 US households§Base: 41,187 US online adults (18+)§Source: Forrester Data Consumer Technographics Global Online Benchmark Survey (Part 2), 2018
In 2018, consumers converse with chatbots, digital assistants, and tech-enhanced employees of the brands that they love:§
Interested in using a voice assistant speaker for:
14%
29%
34%
35%
41%
47%
Financial
Retail
Entertainment
Communication
Information
Life management
14%of US online
adults use voiceassistant speakers
Consumers Are Ready To Shift How They Converse And Connect (Cont.)

For B2C Marketing ProFessionals
The Consumer Tech Stackapril 5, 2018
© 2018 Forrester research, inc. Unauthorized copying or distributing is a violation of copyright law. [email protected] or +1 866-367-7378
16
Our 2018 US Benchmark Data Overview Reveals The Four Forces Of Adoption
**Base: 2,134 US online adults (18+) and 1,122 US Progressive Pioneers (18+) who have used a virtualagent or chatbot on a website or smartphone in the past 12 months††Base: 83,152 US online adults (18+) and 20,789 US Progressive Pioneers (18+)‡‡Base: 5,825 US online adults (18+) and 1,722 US Progressive Pioneers (18+)**‡‡Source: Forrester Data Consumer Technographics North American Retail And Travel Customer Life Cycle Survey, Q1 2017 (US)††Source: Forrester Data Consumer Technographics® Global Online Benchmark Survey (Part 1), 2018§§Source: Forrester Data ConsumerVoices Market Research Online Community, Q4 2017 (US)
Twitter is my best friend, because it always keeps me updated on the latest news and makes sure I’m never out of the loop, and is always there for me when I need a laugh. I would miss Twitter if it
ever disappeared, and I would be devastated not to have it in my life anymore.§§
Female, 35 to 44 years old
Progressive Pioneers lead when it comes to using digital customer service tools like chatbots or digital agents:
Total US Progressive Pioneers
36%59%
72%87%
34%64%
Satis�ed using anonline virtual agent orchatbot service in the
past 12 months**
Prefer to use digitalcustomer servicerather than speak
with a live person ona telephone‡‡
Use social networkingsites to get customer
support (at least weekly)††
Consumers Are Ready To Shift How They Converse And Connect (Cont.)

For B2C Marketing ProFessionals
The Consumer Tech Stackapril 5, 2018
© 2018 Forrester research, inc. Unauthorized copying or distributing is a violation of copyright law. [email protected] or +1 866-367-7378
17
Our 2018 US Benchmark Data Overview Reveals The Four Forces Of Adoption
Base: 8,420 to 83,152 US online adults (18+)Source: Forrester Data Consumer Technographics® Mail Benchmark Survey, 2002 and Forrester Data Consumer Technographics Global Online Benchmark Survey (Part 1), 2018
Despite changes in technology over time, its importance remains consistent:
Percent agreeing that“Technology is important to me” 66%2018
2002 49%
EMOTION
Emotion commands our attention, directs our focus, and prioritizes our memories. Applied to technology, it guides us toward technologies we feel we can use and away from those we don’t yet feel equipped to master. In some cases, we trust the technology; in others, we use the technology to assign trust to key brands and services. Once we master speci�c tools, we can use them to tap into speci�c emotions — ambition, pride, and con�dence — to get what we want.
How we know what to care about
Emotions About Technology Still Run Strong
For B2C Marketing ProFessionals
The Consumer Tech Stackapril 5, 2018
© 2018 Forrester research, inc. Unauthorized copying or distributing is a violation of copyright law. [email protected] or +1 866-367-7378
18
Our 2018 US Benchmark Data Overview Reveals The Four Forces Of Adoption
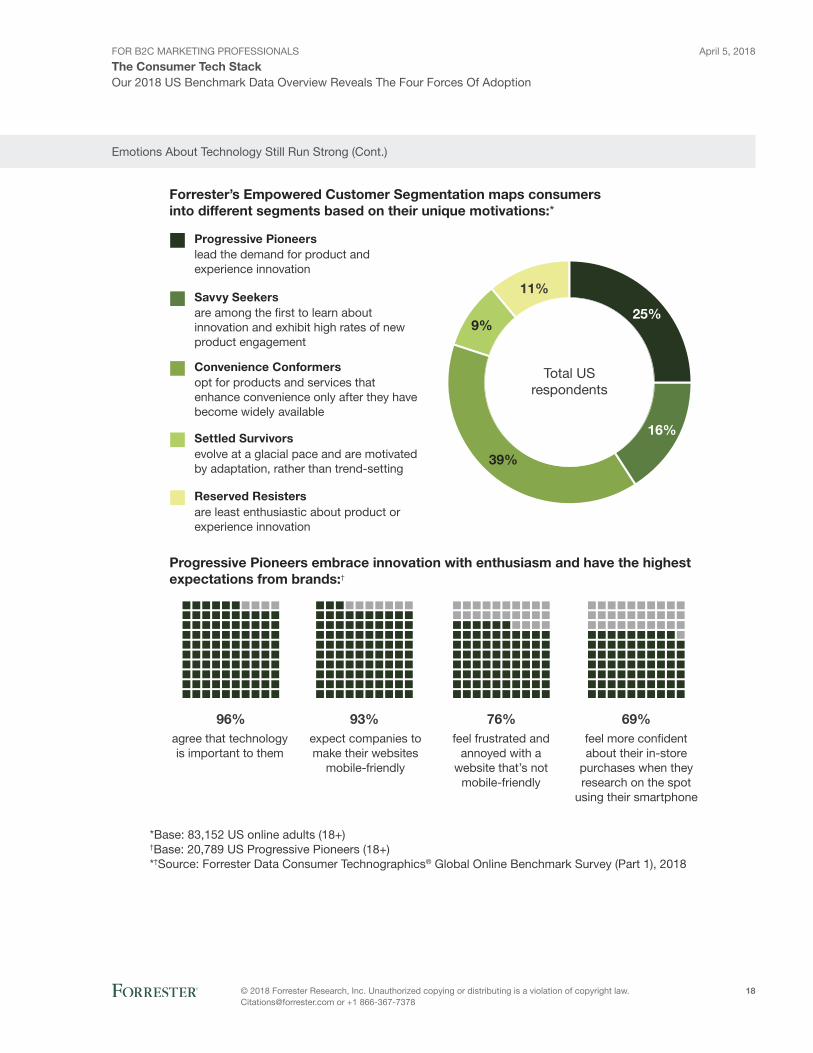
*Base: 83,152 US online adults (18+)†Base: 20,789 US Progressive Pioneers (18+)*†Source: Forrester Data Consumer Technographics® Global Online Benchmark Survey (Part 1), 2018
Savvy Seekersare among the �rst to learn about innovation and exhibit high rates of new product engagement
Convenience Conformersopt for products and services that enhance convenience only after they have become widely available
Settled Survivorsevolve at a glacial pace and are motivated by adaptation, rather than trend-setting
Progressive Pioneerslead the demand for product and experience innovation
Reserved Resistersare least enthusiastic about product or experience innovation
11%
9%
16%
39%
25%
Total USrespondents
Forrester’s Empowered Customer Segmentation maps consumers into different segments based on their unique motivations:*
Progressive Pioneers embrace innovation with enthusiasm and have the highestexpectations from brands:†
69%feel more con�dent about their in-store
purchases when they research on the spot
using their smartphone
76%feel frustrated and
annoyed with a website that’s not
mobile-friendly
96%agree that technology is important to them
93%expect companies to make their websites
mobile-friendly
Emotions About Technology Still Run Strong (Cont.)

For B2C Marketing ProFessionals
The Consumer Tech Stackapril 5, 2018
© 2018 Forrester research, inc. Unauthorized copying or distributing is a violation of copyright law. [email protected] or +1 866-367-7378
19
Our 2018 US Benchmark Data Overview Reveals The Four Forces Of Adoption
‡Base: 118,992 US online consumers (18+) who interacted with a speci�c brand within the past 12 months‡Source: Forrester Data Customer Experience Index Online Survey, US Consumers 2017§Source: Forrester Data ConsumerVoices Market Research Online Community, Q4 2017 (US)
I think interacting with a bot can feel really impersonal. If you are already ticked off at a company, then �nding yourself on the line with a bot might tip you over the edge —
“I’m not even important enough to these people to rate a human being.”§
Female, 35 to 44 years old
Cross-channel experiences elicit more positive emotion:‡
Percent of customers with positive emotions after an interaction with a brand byinteraction channel
Full-service investment 67% 58% 68%
Auto manufacturer
Traditional retailer
Nondigital Digital Combined
58%
50%
55%
55%
64%
Traditional retail bank 60% 53% 66%
61%
Emotions About Technology Still Run Strong (Cont.)
You’ve Seen Consumers’ Tech Stack; Now Help Them Use It
In the age of the customer, this level of knowledge about the customer — how they feel, what conversations they want to have, how they want to get things done, and what tools they will choose to do it — must be your guiding light. Now that you know what people are doing, we recommend you:
› Stay one step ahead of your customer’s tools. You can’t serve customers through tools that are a mystery to you. We can tell you which technologies your customers have and how the tools empower them to not just replace an old behavior but instead enable entirely new behaviors and expectations. You can build an Alexa skill, as Ally Bank did to serve a test bed of Millennial customers, but make sure you’re measuring the new interactions that the voice assistant enables as much as the traditional transactions that the tool accomplishes.

For B2C Marketing ProFessionals
The Consumer Tech Stackapril 5, 2018
© 2018 Forrester research, inc. Unauthorized copying or distributing is a violation of copyright law. [email protected] or +1 866-367-7378
20
Our 2018 US Benchmark Data Overview Reveals The Four Forces Of Adoption
› map the conversations you will build onto your customer journey. Most successful journey maps are deficient in this key way: They don’t explicitly plot out the opportunities for high-emotion conversations along the way. Reexamine a journey map, imagining how a customer would describe what they’re trying to accomplish or coordinate at each point in the journey. Put their coordination task into words they might use in the conversation. Now envision how you would intervene in the journey to have that conversation using the tools available to them — whether it’s a chatbot, a voice assistant, or a call center agent. Now go test those conversations with real customers and see if they are authentic and helpful.
› Live the customer’s coordination burden. Lee Iacocca famously made the Ford Mustang’s design team put on fake nails to try to operate the stylish car from a different customer’s perspective.15 Trying to live your customer’s coordination burden this way builds empathy, which is nice, but it also identifies specific improvements that you must make to improve the experience. Use your own products the way your customers would use them, with the tools they would use, and see what conversations that experience inspires. Here’s a hint: If your feel the urge to curse your own experience, you’ve spotted an issue worth fixing.
› Deepen emotion by embracing customer obsession as a cultural mode. Having a customer-obsessed culture that understands and responds to emotion requires top leaders to send the right cultural signals. On the one hand is Prudential Singapore, where the CEO told his direct reports that he wanted them to talk to a customer each week and be prepared to tell him about that customer when he saw them next. On the other hand, we know of a large energy company that is currently spending millions on a refresh of its corporate values but has left the word “customer” out of the new values entirely.
How Forrester Can Help
Forrester Data Delivers A Comprehensive View Of Consumers
Our deep dive into consumer attitudes, sentiment, and shifting behaviors and their impact on organizations demonstrates that business professionals who want to understand patterns of behavior and nuances in consumer activity must examine qualitative data alongside other data sources. Forrester can draw on a variety of sources:
› Survey data and insights. Our Consumer and Business Technographics surveys, online qualitative insights from our market research online community, and social listening data help you understand what your customers do, how they do it, and why. A 360-degree study of your consumers that leverages these qualitative and quantitative insights will give you a more comprehensive analysis of individual behaviors, mindset, and motivations, which is critical to understanding how they will evolve.

For B2C Marketing ProFessionals
The Consumer Tech Stackapril 5, 2018
© 2018 Forrester research, inc. Unauthorized copying or distributing is a violation of copyright law. [email protected] or +1 866-367-7378
21
Our 2018 US Benchmark Data Overview Reveals The Four Forces Of Adoption
› Forrester’s empowered Customer Segmentation. This measures how individuals evolve along five dimensions of change. On the one hand, Progressive Pioneers rapidly evolve and feel most empowered; on the other, Reserved Resisters refuse change and innovation. A deep dive into the empowered customer segments reveals a latent opportunity for brands to refine, expand, and deepen their relationships with their most empowered consumers. To learn more about the empowered customer, read The Rise Of The Empowered Customer or contact your account manager.
› Forrester’s CX Index. An annual benchmark of customer experience quality among large global brands, Forrester’s CX Index is based on our proprietary consumer survey data. Criteria for CX Index rankings include how effectively respondents felt their needs were met and how they assessed the ease and enjoyability of their experiences. We can provide deep, holistic insights; competitive benchmarking; actionable, industry-specific drivers; and modeling and revenue simulation. To learn more about the CX Index, read The US Customer Experience Index, 2017 or contact your account manager.
Engage With An Analyst
Gain greater confidence in your decisions by working with Forrester thought leaders to apply our research to your specific business and technology initiatives.
Forrester’s research apps for iOS and Android.Stay ahead of your competition no matter where you are.
Analyst Inquiry
To help you put research into practice, connect with an analyst to discuss your questions in a 30-minute phone session — or opt for a response via email.
Learn more.
Analyst Advisory
Translate research into action by working with an analyst on a specific engagement in the form of custom strategy sessions, workshops, or speeches.
Learn more.
Webinar
Join our online sessions on the latest research affecting your business. Each call includes analyst Q&A and slides and is available on-demand.
Learn more.

For B2C Marketing ProFessionals
The Consumer Tech Stackapril 5, 2018
© 2018 Forrester research, inc. Unauthorized copying or distributing is a violation of copyright law. [email protected] or +1 866-367-7378
22
Our 2018 US Benchmark Data Overview Reveals The Four Forces Of Adoption
Supplemental Material
Survey methodology
The Forrester Data Consumer Technographics Global Online Benchmark Survey (Part 1), 2018, was fielded from November 2017 through February 2018. This online survey included 83,152 respondents in the US and 10,916 respondents in Canada between the ages of 18 and 88. For results based on a randomly chosen sample of this size, there is 95% confidence that the results have a statistical precision of plus or minus 0.3% of what they would be if the entire population of US online adults (defined as those online weekly or more often) had been surveyed and plus or minus 0.9% of what they would be if the entire population of Canadian online adults had been surveyed.
Forrester weighted the data by age, gender, income, region, and broadband adoption to demographically represent the US and Canadian online adult populations. The survey sample size, when weighted, was 83,152 in the US and 10,916 in Canada. (Note: Weighted sample sizes can be different from the actual number of respondents to account for individuals generally underrepresented in online panels.) The programming language herein reflects the survey respondent base for each question. Bases for specific questions have been changed in published data for increased clarity. Therefore, the base in published data may not match the base language in this document. Research Now fielded this survey on behalf of Forrester. Survey respondent incentives include points redeemable for gift certificates.
Note: Data from the Forrester Data Consumer Technographics Global Online Benchmark Survey (Part 2), 2018, is preliminary and may be subject to update.
For Technographics Clients: How To Get more Technographics Data Insights
The Forrester Data Consumer Technographics Global Online Benchmark Survey (Part 1), 2018, includes many additional questions and parameters by which you can analyze the data contained in this report.
We can provide additional insights about the consumers highlighted in this report:
› Who they are (e.g., demographics, lifestyle, and interests).
› What they do (e.g., digital, mobile, and social behaviors).
› Affiliations they have (e.g., brands used and products owned).
› How they feel (e.g., attitudes and interests).
If you wish to subscribe to Forrester Data Consumer Technographics services, please contact your account manager or [email protected]. If you are an existing Technographics client, please contact your data advisor at [email protected].
You can find more information about the data on the Survey & Data page online. From this page, you will be able to download the Survey Instrument.

For B2C Marketing ProFessionals
The Consumer Tech Stackapril 5, 2018
© 2018 Forrester research, inc. Unauthorized copying or distributing is a violation of copyright law. [email protected] or +1 866-367-7378
23
Our 2018 US Benchmark Data Overview Reveals The Four Forces Of Adoption
Endnotes1 Based on 100,000 US and Canadian adults surveyed in Forrester Data Technographics Field Study Dec 1998 (North
American Households). Source: Forrester Research January 1999 report “Consumers’ Digital Decade” and Forrester Data Technographics Field Study Dec 1998 (North American Households).
2 Some 74% of US online adults bought products online in the past three months. Source: Forrester Data Consumer Technographics Global Online Benchmark Survey (Part 1), 2018.
3 Some 32% of US online adults say they use a smartwatch, fitness tracker, or other wearable device. Source: Forrester Data Consumer Technographics Global Online Benchmark Survey (Part 1), 2018.
4 Progressive Pioneers are the most empowered segment of Forrester’s Empowered Consumer segmentation. They lead the demand for product and experience innovation. Source: Forrester Data Consumer Technographics Global Online Benchmark Survey (Part 1), 2018. For more information, see the Forrester report “The State Of Empowered Customers And Technology: Benchmark 2017, Global.”
5 Source: Forrester Data Consumer Technographics North American Retail And Travel Survey, Q4 2017 (US).
6 Some 28% of US online adults say they would trust a bank or credit card issuer to provide a mobile digital wallet. The same percentage said they would trust Amazon to do so, while only 26% said they would trust a payment card network like Visa or MasterCard to provide a mobile digital wallet service. Source: Forrester Data Consumer Technographics North American Online Benchmark Survey (Part 2), 2017.
7 We present the four basic forces starting from the point furthest away from the center of the self — the tools or technologies — and coming closer through the social or coordinating force, then the conversation force, then finally the emotional force where the customer’s internal sense of self is rawest.
8 And one that they people are increasingly unable to live without, creating a new diagnosis, nomophobia, for the fear of not being able to use your mobile phone. Source: Sandee LaMotte, “Smartphone addiction could be changing your brain,” CNN, December 1, 2017 (https://edition.cnn.com/2017/11/30/health/smartphone-addiction-study/index.html).
Some 88% of US online adults use a smartphone. Source: Forrester Data Consumer Technographics Global Online Benchmark Survey (Part 1), 2018.
9 Brands are being drawn into consumer conversations on social media all the time, highlighting how much is at risk for brands that don’t join their own customer conversations. See the Forrester report “Mine The Emotions Behind Your Consumers’ Social Media Behaviors.”
10 Your suspicion that consumers are using technology to become more empowered is true. Our Empowered Customer Segmentation helps you track how your customers evolve toward increased empowerment. See the Forrester report “The Rise Of The Empowered Customer.”
11 Forrester reveals the complete rankings of all 314 brands across 21 industries in the US CX Index 2017, amid some surprising trends in CX quality and the role that emotion plays in CX. See the Forrester report “The US Customer Experience Index, 2017.”
It’s important to note that the journey relies on tech but is not purely digital; in fact, customers prefer a hybrid digital/physical experience. See the Forrester report “Customers Prefer Hybrid Digital/Physical Experiences.”
12 Some 37% of US online adults say they have used a virtual agent or chatbot on a smartphone or website in the past 12 months. Source: Forrester Data Consumer Technographics North American Retail And Travel Customer Life Cycle Survey, Q1 2017 (US).
13 Source: Forrester Data Consumer Technographics Global Online Benchmark Survey (Part 1), 2018.

For B2C Marketing ProFessionals
The Consumer Tech Stackapril 5, 2018
© 2018 Forrester research, inc. Unauthorized copying or distributing is a violation of copyright law. [email protected] or +1 866-367-7378
24
Our 2018 US Benchmark Data Overview Reveals The Four Forces Of Adoption
14 Source: Forrester Data Consumer Technographics North American Retail And Travel Customer Life Cycle Survey, Q1 2017 (US).
15 Iacocca’s example was legendary but still had men pretending to be women to design a woman-friendly car. A more recent — and more modern — example has women designing the car themselves. Source: Karla Pincott, “Is this the headrest of the future?” CarsGuide, January 12, 2007 (https://www.carsguide.com.au/car-news/is-this-the-headrest-of-the-future-14513).

We work with business and technology leaders to develop customer-obsessed strategies that drive growth.
Products and services
› core research and tools › data and analytics › Peer collaboration › analyst engagement › consulting › events
Forrester research (nasdaq: Forr) is one of the most influential research and advisory firms in the world. We work with business and technology leaders to develop customer-obsessed strategies that drive growth. through proprietary research, data, custom consulting, exclusive executive peer groups, and events, the Forrester experience is about a singular and powerful purpose: to challenge the thinking of our clients to help them lead change in their organizations. For more information, visit forrester.com.
client suPPort
For information on hard-copy or electronic reprints, please contact client support at +1 866-367-7378, +1 617-613-5730, or [email protected]. We offer quantity discounts and special pricing for academic and nonprofit institutions.
Forrester’s research and insights are tailored to your role and critical business initiatives.
roles We serve
Marketing & Strategy ProfessionalscMoB2B Marketing
› B2c Marketingcustomer experiencecustomer insightseBusiness & channel strategy
Technology Management Professionalscioapplication development & deliveryenterprise architectureinfrastructure & operationssecurity & risksourcing & vendor Management
Technology Industry Professionalsanalyst relations
142891