The Connecticut Department of Children and … · 2007‐2010 Project Evaluation: The Connecticut...
14
The Connecticut Department of Children and Families (DCF)/Head Start Partnership 2007‐2010 Project Evaluation August 1, 2010 Iva Kosutic Marisol Garcia Jessica Sanderson
Transcript of The Connecticut Department of Children and … · 2007‐2010 Project Evaluation: The Connecticut...

The Connecticut Department of Children and Families (DCF)/Head Start Partnership
2007‐2010 Project Evaluation
August 1, 2010
Iva Kosutic
Marisol Garcia
Jessica Sanderson

2007‐2010 Project Evaluation: The Connecticut Department of Children and Families (DCF)/Head Start Partnership
Prepared for
Grace‐Ann C. Whitney Connecticut Head Start State Collaboration Office
Hartford, Connecticut by
Iva Kosutic, MA • Marisol Garcia, MA • Jessica Sanderson, MA
August 1, 2010

Page 1
The Connecticut DCF/Head Start Partnership 20072010 Project Evaluation
INTRODUCTION This report describes the 2007‐2010 evaluation of the collaboration initiative between Head Start in the State of Connecticut and the Department of Children and Families (DCF), the state’s child welfare system. The purpose of this evaluation was to explore the nature of the DCF/Head Start Partnership in the period between 2007 and the spring of 2010. More specifically, the evaluation sought to explore changes over time in the level of activities to (1) build trust and partnership between DCF and Head Start, (2) maintain on‐going collaboration, and (3) improve services to families.
InterAgency Collaboration A number of definitions have been offered to describe inter‐agency collaboration. Most broadly, it can be defined as an exchange of information or resources among staff members from different types of agencies. In regards to child welfare, inter‐agency collaboration can be defined as “the process of agencies and families joining together for the purpose of interdependent problem solving that focuses on improving services to children and families” (Hodges, Nesman, & Hernandez, 1999, p. 8).
Collaboration can occur on multiple levels, from frontline interactions among caseworkers, teachers, and mental health providers, to collaborative relationships among policy makers and administrators responsible for carrying out organizational mandates, managing finances, and implementing programming (Usher, Franklin, & Cohen, 2008). The need for inter‐agency collaboration for particular populations of children has been noted in the literature. It includes references to children involved in the child welfare system (Harburger & White, 2004; Jonson‐Reid, Kim, Barolak, et al., 2007); children involved in the juvenile justice system (Bullock, Little, Milham, 1998); and children with special education needs (Farmakopoulou, 2002), mental health problems (Prince & Austin, 2005), and physical disabilities. On the whole, inter‐agency collaborations can take a number of forms, involve multiple levels of agency systems, and provide a range of services to various populations of children.
Agencies enter into collaborative relationships for a number of reasons. Not surprisingly, different theoretical frameworks have been used to explain why and how this happens. Social exchange theorists suggest that inter‐agency collaborations are formed when members of organizations perceive mutual benefits and gains from working together (Levine & White, 1961). This is often true of collaborations between agencies providing services to children and families. For decades, child welfare policy and practice have recognized that the children they serve have a variety of needs linked to multiple systems of care (i.e., home, school, and community). For example, children and their families have emotional, health, educational, and legal needs, and no single agency has ever been comprehensive enough to meet all of these needs (Usher et al., 2008). Resource dependency theorists offer another explanation for the formation of inter‐agency collaborations. They suggest that when resources are scarce, organizations collaborate to ensure survival (Benson, 1975). For example, when faced with budget cuts two organizations might be forced to work together to provide services to families in a more cost effective manner. Finally, political economy theorists suggest that the wider economic and political climate influences inter‐agency collaborations. For instance, agencies might collaborate as a result of a new policy, legal mandate, or social directive from a higher authority (Benson, 1975). Although explanations provided by these theorists are discussed independently from one another, in practice, inter‐agency collaborations typically result from a combination of factors highlighted by each of these theories.
Empirical studies have demonstrated the importance of a number of individual, relational, and organizational variables to successful inter‐agency collaboration. Individual‐level variables such as attitudes, beliefs, knowledge, and perceptions are very important to successful collaboration. Qualitative studies suggest that shared commitment to core values and a belief that the collaboration can be successful promote collaborative practices such as sharing information and resources (Ring & Van de Ven, 1994; Sandfort, 1999). Smith & Morgo‐Wilson (2006) explored factors related to staff members’ willing to engage in inter‐agency collaborations. They found that staff members who see more advantages to the collaboration have more positive attitudes towards it; similarly, staff members who are more confident in their knowledge about how to collaborate are more likely to collaborate with staff from other agencies. Additionally, they found that staff who perceived that there were more organizational policies surrounding inter‐agency collaboration were also more likely to collaborate.

Page 2
Relationships among staff both within and across agencies are a key ingredient for a successful collaboration. Respect and a positive view of staff from the other agency have been found to be very important. When there is cross‐agency hostility among staff members, information about and interactions with the other agency are often interpreted negatively (Sandfort, 1999).
Finally, organizational‐level variables such as stable inter‐agency structures and policies reinforcing the collaboration (Johnson, Zorn, Yung Tam, LaMontagne, & Johnson, 2003), the adequate allocation of resources, and agreed upon confidentiality policies and practices have been linked to successful inter‐agency collaborations (Hetherington, Baistow, Katz, Mesie, & Trowell, 2002).
Overview of the DCF/Head Start Partnership The unfolding of DCF/Head Start collaboration is best described as taking place in three phases occurring between 1997 and 2010. Phase I covered the period from 1997 through 2001. In 1997, representatives from DCF and Head Start met to discuss ways to improve communication between the two agencies. It was believed that poor communication, inadequate coordination, and distrust were negatively affecting children and families. Both agencies agreed to improve their relationship; however, a specific plan of action was not determined. In 1999, a planning team comprised of both Head Start and DCF staff began meeting regularly to learn about the other agency and to develop a protocol for working together. The resulting protocol was implemented during an initial pilot phase between January 2001 and December 2001, with DCF offices and Head Start programs located in Torrington, Waterbury, and Danbury. As a result of this initial collaboration, both agencies developed new knowledge and understanding of the partner agency’s program; what’s more, they improved communication, developed a more coordinated referral process, and increased services and resources to families.
Unfortunately, by 2007 many of the initial efforts at partnership and protocols for collaboration were no longer being followed. Hence, Phase II of the collaboration initiative began in 2007 following an educational presentation made to top management at each of the 14 DCF offices. As a result of this presentation, six DCF area offices and corresponding Head Start programs decided to participate in the collaboration.i These offices included Danbury, Hartford, Manchester, Norwich, Stamford, and Torrington. The New Britain DCF office joined the collaboration towards the end of Phase II. For sites that participated in Phase I (1997‐2001) of the collaboration, Phase II marked a revival of the original partnerships. Quarterly meetings were reintroduced and used to build relationships among staff from each of the agencies, to foster communication between the agencies, and to provide time and space for staff to work together to develop strategies for effective collaboration.
Finally, Phase III, which began in 2009, involved the addition of six DCF‐Head Start partnerships located in Bridgeport, Meriden, Milford, New Haven, Norwich, and Waterbury. Soon after, the Middletown and Willimantic DCF offices decided to join the collaboration, as well.
Currently, all 14 DCF offices are working collaboratively with Head Start programs in their communities to ensure that children receive comprehensive services. This means that children across the state are benefiting from the collaboration. As a result, staff members from DCF and Head Start programs have developed effective strategies for communicating with one another and coordinating services for children involved in the child welfare system. This coordination of services ensures children’s access to high quality early care and education, increases support and stability for children and families, and, in some cases, it even prevents out‐of‐home placements for children.
The study described in this report examines the nature of DCF/Head Start collaboration in the period between 2007 and the spring of 2010. The study centers on six DCF area offices and the corresponding Head Start programs that started their partnership in 2007, during Phase II of the DCF/Head Start collaboration. The purpose of this study was to explore changes over time in the level of activities to:
(1) build trust and partnership between DCF and Head Start, (2) maintain on‐going collaboration, and (3) improve services to families.
Page 3
METHODS
Participants Participants included DCF and Head Start administrators from six DCF area offices that have been part of the DCF/Head Start Partnership since 2007 and the corresponding Head Start programs. Participating DCF area offices included the following:
(1) Danbury Area Office, (2) Torrington Area Office, (3) Norwich Area Office, (4) Hartford Area Office, (5) Manchester Area Office, and (6) Stamford Area Office.
Participating Head Start programs within the six DCF catchment areas included the following:
(1) Danbury Head Start/Head Start of Northern Fairfield County, (2) Education Connection/Litchfield County Head Start (New Milford), (3) Education Connection/Litchfield County Head Start (Torrington), (4) TVCCA Head Start, (5) CRT Head Start, (6) Enfield Head Start, (7) East Hartford Head Start, and (8) Stamford Head Start.ii
Measures Quantitative and qualitative data collection forms were developed to capture aspects of DCF/Head Start collaboration. DCF/Head Start community teams, organized by DCF catchment areas, were asked to jointly complete the forms during quarterly state‐level meetings.
Quantitative Data
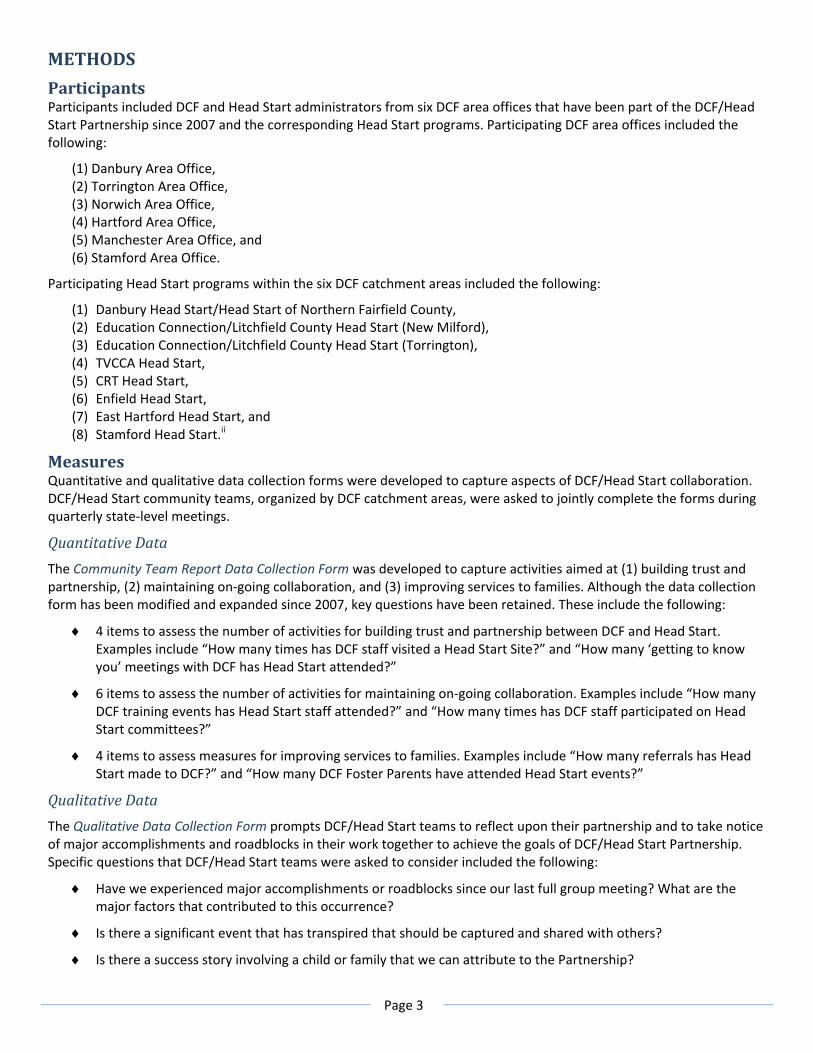
The Community Team Report Data Collection Form was developed to capture activities aimed at (1) building trust and partnership, (2) maintaining on‐going collaboration, and (3) improving services to families. Although the data collection form has been modified and expanded since 2007, key questions have been retained. These include the following:
♦ 4 items to assess the number of activities for building trust and partnership between DCF and Head Start. Examples include “How many times has DCF staff visited a Head Start Site?” and “How many ‘getting to know you’ meetings with DCF has Head Start attended?”
♦ 6 items to assess the number of activities for maintaining on‐going collaboration. Examples include “How many DCF training events has Head Start staff attended?” and “How many times has DCF staff participated on Head Start committees?”
♦ 4 items to assess measures for improving services to families. Examples include “How many referrals has Head Start made to DCF?” and “How many DCF Foster Parents have attended Head Start events?”
Qualitative Data
The Qualitative Data Collection Form prompts DCF/Head Start teams to reflect upon their partnership and to take notice of major accomplishments and roadblocks in their work together to achieve the goals of DCF/Head Start Partnership. Specific questions that DCF/Head Start teams were asked to consider included the following:
♦ Have we experienced major accomplishments or roadblocks since our last full group meeting? What are the major factors that contributed to this occurrence?
♦ Is there a significant event that has transpired that should be captured and shared with others?
♦ Is there a success story involving a child or family that we can attribute to the Partnership?

Page 4
Additionally, the teams were asked to capture anecdotes or famous quotes that represent the impact of the Partnership on children, families, staff, programs, or the community at large.
Qualitative data were coded for themes corresponding to the topics of interest, which is to say building trust and partnership, maintaining on‐going collaboration, and improving services to families.
RESULTS The findings reflect the overarching purpose of this study—namely, exploration of activities to (1) build trust and partnership between DCF and Head Start, (2) maintain on‐going collaboration, and (3) improve services to families. Qualitative and quantitative findings are organized accordingly.
Building Trust and Partnership Qualitative Results
Activities to build trust and partnership included visits to DCF and Head Start sites and “getting to know you” meetings. Participants noted that their “comfort level increased” and that there was an “increased comfort zone” owing to contacts between the two agencies. Participants also noted that there was “increased communication” and “increased support.” As one participant stated,
Now I get on the phone…I have that comfort zone with M[_____]. (Waterbury, 2009)
Furthermore, participants reported that on‐site visits and “getting to know you” meetings helped each agency learn more about each other’s roles, needs, goals, activities, and procedures. Increased knowledge was connected to increased collaboration and involvement, as well as to the building of trust. As one participant stated,
As our collaboration strengthens and we learn more about each other’s agencies, we are starting to become more involved with the other’s agencies. (New London, 2009)
On‐site visits were described as beneficial for resolving difficult case management situations. Participating Head Start administrators reported that these situations were handled more efficiently and positively because a DCF member was on site. As a participant in Enfield 2009 stated,
Our out‐posted DCF worker, who serves on our policy committee, was on‐site participating in the HS self‐assessment. A “situation” occurred with her open DCF case. Because she was on‐site, the entire situation was taken care of quickly. (Enfield, 2009)
Quantitative Results
Figures 1, 2, and 3 illustrate activities aimed at building trust and partnership. These include an aggregate of various activities to foster DCF/Head Start collaboration (Figure 1), visits to DCF and Head Start sites (Figure 2), and “getting to know you” meetings attended by DCF and Head Start staff (Figure 3).
Figure 1 (below) shows changes in the level of various activities aimed at building trust and partnership in the period between 2007 and 2010. Activities portrayed in Figure 1 include visits by Head Start staff to DCF sites, visits by DCF staff to Head Start sites, “getting to know you” meetings attended by Head Start staff, and “getting to know you” meetings attended by DCF staff. As Figure 1 illustrates, the average number of activities to build trust and partnership was characterized by an upward trend over the period under study. In other words, the average number of these activities steadily increased over time, from about 5 visits per quarter in 2007 to over 8 visits per quarter in 2010.

Page 5
Figure 1. Activities to Build Trust & Partnership Between DCF and Head Start
Figure 2 (below) highlights one aspect of efforts to build trust and partnership: Head Start visits to DCF sites and DCF visits to Head Start sites. As shown on Figure 2, average numbers of Head Start visits to DCF (red lines), DCF visits to Head Start (blue lines), and combined Head Start and DCF visits (green lines) increased over time. Interestingly, the average number of DCF visits to Head Start sites was greater at any point in time throughout the period of the study than the average number of Head Start visits to DCF sites. The trend line shows that the average number of DCF visits increased from under 2 to over 4 visits per quarter, whereas the average number of Head Start visits increased from slightly over 1 to about 2 visits per quarter.
Figure 2. Head Start Visits to DCF sites and DCF Visits to Head Start Sites
Figure 3 (below) highlights another aspect of efforts to build trust and partnership: “Getting to know you” meetings attended by Head Start and DCF staff. As Figure 3 shows, the combined average number of “getting to know you” meetings (green lines) evidenced a steady increase over time. Similarly, the average number of meetings attended by DCF staff (blue lines) increased over time. In contrast, however, the average number of meetings attended by Head Start staff (red lines) remained the same over time, averaging at about one meeting per quarter.
.00
2.00
4.00
6.00
8.00
10.00
12.00Average
# of Visits & M
eetings
Yearly Quarters
.00
1.00
2.00
3.00
4.00
5.00
6.00
7.00
8.00
Average
Num
ber of Visits
Yearly Quarters
DCF visits to HS
HS visits to DCF
Combined Visits
Linear (DCF visits to HS)
Linear (HS visits to DCF)
Linear (Combined Visits)

Page 6
Figure 3. “Getting to Know You” Meetings Attended by DCF and Head Start
Overall, the data on efforts to build trust and partnership between DCF and Head Start show increases in average levels of activity over the period under study. That is, both the average number of site visits to the partnering agency and the average number of “getting to know you” meetings have increased over time.
Maintaining OnGoing Collaboration Qualitative Results
Participants identified trainings and participation on Head Start committees as major accomplishments. They regarded these events as important in “spreading the word” about the partnering agency’s programs. As one participant stated,
Head Start has been recruiting and enrolling at the DCF office for the convenience of the DCF workers and two additional DCF workgroups have attended “meet and greets” with the Head Start program, including a tour, to familiarize the workers with the preschools. Head Start was also invited to two radio‐talk shows run by DCF workers to spread the word about our programs to the Hartford area. (Hartford, 2009)
Participants reported that trainings and membership on Head Start committees provided beneficial results for families because DCF staff worked with Head Start staff to provide information regarding investigation, legal, foster, and custody processes. As an example, a Danbury participant stated,
DCF staff visited Head Start to discuss the investigation process. Also discussed was the role of the treatment worker. Head Start staff were given the “parents right to know” pamphlet. Head Start had the opportunity to ask DCF staff questions. (Danbury, 2007)
On‐going collaboration through trainings and committee involvement provided opportunities for joint treatment planning and goal setting. As one participant relayed,
Teams have met to begin to talk about next steps – to connect and develop treatment plans between DCF/HS. (New London, 2008)
Joint home visits were highlighted as especially successful. A participant in Enfield wrote the following:
.00
1.00
2.00
3.00
4.00
5.00
6.00Average
Num
ber of M
eetings
Yearly Quarters
Meetings DCF attended
Meetings HS attended
Combined Visits
Linear (Meetings DCF attended)
Linear (Meetings HS attended)
Linear (Combined Visits)

Page 7
We have implemented joint home visits with DCF social workers and family service workers. This entails a lot of planning, scheduling, and re‐scheduling. Two families have benefited from 3 separate home visits. All have shared goals and treatment plans. In these particular cases, joint home visits have been very beneficial! (Enfield, 2010)
Opportunities to connect with foster care services and/or workers were also listed as major accomplishments. Participants stated that the collaboration process afforded them with the opportunities to reconnect with foster parent recruiters that resulted in increased DCF referrals. As a participant from Torrington noted,
We have recruitment with Policy Council and raised awareness of the need for foster parents. We have successfully recruited a wonderful foster care resource from council. (Torrington, 2009)
Participants noted that major roadblocks to collaboration between DCF and Head Start included (a) time limitations, (b) ability to involve all parties in meetings, and (c) changes in organizational structures in DCF. Additionally, they mentioned the difficulty involved in meeting when personnel changes were made in the DCF organization and when the collaboration group was too large.
Quantitative Results
Figures 4, 5, and 6 show activities aimed at maintaining on‐going collaboration. These include training events attended by DCF and Head Start (Figure 4), trainings provided by DCF and Head Start (Figure 5), and participation on DCF and Head Start committees by members of the other organization (Figure 6).
Figure 4 (below) illustrates changes in the average number of Head Start and DCF training events attended by DCF and Head Start, respectively. As shown, the average number of training events attended by DCF staff (red lines) remained about the same over time, averaging at less than 1 training event per quarter. In contrast, the average number of training events attended by Head Start staff (blue lines) slightly decreased over time, from just over 0.5 to slightly over 0.1 meeting per quarter.
Figure 4. DCF and Head Start Training Events
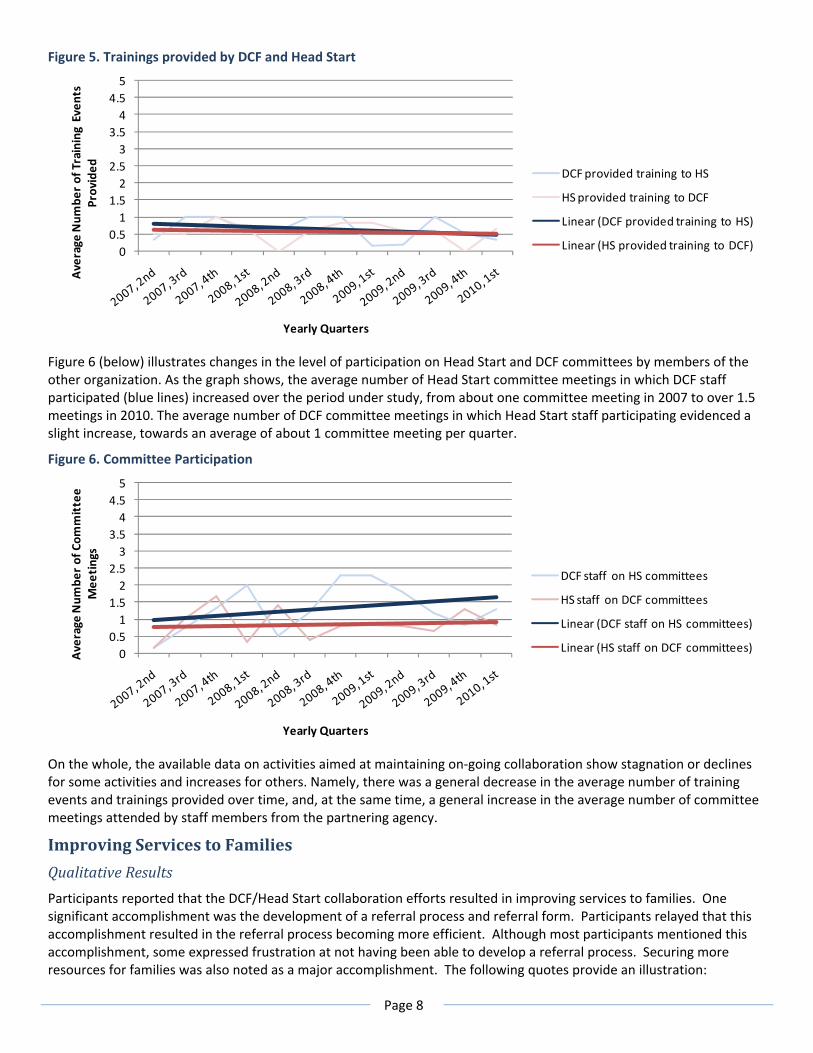
Figure 5 (below) shows the average number of trainings provided by DCF and Head Start to members of the other organization. As shown, the average number of trainings provided by DCF (blue lines) decreased during the period under study, going from just under one to about 0.5 per quarter, whereas the average number of trainings provided by Head Start (red lines) remained about the same, averaging at around 0.5 trainings per quarter.
00.51
1.52
2.53
3.54
4.55
Average
Num
ber of Training Even
ts
Yearly Quarters
DCF training events HS attended
HS training events DCF attended
Linear (DCF training events HS attended)
Linear (HS training events DCF attended)
Page 8
Figure 5. Trainings provided by DCF and Head Start
Figure 6 (below) illustrates changes in the level of participation on Head Start and DCF committees by members of the other organization. As the graph shows, the average number of Head Start committee meetings in which DCF staff participated (blue lines) increased over the period under study, from about one committee meeting in 2007 to over 1.5 meetings in 2010. The average number of DCF committee meetings in which Head Start staff participating evidenced a slight increase, towards an average of about 1 committee meeting per quarter.
Figure 6. Committee Participation
On the whole, the available data on activities aimed at maintaining on‐going collaboration show stagnation or declines for some activities and increases for others. Namely, there was a general decrease in the average number of training events and trainings provided over time, and, at the same time, a general increase in the average number of committee meetings attended by staff members from the partnering agency.
Improving Services to Families Qualitative Results
Participants reported that the DCF/Head Start collaboration efforts resulted in improving services to families. One significant accomplishment was the development of a referral process and referral form. Participants relayed that this accomplishment resulted in the referral process becoming more efficient. Although most participants mentioned this accomplishment, some expressed frustration at not having been able to develop a referral process. Securing more resources for families was also noted as a major accomplishment. The following quotes provide an illustration:
00.51
1.52
2.53
3.54
4.55
Average
Num
ber of Training Even
ts
Provided
Yearly Quarters
DCF provided training to HS
HS provided training to DCF
Linear (DCF provided training to HS)
Linear (HS provided training to DCF)
00.51
1.52
2.53
3.54
4.55
Average
Num
ber of Com
mittee
Mee
tings
Yearly Quarters
DCF staff on HS committees
HS staff on DCF committees
Linear (DCF staff on HS committees)
Linear (HS staff on DCF committees)

Page 9
A HS child, in need of dental treatment will now receive onsite treatment with pediatric dentist because of the collaboration of a DCF social worker and HS health coordinator. (Enfield 2009)
Through the collaborative, LULAC requested help for a family and “flex funds” were applied to child care fees to help a single mom who lives in crisis. (New Haven, 2009)
Joint treatment planning and development of common goals were mentioned as significant improvements to services to families. Some mentioned the success of joint home visits, in particular.
We have implemented joint home visits with DCF social workers and family service workers. This entails a lot of planning, scheduling, and re‐scheduling. Two families have benefited from 3 separate home visits. All have shared goals and treatment plans. In these particular cases, joint home visits have been very beneficial! (Enfield, 2010)
As DCF and Head Start engaged in joint treatment planning and the development of common goals, barriers to services were identified and sources of support were accessed, which, in turn, resulted in an improvement to services provided to families. Here are some examples of that process:
A collaboration meeting identified transportation as a major barrier to a sibling of a special needs child attending HS – HS staff advocated with the LEA and they agreed to allow both children to ride the BOE bus. (Torrington, 2008)
We were able to enroll a child, with special needs and involved with DCF, into one of our Head Start programs half day, after she was kicked out of a public preschool, in preparation for her transition to Kindergarten this September. (Hartford, 2009)
Intervention to arrange a HS student to maintain enrollment while her mother had a second child. Wrap around services were discussed that would support the mother’s transportation and child‐care needs. (Torrington, 2009)
Participants noted that families benefitted from collaboration because they were able to access resources in both agencies. This helped to ensure that services were not interrupted, families were reunited, and parents were able to go back to work. The following is an example of a success story provided:
This is a success story involving a single mom referred to us by DCF. We followed up the referral and placed the first child into EHS. Later on this child transitioned into a HS classroom. Then the youngest one entered into our EHS program. Mean while, mom is working now, she is out of TFR. She is a Policy council Rep and being pregnant again, she has the confidence to look forward to placing her baby in our EHS class as well. She continues to participate in HS and EHS activities. (Stamford, 2009)
Quantitative Results
Figures 7 and 8 illustrate activities aimed at improving services to families through DCF/Head Start collaboration. These include referrals made by Head Start to DCF, referrals made by DCF to Head Start, and DCF foster parents’ participation in Head Start events.
Figure 7 (below) shows the average number of referrals made by Head Start to DCF (blue lines) and referrals made by DCF to Head Start (red lines) over the period under study. As trend lines shown, the average number of Head Start referrals to DCF increased from under 2 referrals per quarter in 2007 to over 7 referrals per quarter in 2009. Similarly, the average number of DCF referrals to Head Start increased from about 3 referrals in 2007 to over 6 referrals in 2009.

Page 10
Figure 7. Referrals Made by Head Start and DCF
Similar to DCF and Head Start referrals to the partnering agency, the graph illustrating Head Start events attended by DCF Foster Parents (Figure 8, below) shows a steady increase over time. The trend line shows that the average number of Head Start events was slightly above 2 events per quarter in 2007 and slightly below 3 events per quarter in 2009. That said, it is worth noting that the pale green line connecting the actual data points shows a great deal of fluctuation, with as many as 6 events per quarter (averaged across DCF catchment areas—e.g., 1st quarter of 2008) and as few as no reported events (3rd and 4th quarters of 2007).
Figure 8. Head Start Events Attended by DCF Foster Parents
Overall, the available data on service improvements indicate large increases in the number of DCF and Head Start referrals to the partnering agency. In contrast, the average number of Head Start events attended by DCF foster parents has been relatively steady over time, fluctuating around 2.5 events per quarter.
SUMMARY AND CONCLUSIONS Site visits and “getting to know you” meetings fostered inter‐agency relationships. In the period between 2007 and the spring of 2010, site visits and “getting to know you” meetings were implemented to build trust and partnership among staff from the two agencies. The average number of activities to build trust and partnership between DCF and Head Start was characterized by an upward trend. Interestingly, DCF visited Head Start sites more often than Head Start visited DCF sites.
0
2
4
6
8
10
12
14Average
Num
ber of Referrals
Yearly Quarters
HS referrals to DCF
DCF referrals to HS
Linear (HS referrals to DCF)
Linear (DCF referrals to HS)
.00
1.00
2.00
3.00
4.00
5.00
6.00
7.00
Average
#
Yearly Quarters

Page 11
As a result of involvement in these activities, participants reported increased comfort interacting with staff from partnering agencies and an improvement in inter‐agency communication. These activities also resulted in increased knowledge and understanding of the partnering agency’s roles, needs, goals, activities, and procedures. In turn, this was connected to greater levels of collaboration, building of trust, increased involvement, and better management of negative experiences. These findings are congruent with literature suggesting that inter‐agency relationships characterized by trust and respect as well as increased understanding and knowledge of the partnering agency are related to successful collaborative practices (Ring & Van de Ven, 1994; Sandfort, 1999).
Training events and committee participation promoted on‐going collaboration. Trainings and committee participation occurred consistently in the period between 2007 and the spring of 2010. Participants identified trainings and participation in committees as major accomplishments. They regarded these events as important in “spreading the word” about the partnering agency’s programs. Trainings and participation in committees were reported to provide beneficial results for families as they provided information regarding investigation, legal, foster, and custody processes. Additionally, they provided opportunities for joint treatment planning and goal setting. Joint home visits were highlighted as especially successful. Opportunities to connect with foster care services and/or workers were also listed as major accomplishments provided by trainings and committee participation. In all, participation in trainings and committees provided opportunities for both agencies to interact, to increase knowledge about the partnering agency, and to develop enhanced strategies for collaborating. Literature suggests that when individuals understand the collaboration process and feel confident in their ability to engage in partnership activities, they are more likely engage in inter‐agency collaborative practices (Smith & Morgo‐Wilson, 2006). Additionally, these trainings are a good example of organizational‐level policy and structures supporting the collaboration. When organization‐level policies and structures support inter‐agency collaboration, collaborative practices are more likely to be successful (Johnson, et al., 2003).
The development of a referral process resulted in an increased number of referrals between agencies. The average number of Head Start referrals to DCF increased from under 2 referrals per quarter in 2007 to over 7 referrals per quarter in 2009. Similarly, the average number of DCF referrals to Head Start increased from about 3 referrals in 2007 to over 6 referrals in 2009. Participants reported that the development of a referral process and referral form were significant accomplishments of the collaboration between DCF and Head Start. Participants reported that this accomplishment resulted in the referral process becoming more efficient. This finding suggests that the DCF/Head Start partnership has enhanced the services provided by each agency and ensured that children in the child welfare system receive quality early care and educational experiences.
Participants reported that collaboration efforts between DCF and HS were successful in securing more resources for families. Joint treatment planning and development of common goals were often mentioned as significant improvements to services to families. Some mentioned the success of joint home visits, in particular. As DCF and Head Start engaged in joint treatment planning and development of common goals, barriers to services were identified and sources of support were accessed, which, in turn, contributed to an improvement to services provided to families.
Participants noted that major barriers to collaboration between DCF and Head Start included (a) time limitations, (b) ability to involve representatives from both agencies in meetings, and (c) changes in DCF organizational structure. Participants mentioned the difficulty involved in meeting when personnel changes were made in the DCF organization and when the collaboration group was too large. Usher and colleagues (2008) reported similar findings in their report on inter‐agency collaboration. They suggested that a lack of time and resources often makes inter‐agency activities difficult. Further, they report that staff turnover and changes can present barriers to successful collaboration. When key individuals resign, are reassigned, or transfer, they take with them institutional knowledge, interpersonal relationships, valuable experiences and credibility.
REFERENCES Benson, J. K. (1975). The inter‐organizational network as a political economy. Administrative Science Quarterly, 20, 229‐
249.
Bullock, R., Little, M., & Milham, S. (1998). Secure treatment outcomes: The care careers of very difficult adolescents. Aldershot: Ashdale Publishing.
Farmakopoulou, N. (2002). Using an integrated theoretical framework for understanding inter‐agency collaboration in the special education system. European Journal of Special Education Needs, 17, 49‐59.

Page 12
Hodges, S., Nesman, T., & Hernandez, M. (1999). Promising practices: Building collaborations in systems of care. Systems of Care: Promising Practices in Children’s Mental Health, 1998 Seroies, Volume 6. Retrieved June 30, 2010. from http://cecp.air/promisingpractices/1998monographs/vol6.pdf
Harburger, D. S., & White, R. (2004). Reunifying families, cutting costs: Housing‐child welfare partnerships for permanent supportive housing. Child Welfare, 133, 493‐508.
Hetherington, R., Baistow, K., Katz, I., Mesie, J., & Trowell, J. (2002). The welfare of children with mentally ill parents: Learning from inter‐county comparisons. Chichester: John Wiley and Sons.
Johnson, L. J., Zorn, D., Yung Tam, B., LaMontagne, M., & Johnson, S. A. (2003). Stakeholders views of factors that impact successful inter‐agency collaboration. Exceptional Child, 69, 195‐209.
Jonson‐Reid, M., Kim, J., Barolak, M., Citerman, B., Laudel, C., Essma, A., Fezzi, N., Green, D., Kontak, D,. Mueller, N., Thomas, C. (2007). Maltreated children in schools: The interface of school social work and child welfare. Children and Schools, 29, 182‐191.
Levine, S., & White, P. (1961). Exchange as a conceptual framework for the study of inter‐organizational relationships. Administrative Science Quarterly, 5, 583‐601.
Prince, J., & Austin, M. ( 2005). Inter‐agency collaboration in child welfare and child mental health systems. Social Work in Mental Health, 4, 1‐16.
Ring, P. S., & Van de Ven, A. H. (1994). Developmental processes of cooperative interorganizational relationships. Academy of Management Review, 19, 90‐118.
Sandfort, J. (1999). The structural impediments to human service collaboration: Examining welfare reform at the front lines, The Social Service Review, 73, 314‐339.
Smith, B. D., & Morgo‐Wilson, C. (2006). Multi‐level influences on the practice of inter‐agency collaboration in child welfare and substance abuse treatment. Children and Youth Services Review, 29, 545‐556.
Usher, L., Franklin, S., & Cohen, E. (2008). Inter‐agency Collaboration: A Closer Look. Report prepared by the National Technical Assistance and Evaluation Center.
END NOTES iFor the purposes of DCF/Head Start collaboration, inter‐agency partnerships are organized according to DCF area offices. Accordingly, each partnership includes one DCF area office and one or more Head Start programs providing services in the same community. iiIn addition to the eight participating Head Start sites, several other sites fall within the six DCF catchment areas (e.g., Manchester Head Start, Stafford Head Start, Manchester Memorial Hospital, EASTCONN Head Start—Vernon, and Greenwich Head Start). Although these sites participate in the DCF/Head Start Partnership, they were excluded from this study because of insufficient data on their engagement in the DCF/Head Start Partnership.