The Confluence Zone of the Intense Katabatic Winds at ...
15
JOURNAL OF GEOPHYSICAL RESEARCH, VOL. 95, NO. D5, PAGES 5495-5509, APRIL 20, 1990 The Confluence Zone of the Intense Katabatic Winds at Terra Nova Bay, Antarctica, as Derived From Airborne Sastrugi Surveys and Mesoscale NumericalModeling DAVID H. BROMWICH Byrd Polar Research Center, Ohio State University, Columbus THOMAS R. PARISH Department of Atmospheric Science,University of Wyoming, Laramie CHRISTIANA. ZORMAN •' Byrd Polar Research Center, Ohio State University, Columbus The surface wind field inlandof the intense coastal kataba!,•c wind regime at Terra Nova Bay, Antarctica, has beenstudied bothobservationally and numerically. Airbornesurveys of wind- induced features on the snow surface have beenused to construct thetime-averaged wintersurface airflow pattern. The surface motion field hasalsobeen simulated by a mesoscale primitive equa- tion model using terrain slopes with a horizontal resolution of 32 km. Both methods of analys!•s demonstrate that the intensekatabatic airstream at Terra Nova Bay is forced by converging air currents in the continental interior. The broadscale confluence zone becomes organized into two regions within about180 km of the coast. The primary routefor katabatic mass transport intothe Terra Nova Bay area is Reeves Glacier valley, but an important secondary source is provided by airflowdown DavidGlacier. The formeris generated by theCoriolis-induced concentration of mass transport on the left side (looking downwind) of the broadscale confluence zone as well as by the near-coastal mountain deflection of airflow into the valley head. The confluence zone feeding intoDavidGlacier valley stretches over 100 km intothe interior and is forced by the broadscale terrain configuration of the ice sheet. Source areas for the two airstreams differ with Reeves Glacier valleybeingfed by coldair formed well into the interior, whereas the airflowdown David Glacier is sustained by radiative cooling over lower parts of the ice sheet which are muchcloser to the Ross Sea. Evaluation of the observational and modeling results reveals boththe strengths and weaknesses of eachapproach. Airbornesurveys of sastrugi orientations are a highlysuccess- ful method for establishing the detailed pattern of surface airflow. However,a systematic exami- nationof sastrugi dimensions suggests that suchwork could also be carriedout usingSPOT-type satellite observations, which is a more cost-effective approach than aircraft surveying. The double-jet structure of katabatic airflow into the Terra Nova Bay area is well represented by the primitiveequation modeling, but much finer gridsare needed to resolve the near-coastal drainage details. 1. INTRODUCTION The continental-scale surface wind field over Antarctica is a keyclimatic component in thesouthern hemisphere whose effects are manifested well into the middle latitudes [James, 1988] and throughout a substantial depthof the atmosphere overlying the continent [Polar Research Board, 1984, p. 10]. Yet description and study of this phenomenon have been severely limited by the continent's remote location and harsh climate. Two recent developments are drastically altering this situation. Automatic weather stations (AWS) which transmitobservations to NOAA polar- orbiting meteorological satellites can be deployed in remote areasand have a high probability of operating successfully throughout the year. The fraction of ice sheet areas moni- Now at Department of Physics, Case Western Reserve University, Cleveland, Ohio. Copyright 1990 by the American Geophysical Union. Paper number 89JD03027. 0148-0227/90/89JD-03027505.00 toted by these units continuesto expand, with the result that surface climatic processes are being diagnosed more completely [Stearns and Wendlet, 1988]. The second development is that the ice sheettopography has been determined with unprecedented precision[Drewry, 1983]; elevations are knownwith an uncertainty of about30 m for the entire continent. Based upon a realization that the prime forcing of Antarctic drainagewinds is gravity acting on radiatively-cooled air over sloping terrain [Parish, 1982], Parishand Bromwich [1987] havediagnosed the pattern of surface airflow over Antarctica from the simple steady state modelof Ball [1960]. Input data con- sisted of terrain slopes at 50-kin resolution and estimates of the boundary layer stratification [Phillpot and Zillman, 1970]. Surface air does not blow radially and uniformly away from the highest partsof the ice sheet, but rather is highlyirregular withregions of pronounced confluence and difiuence. Where negatively buoyant air from a large in- terior sectionof the ice sheet converges, the supply of cold air to sustain katabatic winds blowing down the mar- ginal ice slopes is considerably enhanced [Parish, 1984]. Such confluence regions in the interior wind field are believed to be the prime cause of the intense katabatic winds monitored at Cape Denisonand Port Martin in Adelie Land [Parish, 1981]. The resulting highly irregular trans- port of katabatic air acrossthe Antarctic coastlineis of 5495
Transcript of The Confluence Zone of the Intense Katabatic Winds at ...

JOURNAL OF GEOPHYSICAL RESEARCH, VOL. 95, NO. D5, PAGES 5495-5509, APRIL 20, 1990
The Confluence Zone of the Intense Katabatic Winds at Terra Nova Bay, Antarctica, as Derived From Airborne Sastrugi Surveys
and Mesoscale Numerical Modeling
DAVID H. BROMWICH
Byrd Polar Research Center, Ohio State University, Columbus
THOMAS R. PARISH
Department of Atmospheric Science, University of Wyoming, Laramie
CHRISTIAN A. ZORMAN •'
Byrd Polar Research Center, Ohio State University, Columbus
The surface wind field inland of the intense coastal kataba!,•c wind regime at Terra Nova Bay, Antarctica, has been studied both observationally and numerically. Airborne surveys of wind- induced features on the snow surface have been used to construct the time-averaged winter surface airflow pattern. The surface motion field has also been simulated by a mesoscale primitive equa- tion model using terrain slopes with a horizontal resolution of 32 km. Both methods of analys!•s demonstrate that the intense katabatic airstream at Terra Nova Bay is forced by converging air currents in the continental interior. The broadscale confluence zone becomes organized into two regions within about 180 km of the coast. The primary route for katabatic mass transport into the Terra Nova Bay area is Reeves Glacier valley, but an important secondary source is provided by airflow down David Glacier. The former is generated by the Coriolis-induced concentration of mass transport on the left side (looking downwind) of the broadscale confluence zone as well as by the near-coastal mountain deflection of airflow into the valley head. The confluence zone feeding into David Glacier valley stretches over 100 km into the interior and is forced by the broadscale terrain configuration of the ice sheet. Source areas for the two airstreams differ with Reeves Glacier valley being fed by cold air formed well into the interior, whereas the airflow down David Glacier is sustained by radiative cooling over lower parts of the ice sheet which are much closer to the Ross Sea. Evaluation of the observational and modeling results reveals both the strengths and weaknesses of each approach. Airborne surveys of sastrugi orientations are a highly success- ful method for establishing the detailed pattern of surface airflow. However, a systematic exami- nation of sastrugi dimensions suggests that such work could also be carried out using SPOT-type satellite observations, which is a more cost-effective approach than aircraft surveying. The double-jet structure of katabatic airflow into the Terra Nova Bay area is well represented by the primitive equation modeling, but much finer grids are needed to resolve the near-coastal drainage details.
1. INTRODUCTION
The continental-scale surface wind field over Antarctica is a key climatic component in the southern hemisphere whose effects are manifested well into the middle latitudes [James, 1988] and throughout a substantial depth of the atmosphere overlying the continent [Polar Research Board, 1984, p. 10]. Yet description and study of this phenomenon have been severely limited by the continent's remote location and harsh climate. Two recent developments are drastically altering this situation. Automatic weather stations (AWS) which transmit observations to NOAA polar- orbiting meteorological satellites can be deployed in remote areas and have a high probability of operating successfully throughout the year. The fraction of ice sheet areas moni-
Now at Department of Physics, Case Western Reserve University, Cleveland, Ohio.
Copyright 1990 by the American Geophysical Union.
Paper number 89JD03027. 0148-0227/90/89JD-03027505.00
toted by these units continues to expand, with the result that surface climatic processes are being diagnosed more completely [Stearns and Wendlet, 1988].
The second development is that the ice sheet topography has been determined with unprecedented precision [Drewry, 1983]; elevations are known with an uncertainty of about 30 m for the entire continent. Based upon a realization that the prime forcing of Antarctic drainage winds is gravity acting on radiatively-cooled air over sloping terrain [Parish, 1982], Parish and Bromwich [1987] have diagnosed the pattern of surface airflow over Antarctica from the simple steady state model of Ball [1960]. Input data con- sisted of terrain slopes at 50-kin resolution and estimates of the boundary layer stratification [Phillpot and Zillman, 1970]. Surface air does not blow radially and uniformly away from the highest parts of the ice sheet, but rather is highly irregular with regions of pronounced confluence and difiuence. Where negatively buoyant air from a large in- terior section of the ice sheet converges, the supply of cold air to sustain katabatic winds blowing down the mar- ginal ice slopes is considerably enhanced [Parish, 1984]. Such confluence regions in the interior wind field are believed to be the prime cause of the intense katabatic winds monitored at Cape Denison and Port Martin in Adelie Land [Parish, 1981]. The resulting highly irregular trans- port of katabatic air across the Antarctic coastline is of
5495
5496 BROMWICH ET AL.: TERRA NOVA BAY KATABATIC CONFLUENCE ZONE
supreme importance in determining the effects of the ice age-hardened (sintered) can persist for months [Watanabe, sheet boundary layer circulation upon the atmosphere and the 1978; Okuhira and Narita, 1978, Figure 5]. Because most ocean surrounding the continent. East Antarctic precipitation (approximates deposition) falls
Terra Nova Bay is located downwind of a pronounced con- during winter [Bromwich. 1988] a sastrugi survey conducted fluenee region in the simulated interior wind field of at the end of winter should record sastrugi orientations Parish and Bromwich [1987]. Consistent with the arguments that formed as a result of many past depositional events. outlined above, the coastal katabatic winds are known from As is demonstrated in section 2.3, analyses of such observa- the historical records of Scott's Northern Party. who were tions allow the time-averaged airflow pattern to be con- forced to winter in this area during 1912, to rival those of structed, a technique pioneered by Mather and Miller [1967]. Cape Denison and Port Martin in terms of persistence and Some variability of sastrugi directions will inevitably be strength [Bromwich and Kurtz, 1982, 1984]. Recent AWS observati9ns have shown that the surface wind speed averages 17 ms-" for the fall months of February_tp April with speeds mostly varying between 10 and 30 m s [Bromwich, 1989]. A joint study, directed by the first two co-authors, is being conducted to describe the kinematics and dynamics of this intense katabatic airstream. The investigation is directed toward obtaining an enhanced understanding of coastal katabatic wind regimes which are forced by interior confluence zones; these features seem to dominate the boun- dary layer circulation over the ice sheets of Antarctica.
present in such data sets as a result of atypical but infrequent synoptic forcing [Mather, 1962].
To construct the time-averaged winter surface airflow pattern over the ice slopes west of Terra Nova Bay, airborne photographic surveys of sastrugi orientations were under- taken on November 6, 1986, and November 8. 1987. Early November was chosen as the desirable time period because lighting conditions are favorable for aerial photography, but winter wind conditions still prevail. Both missions were planned and coordinated by Jerry Mullins of the U.S. Geological Survey (USGS) and flown by U.S. Navy personnel
This paper combines observational analysis and numerical using an LC-130 transport aircraft. For both missions the modeling to explore the interior confluence zone which LC-130wasequippedwithaWildRC-8camerawitha152.3mm sustains the intense katabatic winds at Terra Nova Bay; a focal length. The camera was set at a shutter speed of preliminary version of this work was presented by Bromwich 1/300 sec., an ilstop of t:8 and was loaded with Kodak et al. [1988]. The snow surface over the plateau to the Panatomic-X aerographic film 2412. The film was developed west of Terra Nova Bay has been extensively photographed from the air. Section 2 describes these surveys of wind- forced features at the snow-air interface which allow the time-averaged streamlines of surface air motion to be estab- lished with unprecedented spatial resolution. The interior wind field has also been simulated by the three-dimensional version of the mesoscale numerical model of Parish and
Waight [1987]. and the results are presented in section 3. The last section compares and contrasts the observational and modeling studies of the confluence zone, and concludes that the discrepancies are primarily due to the grid spacing used in the model calculation.
2. SASTRUGI-DERIVED STREAMLINE FIELDS
2.1. Flight Surveys
and processed into a series of 9 x 9 in. black and white contact prints which formed the data base for the sastrugi analyses. Photographs were taken with 60% along-track over- lap between successive photographs. Thus inspection of every other print provided complete examination of the photographed region.
The objective of the missions was not to provide complete spatial coverage of the Terra Nova Bay confluence zone, but rather to sample the region in order to capture the overall pattern of the surface airflow. Hence the missions were flown in discrete, we!l-separated flight legs. The sampling area differed between 1986 and 1987 but there was sufficient
overlap to evaluate the interannual variability of snow surface features.
The 1986 mission was designed to capture the drainage of David. Reeves and Priestley glaciers. Figure ! shows the
Sastrugi are wind-formed minor relief feattires at the 1986 flight domain. It consisted of six north-south flight snow surface whose orientations mirror the direction of the lines approximately 18 km apart and three east-west tie wind that generated them. The literature contains two lines. The tie lines were to aid in the positioning of the definitions of what entities constitute sastrugi. Roscoe. north-south flight lines and to fill in details lying be- [1953] and Alley [1989] define all aeolian-forced features tween the north-south lines. The mission was flown between to be sastrugi, but Mather[1962], Doumani[1967], Fujiwara 1858 UTConNovemberSand0314 UTC on November 6 in and Endo [ 1971 ], and Watanabe [1978] discriminate between 19116. The aircraft ground speed r.a4aged from 435 to 514 km alepositional (snowdunes (= whale backs)andbarchanoids)and h- with an average of 480 km h -'. The aircraft flew at a erosional (called sastrugi) forms. The varying definition constant height of 5390 m above sea level. Because the appears to arise in part because of areal variations in terrain elevation ranged from 200 to 2200 m. the aircraft typical alepositional conditions. Around Siple Coast, for altitude varied from 3190 to 5190 m. Since the scale of example, most snow seems to be deposited in conjunction with each photograph depends upon the aircraft height above the light winds or downslope storm winds (M. Strobel, personal !?hotographed region the scale changed throughout the region communication, 1989). These can then be eroded by down- from 1:20,950 at 3'!90-m altitude to 1:34,080 at 5190-m slope drainage winds so that alepositional and erosional altitude. Consequently, at 3190 m ab9ve the terrain the forms are parallel to the prevailing wind direction. By sampledarea:per photograph was22.9 kin-, while at5190mit contrast inland of Syowa Station, precipitation is usually was 60.7 kin'. The smallest resolution. found by calculating accompanied by strong cross-slope cyclonic winds and snow the resolution of the photograph with the smallest scale, dunes form by forced deposition [Watanabe, 1978]: subse- was 5 m. Positional uncertainty was calculated to be a quently these are carved by drainage winds. The typical maximum of q-2 kin, and was greatest in the northwest section angular deviation between depositional and erosional forms of the flight domain due to the lack of locally prominent on Mizuho Plateau is 50 ø [FujiwaraandEndo. 1971]. Auto- terrain features with which to tie the flightlines. This marie weather station observations from inland of Terra Nova positional uncertainty is no problem, however, because Bay (discussed in section 2.3)show that almost all winds changes in sastrugi directions in this region are large- come from a narrow angular range. Depositional conditions scale, occurring over tens of kilometers. The total number inland of Terra Nova Bay thus appear to be similar to those of photographs in the 1986 mission was 945. at Siple Coast. Because the predominant linear depositional The 1987 mission was designed to resolve the broadscale and erosional forms may not be readily distinguishable from structure of the Terra Nova Bay confluence zone, and is also the air, the sastrugi definition of Roscoe [1953] and Alley shown in Figure 1. Because the 1987 and 1986 flight legs [1989] is adopted here. overlapped around David and Reeves glaciers, interannual
Sastrugi form rapidly in hours to days [Mather, 1962; variability can be investigated. The 1987 flight domain I.M. Whi!!ans. personal communication. 1989]. and once consisted of five flight legs, four comprising the sides of

BROMWICH ET AL.' TERRA NOVA BAY KATABATIC CONFLUENCE ZONE 5497
1900
/...-- 2300
J
i / \
J J
J J
.---.%
Talos Dome4 I / I ! I
) •, 23OO
/2500"'"
\ \
I i
•jx
145øE 150øE 155øE
/ Cape Adare
..
Gl
rGI.
ß ' '"'"'•:'.i.. Campbell GI. TERRA NOVA
BAY
- / Ice Ton
;•.....•'• ...............
•McMurdo $ta.
[..• " .;:
.,i -11• ..... ;?. ..... ::,• ?8ø5 •%_ •'"•' '•:• •:•,.. ROSS
Skelto r• G
160øE 165øE 170øE
•.i',.,. ' .... -½;Y.. Cape Hallelt . :. .
Tucker GI.
,;-•?;" .:.'..-' '
-/oulman Is.
75'os
ROSS SEA
------- 1986
, 1987
r-'--] Fast ice '"'//•/•• Rough terrain
Fig. I. Regional location map. Ice sheet elevation contours in meters (solid and dashed) were obtained by merging Drewry's [1983] interior analysis with USGS 1:250,000 reconnaissance maps for the coastal regions. The 1986 and 1987 sastrugi survey flight legs are shown by the heavy dashed and heavy solid lines, respectively.
a box, the fifth being a tie line connecting the northwest 2.2. Data Collection and Analysis and southeast corners. The mission was flown between 1600
and 2200 UTC on November 8, 19h8.7 r The aircraft flew at an 2.2. i. Lavottt of flight lines. Upon receipt of the average ground speed of 432 km at a height of 5390 m photographs frdm the USGS, the photographs for both the 1986 above sea level. The terrain elevation ranged from 400 to and 1987 missions were laid out in their flight leg configu- 2250 m; therefore, the aircraft altitude ranged from 3140 to rations and checked for prominent terrain features such as 4990 m, the photographic scale from !:20,620 to 1:32,76•), mountains. glacier valleys a,d nunataks, as shown on the and the sampled area per photograph from 22.2 to 56. I km . USGS !-250,000 reconnaissance map series. Using these As in the 1986 mission, the resolution per photograph was 5 terrain features as reference points and the mission plans m and larger. Themaximumpositionaluncertaintywas+4km, as guides, the flight and tie lines were plotted on the and the number of photographs was 575. detailed USGS maps. The flight domain for the 1986 mission

5498 BROMWICH ET AL.' TERRA NOVA BAY KATABATIC CONFLUENCE ZONE
was characterized by prominent terrain features only in the southern and eastern portions. Thus the confidence in the position of the north-south flight lines decreased in the northern and western portions of the domain. By beginning with the easternmost flight line and working west, the tie lines not only positioned the north-south flight lines in relation to the terrain, but also in relation to the other north-south lines. This method worked well in all but the
northern section of the westernmost flightline where the exact intersection of the tie line with the flight line could not be found. However, it was possible to determine a 4 km square containing the intersection by looking for slight changes in sastrugi size and orientation.
Unlike the 1986 mission, the flight donlain for the 1987 mission was characterized by identifiable terrain features only in the northeast section. Thus only two flight lines could be accurately positioned using terrain features. The position of the other flight lines and the diagonal tie line were fixed by searching for changes in sastrugi size and orientation. While the exact intersection points could not be found, 8 km squares containing the intersections were located.
(i) Linear Sastrugi (1, 2, 3 or 4)
Wind direction a
Type Average Length Range of Lengths 1 13m 10m to 16m 2 43 rn 21 rn to 73 rn
3 51 rn 21 rn to 73m 4 114m 80mto 181m
Note: Type 2 linear sastrugi is a well-defined, singular unit while type 3 occurs in densely-packed bunches.
(ii) Barchanoid Sastrugi (B)
Wind direction
.,---- 25 m ---,-
2.2.2. Extraction of directional information. Sastrugi were readily identifiable throughout both flight domains. Sample air photographs are not presented here because the prints do not contain sufficient contrast for sastrugi to be clearly resolved in gray-shade reproductions. Roscoe [1953, pp. 76-77] and Wendler [1988] give examples of photographs of sastrugi taken from much lower altitudes. Most sastrugi (Figure 2) were of the linear .type [Roscoe, 1953, p. 76], but barchanoids [Doumani, 1967] predominated to the north of the Reeves Glacier entrance. Resolvable linear sastrugi generally ranged in size from 10 to 181 m. In parts of the 1986 flight domain, some very large linear features were present which had an average length of 600 m and a maximum length of about ! km. These features seem to disappear when the photographs are examined with a magnifying glass, and often have regular-sized sastrugi on top of them. Previous aerial surveys have reported much longer sastrugi than seen from the ground: up to 240 m [Roscoe, 1953, p. 78] compared with typical surface estimates of a few meters [e.g., Roscoe, 1953; Doumani, 1967]. It is likely that the spatial organization of these relatively low-amplitude features is obscured by oblique observation from the surface [compare Roscoe, 1953, p. 78]. It seems from the comments of Mather [1962, p. 167] that many of the sastrugi seen on the air photographs are alepositional in origin. Airborne photo- graphic surveys offer the distinct advantage of spatial integration, and provide data which can be reanalyzed. The primary spatial organization in Figure 2 is the increase in length of linear sastrugi with elevation. This must result from the interaction between the atmospheric and ice surface characteristics that govern sastrugi evolution [e.g., Roscoe, 1953, p. 76], but is not a simple function of the surface wind field dynamics.
Sastrugi orientations were easily discernable in most areas, and the following strategy was employed for both missions to extract these data. Each independent photograph was divided into quadrants and the direction of the primary sastrugi (called the primary direction) was found for each quadrant. Primary sastrugi were those whose spatial fre- quency (number per unit area) was generally twice as high as those of sastrugi with different orientations. If the
(iii) Ripples (R)
Wind direction
(iv) Drift Plumes (DP)
-,- 113 m---- f Collapsed bridge
•'" •_Wind direction •- Bridged crevasse
Fig. 2. Primary wind-generated snow surface features within the con- fluence zone. (a) Classification scheme. (b) Spatial organization; data for every tenth photograph are plotted for both 1986 and 1987 flight legs.
In many photographs, less prominent sastrugi with markedly different orientations to those of the primary sastrugi were also present. In no instance was the dis- tinction between these two groups in doubt: this is another consequence of the spatial averaging provided by airborne photographic surveys. It is probable that a surface-based observer with his limited field of view is more likely to confuse primary and secondary sastrugi. The latter are probably generated by short-term, synoptically forced modi- fications of the time-averaged airflow. Primary sastrugi directions are presumed to follow the gravity-driven winter
angular range of quadrant directions was less than 20 ø , then drainage of surface air, and the generally disorganized all quadrant directions were averaged, yielding a single secondary directions were omitted from the present analysis. primary direction for the photograph. If the angular range In order to successfully represent the surface wind field exceeded 20 ø , then the quadrant directions were organized into groups where the angular range was less than 20 ø . Then the members of each group were averaged, yielding multiple primary directions for the photograph. Primary sastrugi directions were assigned to the centerpoint of the respective photographs.
within the confluence zone, the primary sastrugi directions from the 1986 and 1987 missions had to be merged. But in order to justify such a combination, it was necessary that the interannual variability of primary sastrugi directions for regions common to both missions be insignificant. Be- cause the overlap of flight domains provided many such

BROMWlCH ET AL.' TERRA NOVA BAY KATABATIC CONFLUENCE ZONE 5499
b
!.50:E
/ DPe \ {•,,,
e3 %.,%
3. %!3 .3 ß •, e3
'"' 1 •"3 e
.............. -•½;'3•} ",, - •.• .....................
/
/
/ -,; 55 ø: •. 60 ø E
NO',: ...... :os ß SAY /
Fig. 2. (continued)
regions, the variability of primary sastrugi directions was dary. The resulting pattern is well established, being only examined and the results tabulated in Table 1. The compari- slightly influenced by the multiple sastrugi directions en- son indicated a mean absolute difference of 6.2 ø with a max- countered in the transition areas between drainage regions imum difference of + 12 ø Because the mean absolute differ- for particular glaciers. cnce is small compared v•ith the criterion used to determine Figure 3 shows the resulting time-averaged airflow pat- a primary sastrugi direction. differences between the two tern. The domain is basically divided into two parts with years were insignificant. Hence the methods used in oh- winds to the north of 74ø40'S converging into Reeves Glacier taining the streamline pattern are justified, and it will be valley and those to the south draining down David Glacier. assumed that the streamline pattern represents the surface The steep mountains to the southwest of Priestley Glacier wind field conditions for late wintertime regardless of the (with peaks to 2800 m) block the approaching stable air- year. stream and deflect it to the right down the trough leading
to Reeves Glacier. This barrier effect for drainage winds, 2.3. Streamline Analysis which was inferred by Brormvich and Kurtz [1984] from the
Manual streamline analysis was performed on the field of theoretical study of Ball [1956], plays a key role in set- primary sastrugi orientations. Streamlines were started at ting up the airflow down Reeves Glacier. Figure 4a provides equidistant intervals around the western and southern edges a more detailed look at this barrier jet. If the flight of the photographed area and followed to the eastern boun- line oriented in the direction of WNW from Skinner Ridge is

5500 BROMWICH ET AL.: TERRA NOVA BAY KATABATIC CONFLUENCE ZONE
TABLE 1. Variability of Primary Sastrugi Directions Inland of Terra Nova Bay Between 1986 and 1987
Iax:ation of Centerpoint of Photol•raph
Latitude. del• S Longitude. deg E
74ø30.77 f 161 ø37.94f
74ø29.81 • 161 o 10.81
74ø22.50 • 160ø23.71
74ø18.02 f 159ø48.00
74 ø 13.29 • 158ø23.57
74 ø 6.59' 159ø 12.58
75ø49.98 ' 159ø48.00
75ø35.69 f 160ø23.71
75ø 14.80 ' 161 ø'9.82'
75" 2.83 • 161ø37.94'
Mean difference Standard deviation Mean absolute difference
Average Sastrugi Direction, deg Difference, deg 1986 1987 (1986- 1987) Remarks
337 339 -2
341 341 0
276 283 -7
302 290 + 12
296 292 +4 320 } 325 } -5 304 314 -10
183 195 -12
224 213 + 11
283 282 +1
293 297 -4
-1.1 7.8
6.2
} transition zone
complex topography
complex topography
complex topography
complex topography
taken to be representative, the jet is about 30 km wide, and the shift from airflow toward the mountains to mountain-de- flected airflow takes place abruptly in about 5 km.
Surface wind observations from four AWS between Feb- ruary and June in 1988 are available to check the winter streamline analysis (Figure 4a). The directions of the vector-average winds for all observations and for those speeds •hich exceed the lowest threshold for drifting snow (8 ms-' [B.ryazgin, 1986. Figure I]) agree to within 2 ø. This arises because, with rare exceptions. the winds blow from one direction. Resultant directions at stations 09, 23, and 27 lie along the streamlines. The apparent dis- crepancy between the direction at station 21 and the streamlines probably arises because 21 is located very close to the edge of the barrier jet where there is a sharp di- rectional gradient. It can be concluded that the sastrugi analysis accurately reproduces the winter surface-airflow pattern.
The broadscale airflow into David Glacier valley is well
3. MODELING OF THE TERRA NOVA BAY KATABATIC WIND REGIME
In addition to the observational evidence for the conflu- ence zone paradigm offered by the sastrugi analysis, numeri- cal simulations were conducted in order to provide physical insight into the mesoscale confluence feature and attendant katabatic winds near Terra Nova Bay. The numerical model used is the three-dimensional version of the primitive equation model discussed in the katabatic wind study of Parish and Waight [1987] and is a modified version or the model described by Anthes and Warner [1978]. The model is written in terrain-following sigma coordinates and includes 10 vertical levels. The first sigma level corresponds to a height of approximately 20 m above ground level: the re- maining vertical levels are distributed such that the highest resolution is found in the lower portion of the atmosphere. This enables the boundary layer to be explicigt resolved. Fluxes of momentum and heat within the boundary
defined with most cold air coming from plateau areas adja- layer are modeled using a first-order closure scheme as cent to the coast (Figure 3). By contrast. the cold air described by Parish [1984] and t'arish and Waight [1987]. A which blows down Reeves Glacier comes from much farther horizontal grid consisting of 25 grid points in the x direc- inland. The prominent streamline confluence zone inland of tion and 21 points in the y direction were used for the David Glacier is associated with a trough shown by the 1800- simulation. Open boundary conditions as described by Anthes and 2000-m elevation contours. A more accurate topographic and Warner[1978] are employed in which all prognostic vari- survey may reveal that the valley is even more well-defined ables are extrapolated outward to the boundaries. Prognos- than appears at present. The shift from southerly airflow tic equations in the model include the two horizontal motion toward, to westerly airflow within, the confluence zone components, temperature, the surface energy budget of (Figure 4b) takes place abruptly along the 1987 tie line Blackadar [1978] and presstire. Explicit representation of within about 4 km. Figure 4b suggests that the southern the longwave radiative processes is incorporated in the edge of the confluence zone can migrate about 25 km to the model following Cerni and Parish [1984] to provide a realis- north and south of its time-averaged location. The area to tic numerical treatment of the cooling processes in the the south and southwest of David Glacier (Figure 3) has lower atmosphere. This allows the katabatic wind to evolve numerous nunataks. This complicatedtopographydisruptsthe in a physically consistent manner without the need for ad surface drainage into the southern half of David Glacier hoc assumptions regarding the cooling rate. valley. The ice topography for the Terra Nova Bay region was
The 1986 flight lines captured the airflow into Priestley digitized to a 32-kin grid scale from the contour map of Glacier valley and the southern fringes of the drainage re- Drewry [1983]. This grid representation resolves the large gion for Rennick Glacier (Figure 3). The col between these scale confluence zone structure in the interior of the two drainage areas is located by the sastrugi analysis just continent and is sufficient to depict the broadscale struc- to the north of the head of Priestley Glacier. The source ture of the katabatic flow. but individual glacier outlets region for air flowing down Priestley Glacier covers the and irregular mountainous topography are not explicitly southern part of Talos Dome and some plateau areas farther represented. The terrain in the vicinigt of Terra Nova Bay west. Airflow into Rennick Glacier valley is discussed in is extremely complex because of the proximigt of the Trans- the next section. antarctic Mountains and numerous mountain peaks adjacent to

BROMWICH ET AL.: TERRA NOVA BAY KATABATIC CONFLUENCE ZONE 5501
'55øE ß /
/ /
1.67E
Fig. 3. Time-averaged winter streamlines of surface airflow over the plateau to the west of Terra Nova Bay (heavy con- tinuous lines) as analyzed from the airborne sastrugi surveys. Directions of the primary sastrugi (arrows) are plotted at the centerpoint of every tenth photograph from 1986 and 1987.
Terra Nova Bay. The results therefore,' while representative The strong radiative flux divergence rapidly cools the of the mesoscale katabatic wind structure upslope of indi- ice surface and development of the katabatic wind is abrupt. vidual glaciers such as Reeves Glacier. cannot be expected Within four hours from the start of the model integration, to provide fine-scale information over the very complex significant drainage flows appear along Reeves Glacier. The terrain to the north and southwest as well as within narrow result has been observed in other simulations [Parish, 1984; glaciers such as Priestley Glacier. The model has been initalized about a state of rest to isolate the terrain-
induced drainage flows without complications introduced by the large scale synoptic forcing. The initial temperature profile used in the initialization process was adapted from the sounding presented by Schwerdtfeger [1984, Figure 6.9] and extrapolated to the sea level and is consistent with the initial state of rest in the wind field. Model equations have been integrated tbr a 12-hour period by which time the katabatic winds are well developed and have reached a near steady state.
Parish and Waight, 1987] and is supported by data from AWS; the onset of strong katabatic winds at Inexpressible Island adjacent to Terra Nova Bay often occurs with suddenness. Results from the numerical simulations suggest that most of the adjustment of the katabatic winds is complete by eight hours and relatively minor changes take place during the final few hours of model integration. Figure 5 illustrates the streamlines of cold air drainage after the 12-hour simu- lation for the first and second sigma levels corresponding to heights of 20 and 60 m above the ice surface. The terrain-induced forcing of the airflow is pronounced; the

5502 BROMWICH ET AL.' TERRA NOVA BAY KATABATIC CONFLUENCE ZONE
a 160 ø E
74 ø 30'S
•1800
I I
0 10 Km
b
600 I
160 ø E
157 ø E I
75øS !
75øS
•) l•Okm I----
I
157øE
Fig. 4. Detailed descriptions of some prominent features of the inferred winter streamlines. Primary sastrugi direc- tions are plotted at the centerpoint of every second photograph. Complex terrain is stippled. (a) Barrier jet feeding into the northern half of Reeves Glacier valley. (b) Confluence zone upwind of David Glacier. In Fig. 4a, vector- average surface-wind directions from AWS sites 09, 21, 23, and 27 for February-June 1988 are plotted as heavy dashed lines. Dots mark the AWS locations.
katabatic wind pattern at both levels is strongly influenced by the orientation of the topography in the continental in- terior. Owing to the larger friction term in the lower part of the atmosphere, the streamlines for the first sigma level ß O
are directed some 20 more downslope than corresponding streamlines for the second sigma level. A clear tendency in the downslope orientation of streamlines is also seen from
the gently sloping interior to the steeper ice slopes near the coast. Streamlines are directed at only slight angles to the ice contours in the continental hinterland, becoming directed in a more downslope direction near the steep coastal ice slopes in response to the sudden enhancement in the katabatic acceleration. Two distinct confluence zones are delineated in each streamline depiction upslope from

BROMWICH ET AL.: TERRA NOVA BAY KATABATIC CONFLUENCE ZONE 5503
715
596
477
358
238
119
a) STREAMLINES cr LEVEL - I
I I
o o III 223 334 446 557 669
x DISTANCE (km)
78O
715
596
477
358
238
119
b) STREAMLINES LEVEL : 2
I
0 o III 223 334 446 557 669 780
X DISTANCE (km)
Fig. 5. Model streamlines afier 12-hour time integration for (a) first sigma level (20 m above the ice surface) and (b) second sigma level (60 m above the ice surface).
Reeves and David glaciers. The analyses suggest that cold Two additional confluence features can be identified to air produced over a broad area in the Antarctic interior the northwest of Terra Nova Bay on the second sigma level in drains through only two glacier valleys. The large source Figure 5b. The confluence zone at the top left corner rep- area and relative narrowness of the outflow region suggests resents the flow convergence which feeds the Adelie Land that a nearly unlimited cold air supply is present upslope coast. This zone is clearly identified in the large scale of the glaciers and katabatic wind enhancement is to be streamline simulation of ParisIt and Bromwich [1987]. The expected. second additional confluence feature is situated some 300 km
5504 BROMWlCH ET AL.: TERRA NOVA BAY KATABATIC CONFLUENCE ZONE
715
596
477
358
238
119
a) VELOCITY FIELD (m/s)
2400
o- LEVEL = I
i
ZOO0 1600 1200
o o iii 22:5 ;534 446 557 669 780
x DISTANCE (km)
715
596
477
358
238
119
b) VELOCITY FIELD I
2400
(m/s) o- LEVEL = 2 i I
2400 2000 1600 1200
0 • 0 III 223 334 446 557 669 780
X DISTANCE (km)
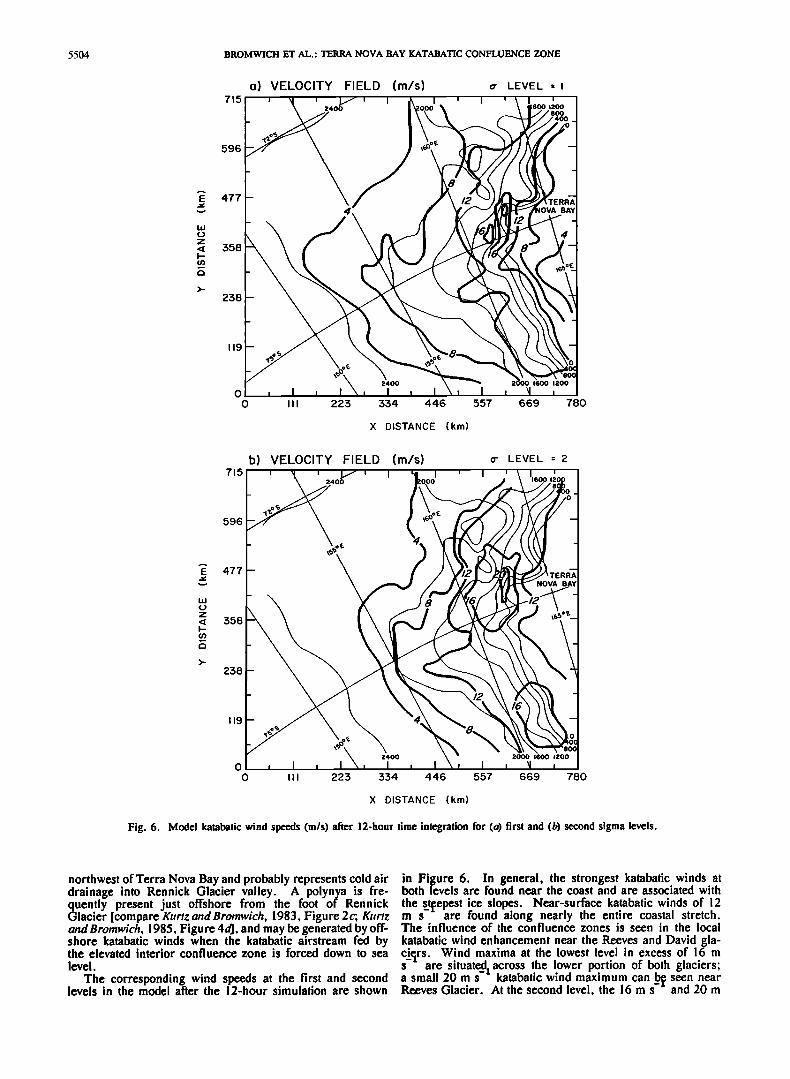
Fig. 6. Model katabatic wind speeds (m/s) after 12-hour time integration for (a) first and (b) second sigma levels.
northwest of Terra Nova Bay and probably represents cold air in Figure 6. In general, the strongest katabatic winds at drainage into Rennick Glacier valley. A polynya is fre- both levels are found near the coast and are associated with quently present just offshore from the foot of Rennick the s_t•epest ice slopes. Near-surface katabatic winds of 12 Glacier [compare KurtzcazdBromwich, 1983, Figure2c; K•r/z m s are found along nearly the entire coastal stretch. andBrornwich, 1985, Figure 4dJ, and may be generated by off- The influence of the confluence zones is seen in the local shore katabatic winds when the katabatic airstream fed by katabatic wind enhancement near the Reeves and David gla- the elevated interior confluence zone is forced down to sea ci_•rs. Wind maxima at the lowest level in excess of 16 m level. s are situatc_d z across the lower portion of both glaciers'
The corresponding wind speeds at the first and second a small 20 m s katabatic wind maximum can • seen near levels in the model after the 12-hour simulation are shown Re:eves Glacier. At the second level, the 16 m s and 20 m

BROMWICH ET AL.: TERRA NOVA BAY KATABATIC CONFLUENCE ZONE 5505
TERRA NO•4'--' 7• •' S
f i onaue
/
/
j Fast
Rough terrain
. :,• . .•.•;•1
, ...
•65ø-E
Fig. 7. Comparison between inferred streamlines of surface air motion (heavy solid lines) and those modeled by Parish and Bromwich [1987] (heavy dashed lines). Primary sastrugi directions are plotted at the centerpoint of every tenth 1987 photograph.
-1 s areas have expanded to cover the entire Reeves/David within the confines of ihe glacier valley and smooths out Glacier region. The strongest katabatic winds are therefore the terrain significantly. This truncation of the ice associated with the terminalslopesdownstream from the con- terrain almost certainly results in a reduction of the fiuence zones. Although the broad-scale confluence feature simulated katabatic wind speeds. In addition, the actual is in agreement with observations and maximum simulated wind topography consists of very rugged and mountainous terrain speeds occur near the Reeves and David glaciers, there is to the north of Reeves Glacier which acts to further reason to suspect the core of high katabatic wind speeds in concentrate the airflow into the narrow glacier valley. the model is smoothed. Recent instrumented aircraft flights This barrier effect has been well documented from the during the Antarctic springtime months indicate the sastrugi analysis and may direct a significant airstream katabatic winds in the vicinity. ,of Terra Nova Bay are down Reeves Glacier. The terrain-induced channeling of the frequently in excess of 25 m •-- and often are localized flow may be responsible for an enhanced acceleration of the [Parish and Bromwich, 1989]. Such local katabatic wind flow down the steep slopes which is not simulated in this maxima are not resolved in this simulation owing to the scale of model. 32-km grid spacing used in the simulation. Reeves Glacier The model simulation is thought to provide a consistent is only 20 km wide and stretches for approximately 50 km. broadscale picture of the katabatic wind drainage over the The 32-km grid spacing allows only a couple grid points interior of the continent. The confluence features upslope

5506 BROMWlCH ET AL.: TERRA NOVA BAY KATABATIC CONFLUENCE ZONE
2400
• i•ce
/
l•:'q 'E
,,...
?.;}%
Fig. 8. Inferred streamlines (heavy continuous lines) compared with surface-wind streamlines (• = 1) produced by the primitive equation model (heavy dot-dash).
of the Reeves and David glaciers are well resolved and local enhancement of the katabatic regime downslope front the con- fluence zones is portrayed. Simulated katabatic wind speeds are in reasonable agreement with available observations although localized pockets of strong drainage flow down individual glaciers are not resolved. Model results appear to confirm earlier inferences [Bromwich and Kurtz, 1984] about the importance of the confluence zone and attendant katabatic wind regime on the meteorology of the Terra Nova Bay region.
4. DISCUSSION AND CONCLUSIONS
The observe d and simulated descriptions of the winter surface wind field over the marginal slopes to the west of Terra Nova Bay were obtained with completely independent
approaches. However. when the known limitations of each method are considered, the rest!Its are in close agreement. Figure 7 contrasts the st,'eamlines derived from the aircraft sastrugi surveys with the broadscale streamlines modeled by Parish cutd Bromwiclt [1987]. The latter generally were ter- minated near the 1800 m contour because advective accelera- tions (e.g., ua u/a x) over the steep coastal ice slopes cause the model assumptions to break down. Both the inferred and modeled airflow patterns show the shift from southerly winds in the southern part of the domain around to northwesterly winds upslope from Reeves Glacier. This means that both analyses show a pronounced broadscale streamline confluence just inland from Terra Nova Bay. If allowance is made for the nearly order of magnitude difference in spatial resolu- tion between the observational and modeling results (5-l0 km versus 50 km), it can readily be seen that the results agree to within the limits of error.

BROMWICH ET AL.: TERRA NOVA BAY KATABATIC CONFLUENCE ZONE 5507
Figure 8 intercompares the sastrugi-derived streamlines in the confluence zone with those simulated by the primitive equation model discussed in section 3. Above the 1800-m contour there is a good overall fit. However, in the southern part of the domain the simulated streamlines are oriented some 20 ø more downslope than the inferred ones. This discrepancy is detectable over distances of up to 100 km, and causes the model to locate the marked confluence zone within the David Glacier valley rather than well into the interior. This difference may be due to a significant directional shear between the winds adjacent to the snow surface and those at an altitude of 20 m (i.e., at the a = l level). Comparison of Figures 5a and 5b shows that the directional shear from the a = I to the a = 2 model levels causes the simulated confluence zone feeding into David
Glacier valley to become less well-defined and to move farther downslope.
As the complicated coastal region is approached the fit between the inferred and simulated streamlines is less
satisfactory as a result of the 32-kin model grid spacing. However it is abundantly clear that the model is reproducing the overall behavior of the airflow. In close agreement with the sastrugi analysis. almost the entire plateau area upslope from Terra Nova Bay is simulated to discharge down the Reeves and David glaciers. Furthermore, the sastrugi- derived and modeled streamlines which feed into the central
part of Reeves Glacier valley almost overlap: this region has the simplest topography.
The influence of near-coastal topographic smoothing is shown by the mode!'s inability to locate the northern and
.J
4
-! Fig. 9. Inferred streamlines (heavy continuous lines) compared with primitive equation surface-wind speeds in m s (heavy dot-dash).

5508 BROMWICH ET AL.: TERRA NOVA BAY KATABATIC CONFLUENCE ZONE
southern confluence zones completely within the confines of Reeves and David glaciers. Neither does the model simulate a marked barrier jet blowing into Reeves Glacier valley. Simulated airflow is not directed into the head of Priestley Glacier, but a reflection of this drainage does seem to be produced farther downslope. It is highly likely that these coastal drainage details would be reproduced by model simu- lations using a much smaller grid spacing than 32 km.
Comparisons between the inferred streamlines and modeled
REFERENCES
Alley, R.B., Concerning the deposition and diagenesis of strata in polar firn, J. Glaciol., 34, 283-290, 1989.
Anthes, R.A., and T.T. Warner. Development ofhydrodynamical models suitable for air pollution and other mesometeorological studies, Man. Weather Rev., I06, 1045-1078. 1978.
Ball. F.K., The theory of strong katabatic winds, Aust. J. Phys., 9, 373-386, 1956.
Ball, F.K., Winds on the ice slopes of Antarctica, Antarctic Meteo- rology, Proceedings of the Symposiurn, Melbourne, 1959, pp. 9-16,
isotachs (Figure 9) also provide important results. The Pergamon, New York, 1960. strongest katabatic winds are found just to the north of B!ackadar, A.K., High-resolution models of the planetary boundary Reeves Glacier; this result is much more pronounced for the layer, Advances in Environmental and Scientific Engineering, vol. l, • ---- 2 level. It arises because the Coriolis force concen- pp. 51-85, Gordon and Breach, New York, 1978. trates katabatic airflow on the left side (looking downwind) Bromwich. D.H., Snowfall in high southern latitudes, Rev. Geophys., of a broadscale topographic trough [Ball, 1960]. As a re- 26(I). 149-168, 1988. suit the katabatic mass transport down Reeves Glacier Bromwich, D.H.,An extraordinary katabaticwind regime at Terra Nova ' Bay, Antarctica, Mon. Weather Rev., ! 17, 688-695, 1989. should substantially exceed that emerging from David Glacier Bromwich,D.H.,andD.D. Kurtz,ExperiencesofScott'sNorthernParty: valley. Evidence for a relationship between winter katabatic winds and the
Examination of Figure 6b revt:als that the model produces Terra Nova Bay polynya, Polar Rec., 21, 137-146, 1982. the strongest winds (>20 ms--) around 600-m elevation. Bromwich. D.H., and D.D. Kurtz, Katabatic wind forcing of the Terra This near-coastal convergence is primarily generated by the Nova Bay polynya, J. Geophys. Res., 89. 3561-3572, 1984. smoothed topograpy just to the north of Reeves Glacier/Terra Bromwich, D.H., T.R. Parish, and C.A. Zorman. Observational and Nova Bay (Figure I). The sastrugi-derived streamlines dem- modeling studies of the Terra Nova Bay confluence zone, in Second onstrate that this convergence actually takes place above the 1200-m contour, and is generated by the steep mountains to the southwest of Priestley Glacier. The smoothed model topography, which does not resolve these coastal details, produces a broader and more seaward katabatic jet than inferred.
The main conclusions of this study can be summarized as follows.
1. The overall picture of the intense katabatic airstream
Conference on Polar Meteorology and Oceanography, pp. 101-104, American Meteorological Society. Boston, Mass.. 1988.
Bryazgin, N.N., Method of preparing monthly charts of atmospheric precipitation in Antarctica, in Climate of Antarctica, edited by I.M. Dolgin, pp. 109-116, OxonJan, New Delhi, 1986.
Cerni, T.A., and T.R. Parish, A radiative model of the stable nocturnal boundary layer with application to the Polar night, J. Clim. Appl. Meteorol., 23, 1563-1572, 1984.
Doumani, G.A., Surface structures in snow, in Physics of Snow and Ice, Proceedings of btternational Conference on Snow and Ice, Sapporo, 1966, vol. I. part 2, edited by H. Oura, pp. ! 119-1136, Institute of Low Temperature Science, Hokkaido University, Japan, 1967.
at Terra Nova Bay being forced by converging air currents in Drewry, D.J., The surface of the Antarctic ice sheet, in Antarctica: the continental interior is well supported by both observa- Glaciological and Geophysical Folio, sheet 2. edited by D.J. Drewry, tions and numerical modeling. Scott Polar Research Institute, University of Cambridge, England,
2. Most discrepancies between model results and observa- 1983. tions are readily explained by the spatial resolution used Fujiwara, K., and Y. Endo, Preliminary report of glaciological studies, in Report of the Japanese Traverse Syowa-South Pole in the model calculations. Finer scale grids are needed to 1968-1969, pp.68-109,editedbyM.Murayama,PolarResearchCenter, reproduce the near-coastal drainage features shown by the National Science Museum, Tokyo. 1971. sastrugi surveys. James, I.N.. On the forcing of planetary-scale Rossby waves by
3, Airborne photographic surveys of the ice sheet surface Antarctica, Q.J.R. Meteorol. Soc., !i4, 619-637, 1988. Kurtz, D.D., and D.H. Bromwich, Satellite observed behavior of the provide a demonstrated, high quality method for detailed Terra Nova Bay polynya, J. Geophys. Res., 88, 9717-9722, 1983. spatial mapping of the time-averaged surface motion field. However, the spatial resolution of some satellite sensors (e.g., 10-20 m of SPOT (Systi:me Probatoire d'Observation de la Terre)) is at or approaching that required for sastrugi surveys (compare Figure 2), and satellite remote sensing may provide an alternative source of data. The results pre- sented here as well as by Parish and Bromwich [1987] demon- strate that for many areas the interior Antarctic surface wind field is characterized by strong spatial variability. Both cross-slope and downslope variations of the surface wind must be considered when future field programs are designed.
4. The primary route in this area for katabatic mass transport to sea level is Reeves Glacier valley. The moun- tain deflection north of the valley head plays an essential role in setting t,p this near-coastal convergence. An impor- tant secondary katabatic airflow emerges from David Glacier: this is sustained by a confluence zone which stretches at least 100 km into the interior.
Acknowledgments. We are grateful m Jerry Mullins of the USGS for
Kurtz, D.D., and D.H. Bromwich, A recurring, atmospherically forced polynya in Terra Nova Bay, in Oceanology of the Antarctic Continental Shelf, Antarct. Res. Set., vol. 43. pp. 177-201, edited by S.S. Jacobs, AGU, Washington, D.C., 1985.
Mather, K.B., Further observations on sastrugi, snow dunes and the pattern of surface winds in Antarctica, Polar Rec., II, 158-171, 1962.
Mather, K.B., and G.S. Miller, Notes on topographic factors affecting the surface wind in Antarctica. with special reference to katabatic winds, and bibliography, Rep. UAG R-189, 125 pp., Geophys. Inst., Univ. of Alaska. Fairbanks, 1967.
Okuhira, F., and H. Natira, A study of formation of a surface snow layer. in Glaciological Studies in Mizuho Plateau, East Antarctica, 1969-1975, pp. 140-153, edited by T. Ishida, National Institute of Polar Research, Tokyo, 1978.
Parish, T.R., The katabatic winds of Cape Denison and Port Martin, Polar Rec., 20, 525-532, 1981.
Parish, T.R., Surface airflow over East Antarctica, Man. Weather Rev., 110, 84-90, 1982.
Parish, T.R., A numerical study of strong katabatic winds over Ant- arctica, Man. Weather Rev., 112, 545-554, 1984.
Parish, T.R., and D.H. Bromwich, The surface windfield over the Antarctic ice sheets, Nature, 328, 51-54, 1987.
Parish, T.R., and D.H. Bromwich, Instrumented aircraft observations of the katabatic wind regime near Terra Nova Bay, Mort. Weather Rev., 117, 1570-1585, 1989.
planning and coordinating the sastrugi survey flights and to the U.S. Parish, T.R., and K.T. Waight, The forcing of Antarctic katabatic Navy for flying the missions. Kathleen Doddroe typed the manuscript, winds, Mort. Weather Rev., 115, 2214-2226, 1987. and Yvonne Holsinger drafted the figures. We thank all these individ- Phillpot, H.R., and J.W. Zi!!man, The surface temperattire inversion uals for their high quality and essential support. This research was over the Antarctic continent, J. Geophys. Res., 75, 4161-4169, 1970. funded by National Science Foundation grants DPP-8519977 (D.H.B.) Polar Research Board, The Polar Regions and Climatic Change, Appendix, and DPP-8521176 (T.R.P.). Byrd Polar Research Center, Ohio State 113 pp., National Academy Press, Washington, D.C., 1984. University, contribution 670. Roscoe, J.H., Antarctica, Air Force Manual AFM 200-30, 171 pp.,
Intelligence, Regional Photo Interpretation Set., Dep. of the Air Force, Washington, D.C., 1953.

BROMWlCH ET AL.' TERRA NOVA BAY KATABATIC CONFLUENCE ZONE 5509
Schwerdffeger, W., Weather and Climate of the Antarctic, 261 pp., D.H. Bromwich, Byrd Polar Research Center, Ohio State University, Elsevier, New York, 1984. Columbus, OH 43210.
Stearns, C.R., and G. Wendlet, Research results from Antarctic T.R. Parish, Department of Atmospheric Science, University of automatic weather stations, Rev. Geophys., 26(1), 45-61, 1988. Wyoming, Laramie, WY 82071.
Watanabe, O., Distribution of surface features of snow cover in Mizuho C.A. Zorman, Department of Physics, Case Western Reserve Plateau, in Glaciological Studies in Mizuho Platecut, East University, Cleveland, OH 44106. Antarctica, 1969-1975, pp. 44-62, edited by T. Ishida, National Institute of Polar Research, Tokyo, 1978.
Wendlet, G., Measuring blowing snow in Adelie Land. Eastern Antarc- (Received September 26, 1988; fica, in Second Conference on Polar Meteorology and Oceanography, revised September 14, 1989; pp. 93-96, American Meteorological Society, Boston, Mass., 1988. accepted September 14, 1989.)